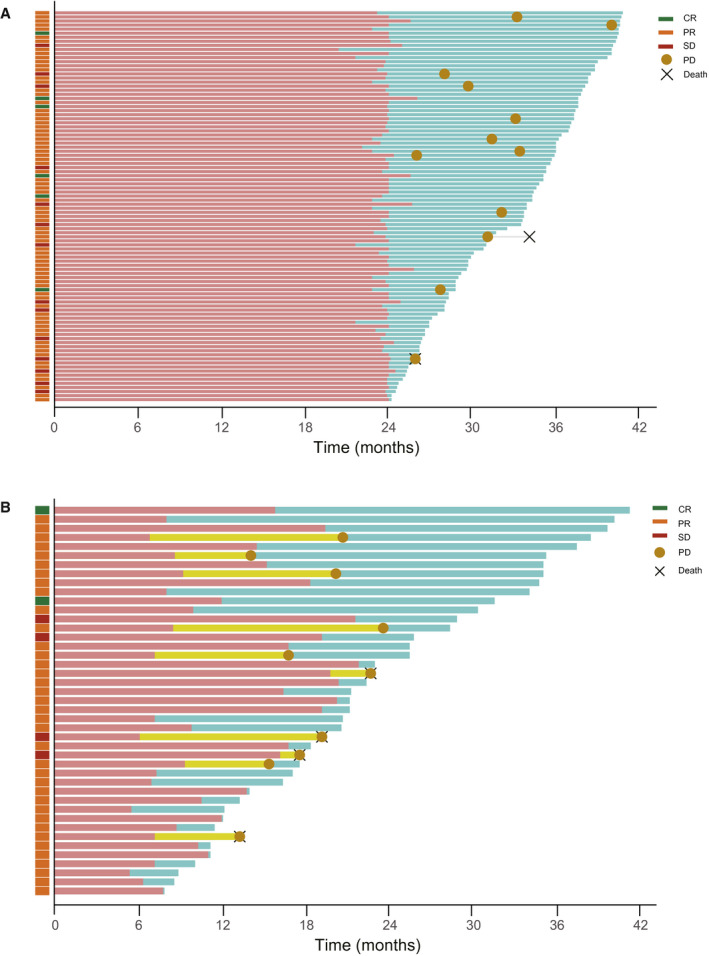
Figure 1.

Swimmer plots indicating the duration of ICI treatment and follow‐up, progression‐free survival, and overall survival for patients who (A) completed 2 years of ICI therapy and (B) discontinued ICIs without disease progression. The light red bars indicate the duration of ICI treatment, the light teal bars indicate the follow‐up duration, and the light yellow bars indicate the time from the discontinuation of ICIs to disease progression. CR indicates complete response; ICI, immune checkpoint inhibitor; PD, progressive disease; PR, partial response; SD, stable disease.
