Abstract
Background and aims
There is a higher prevalence of unhealthy alcohol use among Indigenous populations, but there have been few studies of the effectiveness of screening and treatment in primary health care. Over 24 months, we tested whether a model of service‐wide support could increase screening and any alcohol treatment.
Design
Cluster‐randomized trial with 24‐month implementation (12 months active, 12 months maintenance).
Setting
Australian Aboriginal Community Controlled primary care services.
Participants
Twenty‐two services (83 032 clients) that use Communicare practice software and see at least 1000 clients annually, randomized to the treatment arm or control arm.
Intervention and comparator
Multi‐faceted early support model versus a comparator of waiting‐list control (11 services).
Measurements
A record (presence = 1, absence = 0) of: (i) Alcohol Use Disorders Identification Test—Consumption (AUDIT‐C) screening (primary outcome), (ii) any‐treatment and (iii) brief intervention. We received routinely collected practice data bimonthly over 3 years (1‐year baseline, 1‐year implementation, 1‐year maintenance). Multi‐level logistic modelling was used to compare the odds of each outcome before and after implementation.
Findings
The odds of being screened within any 2‐month reference period increased in both arms post‐implementation, but the increase was nearly eight times greater in early‐support services [odds ratio (OR) = 7.95, 95% confidence interval (CI) = 4.04–15.63, P < 0.001]. The change in odds of any treatment in early support was nearly double that of waiting‐list controls (OR = 1.89, 95% CI = 1.19–2.98, P = 0.01) but was largely driven by decrease in controls. There was no clear evidence of difference between groups in the change in the odds of provision of brief intervention (OR = 1.95, 95% CI = 0.53–7.17, P = 0.32).
Conclusions
An early support model designed to aid routine implementation of alcohol screening and treatment in Aboriginal health services resulted in improvement of Alcohol Use Disorders Identification Test—Consumption screening rates over 24 months of implementation, but the effect on treatment was less clear.
Keywords: Alcohol, alcohol screening, AUDIT‐C, brief intervention, continuous quality improvement, Indigenous, primary care, training and support, treatment
INTRODUCTION
Indigenous peoples that have been colonized, including Australia's Aboriginal and Torres Strait Islander peoples, are more affected by alcohol‐related harms than general populations [1, 2, 3, 4]. Harms of colonization, including intergenerational trauma, combined with introduction of mass‐produced alcohol, underpin this disparity [5].
Regular screening for unhealthy alcohol use (drinking above recommended guidelines, including alcohol use disorders) is important for timely detection. Cost‐effective brief intervention (BI) can then be provided to those with unhealthy drinking who are not dependent [6]. Clients with dependence can be treated in primary care settings, including with pharmacotherapies or referred to specialist services, if appropriate.
Recent systematic reviews [7, 8] found only four studies of implementation strategies to increase the uptake of both screening and the full spectrum of treatment for unhealthy alcohol use [7]. While they consistently showed improvement in screening, their impact on treatment provision was variable. None were conducted in Australian or other Indigenous populations.
This report describes the outcomes of a cluster randomized trial to assess whether a service delivery support model, designed for Aboriginal and Torres Strait Islander Community Controlled Health Services (ACCHS), can produce a sustained increase in uptake of screening and appropriate treatment for unhealthy alcohol use. The first 12 months (active phase) of support resulted in a significant increase in screening in any 2‐month period over that time [odds ratio (OR) = 5.52, 95% confidence interval (CI) = 4.31–7.07] [9]. However, there was no significant increase in the odds of BI. That analysis did not assess provision of a broader spectrum of treatment.
Previous studies have shown that longer implementation was associated with better outcomes [10]. In this analysis we examine the effects of the support on screening and provision of alcohol treatment over the full 24 months of implementation (active and maintenance phases), and investigate if the effects of provision of BI over 24 months differed from 12‐month results. We hypothesized that over the 24 months there would be an increase in the odds of: (i) screening; (ii) provision of any alcohol treatment; and (iii) provision of BI for unhealthy alcohol use.
METHODS
The full study protocol was retrospectively registered (ACTRN12618001892202) and published [9, 11]. This paper was prepared using the Consolidated Standards of Reporting Trial (CONSORT) extension for cluster randomized trials [12].
Study design and recruitment
The study is a cluster randomized trial of 22 ACCHS across Australia, with an equal allocation to treatment (early‐support) and waiting‐list control arms. During recruitment there were approximately 140–143 ACCHS in Australia [13, 14]. Of these, 132 were assessed for eligibility. ACCHS were eligible if they: (i) used Communicare practice software; and (ii) provided care for 1000 or more unique clients per year.
Sample size and randomization
Sample size was calculated to detect 13% increase in treatment for unhealthy alcohol use, as this would require the larger sample than for screening alone (Supporting information, Section S1). Eleven ACCHS were recruited per arm [11]. Randomization of ACCHS, stratified by remoteness (based on the road distance to the nearest urban centre; Table 1) [15], was performed by the study statistician (TD) in SAS statistical software, using coded identifiers to ensure blinded allocation.
TABLE 1.
Service characteristics by trial arm at the end of 12‐month baseline period (52 678 clients; 142 519 observations). a
| Characteristic | Early support | Waiting‐list controls |
|---|---|---|
| Services | ||
| n | 11 | 11 |
| Mean clients per service (SD) | 3166 (2045.4) | 1623 (586.7) |
| Remoteness | ||
| Urban and inner regional | 5 | 5 |
| Outer regional and remote | 2 | 3 |
| Very remote | 4 | 3 |
| Clients | ||
| n | 34 829 | 17 849 |
| Mean age of clients (years) (SD) | 37.4 (16.0) | 37.8 (16.4) |
| Number of female clients (%) | 19 578 (56.2) | 10 009 (56.1) |
| Mean observations b per client (SD) | 2.7 (1.8) | 2.7 (1.7) |
| Clients screened with AUDIT‐C (%) | 5435 (15.6) | 3626 (20.3) |
| Mean AUDIT‐C score c (SD) | 3.5 (3.6) | 3.3 (3.5) |
| Clients with an AUDIT‐C > 0 c (%) | 3017 (55.5) | 2133 (58.8) |
| Clients recorded as receiving treatment for UAU d (%) | 199 (0.6) | 162 (0.9) |
| Clients recorded as receiving brief intervention (%) | 70 (0.2) | 109 (0.6) |
Baseline period: from 29 August 2016 to 30 August 2017, inclusive;
An observation appeared in the data set for a client if they attended their service for a consultation in the preceding 2‐month reference period at least once;
mean score among clients who had at least one recorded AUDIT‐C score;
UAU = unhealthy alcohol use; treatment as recorded in Communicare (i.e. advice recorded using selected clinical items or pharmacotherapies prescribed). SD = standard deviation; AUDIT‐C = Alcohol Use Disorders Identification Test—Consumption.
Implementation strategy
The 24‐month support model (Fig. 1) consisted of eight core components (Supporting information, Table S1) designed to aid routine implementation of alcohol screening and appropriate treatment. Support was delivered to the early‐support arm services in two 12‐month phases: active (components c1–c8) and maintenance (c4–c8). Waiting‐list control services operated as normal and had contact with the research team only when providing data. Following both phases in early support, the waiting‐list control arm received their support. Services received $AUD100 each as staff‐time reimbursement after each provision of data in phases when they were not receiving support.
FIGURE 1.
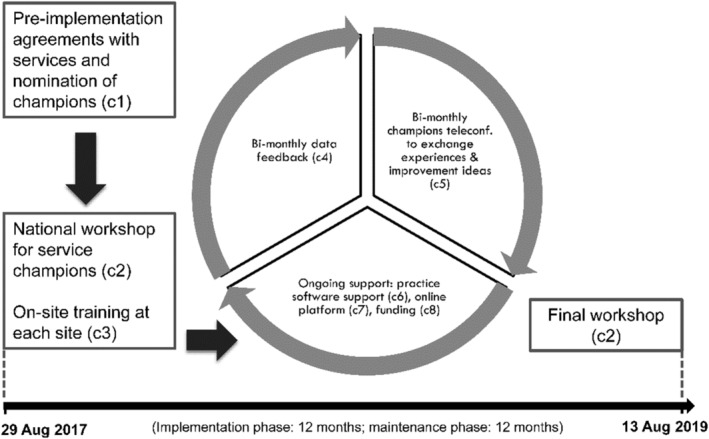
Graphic summary of the support model trialled during this study. c1 – c8: eight components of the support model. Detailed description is provided in Supporting information, Table S1. Implementation is considered as commencing on 31 August 2017, when service champions returned to their services following the workshop. Implementation ended on the last day of the final workshop on 15 August 2019
Study outcomes
We analysed data collected over 3 years (12 months baseline, 24 months implementation). Services extracted de‐identified, routinely collected clinical data from their practice software, Communicare, using SQL commands every 2 months. Clients’ records were matched through client IDs [11]. If a client attended in a 2‐month period this resulted in an observation, which included age, gender and outcome variables.
The outcomes were a recording (yes/no) of each of the following in each 2‐month period:
screening with the Alcohol Use Disorders Identification Test—Consumption (AUDIT‐C); primary outcome (Supporting information, Section S2);
any treatment: advice/BI or counselling for unhealthy alcohol use or prescription of naltrexone, acamprosate or disulfiram; secondary outcome; and
BI: advice/BI for unhealthy alcohol use; secondary outcome.
Analysis
We tested whether the support model improved the clients’ odds of each outcome being recorded at least once in any 2‐month period. To account for the effects of clustering by service and client, we used multi‐level logistic modelling (‘lme4’ package [16] in R statistical software version 4.0.2 [17]). All models focused on testing the following fixed effects:
‘condition’: early support arm (condition = 1); waiting‐list controls (condition = 0);
‘post‐implementation’: whether an observation occurred on or after the start of implementation—taken as the date when service champions returned from the national workshop, 31 August 2017 (yes = 1, no = 0); and
‘intervention’: effect of support model, given by the interaction between ‘condition’ and ‘post‐implementation’. Interaction represents relative change in the odds for the early support arm when compared to the waiting‐list controls, post‐implementation.
We tested a range of random effects. Model selection is detailed in Supporting information, Sections S3 and S4. We calculated:
fixed effects and confidence intervals (Wald estimation);
changes in odds over time for the early support arm (simple slope analysis) using the delta method (‘car’ package [18, 19]); and
adjusted intracluster correlation coefficients (ICC) to describe the proportion of variability explained by differences between clusters (‘performance’ package [20, 21]).
We illustrated the fixed effects by plotting adjusted probabilities (‘ggeffects’ and ‘ggplot2’ packages [22, 23]).
Missing data
As routinely collected data were used, we had no ability to detect if there were missing outcome data. When comparing demographic characteristics of arms at baseline we used complete‐case analysis, as demographic data could be missing.
Aboriginal involvement and consent
Study methods were designed in consultation with two umbrella Aboriginal community‐controlled health organizations (Supporting information, Table S2). The participating ACCHS were involved in refining study design. ACCHS’ custodianship of study data was recognized: consent to participation and data release was sought from each ACCHS from authorized representatives and the board; ACCHS were provided with the results and the manuscript for comment before submitting for publication.
Ethics statement
This study received approval from eight ethics committees in Australian states where the participating services were located (Supporting information, Table S2). Three were Aboriginal‐specific committees.
RESULTS
Description of sample
The 22 ACCHS contributed 83 032 client records between 29 August 2016 and 15 August 2019 (Fig. 2, Supporting information, Table S6). From January 2019, one waiting‐list control service was unable to provide data due to change in practice software. Gender was missing for six clients. Service and client characteristics at baseline (Table 1) and at the end of the study (Supporting information, Table S6) show that sample composition remained broadly unchanged.
FIGURE 2.
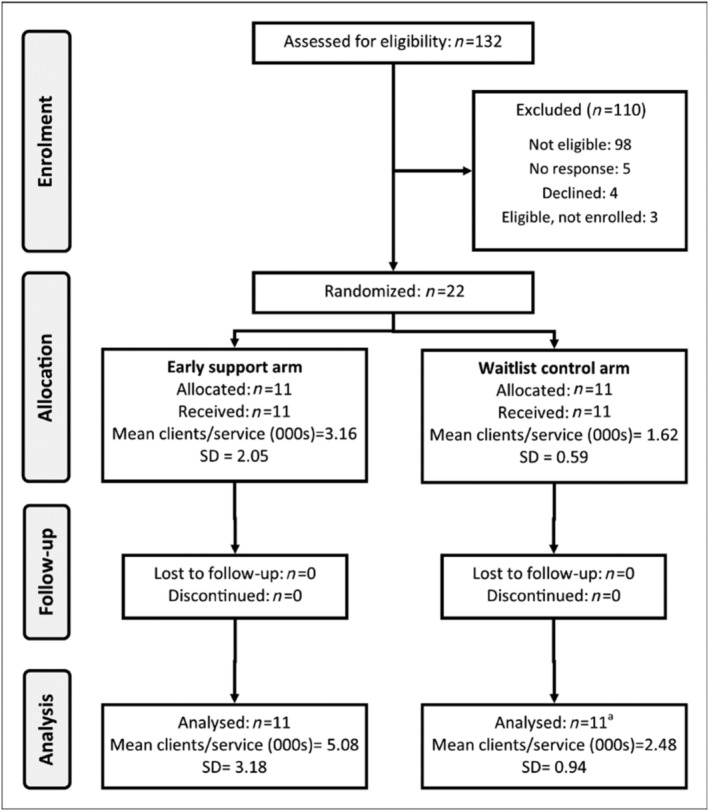
Flow diagram of participating services (n = number of services). aOne service was unable to provide data from January 2019 onwards as they stopped using Communicare to log AUDIT‐C results. Duration of follow‐up was 24 months
Outcomes
The odds of screening at baseline were lower for the early support arm than waiting‐list controls. The odds of recorded BI and any treatment were negligible in both arms. Unadjusted smoothed rates by service and trial arm (Supporting information, Figs S1–S3) and adjusted ICCs (Table 2) demonstrate great variability in effects among the services. Detailed fixed effects results are presented in Table 2.
TABLE 2.
Detailed effects
| ICC (%) | OR | 95% CI | Log‐odds | SE | P | |
|---|---|---|---|---|---|---|
| Screening | 52 | |||||
| (intercept) | 0.02 | (0.01–0.04) | −3.73 | 0.32 | 0.00 | |
| Post‐implementation | 5.09 | (3.01–8.63) | 1.63 | 0.27 | 0.00 | |
| Condition (early support) | 0.13 | (0.05–0.31) | −2.04 | 0.44 | 0.00 | |
| Intervention | 7.95 | (4.04–15.63) | 2.07 | 0.35 | 0.00 | |
| Brief intervention | 66 | |||||
| (intercept) | 0.00 | (0–0) | −9.15 | 0.71 | 0.00 | |
| Post‐implementation | 0.88 | (0.28–2.71) | −0.13 | 0.58 | 0.82 | |
| Condition (early‐support) | 0.79 | (0.15–4.22) | −0.24 | 0.86 | 0.78 | |
| Intervention | 1.95 | (0.53–7.17) | 0.67 | 0.66 | 0.32 | |
| Any treatment | 33 | |||||
| (intercept) | 0.00 | (0–0) | −6.28 | 0.21 | 0.00 | |
| Post‐implementation | 0.59 | (0.41–0.85) | −0.52 | 0.19 | 0.01 | |
| Condition (early support) | 1.01 | (0.6–1.69) | 0.01 | 0.26 | 0.98 | |
| Intervention | 1.89 | (1.19–2.98) | 0.63 | 0.23 | 0.01 |
Intervention = effect of the entire 24‐month support model given by the interaction between condition and post‐implementation time‐period. This interaction represents relative change in the odds for the early support arm when compared to the waiting‐list control arm, post‐implementation. ICC = intracluster correlation coefficient; OR = odds ratio; CI = confidence interval; SE = standard error.
AUDIT‐C screening
After implementation, the odds of screening increased in both arms, but the increase within the early support arm was much larger (simple slope: OR = 40.48, 95% CI = 17.82–91.97). This resulted in early support increase in odds nearly eight times greater (OR = 7.95, 95% CI = 4.04–15.63, P < 0.001) than controls. Probabilities of AUDIT‐C screening adjusted for the effects of the support model are shown in Fig. 3.
FIGURE 3.
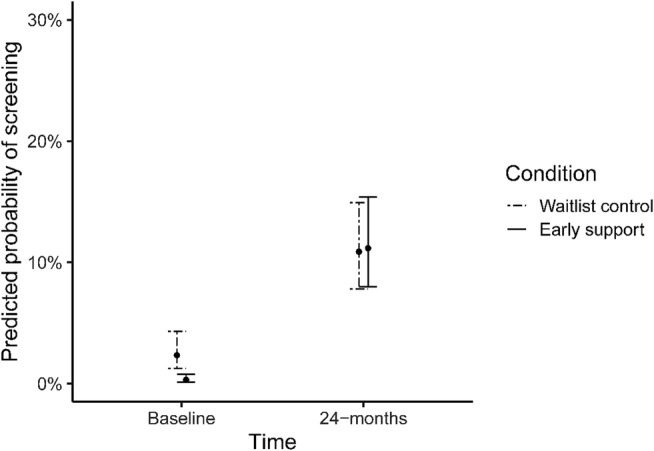
Predicted probabilities of screening in the early and waiting‐list control arms at baseline and during 24 months of implementation
Any treatment and BI
We found no clear evidence that the support model increased in the odds of having any treatment recorded in the early support arm (simple slope: OR = 1.12 95% CI = 0.74–1.68). However, odds reduced significantly for waiting‐list controls (OR = 0.59, 95% CI = 0.41–0.85, P = 0.01). The reduction resulted in significantly greater odds of any treatment in early support services (OR = 1.89, 95% CI = 1.19–2.98, P = 0.01) than in controls.
The evidence that the model increased the odds of BI in the early support arm post‐implementation was inconclusive (simple slope: OR = 1.71, 95% CI = 0.52–5.56), as was the evidence for the early support arm's increase in odds when compared to waiting‐list controls (OR = 1.95, 95% CI = 0.53–7.17, P = 0.32).
However, adjusted probabilities for both any‐treatment and BI remained extremely low (Figs 4 and 5).
FIGURE 4.
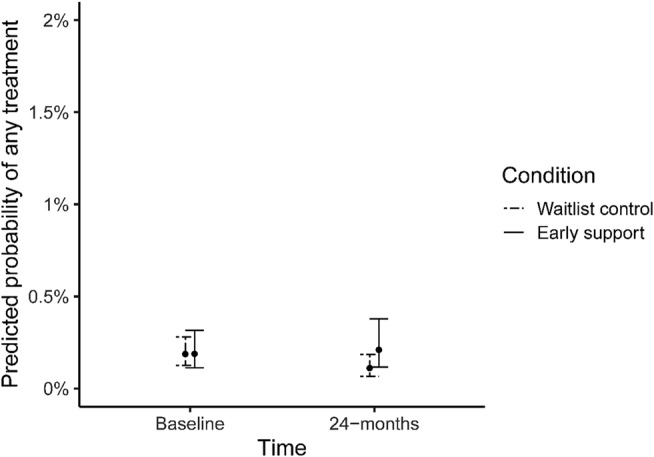
Predicted probabilities of receiving any treatment in the early and waiting‐list control arms at baseline and during 24 months of implementation
FIGURE 5.
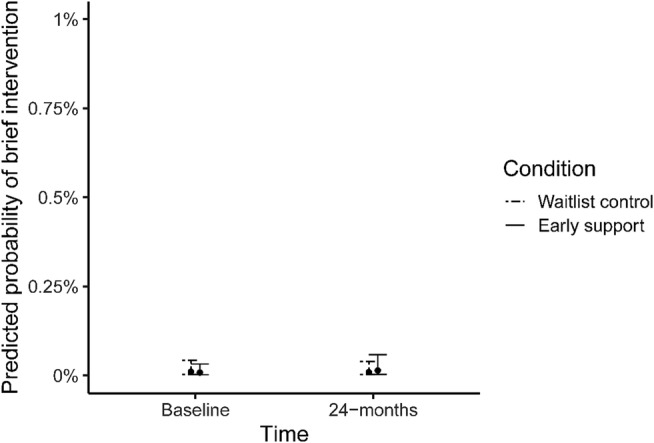
Predicted probabilities of receiving brief intervention in the early and waiting‐list control arms at baseline and during 24 months of implementation
DISCUSSION
This support model resulted in increased AUDIT‐C screening over the 24 months of support and a higher likelihood of screening than during the 12‐month active support phase [9]. However, the high variability in improvement between services [9] persisted until the end of implementation. Given this variability, and the lower baseline screening rates in early support arm, these results must be viewed with caution.
Consistent with the results during 12‐month active phase [9], we were not able to show clear evidence that the support model improved the BI rates over 24 months.
The significant change in odds of any treatment in early support services when compared to waiting‐list controls was driven mainly by a reduction of recorded treatment provision in controls. This result may indicate that the support prevented a drop‐off in treatment provision in the early support arm. However, as the probability of treatment remained extremely low, the increase does not translate to a clinically meaningful result.
Alcohol consumption varies within and between Aboriginal and Torres Strait Islander communities [24]. The design of our model employed tailoring to local conditions, iterative support and using data to drive improvement. Longer duration of implementation (24 months) contrasted with past implementation studies where sites received support over 28 weeks on average [13]. These features may have made it possible for many services to implement improvements despite their highly variable context, ranging from settings where alcohol was freely available to others, where individuals had to drink outside the community.
Recommendations for policy, practice and research
The low implementation rates and high variability in effect sizes indicate that further effort is needed to see more consistent improvements in implementation. At service level, this might include periodic training for new and continuing staff involved in alcohol care and training, on how to improve and monitor service quality (e.g. continuous quality improvement). Screening in combination with other risk factors [e.g. using SNAP (smoking, nutrition, alcohol and physical activity)] may improve client acceptability [25]. Ensuring that practice software prompts recording of BI in response to a raised AUDIT‐C score may help to raise treatment rates.
Previous studies have shown that multiple organizational levels need to be involved to optimize health service improvement efforts [7, 26, 27]. Furthermore, the ACCHS' work to sustainably improve Aboriginal and Torres Strait Islander health must be supported by both state and federal government. Efforts are needed to address systems‐level barriers such as inconsistent, inadequate or siloed funding [28].
Limitations
The pragmatic setting of this implementation trial made the study vulnerable to factors beyond our control. Most significantly, introduction of AUDIT‐C as a national key performance indicator for Aboriginal and Torres Strait Islander primary care in June 2017 [29] may have made early support services more receptive to the support. The effect of this policy change is reflected in the increased odds of screening post‐implementation in both arms.
At service level recording of BI was unlikely to be consistent across sites, as clinicians had to search for and select the relevant clinical item in practice software. Some practices recorded counselling for alcohol by their specialized drug and alcohol staff in different software.
Resource constraints limited our ability to investigate the effect of individual components of the model on outcomes and to capture contextual information (e.g. how support components were used locally to achieve improvement) [26].
CONCLUSIONS
We have demonstrated that our flexible model of support, provided over 24 months, can result in improvement of AUDIT‐C screening. Variability in outcomes indicate that the model was not uniformly successful in inducing gains in screening. Effects on treatment rates for unhealthy alcohol use are less clear. The longer duration of support facilitated successful delivery of the support model at all sites and appeared to be a factor in improving outcomes. Our study suggests that multi‐faceted implementation strategies, which include data‐driven tailoring as well as iterative monitoring and improvement processes, are well suited to the needs of ACCHS because of their flexibility and adaptability to local contexts.
DECLARATION OF INTERESTS
None.
AUTHOR CONTRIBUTIONS
Monika Dzidowska: Conceptualization; formal analysis. KS Kylie Lee: Conceptualization; supervision. James Conigrave: Conceptualization; data curation; methodology. Timothy Dobbins: Formal analysis; supervision. Beth Hummerston: Data curation. Scott Wilson: Conceptualization. Paul Haber: Conceptualization. Dennis Gray: Conceptualization. Katherine Conigrave: Conceptualization; supervision.
TRIAL REGISTRATION
Australian New Zealand Clinical Trials Registry (ACTRN12618001892202): https://anzctr.org.au/Trial/Registration/TrialReview.aspx? ACTRN = 12 618 001 892 202.
Supporting information
Table S1. Detailed description of the eight components of the support model
Table S2. Ethics committees and key Aboriginal community controlled health organisations
Table S3. Models for predicting odds of screening with AUDIT‐C
Table S4. Models for predicting the odds of any‐treatment for unhealthy alcohol use
Table S5. Models for predicting the odds of brief intervention
Table S6. Service characteristics by trial arm, at the over the study perioda (83 032 clients; 417 228 observations)
Figure S1. Unadjusted smoothed screening rates by service and trial arm
Figure S2. Unadjusted smoothed rates of any‐treatment by service and trial arm
Figure S3. Unadjusted smoothed rates of brief intervention by service and trial arm
ACKNOWLEDGEMENTS
This work was supported by the Australian National Health and Medical Research Council (NHMRC) through a Project Grant (ID#1105339), the Centre of Research Excellence in Indigenous Health and Alcohol (ID# 1117198) and Practitioner Fellowships (K.C., ID#1117582; P.H., MRFF ID#1155320). The funder had no role in the study design, data collection and analysis, decision to publish, or preparation of the manuscript. We would like to acknowledge all investigators, staff, students and members of the Centre of Research Excellence Indigenous Health and Alcohol who contributed to this study. In particular, the involvement of: Kristie Harrison (Wiradjuri)—service recruitment, national workshops and on‐site training; Jimmy Perry (Ngarrindjerri, Arrernte), Rob Assan and Peter Jack—national workshops; Taleah Reynolds (Anaiwan), Teagan Weatherall (Kamilaroi, Anaiwan) and Summer Loggins (Bunjalung, Gadigal)—research assistance; Dr José Padarian—technical input; and the 22 ACCHS for participation and their contribution to the study design.
Dzidowska M, Lee KSK, Conigrave JH, Dobbins TA, Hummerston B, Wilson S, et al. Support for Aboriginal health services in reducing harms from alcohol: 2‐year service provision outcomes in a cluster randomized trial. Addiction. 2022;117:796–803. 10.1111/add.15712
Funding information Practitioner Fellowships, Grant/Award Numbers: ID#1155320, ID#1117582; Centre of Research Excellence in Indigenous Health and Alcohol, Grant/Award Number: ID# 1117198; Australian National Health and Medical Research Council (NHMRC), Grant/Award Number: ID#1105339
REFERENCES
- 1. Firestone M, Tyndall M, Fischer B. Substance use and related harms among aboriginal people in Canada: a comprehensive review. J Health Care Poor Underserved. 2015;26:1110–31. [DOI] [PubMed] [Google Scholar]
- 2. Ministry of Health . Alcohol Use 2012/13: New Zealand Health Survey. Wellington, New Zealand: Ministry of Health; 2015.
- 3. Brady M. Alcohol policy issues for indigenous people in the United States, Canada, Australia and New Zealand. Contemp Drug Probl. 2000;27:435–509. [Google Scholar]
- 4. Seale JP, Shellenberger S, Rodriguez C, Seale JD, Alvarado M. Alcohol use and cultural change in an indigenous population: a case study from Venezuela. Alcohol Alcohol. 2002;37:603–8. [DOI] [PubMed] [Google Scholar]
- 5. Gracey M, King M. Indigenous health, part 1: Determinants and disease patterns. Lancet. 2009;374:65–75. [DOI] [PubMed] [Google Scholar]
- 6. Angus C, Thomas C, Anderson P, Meier PS, Brennan A. Estimating the cost‐effectiveness of brief interventions for heavy drinking in primary health care across Europe. Eur J Public Health. 2017;27:345–51. [DOI] [PubMed] [Google Scholar]
- 7. Dzidowska M, Lee KSK, Wylie C, Bailie J, Percival N, Conigrave JH, et al. A systematic review of approaches to improve practice, detection and treatment of unhealthy alcohol use in primary health care: a role for continuous quality improvement. BMC Fam Pract. 2020;21(1):3. 10.1186/s12875-020-1101-x [DOI] [PMC free article] [PubMed] [Google Scholar]
- 8. Williams EC, Matson TE, Harris AHS. Strategies to increase implementation of pharmacotherapy for alcohol use disorders: a structured review of care delivery and implementation interventions. Addict Sci Clin Pract. 2019;14(1). 10.1186/s13722-019-0134-8 [DOI] [PMC free article] [PubMed] [Google Scholar]
- 9. Conigrave JH, Harrison KH, Lee KSK, Dobbins T, Hummerston B, Hayman N, et al. Support can increase use of the AUDIT‐C in Australian aboriginal community controlled health services: a cluster randomised trial. Addiction. 2021;116:2304–15. [DOI] [PubMed] [Google Scholar]
- 10. Keurhorst M, van de Glind I, Bitarello do Amaral‐Sabadini M, Anderson P, Kaner E, Newbury‐Birch D, et al. Implementation strategies to enhance management of heavy alcohol consumption in primary health care: a meta‐analysis. Addiction. 2015;110:1877–900. [DOI] [PubMed] [Google Scholar]
- 11. Harrison KH, Lee KK, Dobbins T, Wilson S, Hayman N, Ivers R, et al. Supporting aboriginal community controlled health services to deliver alcohol care: protocol for a cluster randomised controlled trial. BMJ Open. 2019;9:e030909. [DOI] [PMC free article] [PubMed] [Google Scholar]
- 12. Campbell MK, Piaggio G, Elbourne DR, Altman DG. Consort 2010 statement: extension to cluster randomised trials. BMJ. 2012;345:e5661. [DOI] [PubMed] [Google Scholar]
- 13. National Aboriginal Community Controlled Health Organisation . National Aboriginal Community Controlled Health Organisation Annual Report 2015–2016. Canberra: National Aboriginal Community Controlled Health Organisation; 2016.
- 14. National Aboriginal Community Controlled Health Organisation . National Aboriginal Community Controlled Health Organisation Annual Report 2016–2017. Canberra: National Aboriginal Community Controlled Health Organisation; 2017.
- 15. Australian Bureau of Statistics Australian Standard Geographical Classification (ASGC)2006 16 January 2020. Available at: https://www.abs.gov.au/AUSSTATS/abs@.nsf/Previousproducts/1F8879EF60DD2781CA2571AA001D792F?opendocument. Accessed 16 Jan 2020.
- 16. Bates D, Mächler M, Bolker B, Walker S. Fitting linear mixed‐effects models using lme4. J Stat Softw. 2015;67:1–48. [Google Scholar]
- 17. R Core Team . R: A Language and Environment for Statistical Computing. Vienna, Austria: R Foundation for Statistical Computing; 2018. [Google Scholar]
- 18. Fox J, Weisberg S. An R Companion to Applied Regression. 3rd ed. Thousand Oaks, CA: Sage; 2019. [Google Scholar]
- 19. Sommet N, Morselli D. Keep calm and learn multilevel logistic modeling: a simplified three‐step procedure using Stata, R, Mplus, and SPSS. Int Rev Soc Psychol. 2017;30:203–18. [Google Scholar]
- 20. Nakagawa S, Johnson PCD, Schielzeth H. The coefficient of determination and intra‐class correlation coefficient from generalized linear mixed‐effects models revisited and expanded. J R Soc Interface. 2017;14:20170213. [DOI] [PMC free article] [PubMed] [Google Scholar]
- 21. Lüdecke D, Makowski D, Waggoner P & Patil I Assessment of Regression Models Performance. 0.4.7 edn. CRAN Repository; 2020. Available at: https://cran.r-project.org/web/packages/performance/performance.pdf. Accessed 16 Jun 2020.
- 22. Lüdecke D. ggeffects: Tidy Data Frames of Marginal Effects from Regression Models. J Open Source Softw. 2018;3(26):772. 10.21105/joss.00772 [DOI] [Google Scholar]
- 23. Wickham H. ggplot2. Elegant Graphics for Data Analysis. 2nd ed. New York, NY: Springer International Publishing; 2016. [Google Scholar]
- 24. Conigrave JH, Lee KSK, Zheng C, Wilson S, Perry J, Chikritzhs T, et al. Drinking risk varies within and between Australian aboriginal and Torres Strait islander samples: a meta‐analysis to identify sources of heterogeneity. Addiction. 2020;115:1817–30. [DOI] [PubMed] [Google Scholar]
- 25. Tam CW, Leong LH, Zwar N, Hespe C. Consultation contexts and the acceptability of alcohol enquiry from general practitioners—a survey experiment. Aust Fam Physician. 2015;44:490–6. [PubMed] [Google Scholar]
- 26. Bailie R, Matthews V, Larkins S, Thompson S, Burgess P, Weeramanthri T, et al. Impact of policy support on uptake of evidence‐based continuous quality improvement activities and the quality of care for indigenous Australians: a comparative case study. BMJ Open. 2017;7:e016626. [DOI] [PMC free article] [PubMed] [Google Scholar]
- 27. Bailie J, Laycock A, Matthews V, Bailie R. System‐level action required for wide‐scale improvement in quality of primary health care: synthesis of feedback from an interactive process to promote dissemination and use of aggregated quality of care data. Front Public Health. 2016;4:86. 10.3389/fpubh.2016.00086 [DOI] [PMC free article] [PubMed] [Google Scholar]
- 28. Royal Australian and New Zealand College of Obstetricians and Gynaecologists Practitioners (RACoG) . Support for increased investment in Aboriginal Community Controlled Health Organisations. Position Statement 2020. Available at: https://www.racgp.org.au/getmedia/1573eb96-55a6-41ca-a0f0-329465d9d5cf/RACGP-position-Increased-Investment-in-ACCHOs.pdf.aspx. Accessed 16 Jan 2020.
- 29. Australian Institute of Health and Welfare (AIHW) . National Key Performance Indicators for Aboriginal and Torres Strait Islander Primary Health Care: Results to June 2018. Canberra, Australia: AIHW; 2019. [Google Scholar]
Associated Data
This section collects any data citations, data availability statements, or supplementary materials included in this article.
Supplementary Materials
Table S1. Detailed description of the eight components of the support model
Table S2. Ethics committees and key Aboriginal community controlled health organisations
Table S3. Models for predicting odds of screening with AUDIT‐C
Table S4. Models for predicting the odds of any‐treatment for unhealthy alcohol use
Table S5. Models for predicting the odds of brief intervention
Table S6. Service characteristics by trial arm, at the over the study perioda (83 032 clients; 417 228 observations)
Figure S1. Unadjusted smoothed screening rates by service and trial arm
Figure S2. Unadjusted smoothed rates of any‐treatment by service and trial arm
Figure S3. Unadjusted smoothed rates of brief intervention by service and trial arm


