

Abstract
Background
The specificities of IgE and IgG for allergen molecules in patients with inborn errors of immunity (IEI) have not been investigated in detail.
Objective
To study IgE and IgG antibody specificities in patients with defined hyper‐IgE syndromes (HIES) using a comprehensive panel of allergen molecules.
Methods
We used chips containing micro‐arrayed allergen molecules to analyze allergen‐specific IgE and IgG levels in sera from two groups of HIES patients: Autosomal recessive mutations in phosphoglucomutase‐3 (PGM3); Autosomal dominant negative mutations of STAT3 (STAT3); and age‐matched subjects with allergic sensitizations. Assays with rat basophil leukemia cells transfected with human FcεRI were performed to study the biological relevance of IgE sensitizations.
Results
Median total IgE levels were significantly lower in the sensitized control group (212.9 kU/L) as compared to PGM3 (5042 kU/L) and STAT3 patients (2561 kU/L). However, PGM3 patients had significantly higher allergen‐specific IgE levels and were sensitized to a larger number of allergen molecules as compared to STAT3 patients. Biological relevance of IgE sensitization was confirmed for PGM3 patients by basophil activation testing. PGM3 patients showed significantly lower cumulative allergen‐specific IgG responses in particular to milk and egg allergens as compared to STAT3 patients and sensitized controls whereas total IgG levels were comparable to STAT3 patients and significantly higher than in controls.
Conclusion
The analysis with multiple micro‐arrayed allergen molecules reveals profound differences of allergen‐specific IgE and IgG recognition in PGM3 and STAT3 patients which may be useful for classification of IEI and clinical characterization of patients.
Keywords: allergen, hyper‐IgE syndrome (HIES), micro‐array, phosphoglucomutase‐3 (PGM3) deficiency, signal transducer and activator of transcription (STAT3)
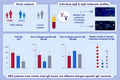
This study assesses IgE and IgG antibody specificities in HIES patients using a comprehensive panel of allergen molecules. Median total IgE levels are significantly lower in the sensitized control group as compared to PGM3 and STAT3 patients. PGM3 patients have significantly higher allergen‐specific IgE levels and are sensitized to a larger number of allergen molecules as compared to STAT3 patients.Abbreviations: IEI, inborn errors of immunity; ISU, ISAC standardized unit; HIES, hyper‐IgE syndrome; kU/L, kilo unit per liter; PGM3, autosomal‐recessive phosphoglucomutase‐3 deficiency; sIgE/sIgG, specific immunoglobulin E/specific immunoglobulin G; STAT3, signal transducer and activator of transcription 3
1. INTRODUCTION
Immunoglobulin E (IgE) production against specific allergens is the hallmark of allergic diseases but is also elevated in certain forms of PID. 1 IgE is the least abundant immunoglobulin but can elicit strong immediate inflammation through FcεRI‐mediated activation of mast cells and basophils when it becomes cross‐linked by the corresponding allergen molecules. 2 Accordingly total serum IgE levels can be strongly elevated in atopic patients who are sensitized against a large number of allergen molecules in severe allergic diseases such as asthma or atopic dermatitis. However, several monogenic Primary Immune Deficiencies (PIDs) or Inborn Errors of Immunity (IEI) with dramatically elevated IgE levels have been reported. 3 , 4 Some of these disorders have been considered as hyper‐IgE syndromes (HIES), which are characterized by the triad of high serum IgE levels, eczema, and eosinophilia which are accompanied by recurrent skin and pulmonary infections. HIES may also present with non‐immunological manifestations, such as connective tissue and bone abnormalities. 3 , 4 , 5 , 6 Multiple genetic defects underlying HIES have been identified and support the current 2019 International Union of Immunological Societies (IUIS) classification of these diseases. 7 The first description of HIES was Job´s syndrome reported already in 1966 8 shortly before the characterization of IgE antibodies. 9 It was shown to be an autosomal dominant (AD) form of HIES due to mutations in the STAT3 gene, encoding for the STAT3 transcription factor 10 , 11 , 12 , 13 influencing multiple cytokine and chemokine pathways such as IL‐6, IL‐10, IL‐11, IL‐21, IL‐27, and oncostatin M. STAT3 is essential for various cellular processes, including cell survival, immunity, wound healing, vascular remodelling, and embryogenesis. 14 Dysfunctional STAT3‐dependent signalling in AD‐HIES was then investigated and specific stages of STAT3 signalling affected by the mutations were identified. 15
The autosomal recessive (AR) forms of HIES are mainly due to mutations in PGM3. 16 , 17
We have previously shown that mutations in PGM3 lead to a glycosylation defect in a rare form of HIES. 16 A more recent study demonstrated that defective glycosylation in PGM3‐deficient patients leads to reduced expression of the non‐glycosylated form of gp130 protein and thus to reduced gp130‐dependent STAT3 phosphorylation, explaining similar clinical features of PGM3 deficiency and the AD STAT3 form of the disease. 18 Despite the massive elevations of total IgE levels in various forms of HIES, little is known about the specificities of IgE in the affected patients. It has been even hypothesized that much of the IgE produced in PID patients is driven by dysregulated IL‐4 production and may lack antigen specificity. 19 One study investigating patients with STAT3 mutations even reported markedly lower occurrence of food allergy and anaphylaxis as well as reduced IgE‐FcεRI‐mediated mast cell activation in STAT3‐deficient patients as compared to allergic patients without STAT3 mutations 20 A study assessing cellular immune responses in STAT3‐HIES patients found that they can mount in vivo T cell‐dependent B cell responses but obtained evidence for reduced affinity maturation of antibodies and reduced B cell differentiation. 21 A third study compared STAT3‐deficient patients and DOCK8‐deficient patients, with allergic patients and noted that DOCK8‐deficient patients showed higher IgE levels to food allergens whereas aeroallergen‐specific IgE levels were comparable in both groups. 22 We previously reported, that PGM3 patients may exhibit allergic symptoms, such as moderate/severe atopic dermatitis, asthma, food and drug allergy but nothing is known about the allergen specificities of IgE in PGM3 patients. 16
In a recent overview article a comprehensive overview of IEI with atopic phenotypes is provided and the challenges in the diagnostic work‐up of these diseases, in particular the differential diagnosis to classical allergic disorders is mentioned. 4 This aforementioned review article also emphasizes that in addition to HIES several other IEI such as Wiskott‐Aldrich syndrome (WAS), immune dysregulation, polyendocrinopathy, enteropathy, X‐linked (IPEX), Omenn syndrome and atypical DiGeorge syndrome are characterized by increased serum IgE levels. 4 The article also contains a useful proposal for a diagnostic algorithm for the identification of IEI with atopic phenotypes recommending a thorough genetic testing for reaching a definitive diagnosis.
The fact, that there may be relevant differences regarding the presence of allergen‐specific IgE sensitizations in certain forms of HIES (e.g., AD‐HIES STAT3, DOCK8 deficiency) 22 indicates that it may be useful to investigate and understand the specificities of IgE antibodies in IEI with atopic phenotypes and HIES. Furthermore, it may be of interest to investigate the spectrum and production of allergen‐specific IgG antibodies in HIES patients. For the assessment of IgE and IgG reactivity to multiple defined allergen molecules, we have developed the micro‐array technology. 23 This technology was advanced to create the MeDALL allergen chip containing more than 160 allergen molecules, which we used for the measurement of allergen‐specific IgE and IgG responses in serum samples collected from children in various birth cohorts in the European Union‐funded research program ‘Mechanisms for the development of allergy’ (MeDALL). 24 , 25 The MeDALL allergen chip was shown to be as sensitive as ImmunoCAP IgE measurements and to be more sensitive to detect IgE specificities than traditional forms of allergy diagnosis. 24 , 26 The technology has been already used for measuring specific IgE in case reports of immune dysregulation, polyendocrinopathy, enteropathy, X‐linked (IPEX) syndrome. 27 Here we investigated IgE and IgG specificities to a large set of micro‐arrayed allergen molecules in STAT3 and in PGM3 patients and age‐matched control individual with IgE sensitizations and studied the biological relevance of molecular IgE sensitization in PGM3 patients by basophil activation.
2. MATERIALS AND METHODS
2.1. Demographic and clinical characteristics of patients and controls
Table 1 provides a summary of the demographic and clinical characteristics of eight PGM3 and five STAT3 patients and an age‐matched group of eight non‐HIES subjects with allergic sensitization from Tunisia. In particular, the table provides information regarding age and gender, allergic symptoms, laboratory parameters (total serum IgE, total serum IgG) eosinophil blood counts, genetic analysis, HIES clinical NIH scoring and STAT3 phosphorylation. The clinical manifestations of PGM3 and STAT3 patients are summarized in Table 2, whereas data regarding cellular parameters can be found in Table S1.
TABLE 1.
Demographic and clinical characteristics of investigated patients
| Patients | Gender m/f | Age years | Allergic symptoms | Recognised allergens | Total IgE kU/L | Total IgG g/L | Eosinophils | Score NIH | Mutation | P‐STAT3 | ||
|---|---|---|---|---|---|---|---|---|---|---|---|---|
| PGM3 | ||||||||||||
| 1 | m | 11 | W, E | FA, RA | 4000 | 6.9 | 760 | 50 | p. Glu340del | PGM3 | Defect | |
| 2 | f | 11 | W, E | FA, RA, OA | 807 | 16.3 | 600 | 33 | p. Glu340del | PGM3 | Defect | |
| 3 | f | 7 | n.d | FA, RA, OA | 6085 | 17.4 | 520 | 32 | p. Glu340del | PGM3 | Defect | |
| 4 | m | 17 | n.d | FA, RA, OA | 3946 | 16.2 | 550 | 31 | p. Glu340del | PGM3 | Defect | |
| 5 | m | 16 | n.d | FA, RA, OA | 1651 | 12.6 | 850 | 33 | p. Glu340del | PGM3 | Defect | |
| 6 | m | 3 | E | FA | 6930 | 12.0 | 530 | 26 | p. Glu340del | PGM3 | Defect | |
| 7 | m | 34 | W, E | RA, OA | 99,600 | 15.6 | 1330 | 56 | p. Leu83Ser | PGM3 | n.d | |
| 8 | m | 32 | W, C, E | FA, RA, OA | 141,300 | 16.0 | 1450 | 53 | p. Leu83Ser | PGM3 | Defect | |
| STAT3 | ||||||||||||
| 9 | m | 40 | no | FA | 2947 | 12.6 | n.d | n.d | p.M329V | STAT3 | Normal | |
| 10 | f | 3 | E | OA | 2323 | 10.4 | 550 | 30 | p.M329V | STAT3 | Normal | |
| 11 | f | 5 | E | no | 850 | 8.5 | n.d | n.d | p.M329V | STAT3 | Normal | |
| 12 | m | 3 | W, AR, E | FA, RA, OA | 2875 | 10.3 | 330 | 43 | p.M329V | STAT3 | Normal | |
| 13 | f | 14 | n.d | RA | 2561 | 16.8 | 710 | 53 | c.*351delG | 3'UTR STAT3 | Normal | |
| Patients |
Gender m/f |
Age years |
Allergic symptoms |
Recognized allergens |
Total IgE kU/L |
Total IgG g/L |
|---|---|---|---|---|---|---|
| Control | ||||||
| 14 | f | 3 | n.d | RA | 150 | 7.4 |
| 15 | f | 5 | n.d | FA, RA, OA | 747 | 6.0 |
| 16 | m | 5 | n.d | FA | 56 | 9.9 |
| 17 | m | 8 | n.d | FA, RA, OA | 345 | 8.8 |
| 18 | m | 3 | n.d | RA | 984 | 10.2 |
| 19 | m | 29 | n.d | RA | 35 | 11.1 |
| 20 | f | 40 | n.d | FA, RA | 276 | 12.5 |
| 21 | f | 29 | n.d | RA | 38 | 10.9 |
Abbreviations AR, allergic rhinitis; C, conjunctivitis; E, eczema; FA, food allergens; n.d, not done; no other mutation detected; no, no symptoms; OA, other allergens; RA, respiratory allergens; STAT3 no mutation, no mutation in the STAT3 gene; W, wheezing.
TABLE 2.
Clinical manifestations in HIES patients
| Patients | Clinical manifestations |
|---|---|
| PGM3 | |
| 1 | recRTI, eczema, oral candidiasis, cutaneous abscesses, DD, elevated IgE, eosinophilia |
| 2 | recRTI, eczema, cutaneous abscesses, DD, elevated IgE, eosinophilia |
| 3 | recRTI, cutaneous abscesses, DD, elevated IgE, eosinophilia |
| 4 | recRTI, eczema, DD, viral infection, scoliosis, elevated IgE, eosinophilia |
| 5 | recRTI, eczema, cutaneous abscesses, DD, scoliosis, elevated IgE, eosinophilia |
| 6 | recRTI, eczema, cutaneous abscesses, DD, candidiasis, elevated IgE, eosinophilia |
| 7 | hyperextensibility, failure to thrive, DD, elevated IgE, eosinophilia |
| 8 | recRTI, pneumonias, bronchiectasis, bacterial skin abscesses, severe eczema, hyperextensibility, failure to thrive, DD, elevated IgE, eosinophilia |
| STAT3 | |
| 9 | recRTI, scoliosis, pathologic fractures, joint hyperextensibility, elevated IgE |
| 10 | recurrent bacterial skin infections, pneumonias, eczema, elevated IgE, eosinophilia |
| 11 | pneumonias, atopic dermatitis, cutaneous abscesses, oral candidiasis, elevated IgE |
| 12 | recurrent bacterial skin abscesses, pneumonias, pneumatoceles, atopic dermatitis, elevated IgE, eosinophilia |
| 13 | recRTI, recurrent bacterial skin infection, eczema, gingivitis, oral candidiasis, onychomycosis, retained primary teeth, short stature, puberty delay, elevated IgE, eosinophilia |
Abbreviations: DD, developmental delay; recRTI, recurrent respiratory tract infections.
The Tunisian patients with clinical hyper‐IgE syndrome were investigated at the Institute Pasteur of Tunis. Clinical examination revealed that they presented the clinical features of HIES, that is recurrent pneumonias, skin abscesses, eczema and elevated levels of serum IgE. Besides the clinical features common to HIES, six HIES patients (Table 2: patients #4, 5, 7, 8, 9 and 13) presented additional non‐immunological manifestations, such as connective tissue and bone abnormalities usually associated with AD‐HIES (Table 2).
The diagnosis of AD‐HIES due to STAT3 mutation was based on the HIES clinical NIH scoring system. The latter, included among others the immunological, infectious, allergic, skeletal and connective tissues abnormalities as well as the IgE level and eosinophil counts. Although not perfectly adapted for AR‐HIES, the NIH scoring system is still commonly used. HIES was considered highly likely with a score >40, a score between 20 and 40 gave an intermediate probability and with a score <20 points, HIES was considered unlikely.
Besides NIH scoring, a psychomotor retardation and a developmental delay observed in certain patients were highly suggestive of PGM3 deficiency (Table 2).
Within the HIES suspected patients the following subgroups were identified by means of clinical, laboratory and genetic examination: Group 1 PGM3: confirmed autosomal recessive phosphoglucomutase three deficiency (PGM3) (n = 8); Group 2 STAT3: confirmed autosomal dominant STAT3 deficiency (n = 5); (Table 1).
Patients or parents of patients were asked to fill the ISAAC core questionnaires 28 to assess the prevalence and severity of allergic symptoms such as asthma, rhinitis and eczema. For control purposes, serum samples from 8 age‐matched non‐HIES Tunisian residents with IgE sensitizations to the tested allergen molecules were picked from a group of 27 subjects who had undergone minor surgery to reflect the regional sensitization profiles (Control). Since the ISAAC core questionnaire was not applied to the latter group no information regarding allergic symptoms is available for these subjects but their IgE sensitizations to the 174 allergen molecules were determined (Figures 1 and 2; Figure S1).
FIGURE 1.
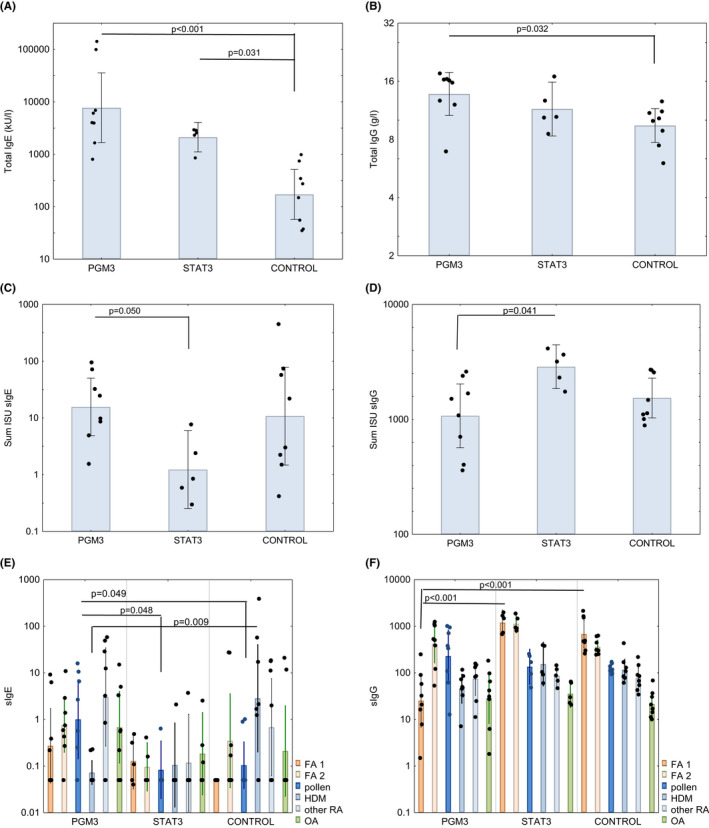
Comparison of A, total IgE, B, total IgG, C, cumulative allergen‐specific IgE, D, cumulative allergen‐specific IgG levels as well as of cumulative IgE levels E, and cumulative IgG levels, F, specific for cow´s milk and egg allergens (FA1), nut‐, seed‐, fruit‐, wheat‐, fish‐ and shrimp allergens (FA2), pollen allergens, HDM allergens (HDM), other respiratory allergens (other RA) and other allergens (OAs) in PGM3, STAT3 patients and allergic controls (x‐axes). y‐axes show total IgE kU/L; total IgG g/L; sum of specific IgE ISU, sum of specific IgG ISU on a log scale, bars represent geometric means with individual data points included and 95% confidence intervals are indicated. Significant differences were calculated for the cumulative allergen‐specific IgE levels. p values below 0.05 were considered significant and are indicated
FIGURE 2.
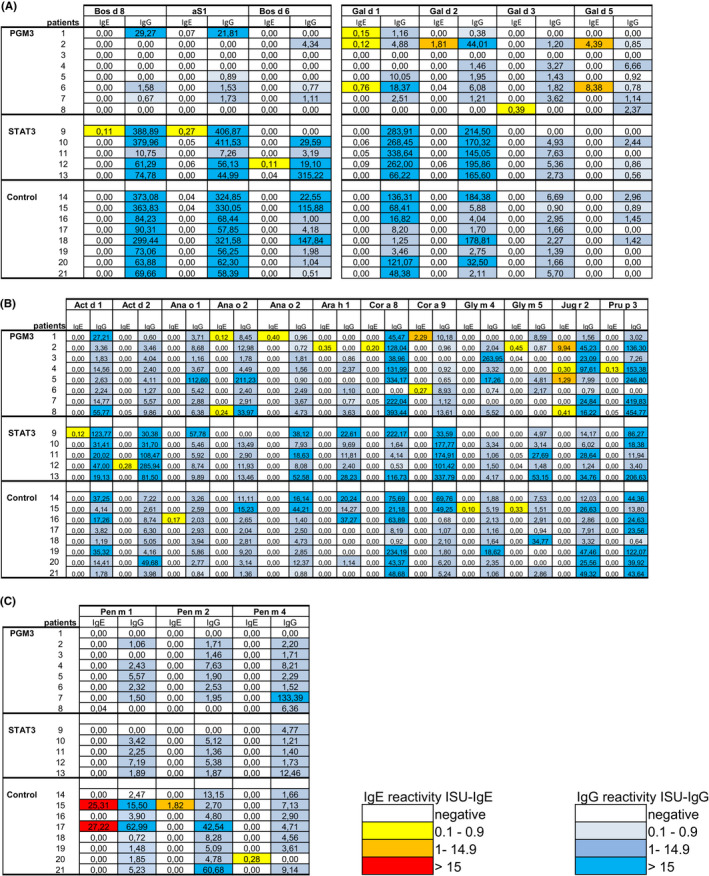
Heat map of IgE and IgG reactivity to A, cow’s milk and egg allergens B, to nut‐, seed‐, fruit‐ and wheat allergens and C, fish‐ and shrimp allergens. Shown are IgE (ISU‐IgE) and IgG (ISU‐IgG) levels (color code) specific for the allergens determined in sera from the patients with hyper‐IgE syndromes (PGM3, STAT3) and control subjects
2.2. Ethics approval and sample collection
Upon signing the written consent the patients` blood samples were taken. For each patient venous blood was collected from a cubital vein into a tube without an anticoagulant. The blood samples were centrifuged at room temperature for 10 min, and the serum was aliquoted into Eppendorf tubes and stored at −20°C for further analysis. Pseudonymized sera were then analyzed for specific antibodies with approval of the ethics committee of Medical University of Vienna, Austria—EK1641/2014.
2.3. Cellular and genetic analyses
Numbers of blood eosinophils, CD19+, CD3+, CD4+ and CD8+ cells were determined as described. 16 In brief, CD19+, CD4+ and CD8+ T cells were measured in freshly isolated peripheral blood mononuclear cells (PBMCs) which had been stained with CD3‐fluorescein isothiocyanate (FITC), CD4‐FITC or CD8‐phycoerythrin abs from Becton Dickinson (BD).
TH17 cells (CD4+IL17+INFgamma‐) were identified by means of intracellular staining of IL‐17. Briefly, adherent monocytes were removed from the PBMC preparation by incubation for 3 h at 37°C, under an atmosphere containing 5% CO2. Aliquots of 2.5 × 10⁶ non‐adherent cells were stimulated overnight with 40 ng/ml phorbol 12‐myristate 13‐acetate (Sigma‐Aldrich) and 10−5 M ionomycin (Sigma‐Aldrich) in the presence of a secretion inhibitor (1 μl/ml GolgiPlug BD Biosciences). CD4+ surface‐stained cells were fixed, permeabilized (Cytofix/Cytoperm;BD Biosciences), and stained with anti‐IL‐17A and anti‐IFN‐γ (BD Biosciences). CD4+CD45RO+ surface‐stained cells were fixed, permeabilized (Cytofix/Cytoperm, BD Biosciences), and stained with an anti‐IL‐4 antibody (BD Biosciences). 17 Stained cells were analyzed on a BD FACSCanto II Flow Cytometer and results were analyzed using Cell Quest Pro software (BD Biosciences). Data were analyzed using FlowJo software.
The analysis of STAT3 phosphorylation was performed as described. 18 Cells were stimulated with IL‐6 (20 ng/ml, R&D Systems, Inc.) for 15 min at 37°C and then fixed at 37°C using Cytofix buffer for 10 min, permeabilized on ice with Perm Buffer III for 30 min (both from BD Biosciences) and stained with phospho‐STAT3 (pY705) antibody (BD Biosciences) for 1 h at room temperature, washed again, and re‐suspended in FACS buffer for flow cytometry (BD FACScanto II). Data were analyzed using FlowJo software.
Genetic analysis of mutations in STAT3 and PGM3 were performed as described. 16 , 17 In brief, genomic DNA was extracted from PBMCs or Epstein‐Barr virus‐transformed lymphoblastoid B cell lines (EBV‐LCLs) using a phenol‐chloroform procedure. Cells were incubated in 5 ml of lysis buffer (100 mM NaCl, 10 mm Tris‐HCL pH 7.4, 25 mM EDTA pH 8.0, 0.5% SDS) and incubated overnight at 37°C in the presence of 20 μg/ml proteinase K. DNA was then extracted with phenol‐chloroform, precipitated in ethanol, and suspended in TE 1X buffer (10 mM Tris‐HCl pH 8.0, 1 mM EDTA). Polymerase chain reaction (PCR) amplification was carried out with Taq DNA Polymerase (Bioline).
All STAT3 (ENST0000264657.10) exons and exon/intron boundaries, PGM3 (ENST00000513973.6) exon 4 and exon 8 were amplified by PCR. Amplified products were purified using the EXO‐SAP (Thermo Scientific) cleanup procedure and sequenced with the BigDye Terminator kit V3.1 (Applied Biosystems). The sequencing was performed on an automated sequencer from Applied Biosystems (Applied Biosystems) and the data were analyzed with GENALYS software (CNG, France; http://software.cng.fr).
2.4. Measurement of total IgE and IgG levels
For measuring total IgE levels, ImmunoCAP assays were performed according to the manufacturer`s instructions (Thermofisher Scientific). Serum IgG levels were measured by Turbidimetry—SPA plus ® (Binding Site).
2.5. Determination of allergen‐specific IgE and IgG
IgE and IgG reactivity to 174 allergen molecules (Table S2), was determined, using MeDALL allergen chips, which had been produced according to ImmunoCAP ISAC technology (Thermofisher), as described previously. 24 For IgG measurements samples were diluted 1:50 using sample diluent (Thermofisher).
Bound IgE or IgG antibodies, were determined by scanning chips using LuxScan 10K micro‐array Scanner (CapitalBio Technology). The analysis of scanned chips was performed with the micro‐array evaluation software version 3.1.2 (customized for MeDALL chips). Results were summarized in three categories for specific IgE/IgG values (0.1 < ISU < 1, 1 < ISU < 15, and >15 ISAC Standardized Units) (ISU). Patients having antibody levels above 0.1 ISU were considered positive. Subjects displaying IgE reactivity to any of the allergens on the MeDALL chip were considered as having an IgE sensitization.
2.6. Rat basophil leukemia cell degranulation assay
RBL assays were performed for patients from the PGM3 (patients #2, #5) for whom sufficient volumes of serum were available to investigate the biological relevance of IgE sensitization. Rat Basophil Leukemia cells (RBL) (RS‐ALT8) expressing the human high‐affinity IgE receptor, 29 were maintained in minimum essential medium Eagle (MEM) supplemented with 5% FBS, 2 mM L‐glutamine (ThermoFisher Scientific), 100 units/ml penicillin and 100 µg/ml streptomycin, 200 µg/ml Geneticin (ThermoFisher Scientific) and 200 µg/ml Hygromycin B (ThermoFisher Scientific) at 37°C and 5% CO2. RBL cells were then loaded with sera from patients at a dilution of 1:10 as described. 30 Cells were then washed three times with Tyrode's buffer (Sigma) and exposed to serial dilutions of allergens (1 ng, 10 ng or 100 ng/ml), respectively, for 1 h. As negative controls, cells were incubated (i) only with allergen but without serum, (ii) only with serum but without allergen or (iii) only with medium but without allergen or serum. Supernatants were analyzed for β‐hexosaminidase release as described previously. 31 Experiments were carried out in duplicates, and results are presented as mean percentages of total β‐hexosaminidase released after addition of 1%Triton X‐100. The deviations of the duplicates were always less than 10%.
2.7. Statistical analysis
As primary endpoint the sum of specific IgE levels was statistically analyzed by a general linear model with log link because of the approximately log‐normal distribution of IgE levels. Normality of residuals was tested by Kolmogorov‐Smirnov tests with Lilliefors’ corrected p values. Homogeneity of variances was tested by Brown‐Forsythe test. Comparisons between groups were done by Tukey's honest significant difference tests. Other endpoints were tested analogously, however, p values are considered exploratory. For computation of the sum of specific IgE levels, zeros were arbitrarily replaced by half of the cutoff level of 0.1. All statistical tests were performed by Stata 13.0 (StataSoft). Figures were prepared by Statistica 10.0 (StatSoft). p values below 0.05 were considered significant.
3. RESULTS AND DISCUSSION
This study compared the IgE and IgG reactivity profiles against 174 allergen molecules (Table S2) in patients with STAT3 and PGM3 deficiency and an age‐matched control group of subjects with IgE sensitizations from the same geographic region with similar cultural backgrounds. Table 1 displays an overview of the demographic and clinical features of the patients with confirmed PGM3 deficiency due to mutations in the PGM3 gene (PGM3, n = 8) and patients, with AD‐STAT3 mutation (STAT3, n = 5). (Table 1). Besides the mutations determined for the HIES patients, results regarding the phosphorylation status are provided in Table 1 for all but one of the HIES patients.
The clinical features of the HIES patients are described in detail in Table 2. Patients suffered from recurrent respiratory tract infections (n = 9/13), eczema (n = 8/13), elevated total IgE (n = 13/13), eosinophilia (n = 11/13) as well as abscesses and/or skin infections (n = 10/13). Developmental delays and neurological impairment occurred mainly in PGM3‐deficient patients (Table 2). A characteristic clinic‐laboratory finding in PGM3‐deficient patients is an inverted CD4/CD8 ratio (n = 6/8) (Table S1). Our past work has shown, that for the same patients investigated previously (n = 3), lymphocyte sub‐population phenotyping revealed increased TH2 and normal or borderline low number TH17 cells (Table S1). 16
Median as well as geometric mean total IgE levels were highest in PGM3 patients followed by the STAT3 patients whereas they were significantly lower in the control group of subjects with allergic sensitizations (Figure 1A, Table S3). Figure 2 and Figure S1A–D display heat maps of IgE and IgG reactivity to those of the 174 allergen molecules tested (Table S2) for which specific IgE reactivity was detected in at least one of the patients or controls.
Although STAT3 and PGM3 patients, had significantly higher total serum IgE levels as compared to subjects with allergic sensitizations, the STAT3 patients showed the lowest cumulative allergen‐specific IgE levels among all studied groups which were significantly lower than those of the PGM3 group (Figure 1, Table S3). This was also reflected by the median numbers of recognized allergens. The median number of allergens recognized by STAT3 patients was 2, whereas sensitized controls were sensitized to 4.5, and PGM3 patients to 7 (Table S3).
PGM3 patients were frequently sensitized to egg allergens (Figure 1A). Also, fish, shrimp, fruit, vegetable, seed, and nut allergens were more frequently recognized by the PGM3 group and control group than by the STAT3 group (Figure 1, Figure 2B,C, Table S3). In this context, one has to consider that the prevalence of IgE sensitization to food allergens usually does not exceed 5%–10%. 32
Sensitization to respiratory allergens typically develops later in life as compared to food allergen sensitization. 32 We found that also IgE sensitizations to respiratory allergen molecules were lowest in term of allergen‐specific IgE levels and numbers of recognized allergens in the STAT3 group as compared to PGM3 patients and allergic controls (Figure 1, Figure S1A–C, Table S3).
In summary, patients with STAT3 mutations reacted with fewer allergen molecules and had a lower mean cumulative allergen‐specific IgE level than the PGM3 and allergic control group although they had highly elevated total IgE levels (i.e., median 2561, geometric mean 2120 kU/L) (Figure 1, Table S3). This finding is in agreement with earlier studies reporting that STAT3 patients show highly elevated total IgE levels but only little specific IgE reactivity to known allergen sources. 22 , 33 A more recent study suggested that STAT3 signalling is important for optimal affinity maturation of antibodies and B cell differentiation and that the low allergen‐specific IgE reactivity in STAT3 patients may be due to disturbed affinity maturation of antibodies. 21 The latter may also explain the observation made in another study that STAT3 patients exhibited few allergic symptoms and reduced IgE‐FcεRI‐mediated mast cell activation. 20
We therefore were interested to study whether allergen‐specific IgE antibodies detected in PGM3 may be functional and elicit allergen‐specific effector cell activation. In fact, the biological relevance of IgE sensitization in the PGM3‐deficient patients was confirmed in basophil activation experiments. We observed a specific and dose‐dependent release of beta‐hexosaminidase from RBL cells when they were loaded with serum IgE from two PGM3‐deficient patients and exposed to respiratory allergens (i.e., major cat allergen, Fel d 1; major Alternaria alternata allergen, Alt a 1) (Figure 3). These experiments could be only performed with sera of which we had sufficient volumes available and with a limited number of allergens, but they indicate the potential clinical relevance of IgE sensitization in the tested patients. Information regarding clinical symptoms of allergy was available for certain of the investigated HIES patients according to ISAAC questionnaire (i.e., for 5 out of 8 PGM3 patients and 4 out of 5 STAT3 patients). We found that allergic symptoms which are mainly caused by IgE‐mediated mast cell and basophil degranulation (i.e., wheezing, conjunctivitis and/or allergic rhinitis) were more common in PGM3‐ (i.e., 4 out of 5) as compared to STAT3 patients (i.e., 1 out of 4) (Table 1). Eczema, a mainly T cell‐mediated allergic manifestation which does not strictly depend on IgE sensitization 34 was found in all but one of the HIES patients with available ISAAC questionnaire data (Table 1). While it is a limitation of our study that information regarding clinical manifestations of allergy was obtained only by ISAAC questionnaire and not for all subjects investigated, the available data still would indicate that symptoms of allergy are more common in PGM3 patients as compared to STAT3 patients.
FIGURE 3.
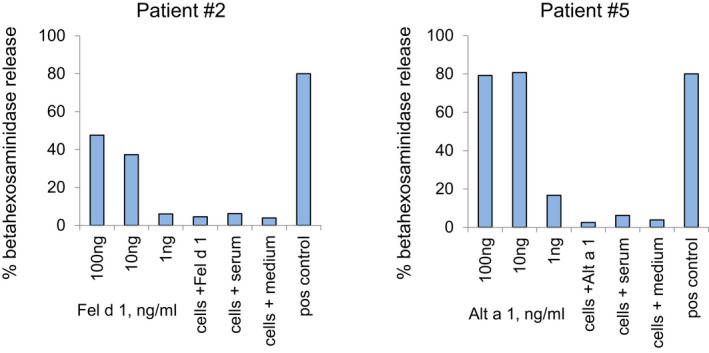
Induction of specific and dose‐dependent rat basophil leukemia (RBL) cell activation in PGM3 patients. Shown are mean percentages of total beta‐hexosaminidase (y‐axes) releases from RBL cells which had been loaded with serum IgE from PGM3 patients (patients 2, 5) after stimulation with different allergen concentrations (x‐axes). Furthermore, negative controls (cells plus allergen only; cells plus serum only; cells plus medium only) and positive controls (loading with serum from a patient with clinically relevant sensitization to the tested allergen, pos control) were performed (x‐axes)
Next, we investigated total and allergen‐specific IgG levels in the HIES patients and sensitized control group (Table 1, Figure 1, Tables S3 and S4). We found that total IgG levels were comparable in the HIES patients whereas they were significantly lower in the allergic control group (Figure 1B, Table S3). Regarding the cumulative sum of allergen‐specific IgG levels PGM3‐deficient patients stood out because their allergen‐specific IgG levels and in particular their milk‐ and egg allergen‐specific IgG levels were significantly lower than those of STAT3 patients (Figure 1D,F, Table S4). This finding cannot be explained by the fact that the PGM3 patients were younger than the STAT3 patients and control subjects and thus exposed for a shorter time to the allergens because their median age was the highest of the three studied groups (Tables S3 and S4).
The use of micro‐arrayed allergen molecules for detecting IgE and IgG responses to a large number of allergen molecules was certainly important to reveal these differences of IgE and IgG recognition of allergen molecules in the different HIES groups. In fact, our micro‐array contained a broad panel of the most common food, respiratory and other allergen molecules. Earlier studies have shown that the test was more sensitive in picking up IgE sensitizations than allergen extract‐based screening tests for detecting specific IgE sensitizations. 26 , 35 We therefore argue that testing of IgE, IgG and perhaps of IgG subclass and eventually IgA reactivity to micro‐arrayed allergens could be especially useful for the testing of HIES patients given the fact that they mount extremely high total IgE levels which may interfere with results in other allergen‐specific test systems.
The fact, that allergen‐specific IgG responses in STAT3 patients were comparable to those observed in allergic controls whereas their allergen‐specific IgE responses was significantly lower is of interest. There are at least three mutually non‐exclusive explanations why allergen‐specific IgG responses in STAT3 patients were comparable to those observed in allergic controls whereas their allergen‐specific IgE responses were significantly lower. First, it is possible that IgE‐ but not IgG‐affinity maturation is selectively reduced in STAT3 patients as was proposed by Van de Veen et al. 21 . Second, it is possible that highIgE levels are a result of a polyclonal IgE production with unknown specificities. Alternatively, it may be considered that patients with STAT3 mutations mount IgE responses against IgE‐reactive antigens such as bacterial antigens 36 , 37 or IgE‐reactive autoantigens, 38 which were not yet represented on our micro‐array. In fact, IgE autoreactivity was detected already in the first years of life in an earlier study. 39 The fact, that patients with STAT3 mutations also experienced symptoms of eczema would indeed speak for the latter possibility because IgE autoreactivity and IgE reactivity against bacterial antigens was found especially in patients suffering from atopic dermatitis. 36 , 38
Thus we could show profound differences regarding allergen‐specific IgE‐ and IgG–recognition in STAT3 and PGM3‐deficient patients using micro‐arrayed allergen molecules suggesting that molecular profiling of HIES patients may not only explain the occurrence or lack of certain allergic symptoms but also assist in the characterization and classification of HIES and IEI with atopic phenotypes. The analysis of IgE reactivity to a comprehensive number of allergen molecules in combination with phenotypic and genetic testing including, if necessary, whole‐exome sequencing (WES) and/or whole‐genome sequencing (WGS) may help to discriminate IEI with atopic phenotypes from atopic diseases early in life and to initiate targeted forms of treatment. 4 In this context molecular diagnosis of IgE sensitizations by broad screening with a large panel of micro‐arrayed allergen molecules may help to identify IgE sensitizations which may progress to clinically relevant allergic disease and/or are already a causal factor for allergic symptoms and thus contribute to disease pathology. Based on identified IgE sensitization profiles detailed anamnesis and targeted diagnostic testing (e.g., provocation testing) can be performed to understand the clinical relevance of IgE sensitization for disease pathology and to initiate preventive and therapeutic forms of disease management.
CONFLICTS OF INTEREST
Rudolf Valenta has received research grants from Viravaxx, Vienna, Austria, HVD‐Biotech, Vienna, Austria and WORG Pharmaceuticals, Hangzhou, China. He serves as a consultant for Viravaxx. The other authors have no conflicts of interest to declare.
AUTHORS CONTRIBUTIONS
Victoria Garib performed experiments, analyzed the data, wrote and read the manuscript; Meriem Ben‐Ali treated the patients, collected the questionnaires, analyzed the data, read the manuscript; Michael Kundi performed statistical analysis of the data, revised and read the manuscript; Mirela Curin analyzed the data, wrote and read the manuscript; Roukaya Yaakoubi collected the patients’ samples and questionnaires and read the manuscript; Imen Ben‐Mustapha and Najla Mekki contributed to the clinical and immunological investigation of the patients and read the manuscript, Renate Froeschl, Thomas Perkmann performed experiments and read the manuscript; Rudolf Valenta, designed and supervised experiments, analyzed the data, wrote and read the manuscript; Mohamed‐Ridha Barbouche designed and supervised the clinical part, analyzed the data, wrote and read the manuscript.
Supporting information
Fig S1
Table S1
Table S2
Table S3
Table S4
ACKNOWLEDGMENTS
This study was supported by the country of Lower Austria and the Tunisian Ministry of Higher Education and Research (Grant LR11IPT02). We thank the clinicians who contributed to the enrollment of patients as well as the patients and their families.
Garib V, Ben‐Ali M, Kundi M, et al. Profound differences in IgE and IgG recognition of micro‐arrayed allergens in hyper‐IgE syndromes. Allergy. 2022;77:1761–1771. 10.1111/all.15143
Victoria Garib and Meriem Ben‐Ali are contributed equally.
Contributor Information
Rudolf Valenta, Email: Rudolf.valenta@meduniwien.ac.at.
Mohamed‐Ridha Barbouche, Email: ridha.barbouche@pasteur.rns.tn, Email: ridha.barbouche@laposte.net.
REFERENCES
- 1. Ozcan E, Notarangelo LD, Geha RS. Primary immune deficiencies with aberrant IgE production. J Allergy Clin Immunol. 2008;122:1054‐1062. [DOI] [PubMed] [Google Scholar]
- 2. Valenta R, Karaulov A, Niederberger V, et al. Molecular aspects of allergens and allergy. Adv Immunol. 2018;138:195‐256. [DOI] [PubMed] [Google Scholar]
- 3. Lyons JJ, Milner JD. Primary atopic disorders. J Exp Med. 2018;215(4):1009‐1022. [DOI] [PMC free article] [PubMed] [Google Scholar]
- 4. Castagnoli R, Lougaris V, Giardino G, et al. Inborn errors of immunity with atopic phenotypes: a practical guide for allergists. World Allergy Organ J. 2021;14(2):100513. doi: 10.1016/j.waojou.2021.100513 [DOI] [PMC free article] [PubMed] [Google Scholar]
- 5. Ponsford MJ, Klocperk A, Pulvirenti F, et al. Hyper‐IgE in the allergy clinic–when is it primary immunodeficiency? Allergy. 2018;73(11):2122‐2136. [DOI] [PubMed] [Google Scholar]
- 6. Fadil I, Ben‐Ali M, Jeddane L, Barbouche MR, Bousfiha AA. The seven STAT3‐related hyper‐IgE syndromes. J Clin Immunol. 2021;41(6):1384‐1389. [DOI] [PubMed] [Google Scholar]
- 7. Tangye SG, Al‐Herz W, Bousfiha A, et al. Human inborn errors of immunity: 2019 update on the classification from the international union of immunological societies expert committee. J Clin Immunol. 2020;40(1):24‐64. [DOI] [PMC free article] [PubMed] [Google Scholar]
- 8. Davis SD, Schaller J, Job's WRJ, Harvard MD. Job's syndrome. Lancet. 1966;287(7445):1013‐1015. [DOI] [PubMed] [Google Scholar]
- 9. Ishizaka K, Ishizaka T, Hornbrook MM. Physico‐chemical properties of human reaginic antibody. IV. Presence of a unique immunoglobulin as a carrier of reaginic activity. J Immunol. 1966;97:75‐85. [PubMed] [Google Scholar]
- 10. Grimbacher B, Holland SM, Gallin JI, et al. Hyper‐IgE syndrome with recurrent infections—an autosomal dominant multisystem disorder. N Engl J Med. 1999;340:692‐702. [DOI] [PubMed] [Google Scholar]
- 11. Minegishi Y, Saito M, Tsuchiya S, et al. Dominant negative mutations in the DNA‐binding domain of STAT3 cause hyper‐IgE syndrome. Nature. 2007;30(448):1058‐1062. [DOI] [PubMed] [Google Scholar]
- 12. Holland SM, DeLeo FR, Elloumi HZ, et al. STAT3 mutations in the hyper‐IgE syndrome. N Engl J Med. 2007;357:1608‐1619. [DOI] [PubMed] [Google Scholar]
- 13. Renner ED, Torgerson TR, Rylaarsdam S, et al. STAT3 mutation in the original patient with Job's syndrome. N Engl J Med. 2007;18(357):1667‐1668. [DOI] [PubMed] [Google Scholar]
- 14. Tsilifis C, Freeman AF, Gennery AR. STAT3 hyper‐IgE syndrome‐an update and unanswered questions. J Clin Immunol. 2021;41(5):864‐880. [DOI] [PMC free article] [PubMed] [Google Scholar]
- 15. Pelham SJ, Lenthall HC, Deenick EK, Tangye SG. Elucidating the effects of disease causing mutations on STAT3 function in autosomal‐dominant hyper‐IgE syndrome. J Allergy Clin Immunol. 2016;138:1210‐1213. doi: 10.1016/j.jaci.2016.04.020. [DOI] [PubMed] [Google Scholar]
- 16. Sassi A, Lazaroski S, Wu G, et al. Hypomorphic homozygous mutations in phosphoglucomutase 3 (PGM3) impair immunity and increase serum IgE levels. J Allergy Clin Immunol. 2014;133:1410‐1419. [DOI] [PMC free article] [PubMed] [Google Scholar]
- 17. Ben‐Khemis L, Mekki N, Ben‐Mustapha I, et al. A founder mutation underlies a severe form of phosphoglutamase 3 (PGM3) deficiency in Tunisian patients. Mol Immunol. 2017;90:57‐63. [DOI] [PubMed] [Google Scholar]
- 18. Ben‐Ali M, Ben‐Khemis L, Mekki N, et al. Defective glycosylation leads to defective gp130‐dependent STAT3 signaling in PGM3‐deficient patients. J Allergy Clin Immunol. 2019;143:1638‐1640. [DOI] [PubMed] [Google Scholar]
- 19. Lawrence MG. Patterns of allergic sensitization in high IgE syndrome. Curr Allergy Asthma Rep. 2015;15:70. [DOI] [PubMed] [Google Scholar]
- 20. Siegel AM, Stone KD, Cruse G, et al. Diminished allergic disease in patients with STAT3 mutations reveals a role for STAT3 signaling in mast cell degranulation. J Allergy Clin Immunol. 2013;132:1388‐1396. [DOI] [PMC free article] [PubMed] [Google Scholar]
- 21. Veen W, Krätz CE, McKenzie CI, et al. Impaired memory B‐cell development and antibody maturation with a skewing toward IgE in patients with STAT3 hyper‐IgE syndrome. Allergy. 2019;74:2394‐2405. doi: 10.1111/all.13969 [DOI] [PubMed] [Google Scholar]
- 22. Boos AC, Hagl B, Schlesinger A, et al. Atopic dermatitis, STAT3‐ and DOCK8‐hyper‐IgE syndromes differ in IgE‐based sensitization pattern. Allergy. 2014;69:943‐953. [DOI] [PubMed] [Google Scholar]
- 23. Hiller R, Laffer S, Harwanegg C, et al. Microarrayed allergen molecules: diagnostic gatekeepers for allergy treatment. FASEB J. 2002;16:414‐416. [DOI] [PubMed] [Google Scholar]
- 24. Lupinek C, Wollmann E, Baar A, et al. Advances in allergen‐microarray technology for diagnosis and monitoring of allergy: the MeDALL allergen‐chip. Methods. 2014;66(1):106‐119. [DOI] [PMC free article] [PubMed] [Google Scholar]
- 25. Siroux V, Lupinek C, Resch Y, et al. Specific IgE and IgG measured by the MeDALL allergen‐chip depend on allergen and route of exposure: the EGEA study. J Allergy Clin Immunol. 2017;139:643‐654. [DOI] [PubMed] [Google Scholar]
- 26. Skrindo I, Lupinek C, Valenta R, et al. The use of the MeDALL‐chip to assess IgE sensitization: a new diagnostic tool for allergic disease? Pediatr Allergy Immunol. 2015;26:239‐246. [DOI] [PMC free article] [PubMed] [Google Scholar]
- 27. Zennaro D, Scala E, Pomponi D, et al. Proteomics plus genomics approaches in primary immunodeficiency: the case of immune dysregulation, polyendocrinopathy, enteropathy, X‐linked (IPEX) syndrome. Clin Exp Immunol. 2012;167:120‐128. [DOI] [PMC free article] [PubMed] [Google Scholar]
- 28. Asher MI, Keil U, Anderson HR, et al. International study of asthma and allergies in Childhood (ISAAC) rationale and methods. Eur Respir J. 1995;8:83‐491. [DOI] [PubMed] [Google Scholar]
- 29. Nakamura R, Uchida Y, Higuchi M, et al. A convenient and sensitive allergy test: IgE crosslinking‐induced luciferase expression in cultured mast cells. Allergy. 2010;65:1266‐1273. [DOI] [PMC free article] [PubMed] [Google Scholar]
- 30. Rodríguez‐Domínguez A, Berings M, Rohrbach A, et al. Molecular profiling of allergen‐specific antibody responses may enhance success of specific immunotherapy. J Allergy Clin Immunol. 2020;146:1097‐1108. [DOI] [PubMed] [Google Scholar]
- 31. Hartl A, Hochreiter R, Stepanoska T, Ferreira F, Thalhamer J. Characterization of the protective and therapeutic efficiency of a DNA vaccine encoding the major birch pollen allergen Bet v 1a. Allergy. 2004;59:65‐73. [DOI] [PubMed] [Google Scholar]
- 32. Kulig M, Bergmann R, Klettke U, Wahn V, Tacke U, Wahn U. Natural course of sensitization to food and inhalant allergens during the first 6 years of life. J Allergy Clin Immunol. 1999;103:1173‐1179. [DOI] [PubMed] [Google Scholar]
- 33. Hagl B, Heinz V, Schlesinger A, et al. Key findings to expedite the diagnosis of hyper‐IgE syndromes in infants and young children. Pediatr Allergy Immunol. 2016;27:177‐184. doi: 10.1111/pai.12512 [DOI] [PubMed] [Google Scholar]
- 34. Campana R, Moritz K, Marth K, et al. Frequent occurrence of T cell‐mediated late reactions revealed by atopy patch testing with hypoallergenic rBet v 1 fragments. J Allergy Clin Immunol. 2016;137(2):601‐609.e8. doi: 10.1016/j.jaci.2015.08.042 [DOI] [PMC free article] [PubMed] [Google Scholar]
- 35. Lupinek C, Hochwallner H, Johansson C, et al. Maternal allergen‐specific IgG might protect the child against allergic sensitization. J Allergy Clin Immunol. 2019;144:536‐548. [DOI] [PMC free article] [PubMed] [Google Scholar]
- 36. Reginald K, Westritschnig K, Linhart B, et al. Staphylococcus aureus fibronectin‐binding protein specifically binds IgE from patients with atopic dermatitis and requires antigen presentation for cellular immune responses. J Allergy Clin Immunol. 2011;128:82‐91. [DOI] [PubMed] [Google Scholar]
- 37. Dzoro S, Mittermann I, Resch‐Marat Y, et al. House dust mites as potential carriers for IgE sensitization to bacterial antigens. Allergy. 2018;73:115‐124. [DOI] [PMC free article] [PubMed] [Google Scholar]
- 38. Natter S, Seiberler S, Hufnagl P, et al. Isolation of cDNA clones coding for IgE autoantigens with serum IgE from atopic dermatitis patients. FASEB J. 1998;12:1559‐1569. [DOI] [PubMed] [Google Scholar]
- 39. Mothes N, Niggemann B, Jenneck C, et al. The cradle of IgE autoreactivity in atopic eczema lies in early infancy. J Allergy Clin Immunol. 2005;116:706‐709. [DOI] [PubMed] [Google Scholar]
Associated Data
This section collects any data citations, data availability statements, or supplementary materials included in this article.
Supplementary Materials
Fig S1
Table S1
Table S2
Table S3
Table S4