

Abstract
Background
Various clinical studies have provided estimates of life expectancy of patients with mild cognitive impairment (MCI) from outpatient clinics, but whether these apply to community‐dwelling individuals at home or in primary care is uncertain.
Methods
Within the population‐based Rotterdam Study, we studied life expectancy with and without dementia in 648 community‐dwelling persons with MCI and 6410 without MCI. Participants aged 60 years and older were assessed for MCI at baseline (2002–2014) and subsequently followed for the onset of dementia and death. We used multistate life tables to determine age‐specific life expectancy with and without dementia by sex, educational attainment, and MCI subtype.
Results
Total life expectancy for MCI ranged from 21.4 years (95% CI: 19.0–23.6) at age 60 to 2.6 years (1.6–3.6) at age 95. With advancing age, an increasing proportion of these years was lived with dementia (2.9 years [1.8–4.0] at age 60; 1.2 [0.2–2.2] at age 95). Women and higher educated individuals lived longer and lived more years with dementia. No differences in total life expectancy were observed by MCI subtype, although individuals with amnestic MCI lived a larger proportion of those years with dementia.
Conclusions
Prognosis of MCI, in terms of life years lived with and without dementia, is more favorable in the general population than described in prior clinical observations, due likely to a substantial proportion of individuals with MCI in the clinic not seeking medical attention in an earlier stage.
Keywords: dementia, education, life expectancy, mild cognitive impairment, multistate model
1. Key Points
Persons with MCI in the general population live shorter than persons without MCI.
Remaining life expectancy and years lived with dementia vary with age, sex, education, and MCI subtype.
2. Why Does this Paper Matter?
This study provides estimates of prognosis that could be valuable for persons with MCI and their caregivers.
INTRODUCTION
Mild cognitive impairment (MCI) is recognized as a transitional phase between a cognitively healthy state and dementia. 1 Due to the aging of the population and increasing life expectancy, a growing number of individuals in the community have some degree of cognitive impairment. The underlying cognitive complaints are often insufficient for a clinical diagnosis of dementia, yet do hinder cognitive functioning or instrumental activities of daily living. However, most information on the prognosis of MCI is derived from patients in referral centers and specialized memory clinics, 2 , 3 , 4 whose disease courses may not be generalizable to community‐dwelling persons with MCI. Indeed, the reported conversion from MCI to dementia varies substantially, from <5% to 20% per year depending on study setting and the applied criteria for MCI, 5 , 6 , 7 with higher conversion rates in clinical populations than those in community‐dwelling samples. With growing awareness of the need for early diagnosis of neurodegenerative disease, primary care physicians have an increasingly important role in detection, counseling, and management of individuals with cognitive impairment, and as such measures of prognosis derived from the general population are invaluable. 7 , 8 , 9 In that context, easily interpretable measures in terms of life expectancies may be more helpful for risk communication to patients and their caregivers than transition rates.
Earlier studies investigated life expectancies for individuals with MCI in clinic‐based settings, generally showing that life expectancy was decreased in comparison with the general population and increased in comparison with persons with dementia. 2 , 4 , 10 Prognostic measures in terms of life expectancy for individuals with MCI in the general population distinguishing years with and without dementia and stratified by key risk factors are lacking. Estimates stratified by age, sex, educational attainment, and MCI subtype will be informative for more precise risk communications, as those factors are thought to influence prognosis. 3 , 6 , 11
In this population‐based cohort study, we therefore aimed at determining age‐specific life expectancies in individuals with MCI, distinguishing years lived with and without dementia, stratified by sex, educational attainment, and MCI subtype. In addition, we estimated years of life lost for individuals with MCI by comparing them to similarly aged cognitively healthy individuals.
METHODS
Study population
This study is embedded within the Rotterdam Study, a population‐based cohort in the Netherlands that started recruitment in 1990. 12 The first recruitment wave of participants, all aged ≥55 years, consisted of 7983 inhabitants of Ommoord, a district in Rotterdam. A second wave of recruitment started in 2000, during which 3011 participants who had reached age 55 or moved into the study area were added to the cohort, followed by a third recruitment wave in 2006, adding 3932 individuals aged 45 years and older. The design of the Rotterdam Study has been described in detail previously. 12 Follow‐up examinations at the research center are ongoing and take place every 4–6 years. In‐depth neuropsychological assessment at the research center was incorporated in the core protocol of the Rotterdam Study from 2002 onwards. This study includes all dementia‐free patients aged 60 years and over who underwent routine neuropsychological assessment from 2002 onwards. Participants were continuously followed for dementia incidence as described below.
The Rotterdam Study has been approved by the Medical Ethics Committee of the Erasmus MC University Medical Center, according to the Population Study Act, as executed by the Dutch Ministry of Health, Welfare and Sport. Written informed consent was obtained from all participants.
MCI assessment
MCI was defined using the following criteria, based on the following criteria by Petersen et al.: 13 (1) the presence of subjective cognitive complaints, (2) the presence of objective cognitive impairment, and (3) the absence of dementia, according to the assessment as described below. 14 Subjective cognitive complaints were assessed by interview, by asking three questions regarding memory complaints (difficulty remembering, forgetting what one had planned to do and difficulty finding words) and three questions regarding (instrumental) daily functioning (difficulty managing finances, problems using the telephone, and difficulty getting dressed). One confirmative answer to any of these questions was considered a subjective cognitive complaint. Objective cognitive impairment was determined using a cognitive test battery comprised of letter‐digit substitution task, Stroop test, verbal fluency test, and 15‐word verbal learning test based on Rey's recall of words. 14 Test results were summarized by compound scores for various cognitive domains including memory function, information‐processing speed, and executive function. 15 Persons were classified as having MCI if they (1) had at least one of the aforementioned subjective cognitive complaints, (2) scored below 1.5 SD of the age and education adjusted means for one the compound scores of the study population that underwent the first neuropsychiatric test battery, and (3) were free from dementia at time of test assessment. MCI was subdivided into amnestic or non‐amnestic MCI. Amnestic MCI was defined as having an impaired test score on memory function, irrespective of scores on other cognitive domains. Non‐amnestic MCI was defined as having an impaired test score on executive function or information‐processing speed, in the absence of objective memory impairment. 14 In order to compare life expectancy estimates to cognitively healthy participants, we identified a group of participants that did not meet the criteria for MCI or dementia that underwent the same wave of cognitive exams.
Dementia assessment
Participants were screened for dementia at baseline and at follow‐up examinations. 16 Screening was performed using the Mini‐Mental State Examination (MMSE) and the Geriatric Mental Schedule (GMS) organic level. Participants with a positive screening (MMSE <26 or GMS >0) subsequently underwent an examination and informant interview with the Cambridge Examination for Mental Disorders in the Elderly. 16 Participants who were suspected of having dementia underwent extra neuropsychological testing if necessary. In addition, the total cohort was continuously monitored for dementia through computerized linkage of the study database and digitized medical records from general practitioners, who serve as gatekeepers to the Dutch healthcare system and therefore receive all relevant medical information from all caregivers of their patients, and the Regional Institute for Outpatient Mental Health Care. Ultimately, a consensus panel, led by a neurologist, decided on the final diagnosis in accordance with standard criteria for dementia (DSM‐III‐R). 16
Mortality assessment
The records of the municipal administration of Rotterdam, general practitioners' files, and nursing home files were continuously evaluated to obtain information on the participants' vital status.
Covariates
Educational attainment was assessed at study entry and subdivided into three categories: primary education, further education, and higher education. History of smoking (i.e., current, former, or never smoker) was surveyed at the same moment as MCI assessment. Blood pressure was measured in a sitting position on the right arm using a random‐zero sphygmomanometer, and the average of two measurements was used. Body mass index (BMI) was calculated as weight in kilograms divided by height in meters squared. Serum total cholesterol, high‐density lipoprotein cholesterol, and glucose were acquired from blood samples at baseline. The use of blood glucose‐lowering medication at baseline or a fasting serum glucose level ≥ 7.0 mmol/L (126 mg/dl), or a nonfasting serum glucose level ≥ 11.1 mmol/L (200 mg/dl) was considered as type II diabetes. APOE genotype was determined using polymerase chain reaction on coded DNA samples for the original cohort, and using biallelic TaqMan assays (TaqMan Gene Expression Assays; Thermo Fisher Scientific, Waltham, Massachusetts) (rs7412 and rs429358) for the expansion cohorts. 17 , 18
Statistical analysis
We calculate the number of years lived with and without dementia using multistate lifetables. Three states were defined, namely, no dementia, dementia, and deceased, between which unidirectional transitions were allowed (i.e., (1) from no dementia to dementia, (2) from no dementia to deceased, and (3) from dementia to deceased). Age‐specific rates for these transitions were calculated using Gompertz regression. We determined hazard ratios (HRs) for incident dementia and death comparing women to men, participants with further and higher education to those with primary education only, and participants with amnestic MCI to participants with non‐amnestic MCI, using the Gompertz regression. To provide valid estimates of life expectancy across the stratified populations, all HRs were adjusted for birth year. In addition, HRs for education and MCI subtype were additionally adjusted for APOE ε4 carrier status. For individuals without MCI, the same approach was used to calculate age‐specific total life expectancy. Missing values were imputed for the main analysis, using single imputation with age and sex as predictors. For the stratified analyses, missing data on education (1% both in the group of individuals with MCI and without MCI) were not imputed.
We then constructed multistate lifetables for participants with and without MCI, starting at age 60 and ending at age 100. Transition rates were calculated separately for men and women, as well as for each group of educational attainment and MCI subtype, respectively. To do so, we weighted the overall rates according to (1) the aforementioned HRs and (2) the prevalence of each category per 10‐year age band by cognitive status (e.g., prevalence of men among all participants aged 60–70 years, with MCI). We calculated the percentage of life years lived with dementia by dividing the expected years lived with dementia by the total remaining life expectancy, for both cognitively healthy individuals and those with MCI. The number of life years lost was calculated as the difference between age‐specific life expectancy of cognitively healthy individuals and individuals with MCI.
Monte Carlo simulation (parametric bootstrapping) with 10,000 runs was applied using @RISK 8.1, to calculate the confidence intervals of the life expectancy estimation. Data preparation was carried out in R 3.6.1. Analyses were performed using Microsoft Excel 2016 (Microsoft Corp, Redmond, Washington) and Stata version 14.1 (StataCorp LLC, College Station, TX).
RESULTS
Study population
Of 10,047 persons who participated in the Rotterdam Study between 2002 and 2014, 7111 had a complete MCI assessment, of whom 655 (9%) met the criteria for MCI (flow diagram in Figure S1). After excluding participants without follow‐up time after the MCI assessment, 648 participants with MCI and 6410 without MCI remained (baseline characteristics in Table 1). Characteristics of participants by the subtype of MCI are shown in Table S1 and a comparison of included participants with excluded participants in Table S2. Compared to individuals without MCI, those with MCI were older, more often men, had lower education, and more often had diabetes or stroke in their medical history.
TABLE 1.
Baseline characteristics of the study population
| Characteristic | Mild cognitive impairment | No mild cognitive impairment |
|---|---|---|
| N | 648 | 6410 |
| Age at study entry a | 71.7 (65.0–78.1) | 67.8 (63.4–74.9) |
| Women | 349 (53.9) | 3683 (57.5) |
| Education | ||
| Primary education | 120 (18.7) | 654 (10.3) |
| Further education | 441 (68.6) | 4589 (72.4) |
| Higher education | 82 (12.8) | 1095 (17.3) |
| APOE genotype | ||
| ε4 noncarrier | 410 (68.6) | 4383 (72.9) |
| ε4 carrier | 188 (31.4) | 1628 (27.1) |
| Smoking status | ||
| Never smoker | 174 (27.9) | 1997 (31.8) |
| Former smoker | 310 (49.8) | 3185 (50.7) |
| Current smoker | 139 (22.3) | 1106 (17.6) |
| Type 2 diabetes | 100 (16.4) | 672 (10.8) |
| History of stroke | 68 (10.5) | 228 (3.6) |
| Systolic blood pressure, mmHg | 148 (22) | 148 (21) |
| Diastolic blood pressure, mmHg | 80 (11) | 81 (11) |
| Body mass index, kg/m2 | 28.1 (4.3) | 27.7 (4.2) |
| Serum total cholesterol, mmol/L | 5.41 (1.03) | 5.61 (1.01) |
| Serum high‐density lipoprotein cholesterol, mmol/L | 1.41 (0.40) | 1.47 (0.40) |
| MMSE, score a | 28 (25–29) | 28 (26–29) |
| Subjective cognitive complaints | 648 (100) | 3771 (58.8) |
| Objective cognitive impairment | 648 (100) | 43 (0.7) |
| Amnestic mild cognitive impairment | 243 (37.5) | ‐ |
Note: Characteristics of the study population at baseline for participants with and without mild cognitive impairment. Values are counts (%) or means (standard deviation), unless specified differently.
Abbreviations: APOE, apolipoprotein E; MMSE, Mini‐Mental State Examination.
Values expressed as median (interquartile range).
During a median follow‐up of 6.8 years (IQR: 3.3–10.6), 136 (21%) of the 648 participants with MCI developed dementia, and 293 (45%) died (of whom 95 with dementia). Among the 6410 participants without MCI (median follow‐up 8.4 years [4.2–11.0]), 442 (7%) participants developed dementia and 1556 died (24%) (of whom 264 with dementia).
Life expectancy for individuals with MCI
The life expectancy for participants with MCI ranged from 21.3 years (95% CI: 19.0–23.6) at age 60 to 2.6 years (1.6–3.6) at age 95. Of those years, 2.9 years (1.8–4.0), corresponding to 14%, and 1.2 years (0.2–2.2), corresponding to 46%, were lived with dementia. Individuals with MCI lived shorter than individuals without MCI, with 5.0 years of life lost (95% CI: 1.9–8.1) for persons aged 60, although with higher age, this difference became smaller. Estimates of life expectancy, years lived with dementia, and years of life lost, for persons aged 70, 80, and 90 years are presented in Table S3. Stratified results by sex, educational attainment, and MCI subtype are presented below for a person aged 70 years.
Sex
Women, both with or without MCI, were at higher risk of dementia than men, and at lower risk of death (hazard ratios (HRs) are shown in Table 2). At age 70, women with MCI had a life expectancy of 15.4 years (95% CI: 13.2–17.6) and men with MCI had a life expectancy of 12.2 years (95% CI: 9.9–14.5). Women with MCI lived a larger number of those years with dementia than men with MCI (3.8 years [95% CI: 2.3–5.3] vs. 2.0 [95% CI: 0.9–3.1]), and this difference increased with age (Figure 1). The years of life lost compared to persons without MCI were similar for women and men.
TABLE 2.
Risk of conversion for individuals with and without mild cognitive impairment by sex, educational attainment, and mild cognitive impairment subtype
| Transition | Mild cognitive impairment | No mild cognitive impairment |
|---|---|---|
| Hazard ratio (95% CI) | Hazard ratio (95% CI) | |
| Sex (reference = men) a | ||
| Transition to dementia | 1.20 (0.85–1.71) | 1.02 (0.84–1.24) |
| Death without dementia | 0.53 (0.40–0.71) | 0.55 (0.49–0.61) |
| Death with dementia | 0.62 (0.41–0.95) | 0.73 (0.57–0.93) |
| Further education (reference = primary education) b | ||
| Transition to dementia | 1.38 (0.87–2.19) | 0.83 (0.64–1.08) |
| Death without dementia | 0.99 (0.69–1.44) | 0.88 (0.75–1.03) |
| Death with dementia | 0.99 (0.57–1.74) | 1.54 (1.08–2.20) |
| Higher education (reference = primary education) b | ||
| Transition to dementia | 1.88 (0.96–3.66) | 0.67 (0.45–0.99) |
| Death without dementia | 0.81 (0.45–1.48) | 0.75 (0.60–0.94) |
| Death with dementia | 0.87 (0.36–2.08) | 0.95 (0.54–1.69) |
| MCI subtype (reference = non‐amnestic MCI) b | ||
| Transition to dementia | 1.53 (1.07–2.19) | ‐ |
| Death without dementia | 0.81 (0.59–1.10) | ‐ |
| Death with dementia | 1.13 (0.74–1.74) | ‐ |
Note: Cox proportional hazard models for the transition to dementia, death, and death after dementia among participants with and without mild cognitive impairment at baseline.
Abbreviations: CI, confidence interval; MCI, mild cognitive impairment.
Adjusted for birth year.
Adjusted for birth year, sex, and APOE ε4 status.
FIGURE 1.
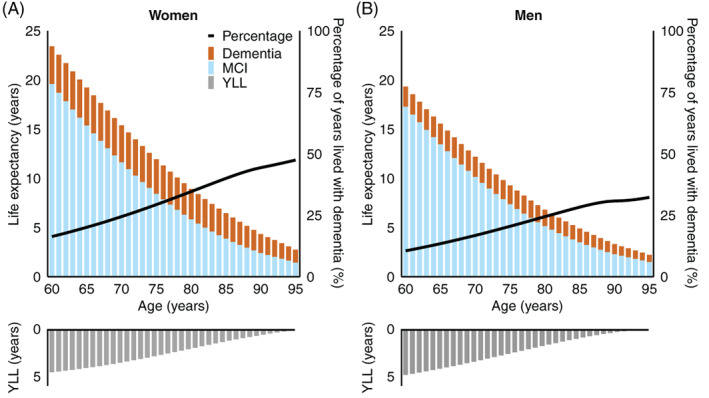
Life expectancy with and without dementia among women (A) and men (B) with mild cognitive impairment. The bars in the lower panel represent the number of lived years lost compared to participants without mild cognitive impairment of similar age and sex. The percentage of years lived with dementia out of the total remaining life expectancy is represented by the black line, corresponding to the right axis. MCI, mild cognitive impairment; YLL, years of life lost
Educational attainment
Participants with MCI and further or higher education were at (nonsignificantly) higher risk of developing dementia than participants with MCI with primary education (Table 2). Conversely, among participants without MCI, higher education was associated with a lower risk of dementia. The life expectancy was higher for individuals with MCI and higher education than for individuals with MCI and further or lower education, but a larger share of these years was lived with dementia (4.1 years [95% CI: 3.7–4.5] for persons with higher education versus 2.9 [2.6–3.2] and 2.3 [2.0–2.5] years with further and primary education; Figure 2). Higher educated participants with MCI also lost more years of life compared to participants without MCI (at age 70: 4.6 years [95% CI: 3.9–5.2]) than participants with further (3.8 [3.2–4.3]) or primary education (2.9 [2.3–3.5]; Figure 2).
FIGURE 2.

Life expectancy with and without dementia among participants with primary (A), further (B), and higher education (C) with mild cognitive impairment. The bars in the lower panel represent the number of lived years lost compared to participants without mild cognitive impairment of similar age and educational attainment. The percentage of years lived with dementia out of the total remaining life expectancy is represented by the black line, corresponding to the right axis. MCI, mild cognitive impairment; YLL, years of life lost
Amnestic and non‐amnestic MCI
Amnestic MCI was associated with a higher risk of dementia than non‐amnestic MCI (Table 2). Consequently, participants with amnestic MCI lived a larger share of their life expectancy with dementia (at age 70: 3.4 years [95% CI: 1.9–5.0], corresponding to 25% vs. 2.6 years [95% CI: 1.4–3.8; 19%]; Figure 3). The total life expectancy did not differ with MCI subtype.
FIGURE 3.

Life expectancy with and without dementia among participants with amnestic mild cognitive impairment (A) and with non‐amnestic mild cognitive impairment (B). The percentage of years lived with dementia out of the total remaining life expectancy is represented by the black line, corresponding to the right axis. MCI, mild cognitive impairment
DISCUSSION
We found that individuals with MCI aged 60 years and older had lower remaining life expectancy than individuals without MCI of similar age. Of the remaining life expectancy, the proportion of years that was lived with dementia varied from 14% (2.9 of 21.4 years) at age 60 to 46% (1.2 of 2.6 years) at age 95. These results show a more favorable prognosis for individuals with MCI than previous studies based on data from memory clinics.
While many studies have examined conversion rates of MCI to dementia, few studies provide estimates of disease duration for individuals with MCI. Most existing estimates derive from specialized memory clinics, with different population characteristics and a higher rate of conversion to dementia than the general population. 5 For instance, a study using data from outpatient clinics in Norway found a remaining life expectancy of 9.2 years for men aged 70 years with MCI and 9.5 for women, compared to 12.2 and 15.4 in the current study. 10 Another study among participants with evidence of amyloid accumulation drawn from both clinic‐based and research‐based cohorts confirmed a less favorable prognosis for participants in a clinical setting. 2 However, even participants with MCI from research‐based cohorts were expected to live more than half of their remaining life expectancy with dementia (8 out of 14 years for a person aged 70 years, vs. 4 out of 14 in the current study). As the authors acknowledged, they may have overestimated total life expectancies because mortality had not been checked systematically in all of the included cohorts. The difference between their findings and ours may further be explained by differences in study population characteristics and underlying pathology. For example, their participants all had evidence of amyloid accumulation and included more than twice as many carriers of the APOE ε4 allele (31% vs. 66%). This contrast further indicates that prognostic estimates from a more unselected population are needed to inform persons with MCI in the general population. In this study, we provide prognostic estimates applicable to a scenario where community‐dwelling older adults are screened for MCI.
We found that among individuals with MCI, individuals with higher education lived more years with dementia compared to individuals with lower education. Conversely, among individuals without MCI, those with further and higher education had a longer life expectancy, of which fewer life years were lived with dementia. This supports the hypothesis that by the time that symptoms arise, those with a higher educational attainment have exhausted their cognitive reserve and have a worse prognosis due to a greater degree of neuropathology. 19 In line with our findings, it was previously reported that higher education is related to a longer noncognitively impaired life expectancy and fewer years as cognitively impaired. 3 It has even been suggested to adapt criteria and cutoff values for the detection of MCI in persons with higher education. 20
Our results show that individuals with amnestic and non‐amnestic MCI have similar total life expectancy. As expected, individuals with amnestic MCI lived a larger share of their remaining life with dementia. The two subtypes of MCI may reflect different underlying mechanisms, and patients with non‐amnestic MCI have a greater probability of reverting to normal cognition. 21 MCI due to underlying neurodegenerative processes, predominantly manifesting as amnestic MCI, usually remains present and leads to more long‐term cognitive decline. 22 In contrast, individuals with MCI due to other causes, such as an underlying medical illness or medication, predominantly manifesting as non‐amnestic MCI, may show less cognitive decline over time. 23
Strengths of this study include the standardized assessment of MCI, the near‐complete follow‐up for dementia, and the population‐based design that enabled us to provide estimates for persons with MCI in the community, which may more closely resemble the population in primary care. However, by routinely examining individuals for MCI, we may have identified MCI at an even earlier stage than in primary care, potentially resulting in an overestimation of life expectancy for individuals by the time they seek medical care. Second, we were unable to determine the etiology of MCI or the duration of MCI at the moment of examination, which could be valuable information to improve prognostic estimates. Thirdly, we did not take reversion to normal cognition into account in our models. This is not necessarily a limitation for perusal of our estimates because in clinical practice at time of consultation, it is also unknown whether the patient will revert, convert, or remain stable. Finally, prognostic estimates depend on the criteria used for MCI assessment and population characteristics like educational attainment, 20 , 24 , 25 , 26 and possibly comorbidities and systemic factors that were outside the scope of this article, which may hamper generalizability to other populations. Generalizability is also limited due to a lack of racial diversity, as the Rotterdam Study population is predominantly White.
CONCLUSION
Prognosis of MCI, in terms of life years lived with and without dementia, is more favorable in the general population compared to prior clinical observations, due likely to a substantial proportion of individuals not seeking medical attention at an earlier stage of MCI. These findings call for better predictions of prognosis for the growing number of older patients with cognitive impairment in primary care.
CONFLICT OF INTEREST
The authors have no conflicts of interest.
AUTHOR CONTRIBUTIONS
Sanne S. Mooldijk, Amber Yaqub, and M. Arfan Ikram contributed to the study concept and design. Peter J. Koudstaal and M. Kamran Ikram carried out the data acquisition. Sanne S. Mooldijk and Amber Yaqub helped with data analysis. Sanne S. Mooldij, Amber Yaqub, Frank J. Wolters, Silvan Licher, Peter J. Koudstaal, M. Kamran Ikram, and M. Arfan Ikram performed data interpretation. Sanne S. Mooldijk and Amber Yaqub drafted the manuscript. Frank J. Wolters, Silvan Licher, Peter J. Koudstaal, M. Kamran Ikram, and M. Arfan Ikram critically revised the manuscript.
SPONSOR'S ROLE
The funders had no role in the design and conduct of the study; collection, management, analysis, and interpretation of the data; the writing of the report; and the decision to submit the article for publication.
Supporting information
Figure S1. Flow diagram of the study population
Table S1. Baseline characteristics by mild cognitive impairment (MCI) subtype
Table S2. Characteristics of eligible participants who were included versus who were not included in the study
Table S3. Life expectancy with and without dementia at age 70, 80, and 90
ACKNOWLEDGMENTS
The contributions of the study participants, the staff from the Rotterdam Study, and the participating general practitioners and pharmacists are gratefully acknowledged. The Rotterdam Study is supported by the Erasmus MC University Medical Center and Erasmus University Rotterdam; The Netherlands Organization for Scientific Research (NWO); The Netherlands Organization for Health Research and Development (ZonMw); the Research Institute for Diseases in the Elderly (RIDE); The Netherlands Genomics Initiative (NGI); the Ministry of Education, Culture and Science; the Ministry of Health, Welfare and Sports; the European Commission (DG XII); and the Municipality of Rotterdam. This study was partly performed as part of the Netherlands Consortium of Dementia Cohorts (NCDC), which receives funding in the context of Deltaplan Dementie from ZonMW Memorabel (Project Number 73305095005) and Alzheimer Nederland.
Mooldijk SS, Yaqub A, Wolters FJ, et al. Life expectancy with and without dementia in persons with mild cognitive impairment in the community. J Am Geriatr Soc. 2022;70(2):481-489. doi: 10.1111/jgs.17520
Sanne S. Mooldijk and Amber Yaqub contributed equally to this work.
Preliminary results of this manuscript have been presented as an ePoster at the Alzheimer's Association International Conference 2020. Otherwise, we confirm that this manuscript has not been and will not be submitted, in part of entirety, elsewhere for publication.
Funding information Alzheimer Nederland; ZonMW Memorabel, Grant/Award Number: 73305095005; Municipality of Rotterdam; European Commission (DG XII); Ministry of Health, Welfare and Sports; Ministry of Education, Culture and Science; The Netherlands Genomics Initiative (NGI); Research Institute for Diseases in the Elderly (RIDE); The Netherlands Organization for Health Research and Development (ZonMw); The Netherlands Organization for Scientific Research (NWO); Erasmus University Rotterdam; Erasmus MC University Medical Center
REFERENCES
- 1. Petersen RC, Smith GE, Waring SC, Ivnik RJ, Tangalos EG, Kokmen E. Mild cognitive impairment: clinical characterization and outcome. Arch Neurol. 1999;56(3):303‐308. [DOI] [PubMed] [Google Scholar]
- 2. Vermunt L, Sikkes SAM, van den Hout A, et al. Duration of preclinical, prodromal, and dementia stages of Alzheimer's disease in relation to age, sex, and APOE genotype. Alzheimers Dement. 2019;15(7):888‐898. [DOI] [PMC free article] [PubMed] [Google Scholar]
- 3. Robitaille A, van den Hout A, Machado RJM, et al. Transitions across cognitive states and death among older adults in relation to education: a multistate survival model using data from six longitudinal studies. Alzheimers Dement. 2018;14(4):462‐472. [DOI] [PMC free article] [PubMed] [Google Scholar]
- 4. Rhodius‐Meester HFM, Tijms BM, Lemstra AW, et al. Survival in memory clinic cohort is short, even in young‐onset dementia. J Neurol Neurosurg Psychiatry. 2019;90(6):726‐728. [DOI] [PMC free article] [PubMed] [Google Scholar]
- 5. Farias ST, Mungas D, Reed BR, Harvey D, DeCarli C. Progression of mild cognitive impairment to dementia in clinic‐ vs community‐based cohorts. Arch Neurol. 2009;66(9):1151‐1157. [DOI] [PMC free article] [PubMed] [Google Scholar]
- 6. Plassman BL, Langa KM, Fisher GG, et al. Prevalence of cognitive impairment without dementia in the United States. Ann Intern Med. 2008;148(6):427‐434. [DOI] [PMC free article] [PubMed] [Google Scholar]
- 7. Langa KM, Levine DA. The diagnosis and management of mild cognitive impairment: a clinical review. JAMA. 2014;312(23):2551‐2561. [DOI] [PMC free article] [PubMed] [Google Scholar]
- 8. Sabbagh MN, Boada M, Borson S, et al. Rationale for early diagnosis of mild cognitive impairment (MCI) supported by emerging digital technologies. J Prev Alzheimers Dis. 2020;7(3):158‐164. [DOI] [PubMed] [Google Scholar]
- 9. Bianchetti A, Ferrara N, Padovani A, Scarpini E, Trabucchi M, Maggi S. Timely detection of mild cognitive impairment in Italy: an expert opinion. J Alzheimers Dis. 2019;68(4):1401‐1414. [DOI] [PubMed] [Google Scholar]
- 10. Strand BH, Knapskog AB, Persson K, et al. Survival and years of life lost in various aetiologies of dementia, mild cognitive impairment (MCI) and subjective cognitive decline (SCD) in Norway. PLoS One. 2018;13(9):e0204436. [DOI] [PMC free article] [PubMed] [Google Scholar]
- 11. Campbell NL, Unverzagt F, LaMantia MA, Khan BA, Boustani MA. Risk factors for the progression of mild cognitive impairment to dementia. Clin Geriatr Med. 2013;29(4):873‐893. [DOI] [PMC free article] [PubMed] [Google Scholar]
- 12. Ikram MA, Brusselle G, Ghanbari M, et al. Objectives, design and main findings until 2020 from the Rotterdam study. Eur J Epidemiol. 2020;35(5):483‐517. [DOI] [PMC free article] [PubMed] [Google Scholar]
- 13. Petersen RC. Mild cognitive impairment as a diagnostic entity. J Intern Med. 2004;256(3):183‐194. [DOI] [PubMed] [Google Scholar]
- 14. de Bruijn RF, Akoudad S, Cremers LG, et al. Determinants, MRI correlates, and prognosis of mild cognitive impairment: the Rotterdam study. J Alzheimers Dis. 2014;42(Suppl 3):S239‐S249. [DOI] [PubMed] [Google Scholar]
- 15. Vernooij MW, Ikram MA, Vrooman HA, et al. White matter microstructural integrity and cognitive function in a general elderly population. Arch Gen Psychiatry. 2009;66(5):545‐553. [DOI] [PubMed] [Google Scholar]
- 16. de Bruijn RFAG, Bos MJ, Portegies MLP, et al. The potential for prevention of dementia across two decades: the prospective, population‐based Rotterdam study. BMC Med. 2015;13(1):132. [DOI] [PMC free article] [PubMed] [Google Scholar]
- 17. Wenham PR, Price WH, Blandell G. Apolipoprotein E genotyping by one‐stage PCR. Lancet. 1991;337(8750):1158‐1159. [DOI] [PubMed] [Google Scholar]
- 18. Woodward J. Bi‐allelic SNP genotyping using the TaqMan(R) assay. Methods Mol Biol. 2014;1145:67‐74. [DOI] [PubMed] [Google Scholar]
- 19. Roe CM, Xiong C, Miller JP, Morris JC. Education and Alzheimer disease without dementia: support for the cognitive reserve hypothesis. Neurology. 2007;68(3):223‐228. [DOI] [PubMed] [Google Scholar]
- 20. Ganguli M, Lee CW, Snitz BE, Hughes TF, McDade EM, Chang CC. How well do MCI criteria predict progression to severe cognitive impairment and dementia? Alzheimer Dis Assoc Disord. 2014;28(2):113‐121. [DOI] [PMC free article] [PubMed] [Google Scholar]
- 21. Petersen RC, Caracciolo B, Brayne C, Gauthier S, Jelic V, Fratiglioni L. Mild cognitive impairment: a concept in evolution. J Intern Med. 2014;275(3):214‐228. [DOI] [PMC free article] [PubMed] [Google Scholar]
- 22. Koepsell TD, Monsell SE. Reversion from mild cognitive impairment to normal or near‐normal cognition: risk factors and prognosis. Neurology. 2012;79(15):1591‐1598. [DOI] [PMC free article] [PubMed] [Google Scholar]
- 23. Bermejo‐Pareja F, Contador I, Trincado R, et al. Prognostic significance of mild cognitive impairment subtypes for dementia and mortality: data from the NEDICES cohort. J Alzheimers Dis. 2016;50(3):719‐731. [DOI] [PubMed] [Google Scholar]
- 24. Kochan NA, Slavin MJ, Brodaty H, et al. Effect of different impairment criteria on prevalence of “objective” mild cognitive impairment in a community sample. Am J Geriatr Psychiatry. 2010;18(8):711‐722. [DOI] [PubMed] [Google Scholar]
- 25. Qian J, Wolters FJ, Beiser A, et al. APOE‐related risk of mild cognitive impairment and dementia for prevention trials: an analysis of four cohorts. PLoS Med. 2017;14(3):e1002254. [DOI] [PMC free article] [PubMed] [Google Scholar]
- 26. Sachdev PS, Lipnicki DM, Kochan NA, et al. The prevalence of mild cognitive impairment in diverse geographical and Ethnocultural regions: the COSMIC collaboration. PLoS One. 2015;10(11):e0142388. [DOI] [PMC free article] [PubMed] [Google Scholar]
Associated Data
This section collects any data citations, data availability statements, or supplementary materials included in this article.
Supplementary Materials
Figure S1. Flow diagram of the study population
Table S1. Baseline characteristics by mild cognitive impairment (MCI) subtype
Table S2. Characteristics of eligible participants who were included versus who were not included in the study
Table S3. Life expectancy with and without dementia at age 70, 80, and 90