

Abstract
Objective
To estimate the incidence of urinary incontinence (UI), including its subtypes stress UI (SUI), urgency UI (UUI) and mixed UI (MUI), and to examine risk factors for de novo SUI and UUI in Chinese women.
Design
Nationwide longitudinal study.
Setting
Six geographic regions of China.
Participants
Women aged ≥20 years old were included using a multistage, stratified, cluster sampling method.
Methods
This study was conducted between May 2014 and March 2016, with follow up in 2018. Data on demographics, medical history, lifestyle and physiological and anthropometric information were collected.
Main outcome measurements
Incidence, rate ratio (RR).
Results
Analyses included 24 985 women (mean age 41.9 years).The follow‐up response rate was 55.5%, median follow‐up time was 3.7 years. The standardised incidences of UI, SUI, UUI and MUI were 21.2, 13.1, 3.0 and 5.1 per 1000 person‐years, respectively. Risk factors for de novo SUI included delivery pattern (vaginal spontaneous delivery RR 2.12, 95% CI 1.62–2.78 and instrumental delivery RR 3.30, 95% CI 1.99–5.45), high body mass index (BMI) (overweight RR 1.52, 95% CI 1.33–1.74 and obesity RR 1.67, 95% CI 1.32–2.11), cigarette smoking (RR 1.54, 95% CI 1.12–2.12), chronic cough (RR 1.44, 95% CI 1.17–1.76), diabetes (RR 1.33, 95% CI 1.10–1.60) and older age (50–59 years RR 1.49, 95% CI 1.16–1.90 and 60–69 years RR 1.61, 95% CI 1.22–2.13).The risk factors significantly associated with de novo UUI were age (RR increased from 1.21, 95% CI 0.74–1.99, at 30–39 years to 6.3, 95% CI 3.85–10.30, at >70 years) and diabetes (RR 1.48, 95% CI 1.05–2.09).
Conclusions
The incidence of female UI is 21.2 per 1000 person‐years in China. Delivery (vaginal spontaneous delivery, instrumental delivery), high BMI, cigarette smoking, chronic cough, diabetes and older age were risk factors.
Tweetable abstract
The incidence of female urinary incontinence was 21.2 per 1000 person‐years in China. Delivery, BMI, diabetes and old age are risk factors.
Keywords: Female urinary incontinence, incidence rate, mixed urinary incontinence, risk factors, stress urinary incontinence, urgency urinary incontinence
Tweetable abstract
The incidence of female urinary incontinence was 21.2 per 1000 person‐years in China. Delivery, BMI, diabetes and old age are risk factors.
Introduction
Urinary incontinence (UI) is defined as the complaint of any involuntary leakage of urine, according to the International Continence Society. 1 It is common in adult women, not life‐threatening but seriously affecting quality of life. 2 The financial burden of UI is substantial, with estimated annual direct costs in the USA of $19.5 billion in 2000. 3 The cost of UI is expected to increase dramatically as the population continues to age.
Several epidemiological studies of female UI have been conducted in Western countries, with an estimated annual incidence varying from 1 to 11%, 4 , 5 , 6 , 7 , 8 , 9 and prevalence varying from 5 to 69%. 10 , 11 , 12 This variability is related to differences in the definitions of UI used, the populations studied and different measuring instruments. 13 , 14 However, reliable estimation is required to plan effective clinical prevention and control. As China has a rapidly aging population, female UI is becoming an important public health concern. The available epidemiological evidence comes from cross‐sectional studies that were conducted across six regions of China among women ≥20 years of age in 2006. 15 , 16 , 17 The findings showed that the prevalence of UI and its subtypes, including stress urinary incontinence (SUI), urgency urinary incontinence (UUI) and mixed urinary incontinence (MUI), were 30.9, 18.9, 2.6 and 9.4%, respectively. However, the incidence rate of female UI is still unclear in China. Furthermore, a few longitudinal studies in Western women showed that the risk factors were different between UI subtypes, with educational level, body mass index (BMI), race and depression for SUI, and alcohol consumption and surgery for UUI. 5 , 18 However, it remains unclear whether such associations hold among Chinese women.
We aimed to estimate the incidence rate of female UI and its subtypes, including SUI, UUI and MUI, in a large‐scale population‐based longitudinal study in China. We further examined potential risk factors for de novo SUI and UUI.
Methods
Study design and participants
This study was a population‐based prospective study. A baseline survey with a multistage stratified cluster sampling design was conducted between May 2014 and January 2016. Details of the sampling technique, baseline recruitment and data collection have been described previously. 19 In brief, six provinces of China, which represent six major geographic regions of great socio‐economic and cultural diversity, were randomly selected as study regions. These provinces were Gansu in the northwest, Guizhou in the southwest, Shanxi in central China, Liaoning in the northeast, Jiangsu in the east and Guangdong in the southeast. Three counties and three cities, which were stratified by levels of economic development and urbanisation, were randomly selected from each province. The target population was all eligible adult female residents according to the updated census lists from the community registry offices. The inclusion criteria were women ≥20 years old in the general population who had lived in the registered regions for at least 5 years before the study. Individuals with severe mental or physical illness and pregnant females were excluded. A total of 55 477 women aged ≥20 years participated in the baseline survey (central China: 9104, the northwest: 9723, the east: 9078, the southwest: 8774, the southeast: 9803, and the northeast: 8995).
From June to December in 2018, we contacted 55 190 women who had complete baseline data for a telephone follow up, and 30 658 (55.5%) participants completed the follow‐up survey. We compared the baseline sociodemographic characteristics between responders and non‐responders (Table S1). Non‐responders were older and comprised a higher proportion of urban population compared with responders. After excluding 5675 participants who had UI detected at baseline or had missing data, a total of 24 985 women were eligible for final analysis. The study flowchart is shown in Figure 1.
Figure 1.
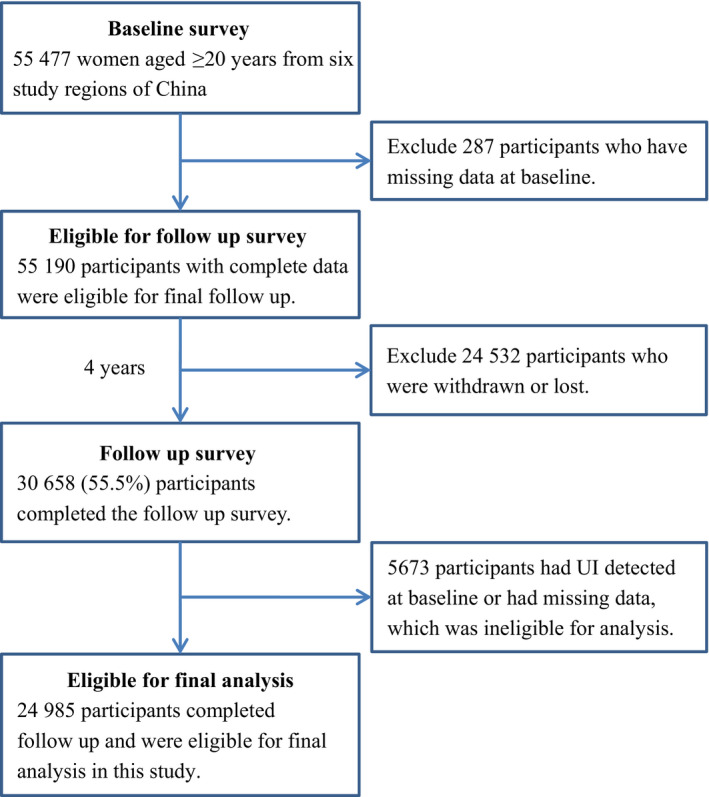
Study flowchart.
Ethical approval for the research protocol was obtained from the Institutional Review Board of Peking Union Medical College Hospital. Approval in the form of written informed consent was obtained from all participants.
Assessment of UI
Trained interviewers used the same self‐developed questionnaire in the baseline and follow‐up surveys. The participants were asked the following questions: (1) ‘During the last 6 months, did you leak urine when you were performing some physical activity, such as coughing, sneezing, lifting, or exercise?’ (no or yes); and (2) ‘During the last 6 months, did you leak urine when you had the urge or the feeling that you needed to empty your bladder, but you could not get to the toilet fast enough?’ (no or yes).
The International Continence Society defines UI as the complaint of any involuntary leakage of urine. 1 Women who answered yes for question (1) were categorised as having SUI (i.e. involuntary leakage on effort, exertion, sneezing or coughing). Women who answered yes for question (2) were categorised as having UUI (i.e. involuntary urine leakage accompanied by, or immediately preceded by, urgency). Women who answered yes for both questions were categorised as having MUI. Women with any of SUI, UUI or MUI were categorised as having UI.
Assessment of other variables
An interviewer‐administered questionnaire was also used to collect information on sociodemographic characteristics, physiological data, reproductive health, personal medical history, lifestyle behaviours and anthropometric data. Sociodemographic characteristics included birth year, ethnicity, marital status and education level. Information on reproductive health included menstruation, postmenopausal hormone replacement therapy and childbearing history. Medical history included doctor‐diagnosed chronic diseases (diabetes and cancers) and gynaecological diseases (pelvic inflammatory disease, pelvic pain, endometriosis, fibroids, gynaecological malignant tumours, pelvic organ prolapse). Lifestyle behaviours included smoking and alcohol drinking. 19 Anthropometric data included weight and height.
Statistical analysis
Normally distributed continuous data are expressed as mean ± SD and non‐normally distributed continuous data are expressed as the median (25th centile, 75th centile). A test for normality was performed by the Shapiro–Wilk test. Categorical variables are presented as the number and proportion. Incidence rates per 1000 person‐years were obtained by dividing the total number of incident cases over the follow‐up period by the total observed person‐years and multiplying by 1000. The incidence rates were standardised by age and region using the population composition of those aged ≥20 years from the 2010 Chinese census population. We conducted tests for the linear trend of incidence rate across categories of age group.
The multivariable Poisson regression model was used to assess the relationship between de novo SUI/UUI and potential risk factors of baseline and to estimate the rate ratio (RR) and 95% CI. We first performed univariate analysis to select statistically significant risk factors. We then combined these risk factors with clinical considerations for the multivariable model. Statistical significance for each variable in the model was analysed by the Wald test. All P values are two‐sided, with the significance level set at 0.1 for univariate analysis and 0.05 for other statistical tests. Data processing and statistical analyses were performed using SAS Version 9.3 (SAS, Cary, NC, USA).
Results
Among the 24 985 participants included in the analysis, the age distribution ranged from 20 to 96 years, and the median (25th centile, 75th centile) follow up was 3.7 (3.1, 4.1) years. The mean (± SD) age was 41.9 ± 15.0 years and mean BMI was 22.5 ± 3.0 kg/m². Overall, 12 994 (52.0%) participants were from urban areas. With regard to the delivery pattern, there were 15 736 (63.4%) vaginal spontaneous deliveries, 4331 (17.4%) caesarean sections, and 212 (0.9%) instrument‐assisted deliveries. Sociodemographic characteristics, physiological and pathological conditions, and health behaviour of study participants at baseline and follow up are shown in Table 1.
Table 1.
Sociodemographic characteristics, physiological and pathological conditions, and health behaviour of the study participants at baseline and follow up
| Characteristic |
Baseline n = 24 985 |
Follow up n = 24 985 |
|---|---|---|
| Age (years), mean ± SD | 41.9 ± 15.0 | 45.4 ± 14.9 |
| 20–29 | 6521 (26.1) | 3869 (15.5) |
| 30–39 | 6517 (26.1) | 6795 (27.2) |
| 40–49 | 5244 (21.0) | 5945 (23.8) |
| 50–59 | 3010 (12.1) | 3890 (15.6) |
| 60–69 | 1998 (8.0) | 2410 (9.7) |
| ≥70 | 1695 (6.8) | 2076 (8.3) |
| Race | ||
| Han | 24 436 (97.9) | 24 436 (97.9) |
| Minority | 521 (2.1) | 521 (2.1) |
| Education | ||
| Primary school and below | 5454 (21.8) | 5605 (22.4) |
| Junior middle school | 6540 (26.2) | 5988 (24.0) |
| Senior school | 5663 (22.7) | 5734 (23.0) |
| College or above | 7318 (29.3) | 7648 (30.6) |
| Marital status | ||
| Couple | 21 614 (86.9) | 22 352 (90.2) |
| Single | 2382 (9.6) | 1390 (5.6) |
| Divorce/Widowed | 874 (3.5) | 1041 (4.2) |
| Cigarette smoking | 441 (1.8) | 272 (1.09) |
| Alcohol consumption | 151 (0.6) | 263 (1.06) |
| BMI (kg/m2), mean ± SD | 22.5 ± 3.0 | 22.6 ± 3.0 |
| Underweight (<18.5) | 1747 (7.0) | 1429 (5.8) |
| Normal (18.5–23.9) | 16 523 (66.1) | 16 538 (66.5) |
| Overweight (24–27.9) | 5537 (22.2) | 5707 (23.0) |
| Obese (≥28) | 1175 (4.7) | 1192 (4.8) |
| Parity | ||
| Nulliparous | 4560 (18.3) | 2334 (9.3) |
| Primiparous (1) | 11 312 (45.5) | 11 536 (46.2) |
| Multiparous (2) | 5959 (24.0) | 7595 (30.4) |
| Multiparous (≥3) | 3034 (12.2) | 3513 (14.1) |
| Delivery pattern | ||
| Nulliparous | 4560 (18.4) | 2334 (9.4) |
| Vaginal spontaneous delivery | 15 736 (63.4) | 17 254 (69.5) |
| Instrumental deliverer | 212 (0.9) | 215 (0.9) |
| Caesarean section | 4331 (17.4) | 5032 (20.3) |
| Gynaecological disease* | 5975 (24.0) | 3238 (13.04) |
| Premenopausal | 15 688 (71.8) | 14 174 (64.9) |
| Cough (>3 weeks) | 1385 (5.6) | 994 (4.0) |
| Diabetes | 2159 (8.7) | 2505 (10.1) |
| Pelvic surgery | 7606 (30.5) | 9973 (40.0) |
| Spinal surgery | 79 (0.3) | 116 (0.5) |
Data are shown as mean ± SD or n (%).
Gynaecological diseases included myoma, pelvic inflammatory disease, chronic pelvic pain and endometriosis.
Overall, the crude incidence rate of UI was 19.6 (95% CI 18.7–20.5) per 1000 person‐years among women aged ≥20 years (Table 2). The age‐specific incidence rate of UI rose significantly with age (P trend < 0.0001 for urban and rural areas) from 10.2 per 1000 person‐years in the 20–30 years group to 43.0 per 1000 person‐years in the >70 years group. The crude incidence rate was significantly higher in rural than in urban areas (21.0, 95% CI 19.6–22.3 versus 18.2, 95% CI 16.9–19.4 per 1000 person‐years, P < 0.0001). The standardised incidence rate of UI was 21.2 per 1000 person‐years for all women, and 19.5 and 23.0 per 1000 person‐years for urban and rural women, respectively.
Table 2.
Incidence rate of female UI over 4 years by region and age*
| Person‐years | Cases | IR (95% CI) | Standardised IR (%)**, * | |
|---|---|---|---|---|
| All | 89 790 | 1757 | 19.6 (18.7–20.5) | 21.2 |
| 20–29 | 22 596 | 230 | 10.2 (8.9–11.5) | |
| 30–39 | 23 821 | 333 | 14.0 (12.5–15.5) | |
| 40–49 | 19 908 | 410 | 20.6 (18.6–22.6) | |
| 50–59 | 11 094 | 308 | 27.8 (24.7–30.9) | |
| 60–69 | 6805 | 237 | 34.8 (30.3–39.3) | |
| ≥70 | 5564 | 239 | 43.0 (37.5–48.4) | |
| Urban | 45 147 | 820 | 18.2 (16.9–19.4) | 19.5 |
| 20–29 | 12 003 | 104 | 8.7 (7.0–10.3) | |
| 30–39 | 12 657 | 161 | 12.7 (10.8–14.7) | |
| 40–49 | 9583 | 189 | 19.7 (16.9–22.5) | |
| 50–59 | 4923 | 151 | 30.7 (25.8–35.6) | |
| 60–69 | 3409 | 116 | 34.0 (27.8–40.2) | |
| ≥70 | 2573 | 99 | 38.5 (30.9–46.1) | |
| Rural | 44 643 | 937 | 21.0 (19.6–22.3) | 23.0 |
| 20–29 | 10 593 | 126 | 11.9 (9.8–14.0) | |
| 30–39 | 11 164 | 172 | 15.4 (13.1–17.7) | |
| 40–49 | 10 326 | 221 | 21.4 (18.6–24.2) | |
| 50–59 | 6171 | 157 | 25.4 (21.5–29.4) | |
| 60–69 | 3397 | 121 | 35.6 (29.3–42.0) | |
| ≥70 | 2991 | 140 | 46.8 (39.1–54.6) |
Incidence rate (IR) per 1000 person‐years.
Standardised incidence rate: the incidence rates were standardised by age and region based on the 2010 Chinese census.
For subtypes of UI, the crude incidence rates of female SUI, UUI and MUI were 12.4 (95% CI 11.7–13.2), 2.7 (95% CI 2.4–3.0) and 4.4 (95% CI 4.0–4.9) per 1000 person‐years, respectively. The trend of the incidence rates of SUI, UUI and MUI with age is shown in Figure S1. For SUI, the crude incidence initially increased and then decreased with age, and peaked at 60–69 years (Table 3). The crude incidence of UUI and MUI monotonically increased with age, especially in the age group of >70 years, which was much higher than other age groups (P < 0.0001). This pattern was found in urban (P < 0.0001) and rural areas (P < 0.0001) (Table 3). With regard to different delivery patterns, the incidence rates of SUI in women who were nulliparous, and in those who had vaginal spontaneous delivery, instrumental delivery and caesarean section were 5.9, 15.1, 27.7 and 8.9 per 1000 person‐years, respectively. The incidence rates of UI, SUI and UUI increased with BMI (P trend < 0.05) (Figure 2). The standardised incidence rates of SUI, UUI and MUI were 13.1, 3.0 and 5.1 per 1000 person‐years, respectively.
Table 3.
Incidence rates of female UI subtypes over 4 years by region and age*
| Region | Person‐years | SUI | UUI | MUI | ||||||
|---|---|---|---|---|---|---|---|---|---|---|
| Cases | IR (95% CI) | Standardised IR (%)** | Cases | IR (95% CI) | Standardised IR (%)** | Cases | IR (95% CI) | Standardised IR (%)** | ||
| All | 89 790 | 1117 | 12.4 (11.7–13.2) | 13.1 | 243 | 2.7 (2.4–3.0) | 3.0 | 397 | 4.4 (4.0–4.9) | 5.1 |
| 20–29 | 22 596 | 178 | 7.9 (6.7–9.0) | 28 | 1.2 (0.8–1.7) | 24 | 1.1 (0.6–1.5) | |||
| 30–39 | 23 821 | 245 | 10.3 (9.0–11.6) | 36 | 1.5 (1.0–2.0) | 52 | 2.2 (1.6–2.8) | |||
| 40–49 | 19 908 | 272 | 13.7 (12.0–15.3) | 50 | 2.5 (1.8–3.2) | 88 | 4.4 (3.5–5.3) | |||
| 50–59 | 11 094 | 195 | 17.6 (15.1–20.0) | 42 | 3.8 (2.6–4.9) | 71 | 6.4 (4.9–7.9) | |||
| 60–69 | 6805 | 135 | 19.8 (16.5–23.2) | 34 | 5.0 (3.3–6.7) | 68 | 10.0 (7.6–12.4) | |||
| ≥70 | 5564 | 92 | 16.5 (13.2–19.9) | 53 | 9.5 (7.0–12.1) | 94 | 16.9 (13.5–20.3) | |||
| Urban | 45 147 | 543 | 12.0 (11.0–13.0) | 12.6 | 107 | 2.4 (1.9–2.8) | 2.6 | 170 | 3.8 (3.2–4.3) | 4.2 |
| 20–29 | 12 003 | 83 | 6.9 (5.4–8.4) | 14 | 1.2 (0.6–1.8) | 7 | 0.6 (0.2–1.0) | |||
| 30–39 | 12 657 | 124 | 9.8 (8.1–11.5) | 14 | 1.1 (0.5–1.7) | 23 | 1.8 (1.1–2.6) | |||
| 40–49 | 9583 | 133 | 13.9 (11.5–16.2) | 20 | 2.1 (1.2–3.0) | 36 | 3.8 (2.5–5.0) | |||
| 50–59 | 4923 | 97 | 19.7 (15.8–23.6) | 19 | 3.9 (2.1–5.6) | 35 | 7.1 (4.8–9.5) | |||
| 60–69 | 3409 | 70 | 20.5 (15.7–25.3) | 16 | 4.7 (2.4–7.0) | 30 | 8.8 (5.7–11.9) | |||
| ≥70 | 2573 | 36 | 14.0 (9.4–18.6) | 24 | 9.3 (5.6–13.1) | 39 | 15.2 (10.4–19.9) | |||
| Rural | 44 643 | 574 | 12.9 (11.8–13.9) | 13.6 | 136 | 3.0 (2.5–3.6) | 3.5 | 227 | 5.1 (4.4–5.7) | 6.0 |
| 20–29 | 10 593 | 95 | 9.0 (7.2–10.8) | 14 | 1.3 (0.6–2.0) | 17 | 1.6 (0.8–2.4) | |||
| 30–39 | 11 164 | 121 | 10.8 (8.9–12.8) | 22 | 2.0 (1.1–2.8) | 29 | 2.6 (1.7–3.5) | |||
| 40–49 | 10 326 | 139 | 13.5 (11.2–15.7) | 30 | 2.9 (1.9–3.9) | 52 | 5.0 (3.7–6.4) | |||
| 50–59 | 6171 | 98 | 15.9 (12.7–19.0) | 23 | 3.7 (2.2–5.3) | 36 | 5.8 (3.9–7.7) | |||
| 60–69 | 3397 | 65 | 19.1 (14.5–23.8) | 18 | 5.3 (2.9–7.7) | 38 | 11.2 (7.6–14.7) | |||
| ≥70 | 2991 | 56 | 18.7 (13.8–23.6) | 29 | 9.7 (6.2–13.2) | 55 | 18.4 (13.5–23.2) | |||
Incidence rate (IR)/1000 person‐years.
Standardised incidence rate: the incidence rates were standardised by age and region based on the 2010 Chinese census.
Figure 2.
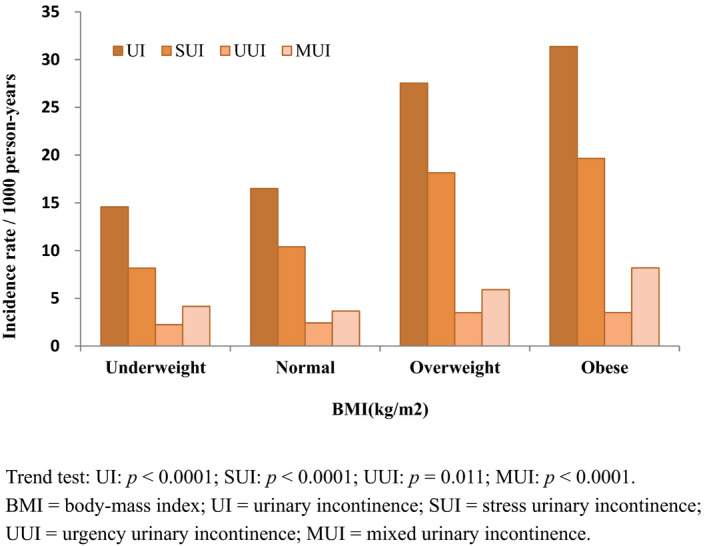
BMI‐specific incidence rate of UI and its subtypes. Trend test: UI: P < 0.0001; SUI: P < 0.0001; UUI: P = 0.011; MUI: P < 0.0001.
Univariate and multivariable analyses of the risk factors of developing SUI are shown in Table 4. In multivariable analysis, middle and older age, higher BMI, race, higher education, vaginal spontaneous delivery, instrumental delivery, chronic cough, diabetes and cigarette smoking were identified as risk factors for de novo SUI (P < 0.05). Our study showed a higher risk of SUI in middle‐aged and older‐aged women (RR 1.49, 95% CI 1.16–1.90 for 50–59 years, RR 1.61, 95% CI 1.22–2.13 for 60–69 years) compared with young women (20–29 years). Women who were overweight (RR 1.52, 95% CI 1.33–1.74) and with obesity (RR 1.67, 95% CI 1.32–2.11) were more likely to have SUI than women with a normal BMI. With regard to delivery pattern, women with vaginal spontaneous delivery (RR 2.12, 95% CI 1.62–2.78) and instrumental delivery (RR 3.30, 95% CI 1.99–5.45) were more likely to have SUI than nulliparous women.
Table 4.
Univariate and multivariable adjusted rate ratios (95% CI) for the risk of developing SUI
| Variables | Univariate analysis | Multivariable analysis | ||
|---|---|---|---|---|
| RR (95% CI) | P value | RR (95% CI) | P value | |
| Age (years) | ||||
| 20–29 | Reference | Reference | ||
| 30–39 | 1.31 (1.08–1.58) | 0.007 | 0.99 (0.79–1.23) | 0.930 |
| 40–49 | 1.73 (1.44–2.10) | <0.0001 | 1.22 (0.97–1.54) | 0.083 |
| 50–59 | 2.23 (1.82–2.73) | <0.0001 | 1.49 (1.16–1.90) | 0.002 |
| 60–69 | 2.52 (2.01–3.15) | <0.0001 | 1.61 (1.22–2.13) | 0.001 |
| ≥70 | 2.10 (1.63–2.70) | <0.0001 | 1.33 (0.98–1.82) | 0.069 |
| Region | ||||
| Urban | Reference | — | — | |
| Rural | 1.07 (0.95–1.20) | 0.265 | — | — |
| Race | ||||
| Han | Reference | Reference | ||
| Minority | 0.41 (0.21–0.79) | 0.007 | 0.46 (0.24–0.89) | 0.022 |
| Education | ||||
| Primary school and below | Reference | Reference | ||
| Junior middle school | 1.28 (1.08–1.51) | 0.004 | 1.66 (1.40–1.98) | <0.0001 |
| Senior school | 1.01 (0.84–1.21) | 0.920 | 1.59 (1.30–1.94) | <0.0001 |
| College or above | 0.99 (0.83–1.18) | 0. 910 | 2.05 (1.68–2.52) | <0.0001 |
| Cigarette smoking | 2.05 (1.50–2.80) | <0.0001 | 1.54 (1.12–2.12) | 0.007 |
| Alcohol consumption | 0.43 (0.14–1.34) | 0.146 | — | — |
| BMI (kg/m2) | ||||
| Underweight (<18.5) | 0.79 (0.59–1.04) | 0.097 | 0.90 (0.67–1.20) | 0.470 |
| Normal (18.5–23.9) | Reference | Reference | ||
| Overweight (24.0–27.9) | 1.75 (1.53–1.99) | <0.0001 | 1.52 (1.33–1.74) | <0.0001 |
| Obese (≥28.0) | 1.89 (1.50–2.37) | <0.0001 | 1.67 (1.32–2.11) | <0.0001 |
| Marital status | ||||
| Couple | Reference | — | — | |
| Single | 0.37 (0.27–0.51) | <0.0001 | — | — |
| Divorce/Widowed | 1.40 (1.07–1.82) | 0.01 | — | — |
| Delivery pattern | ||||
| Nulliparous | Reference | Reference | ||
| Vaginal spontaneous delivery | 2.54 (2.05–3.14) | <0.0001 | 2.12 (1.62–2.78) | <0.0001 |
| Instrumental delivery | 4.67 (2.91–7.50) | <0.0001 | 3.30 (1.99–5.45) | <0.0001 |
| Caesarean section | 1.49 (1.15–1.94) | 0.003 | 1.28 (0.95–1.71) | 0.107 |
| Gynaecological disease*, * | 1.09 (0.95–1.23) | 0.253 | — | — |
| Premenopausal | 1.45 (1.28–1.64) | <0.0001 | — | — |
| Cough (>3 weeks) | 1.64 (1.34–2.01) | <0.0001 | 1.44 (1.17–1.76) | 0.001 |
| Diabetes | 1.98 (1.68–2.33) | <0.0001 | 1.33 (1.10–1.60) | 0.003 |
| Pelvic surgery | 0.87 (0.77–0.99) | 0.039 | — | — |
| Spinal surgery | 0.55 (0.14–2.20) | 0.397 | — | — |
Gynaecological diseases included myoma, pelvic inflammatory disease, chronic pelvic pain and endometriosis.
Univariate and multivariable analyses of the risk factors of developing UUI are shown in Table 5. The risk factors that were positively associated with de novo UUI were older age and diabetes. The RR of UUI increased with age, from 1.96 (95% CI 1.24–3.12) in the 40–49 years group to 6.30 (95% CI 3.85–10.30) in the >70 years group compared with the 20–29 years group.
Table 5.
Univariate and multivariable adjusted rate ratios (95% CI) for the risk of developing UUI
| Variables | Univariate analysis | Multivariable analysis | ||
|---|---|---|---|---|
| RR (95% CI) | P value | RR (95% CI) | P value | |
| Age (years) | ||||
| 20–29 | Reference | Reference | ||
| 30–39 | 1.22 (0.74–2.00) | 0.431 | 1.21 (0.74–1.99) | 0.442 |
| 40–49 | 2.03 (1.28–3.22) | 0.003 | 1.96 (1.24–3.12) | 0.004 |
| 50–59 | 3.06 (1.89–4.93) | <0.0001 | 2.81 (1.73–4.56) | <0.0001 |
| 60–69 | 4.03 (2.44–6.65) | <0.0001 | 3.47 (2.06–5.84) | <0.0001 |
| ≥70 | 7.69 (4.86–12.15) | <0.0001 | 6.30 (3.85–10.30) | <0.0001 |
| Region | ||||
| Urban | Reference | — | — | |
| Rural | 1.28 (1.00–1.66) | 0.052 | — | — |
| Race | ||||
| Han | Reference | — | — | |
| Minority | 1.27 (0.57–2.86) | 0.561 | — | — |
| Education | ||||
| Primary school and below | Reference | — | — | |
| Junior middle school | 0.74 (0.54–1.01) | 0.061 | — | — |
| Senior school | 0.64 (0.46–0.91) | 0.013 | — | — |
| College or above | 0.28 (0.18–0.42) | <0.0001 | — | — |
| Cigarette smoking | 0.67 (0.21–2.09) | 0.491 | — | — |
| Alcohol consumption | 1.33 (0.33–5.33) | 0.692 | — | — |
| BMI (kg/m2) | ||||
| Underweight (<18.5) | 0.92 (0.53–1.60) | 0.778 | — | — |
| Normal (18.5–23.9) | Reference | — | — | |
| Overweight (24.0–27.9) | 1.44 (1.08–1.91) | 0.012 | — | — |
| Obese (≥28.0) | 1.45 (0.85–2.46) | 0.173 | — | — |
| Marital status | ||||
| Couple | Reference | — | — | |
| Single | 0.35 (0.17–0.72) | 0.004 | — | — |
| Divorce/Widowed | 2.28 (1.44–3.60) | <0.0001 | — | — |
| Delivery pattern | ||||
| Nulliparous | Reference | — | — | |
| Vaginal spontaneous delivery | 3.65 (2.12–6.28) | <0.0001 | — | — |
| Instrumental delivery | 4.38 (1.26–15.35) | 0.020 | — | — |
| Caesarean section | 2.48 (1.34–4.61) | 0.004 | — | — |
| Gynaecological disease** | 1.09 (0.82–1.45) | 0.556 | — | — |
| Premenopausal | 3.78 (2.87–4.99) | <0.0001 | — | — |
| Cough (>3 weeks) | 0.82 (0.46–1.46) | 0.499 | — | — |
| Diabetes | 3.14 (2.33–4.24) | <0.0001 | 1.48 (1.05–2.09) | 0.026 |
| Pelvic surgery | 1.00 (0.76–1.30) | 0.972 | — | — |
| Spinal surgery | 2.53 (0.63–10.19) | 0.190 | — | — |
Gynaecological diseases included myoma, pelvic inflammatory disease, chronic pelvic pain and endometriosis.
Discussion
Main findings
The current nationwide longitudinal survey included 24 985 women. We found that standardised incidence rates of UI, SUI, UUI and MUI were 21.2, 13.1, 3.0 and 5.1 per 1000 person‐years, respectively, among adult women in China. Delivery (vaginal spontaneous delivery, instrumental delivery), high BMI, cigarette smoking, chronic cough, diabetes, middle and older age, and living in rural areas increase the risk of SUI. Older age and diabetes increase the risk of UUI.
Strengths and limitations
The strengths of this study are that it included a large population of women, which enabled us to accurately estimate the incidence of UI in each subgroup. Furthermore, for the first time, the incidence rate of female UI and its subtypes has been reported in the general population in China, especially for young women. Finally, several controllable risk factors were identified for de novo SUI and UUI.
Our study has several limitations. First, because 44.5% participants did not respond in the follow‐up survey, selection bias due to loss to follow up was inevitable. However, the distributions of baseline characteristics between the responders and the non‐responders were similar. Although the differences were significant in this large sample, the absolute differences were small, so we believe that loss to follow up did not have a great impact on the estimation of incidence rate. Second, all information was obtained through self‐reporting of responders. Therefore, information bias might have affected the accuracy of the data. Third, UI is a dynamic process and not necessarily progressive, and some people may have recovered before follow up. Therefore, the incidence of UI may have been underestimated. Finally, the frequency and volume of urine leakage and its impact on quality of life were not measured, which makes it impossible to know the severity of UI and the bother it causes to women. A certain proportion of women with symptoms of urine leakage may never require treatment. Further evidence on the severity of UI in women of different ages is needed in future studies.
Interpretation
This study showed that the standardised incidence of UI was 21.2 per 1000 person‐years, which approaches the lower range of estimates from other studies, which ranged from 1 to 11%. 5 Our results of incidence in people aged >60 years are similar to that of the SABE STUDY, 20 which showed the incidence of UI was 39.3 per 1000 person‐years among a relatively small sample size of 864 Brazilian older women (individuals aged ≥60 years). An analysis of the Nurses' Health Study cohort, 7 which included 852 Asian women aged 37–79 years in the USA, showed that the incidence of UI in Asian women was 5.7 per 100 person‐years. This number is higher than that of our result in women aged >40 years, perhaps because the participants of the Nurses' Health Study cohort are specifically a highly educated population. Additionally, our result is lower than that of Espuna‐Pons et al.’s study, 6 which showed that the 1‐year incidence of female UI was 5.3% in the age group of 18–91 years in patients seeking care for different gynaecological problems in Spain. Although the participants came from the clinical population, the incidence of female UI may have been higher than that in the general population. The French GAZEL cohort study 8 recruited 4127 middle‐aged (47–52 years old at baseline) women over 18 years (1990–2008), and reported an annual incidence of 3.3% for UI, which is higher than that of our result in women aged 40–60 years. Although several studies have reported the incidence of female UI in various populations, these earlier findings are not comparable because of the small sample size or non‐representative samples or clinical patients. 5 , 6 , 21 , 22
Identifying risk factors is important for clinical prevention and decision‐making. Because MUI is a combination of SUI and UUI, and MUI pathophysiology may be different from that of pure SUI and pure UUI combined together, we focused on analysing the risk factors of SUI and UUI. Our findings suggested that vaginal spontaneous delivery and instrumental delivery significantly increased the risk of SUI, which is consistent with previous studies. 23 , 24 Vaginal delivery is correlated with development of SUI, probably via injury of pelvic floor structures, such as muscles, nerves, organs and the extracellular matrix responsible for continence. 25 Tahtinen et al. showed that instrumental delivery, especially forceps delivery, is associated with significant increased long‐term risk of SUI compared with other vaginal deliveries for women aged ≤50 years. 24 More attention needs to be paid to women after childbirth, and early prevention and rehabilitation strategies for SUI are required.
Our study showed that BMI at baseline was significantly associated with SUI. These data confirm the associations found between weight gain and UI in clinical patients. 26 However, we did not find an association between BMI and UUI. BMI is a risk factor that can have intervention, and moderate weight reduction may be beneficial for treatment and prevention of SUI.
Age is an established risk factor for SUI and UUI. 4 , 10 , 27 Our findings further confirmed that the risk of SUI and UUI increased with age in the general population. In each age group, although the risk of UUI was higher than that of SUI, the prevalence of SUI was higher. Therefore, the absolute number involved in SUI was more than that of UUI. The incidence of UI subtypes in women aged >60 years is increasing rapidly, which requires more investment in clinical treatment.
We also found a significant association between diabetes and the incidence of SUI and UUI. Although diabetes was identified as a risk factor for UI in a previous cross‐sectional study, 28 our results indicated its causal association by time in our prospective study. Our study suggests that health management of chronic diseases, such as obesity and diabetes, may help to reduce the risk of SUI and UUI.
Our study findings have important public health implications. We calculated the absolute numbers of people with SUI based on the number of Chinese women from the 2018 Chinese Statistics Yearbook. 29 The estimated total number of individuals aged ≥20 years with de novo UI was 14.46 million in China, including 8.93 million SUIs, 2.05 million UUIs and 3.48 million MUIs. With rapid entry into an aging society, the number of affected people and the burden of UI are anticipated to continue to increase in China. Our findings suggest the need for national policies and programmes for prevention and early detection of UI. Information about UI should be disseminated to the Chinese public to assure proper clinical treatment in the future.
Conclusion
Our study shows that the incidence of de novo female UI is 21.2/1000 person‐years in China. Delivery (vaginal spontaneous delivery, instrumental delivery), high BMI, cigarette smoking, chronic cough, diabetes, middle and older age, and living in rural areas increase the risk of SUI. Older age and diabetes increase the risk of UUI. Our findings may aid in identifying populations at risk, and help clinical early prevention, and intervention of UI.
Disclosure of interests
None declared. Completed disclosure of interest forms are available to view online as supporting information.
Contribution to authorship
LZ contributed to the study conception, design, analysis and interpretation of the data, and reviewed and approved the final manuscript. HP contributed to the study concept and design, analysis and interpretation of the data, and drafting of the manuscript. JL contributed to analysis and made critical revision of the manuscript. TX contributed to study concept and design. Zhaoai Li, JG, QL, YW, JW, ZX, and Zhiyi Li contributed to acquisition of data. LL made critical revision of the manuscript for important intellectual content.
Details of ethics approval
The study protocol was approved by the institutional review board of Peking Union Medical College Hospital (Number: S‐689, Date: 15 May 2014). The study protocol was approved (http://www.chictr.org, ChiCTR‐OCH‐14004675), and written informed consent was obtained from each participant before data collection.
Funding
This study was funded by the National Key R&D Programme of China (2018YFC2002201), the National Natural Science Foundation of China (72104247), the CAMS Initiative for Innovative Medicine (2017‐I2M‐1‐002) and the National Natural Science Foundation of China (81830043).
Acknowledgements
We thank all patients who participated in the study. We thank Ellen Knapp for editing the English text of a draft of this manuscript.
Supporting information
Table S1. Baseline description of responders and non‐responders.
Figure S1. Trend of the incidence rates of SUI, UUI and MUI with age.
Supplementary Material
Supplementary Material
Supplementary Material
Supplementary Material
Supplementary Material
Supplementary Material
Supplementary Material
Supplementary Material
Supplementary Material
Supplementary Material
Supplementary Material
Supplementary Material
Pang H, Lv J, Xu T, Li Z, Gong J, Liu Q, Wang Y, Wang J, Xia Z, Li Z, Li L, Zhu L. Incidence and risk factors of female urinary incontinence: a 4‐year longitudinal study among 24 985 adult women in China. BJOG 2022; 10.1111/1471-0528.16936.129:580–589.
Jun Lv is a co‐first author.
Contributor Information
L Li, Email: lmlee@vip.163.com.
L Zhu, Email: zhu_julie@vip.sina.com.
Data availability
The data that support the findings of this study are available from the corresponding author upon reasonable request.
References
- 1. Abrams P, Cardozo L, Fall M, Griffiths D, Rosier P, Ulmsten U, et al. The standardisation of terminology of lower urinary tract function: report from the Standardisation Sub‐committee of the International Continence Society. Neurourol Urodyn 2002;21:167–78. [DOI] [PubMed] [Google Scholar]
- 2. Lukacz ES, Santiago‐Lastra Y, Albo ME, Brubaker L. Urinary incontinence in women: a review. JAMA 2017;318:1592–604. [DOI] [PubMed] [Google Scholar]
- 3. Hu TW, Wagner TH, Bentkover JD, Leblanc K, Zhou SZ, Hunt T. Costs of urinary incontinence and overactive bladder in the United States: a comparative study. Urology 2004;63:461–5. [DOI] [PubMed] [Google Scholar]
- 4. Smith K, Sutherland A, Hyde Z, Crawford R, Dwyer A, Malay R, et al. Assessment, incidence and factors associated with urinary incontinence in older Aboriginal Australians. Intern Med J 2019;49:1111–8. [DOI] [PubMed] [Google Scholar]
- 5. Legendre G, Fritel X, Panjo H, Zins M, Ringa V. Incidence and remission of stress, urge, and mixed urinary incontinence in midlife and older women: a longitudinal cohort study. Neurourol Urodyn 2019;39:650–7. [DOI] [PubMed] [Google Scholar]
- 6. Espuna‐Pons M, Ros C, Ortega JA, Aliaga F, Pérez‐González A, Palau MJ. Prevalence, incidence, and remission rates of urinary incontinence in women attended in gynecological practice. Neurourol Urodyn 2017;36:1081–5. [DOI] [PubMed] [Google Scholar]
- 7. Townsend MK, Curhan GC, Resnick NM, Grodstein F. The incidence of urinary incontinence across Asian, black, and white women in the United States. Am J Obstet Gynecol 2010;202:378.e1–7. [DOI] [PMC free article] [PubMed] [Google Scholar]
- 8. Legendre G, Ringa V, Panjo H, et al. Incidence and remission of urinary incontinence at midlife: a cohort study. BJOG 2015;122:816–24. [DOI] [PubMed] [Google Scholar]
- 9. Townsend MK, Danforth KN, Lifford KL, Rosner B, Curhan GC, Resnick NM, et al. Incidence and remission of urinary incontinence in middle‐aged women. Am J Obstet Gynecol 2007;197:167.e1–5. [DOI] [PMC free article] [PubMed] [Google Scholar]
- 10. Cerruto MA, D'Elia C, Aloisi A, Fabrello M, Artibani W. Prevalence, incidence and obstetric factors' impact on female urinary incontinence in Europe: a systematic review. Urol Int 2013;90:1–9. [DOI] [PubMed] [Google Scholar]
- 11. Thom D. Variation in estimates of urinary incontinence prevalence in the community: effects of differences in definition, population characteristics, and study type. J Am Geriatr Soc 1998;46:473–80. [DOI] [PubMed] [Google Scholar]
- 12. Lasserre A, Pelat C, Gueroult V, Hanslik T, Chartier‐Kastler E, Blanchon T, et al. Urinary incontinence in French women: prevalence, risk factors, and impact on quality of life. Eur Urol 2009;56:177–83. [DOI] [PubMed] [Google Scholar]
- 13. Bedretdinova D, Fritel X, Panjo H, Ringa V. Prevalence of female urinary incontinence in the general population according to different definitions and study designs. Eur Urol 2016;69:256–64. [DOI] [PubMed] [Google Scholar]
- 14. Mittal S, Lee RK. How should the prevalence of urinary incontinence be determined in a female population? Eur Urol 2016;69:265–6. [DOI] [PubMed] [Google Scholar]
- 15. Zhu L, Lang J, Liu C, Han S, Huang J, Li X. The epidemiological study of women with urinary incontinence and risk factors for stress urinary incontinence in China. Menopause (New York, NY) 2009;16:831–6. [DOI] [PubMed] [Google Scholar]
- 16. Zhu L, Li L, Lang J, Xu T, Wong F. Epidemiology of mixed urinary incontinence in China. Int J Gynaecol Obstet 2010;109:55–8. [DOI] [PubMed] [Google Scholar]
- 17. Zhang L, Zhu L, Xu T, Lang J, Li Z, Gong J, et al. A population‐based survey of the prevalence, potential risk factors, and symptom‐specific bother of lower urinary tract symptoms in adult Chinese women. Eur Urol 2015;68:97–112. [DOI] [PubMed] [Google Scholar]
- 18. Komesu YM, Schrader RM, Ketai LH, Rogers RG, Dunivan GC. Epidemiology of mixed, stress, and urgency urinary incontinence in middle‐aged/older women: the importance of incontinence history. Int Urogynecol J 2016;27:763–72. [DOI] [PMC free article] [PubMed] [Google Scholar]
- 19. Zhang C, Tong J, Zhu L, Zhang L, Xu T, Lang J, et al. A population‐based epidemiologic study of female sexual dysfunction risk in mainland China: prevalence and predictors. J Sexual Med 2017;14:1348–56. [DOI] [PubMed] [Google Scholar]
- 20. Tamanini JTN, Pallone LV, Sartori MGF, Girão MJBC, dos Santos JLF, de Oliveira Duarte YA, et al. A populational‐based survey on the prevalence, incidence, and risk factors of urinary incontinence in older adults‐results from the “SABE STUDY”. Neurourol Urodyn 2018;37:466–77. [DOI] [PubMed] [Google Scholar]
- 21. Erekson EA, Cong X, Townsend MK, Ciarleglio MM. Ten‐year prevalence and incidence of urinary incontinence in older women: a longitudinal analysis of the health and retirement study. J Am Geriatr Soc 2016;64:1274–80. [DOI] [PMC free article] [PubMed] [Google Scholar]
- 22. Morrisroe SN, Rodriguez LV, Wang PC, Smith AL, Trejo L, Sarkisian CA. Correlates of 1‐year incidence of urinary incontinence in older Latino adults enrolled in a community‐based physical activity trial. J Am Geriatr Soc 2014;62:740–6. [DOI] [PMC free article] [PubMed] [Google Scholar]
- 23. Boyles SH, Li H, Mori T, Osterweil P, Guise J‐M. Effect of mode of delivery on the incidence of urinary incontinence in primiparous women. Obstet Gynecol 2009;113:134–41. [DOI] [PubMed] [Google Scholar]
- 24. Tahtinen RM, Cartwright R, Vernooij RWM, Rortveit G, Hunskaar S, Guyatt GH, et al. Long‐term risks of stress and urgency urinary incontinence after different vaginal delivery modes. Am J Obstet Gynecol 2019;220:181.e1–e8. [DOI] [PubMed] [Google Scholar]
- 25. Rortveit G, Daltveit AK, Hannestad YS, Hunskaar S. Urinary incontinence after vaginal delivery or cesarean section. New Engl J Med 2003;348:900–7. [DOI] [PubMed] [Google Scholar]
- 26. Subak LL, Wing R, West DS, Franklin F, Vittinghoff E, Creasman JM, et al. Weight loss to treat urinary incontinence in overweight and obese women. New Engl J Med 2009;360:481–90. [DOI] [PMC free article] [PubMed] [Google Scholar]
- 27. Wehrberger C, Temml C, Ponholzer A, Madersbacher S. Incidence and remission of female urinary incontinence over 6.5 years: analysis of a health screening project. Eur Urol 2006;50:327–32. [DOI] [PubMed] [Google Scholar]
- 28. Melville JL, Katon W, Delaney K, Newton K Urinary incontinence in US women: a population‐based study. Arch Intern Med 2005;165:537–42. [DOI] [PubMed] [Google Scholar]
- 29. National Bureau of Statistics of China . 2019 China Statistical Yearbook. National Bureau of Statistics of China; 2019. [http://www.stats.gov.cn/tjsj/ndsj/2019/indexeh.htm]. Accessed 10 January 2020. [Google Scholar]
Associated Data
This section collects any data citations, data availability statements, or supplementary materials included in this article.
Supplementary Materials
Table S1. Baseline description of responders and non‐responders.
Figure S1. Trend of the incidence rates of SUI, UUI and MUI with age.
Supplementary Material
Supplementary Material
Supplementary Material
Supplementary Material
Supplementary Material
Supplementary Material
Supplementary Material
Supplementary Material
Supplementary Material
Supplementary Material
Supplementary Material
Supplementary Material
Data Availability Statement
The data that support the findings of this study are available from the corresponding author upon reasonable request.