Abstract
The aim of this research was to investigate the effect of new, non-conventional starter culture on the kinetics of the lactose transformation during milk fermentation by kombucha, at pH 5.8; 5.4; 5.1; 4.8; and 4.6, at two different temperatures 37 °C and 42 °C. Milk fermentation at 42 °C lasted significantly shorter (about 5 h, 30 min) compared to the fermentation at 37 °C. Changes of lactose concentration at the both temperatures are consisting of two retaining stages and very steep decline in–between. The analysis of the rate curves showed that the reaction rate passes through the maximum after 9 h, 30 min at 37 °C and after 4 h at 42 °C. The sigmoidal saturation curve indicates a complex kinetics of lactose fermentation by kombucha starter.
Keywords: Kinetics, Kombucha, Lactose fermentation, Milk
1. Introduction
Kombucha is known as a symbiotic association of yeasts and acetic acid bacteria whose metabolic activities on sweetened tea produce a pleasant slightly sweet, slightly acidic refreshing beverage consumed world wide. The microbial composition of kombucha cannot be given because it depends on the culture origin. Novel research [1] has showed significant presence of lactic acid bacteria in kombucha. The major bacterial genus in 5 kombucha samples was Gluconacetobacter (over 85% in most samples) and Lactobacillus (up to 30%). Only trace populations of Acetobacter were detected (lower than 2%). Radulović et al. [2] also isolated and identificated lactic acid bacteria from kombucha tea.
Traditional substrate for the kombucha cultivation is black or green tea extract sweetened with 5%–8% sucrose. Besides traditional substrates, the possibilities of use of alternative substrates have been established in various studies [3–11]. Reiss [12] found that kombucha fermentation on other sugars (lactose, glucose or fructose) produced beverages slightly different in flavour but significantly different in ethanol and lactic acid quantity, compared to sucrose's sweetened tea. For example, fermentation on lactose gave extremely low quantities of ethanol in comparison to the fermentation on sucrose. Belloso Morales and Hernández-Sánches [13] successfully cultivated kombucha on cheese whey. Malbaša et al. [14] investigated the manufacture of milk-based beverages by application of kombucha starters cultivated on sweetened black and green tea, and top-inambur. Three different inoculums of kombucha starter: cultivated on black tea with addition of sucrose, concentrated by microfiltration and concentrated by evaporation were applied in functional fermented dairy beverages manufacture [15]. Iličić et al. [16] investigated fermentation of lactose from two types of milk, low fat and reduced fat, inoculated with kombucha starter. Milanović et al. [17] revealed that kombucha inoculums cultivated on different tea types could be used in combination with probiotic starter culture in fermented dairy products technology. Vukić et al. [18] also investigated the effect of kombucha starter culture on the rheological properties, texture and microstructure as well as on the protein fractions in different phases of milk fermentation.
Lactose is the main carbohydrate in dairy products. It is a unique disaccharide, composed of glucose and galactose, in the sense that it occurs exclusively in the milk of mammals [19]. Lactose plays an important role in the formation of the neural system and the growth of skin (texture), bone skeleton and cartilage in infants. It also prevents rickets and saprodontia [20]. Lactose fermentation by lactic acid bacteria is widespread in the production of fermented dairy products. In particular, lactose is the principal energy source for the bacteria in the starter culture, while casein, together with calcium and phosphorus gives rise to the basic structure of a gel structure [21]. In general, dairy starter cultures metabolize lactose either through the homo- or hetero-fermentative metabolic pathways. Lactose content is reduced during fermentation (by 20–30 g/100 g of the level in the original milk), while the concentration of lactic acid and some free amino acids increases, for example, proline, serine, alanine, valine, leucine, and histidine [22].
The biochemistry of kombucha fermentation was analysed using green and black teas by Kallel et al. [23]. They followed several biochemical markers of kombucha fermentation for a period of two weeks. The metabolism of carbon was targeted using sucrose, glucose, fructose, cellulose, ethanol and total acetic acid equivalents. Green and black teas exhibited similar kombucha fermentation profiles, but specific biochemical behaviours were observed as well. Lončar et al. [24] defined, by processing the experimental results, two mathematical models for the kinetics of sucrose fermentation by kombucha. It has been shown that both empirical models – one for the change of saccharose concentration during its fermentation, and the other for the rate of the mentioned fermentation, enable better insight into sucrose transformation.
There is no data in available literature about kinetics of lactose conversion during milk fermentation by kombucha starter. Therefore, the aim of this research was to determine the effect of non-conventional starter culture on the kinetics of the lactose transformation during milk fermentation by kombucha, at pH 5.8; 5.4; 5.1; 4.8; and 4.6, at two different temperatures 37 °C and 42 °C.
2. Experimental
2.1. Milk
Homogenized and pasteurized cow's milk from AD Imlek, Division Novi Sad Dairy, was used for the production of kombucha fermented milk products. The composition of milk was as follows: fat content – 2.0 g/100 g, total solids – 10.59 g/ 100 g, total proteins – 3.30 g/100 g and lactose – 4.60 g/100 g, ash 0.69 g/100 g.
2.2. Kombucha inoculum
Kombucha inoculum was prepared according to procedure published by Milanović et al. [25] (2002). Kombucha is cultivated on a black tea (Camellia sinensis – oxidized, 1.5 g/L) with sucrose concentration of 70 g/L. The tea was cooled to room temperature, after which inoculum from a previous fermentation was added in concentration of 10% (v/v). Incubation was performed at 25 °C for 7 days. Inoculum in concentration of 10% (v/v) was used for milk fermentation.
Local domestic Kombucha, used for the fermentation, contains at least five yeast strains (Saccharomycodes ludwigii, Saccharomyces cerevisiae, Saccharomyces bisporus, Torulopsis sp. and Zygosaccharomyces sp.) as determined by Markov et al. [26]. Total number of viable cells was as follows: approximately 5 × 10⁴ of yeast cells per mL of the reaction mixture and approximately 2 × 10⁵ of bacteria cells per mL of the mentioned mixture [24].
2.3. Samples production
Samples were obtained by addition of 30 mL of kombucha inoculum in 300 mL of milk at 42 °C and 37 °C simultaneously. Samples were taken at pH values: 5.8; 5.4; 5.1; 4.8 and 4.6.
2.4. Methods
2.4.1. pH values
The pH values were determined using a pH-metre (pH Spear, Eutech Instruments Oakton, UK).
2.4.2. Sugar content
The content of lactose and galactose at two temperatures were detected in all samples using specific enzymatic tests K-LACGAR 12/05 (lactose and d-galactose) purchased by Mega-zyme, Ireland. Products of the reactions were monitored using spectrophotometer (T80 + UV/VIS Spectrometer PG Instruments Ltd, UK).
2.4.3. HPLC analysis of lactic acid
Lactic acid content was determined according to the modified method of Jayablan et al. [27]. Four grams of samples were transferred into a 25 mL volumetric flask, 5 mL of bidestiled water was added and filled up with acetonitrile (Mallinckrodt Baker, Inc., Netherlands). The obtained solution was mixed for 5 min and then was filtered through membrane syringe filter (with diameter pore of 0.45 μm). Agilent 1100 system (USA) with C-8 column and UV–DAD detector was used for determination. The mobile phase was a mixture of 20 mM potassium dihydrogen phosphate, pH 2.4 and methanol (97:3). The flow rate and column temperature was maintained as 1.0 mL/ min and 28 °C, respectively. Detection was carried out at 220 nm. Lactic acid was used as a standard. Each sample was prepared and injected in triplicate.
2.4.4. Statistical analysis
Statistical analysis of results was carried out with the computer software program “Statistica 9” and results were expressed as average values with standard deviation.
3. Results and discussion
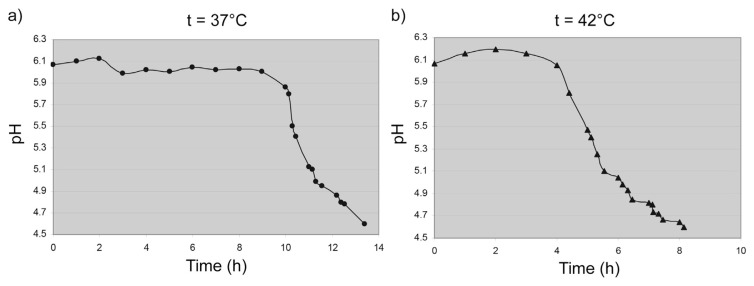
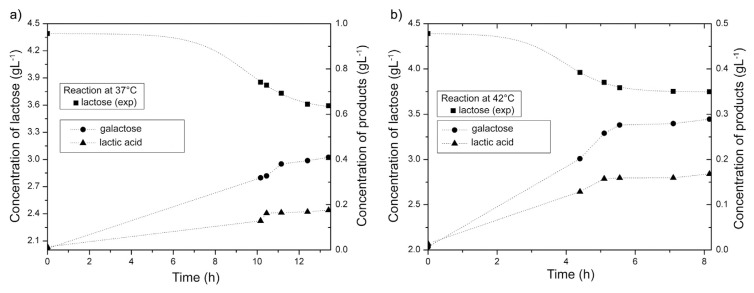
Milk fermentation process by kombucha, at two temperatures (37 and 42 °C) was followed through measuring of pH value (Fig. 1). Kinetics of lactose fermentation was examined through lactose transformation to products – galactose and lactic acid (Fig. 2). During the fermentation, the lactose is first converted into glucose and galactose which are further converted into other products such as pyruvic acid, lactic acid, carbon dioxide, water, ethanol and others, through a series of consecutive and parallel reactions [22,28]. Reaction mixture changes its qualitative and quantitative composition during the milk fermentation.
Fig. 1.
Change of pH during milk fermentation at a) 37 and b) 42 °C.
Fig. 2.
Kinetics of lactose fermentation as a function of temperature at a) 37 and b) 42 °C.
From Fig. 1 it is evident that the fermentation of milk at 37 °C lasted 13 h, 40 min and at 42 °C 8 h, 15 min. Therefore, milk fermentation at 42 °C lasted significantly shorter (about 5,5 h) compared to the fermentation at 37 °C. After 9 h from the start of fermentation at 37 °C the pH began to decline rapidly, almost linearly, and after 3 h achieved pH 4.95. Fermentation curve at 42 °C is characterized by a slight increase during the first 2 h (from the starting pH 6.07 to pH 6.2). The next 2 h, the pH value gradually decreased. Further decrease in pH value at both temperatures took place until the end of the fermentation. These results are in accordance with the results previously reported by Milanović et al. [25] and Milanović et al. [29].
Decrease of pH during the milk fermentation is a result of lactose transformation. Lactose molecules bind to the enzyme's active sites where they are transformed into glucose and galactose, which continued to convert to other products through a number of consecutive and parallel reactions. Seto et al. [30] have reported that Acetobacter strains, which are abundant in kombucha medium, consumed preferentially glucose to fructose as carbon source. In line with this, glucose is preferred to galactose as a carbon source by kombucha microflora. At the beginning of the process, lactose content was 4.39 g/100 g and further during the fermentation it decreased continuously. The best model to present the curve of fermentation change of lactose (as well as sucrose, researched by Lončar et al. [24]), is sigmoidal Boltzmann's function. Changes of lactose concentration at the both temperatures (37 and 42 °C) are consisting of two retaining stages and very steep decline in–between (Fig. 2). At 37 °C change in the lactose content is different from the reaction at 42 °C because it had a less pronounced lag phase at the end of the fermentation process. The phase of concentration decrease is between 7th and 12th hours at 37 °C and between 4th and 6th hours at 42 °C.
The best model to present the lactose concentration changes is Boltzmann's (sigmoidal) function:
| (1) |
where S denotes lactose concentration (g L−1), which changes in time t. Parameters A1 and A2 correspond to the positions of two asymptotes to the S(t) curve (upper and lower), to is the t-coordinate of the point at which the slope has the highest value, while Δt is the width of the step of an exponential decrease. Four parameters (A1, A2, to and Δt) were determined by applying the Levenberg–Marquardt method (ORIGIN 8.5) over the experimental data (Table 1). The achieved coefficients of determination are very high (R2 > 0.99), indicating a good fit of the data to the selected model within the whole interval of variable values.
Table 1.
Parameters of sigmoidal (Boltzmann) concentration model.
| Parameters in equation (1) | Investigated systems | |
|---|---|---|
|
| ||
| 37 °C | 42 °C | |
| A 1 | 4.3902 | 4.3918 |
| A 2 | 3.5520 | 3.7459 |
| t o | 9.4869 | 3.9375 |
| Δt | 1.2305 | 0.6747 |
| R 2 | 0.99759 | 0.99896 |
First derivative of the concentration equation (1) defines the rate of reaction:
| (2) |
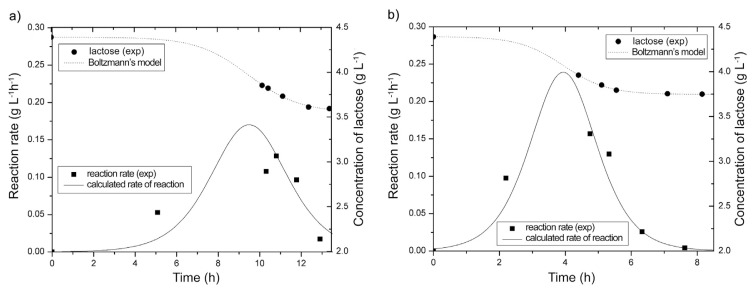
Since the derivative (2) is obtained analytically, its application does not cause any error in calculations. Derivatives, calculated from equation (2), are graphically presented in Fig. 3 as the rate curves, along with the S(t)-curves (experimental and estimated).
Fig. 3.
Reaction rate as a function of temperature: a) 37 °C and b) 42 °C (Lines show mathematical models, symbols present experimental values).
The analysis of the rate curves (Fig. 3) showed that the reaction rate passes through the maximum after 9 h, 30 min h at 37 °C and 4 h at 42 °C. After reaching the maximum, the reaction rate decreases rapidly, probably because of the suppression of metabolic activity of the present microorganisms due to the production of organic acids. Similar results were obtained by Chen and Liu [31] who investigated prolonged fermentation of sucrose by kombucha. The highest reaction rate (0.24 g/L h) of lactose transformation by kombucha starter was achieved in the system at 42 °C.
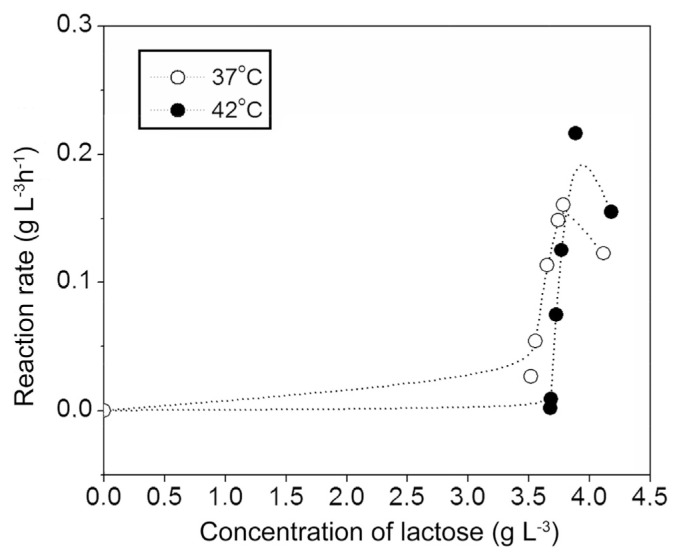
The saturation curves (reaction rates versus lactose concentration) are presented in Fig. 4. The saturation curves show sigmoidal kinetics at chosen substrate concentration, indicating a complex kinetics of lactose fermentation by kombucha starter.
Fig. 4.
Saturation curves – reaction rates versus lactose concentration.
4. Conclusion
Milk fermentation by kombucha at two temperatures, 37 and 42 °C, exhibited similar profiles but specific biochemical behaviours. The best model to present the curve of fermentation change of lactose is sigmoidal Boltzmann's function. Changes of lactose concentration at the both temperatures (37 and 42 °C) are consisting of two retaining stages and very steep decline in–between. At 37 °C change in the lactose content is different from the reaction at 42 °C because it has a less pronounced lag phase at the end of the fermentation. The saturation curves show sigmoidal kinetics at chosen substrate concentration, indicating a complex kinetics of lactose fermentation by kombucha starter.
Acknowledgements
Authors want to thank Ministry of Education, Science and Technological Development of Republic of Serbia for the financial support of research presented in this article, Project No. 46009.
Funding Statement
Authors want to thank Ministry of Education, Science and Technological Development of Republic of Serbia for the financial support of research presented in this article, Project No. 46009.
References
- 1. Marsh AJ, O'Sullivan O, Hill C, Paul Ross R, Cotter PD. Sequence–based analysis of the bacterial and fungal compositions of multiple kombucha (tea fungus) samples. Food Microbiol. 2014;38:171–8. doi: 10.1016/j.fm.2013.09.003. [DOI] [PubMed] [Google Scholar]
- 2. Radulović Z, Paunović D, Iličić M, Mirković N, Petrušić M, Obradović D. Promena mikroflore čajne gljeve tokom skladištenja fermentisanih mlecčnih napitaka. Prehrambena industrija Mleko i mlečni proizvodi. 2010;21(1–2):99–102. [Google Scholar]
- 3. Watawana MI, Jayawardena N, Gunawardhana CB, Waisundara VY. Enhancement of the antioxidant and starch hydrolase inhibitory activities of king coconut water (Cocos nucifera var. aurantiaca) by fermentation with kombucha 'tea fungus'. Int J Food Sci Technol. 2016;51:490–8. [Google Scholar]
- 4. Watawana MI, Jayawardena N, Waisundara VY. Enhancement of the functional properties of coffee through fermentation by “tea fungus” (kombucha) J Food Process Preserv. 2015;39:2596–603. [Google Scholar]
- 5. Lončar E, Malbaša R, Kolarov LI. Kombucha fermentation on raw extracts of different cultivars of Jerusalem artichoke. Acta Period Technol. 2007;38:37–44. [Google Scholar]
- 6. Malbaša R, Lončar E, Đurić M. Comparison of the products of Kombucha fermentation on sucrose and molasses. Food Chem. 2008;106:1039–45. doi: 10.1016/j.foodchem.2007.11.069. [DOI] [PubMed] [Google Scholar]
- 7. Yavari N, Mazaheri Assadi M, Larijani K, Moghadam MB. Response surface methodology for optimization of glucuronic acid production using kombucha layer on sour cherry juice. Aust J Basic Appl Sci. 2010;4(8):3250–6. [Google Scholar]
- 8. Velićanski A, Cvetković D, Markov S. Characteristics of kombucha fermentation on medical herbs from Lamiaceae family. Rom Biotech Lett. 2013;18:8034–42. [Google Scholar]
- 9. Vitas J, Malbaša R, Grahovac J, Lončar E. The antioxidant activity of kombucha fermented milk products with stinging nettle and winter savory. Chem Ind Chem Eng Q. 2013;19(1):129–39. [Google Scholar]
- 10. Jayabalan R, Malbaša R, Lončar E, Vitas J, Sathiskumar M. A review on kombucha tea – microbiology, composition, fermentation, beneficial effects, toxicity, and tea fungus. Compr Rev Food Sci Food Saf. 2014;13:538–50. doi: 10.1111/1541-4337.12073. [DOI] [PubMed] [Google Scholar]
- 11. Sun TY, Li JS, Chen C. Effects of blending wheat grass juice on enhancing phenolic compounds and antioxidant activities of traditional kombucha beverage. J Food Drug Anal. 2015;23:709–18. doi: 10.1016/j.jfda.2015.01.009. [DOI] [PMC free article] [PubMed] [Google Scholar]
- 12. Reiss J. Influence of different sugars on the metabolism of the tea fungus. Z Lebensm Unters Forsch. 1994;198:258–61. [Google Scholar]
- 13. Belloso–Morales G, Hernandez–Sanches H. Manufacture of a beverage from cheese whey using a tea fungus fermentation. Rev Latinoam Microbiol. 2003;45(1–2):5–11. [PubMed] [Google Scholar]
- 14. Malbaša R, Milanović S, Lončar E, Đurić M, Carić M, Iličić M, et al. Milk–based beverages obtained by Kombucha application. Food Chem. 2009;112:178–84. [Google Scholar]
- 15. Iličić M, Milanović S, Carić M, Đurić M, Tekić M, Vukić V, et al. Primena inokuluma čajne gljive u tehnologiji funkcionalnih fermentisanih mlečnih proizvoda. Prehrambena industrija Mleko i mlečni proizvodi. 2009;20(1–2):65–70. [Google Scholar]
- 16. Iličić M, Kanurić K, Milanović S, Lončar E, Đurić M, Malbaša R. Lactose fermentation by Kombucha – a process to obtain new milk–based beverages. Rom Biotech Lett. 2012;17(1):7013–21. [Google Scholar]
- 17. Milanović S, Kanurić K, Vukić V, Hrnjez D, Iličić M, Ranogajec M, et al. Physicochemical and textural properties of kombucha fermented dairy products. Afr J Biotechnol. 2012;11(9):2320–7. [Google Scholar]
- 18. Vukić V, Hrnjez D, Kanurić K, Milanović S, Iličić M, Torbica A, et al. The effect of kombucha starter culture on the gelation process, microstructure and rheological properties during milk fermentation. J Texture Stud. 2014;45:261–73. [Google Scholar]
- 19. Schaafsma G. Lactose and lactose derivatives as bioactive ingredients in human nutrition. Int Dairy J. 2008;18:458–65. [Google Scholar]
- 20. Emmett PM, Rogers IS. Properties of human milk and their relationship with maternal nutrition. Early Hum Dev. 1997;49:7–28. doi: 10.1016/s0378-3782(97)00051-0. [DOI] [PubMed] [Google Scholar]
- 21.Fuquay JW, Fox PF, McSweeney HPL. Encyclopedia of dairy science. 2nd ed. London: Academic Press Elsevier; 2011. [Google Scholar]
- 22.Tamime AY, Robinson RK. Yoghurt, science and technology. Cambridge, UK: Woodhead Publishing Ltd; 2004. [Google Scholar]
- 23. Kallel L, Desseaux V, Hamdi M, Stocker P, Ajandouz EH. Insights into the fermentation biochemistry of Kombucha teas and potential impacts of Kombucha drinking on starch digestion. Food Res Int. 2012;49:226–32. [Google Scholar]
- 24. Lončar E, Kanurić K, Malbaša R, Đurić M, Milanović S. Kinetics of saccharose fermantation by kombucha. Chem Ind Chem Eng Q. 2014;20(3):345–52. [Google Scholar]
- 25. Milanović S, Carić M, Lončar E, Panić M, Malbaša R, Dobrić D. Primena koncentrata čajne gljive u proizvodnji fermentisanih mlečnih napitaka. Prehrambena industrija Mleko i mlečni proizvodi. 2002;13(1–2):8–13. [Google Scholar]
- 26. Markov SL, Malbaša RV, Hauk MJ, Cvetković DD. Investigation of tea fungus microbe associations: I: the yeasts. Acta Period Technol. 2001;32:133–8. [Google Scholar]
- 27. Jayabalan R, Marimuthu S, Swaminthan K. Changes in content of organic acids and tea polyphenols during kombucha tea fermentation. Food Chem. 2007;102:392–8. [Google Scholar]
- 28.Surono S, Hosono A. Fermented milks – types and standards of identity. In: Fuquay JW, editor. Encyclopedia of dairy sciences. 2nd ed. London: Elsevier; Academic Press; 2011. pp. 470–6. [Google Scholar]
- 29. Milanović S, Lončar E, Đurić M, Malbaša R, Tekić M, Iličić M, et al. Low energy kombucha fermented milk-based beverages. Acta Period Technol. 2008;39:37–46. [Google Scholar]
- 30. Seto A, Kojima Y, Tonouchi N, Tsuchida T, Yoshinaga F. Screening of bacterial cellulose-producing Acetobacter strains suitable for sucrose as a carbon source. Biosci Biotechnol Biochem. 1997;61:735–6. [Google Scholar]
- 31. Chen C, Liu BY. Changes in major components of tea fungus metabolites during prolonged fermentation. J Appl Microbiol. 2000;89:834–9. doi: 10.1046/j.1365-2672.2000.01188.x. [DOI] [PubMed] [Google Scholar]


