

Abstract
Background
Chronic jet lag (CJL)‐induced circadian rhythm disruption (CRD) is positively correlated with an increased risk of allergic diseases. However, little is known about the mechanism involved in allergic rhinitis (AR).
Methods
Aberrant light/dark cycles‐induced CRD mice were randomly divided into negative control (NC) group, AR group, CRD+NC group, and CRD+AR group (n = 8/group). After ovalbumin (OVA) challenge, nasal symptom scores were recorded. The expression of Occludin and ZO‐1 in both nasal mucosa and lung tissues was detected by reverse transcription–quantitative polymerase chain reaction (RT‐PCR) and immunohistochemical staining. The level of OVA–specific immunoglobulin E (sIgE) and T‐helper (Th)‐related cytokines in the plasma was measured by enzyme‐linked immunosorbent assay (ELISA), and the proportion of Th1, Th2, Th17, and regulatory T cell (Treg) in splenocytes was evaluated by flow cytometry.
Results
The nasal symptom score in the CRD+AR group was significantly higher than those in the AR group with respect to eosinophil infiltration, mast cell degranulation, and goblet cell hyperplasia. The expression of ZO‐1 and Occludin in the nasal mucosa and lung tissues in the CRD+AR group were significantly lower than those in the AR group. Furthermore, Th2 and Th17 cell counts from splenocytes and OVA‐sIgE, interleukin 4 (IL‐4), IL‐6, IL‐13, and IL‐17A levels in plasma were significantly increased in the CRD+AR group than in the AR group, whereas Th1 and Treg cell count and interferon γ (IFN‐γ) level were significantly decreased in the CRD+AR group.
Conclusion
CRD experimentally mimicked CJL in human activities, could exacerbate local and systemic allergic reactions in AR mice, partially through decreasing Occludin and ZO‐1 level in the respiratory mucosa and increasing Th2‐like immune response in splenocytes.
Keywords: allergic rhinitis, circadian rhythm disruption, Th17, Th2, tight junction
1. INTRODUCTION
Allergic rhinitis (AR) has developed into a global concern and affected 10% to 40% of the world population. 1 Numerous studies have indicated that the increased incidence of AR is associated with social stress and western lifestyle. 2 , 3 The misalignment between the endogenous biological clock and the individual's daily activities in modern society, such as artificial light during the long night, shift work, or travel across time zones, might influence and alter the process of allergy. 4 , 5 However, the correlation between circadian rhythm disruption (CRD) and AR response is poorly understood.
Light is one of the major environmental time cues for circadian entrainment. 2 , 4 Natural light activates central oscillation located in the hypothalamic suprachiasmatic nuclei (SCN) in the retinohypothalamic tract, followed by synchronization with rhythmic activities of peripheral oscillation in some target organs, such as skin, nose, lung, and gastrointestinal tract, via the neural‐humoral pathway. 6 , 7 , 8 A series of clock‐controlled genes, including Clock, Bmal1, Per, Cry, and Rev‐erbα, are distributed in the SCN and peripheral tissues. 2 Especially, this autonomous cellular mechanism regulates the periodic fluctuation in several physiological and pathological processes. 4 Nevertheless, the time phase shift between natural light exposure and artificial light utilization in daily life induces the CRD. 2 , 3 , 4 An epidemiological study revealed that persons with aberrant circadian rhythms from sleep disturbances or who do shift work encounter new health threats from many allergic and metabolic diseases. 4 , 5
AR is defined as predominant T helper 2 (Th2) cell responses resulting in the production of interleukin 4 (IL‐4), IL‐5, and IL‐13, accompanied by epithelium barrier dysfunction, immunoglobulin E (IgE) production, eosinophil (EOS) infiltration, mast cell (MC) degranulation, and goblet cell hyperplasia. 7 , 9 Clinically, nasal symptoms in AR patients exhibited time‐of‐day‐dependent variations and the number of EOSs and MCs in nasal secretions displayed rhythmic patterns, suggesting a biological clock that modulates the neural‐immuno‐humoral mechanism of AR. 10 Recent findings indicated that clock genes exist in human and mouse nasal mucosa that drive temporal nasal cycle activities in AR. 7 , 11 However, the effect of CRD on the epithelial barrier function and inflammatory response in AR is poorly understood.
A previous study has reported that food allergy (FA) incidence in the nurses with day/night‐shift rotation was significantly higher than in those with non‐day/night‐shift rotation. 12 Another experimental study demonstrated that environmental CRD due to chronic jet lag (CJL) worsen asthma‐like symptoms caused by Sendai virus (SeV) and influenza A virus in mice in comparison to the mice maintained under standard 12‐h:12‐h light/dark condition. 13 Accumulating evidence supports that the circadian regulation of intestinal permeability and tight junctions (TJs) is inversely affected by the rhythmic secretion of Th2‐like cytokines. 14 , 15 In addition, altered circadian clock (ACC) downregulates TJs levels and compromises epithelial barrier integrity in the intestine, thereby facilitating the initiation of FA. 12 , 15 Furthermore, nasal epithelial barrier dysfunction was consistent with low Occludin and Zonula occludens‐1 (ZO‐1) expression (the key components of airway epithelial TJs) in house dust mite (HDM)‐induced AR patients, whereas IL‐4 impairs epithelial integrity in vitro and deteriorates the immune response. 16 Therefore, we hypothesized that light‐induced CRD decreases the local TJs expression in respiratory mucosa and strengthens the overall Th2 and Th17 response to exacerbate allergic airway inflammation in the development of AR.
Our preliminary studies demonstrated that clock gene Per2 regulates daily attacks of nasal symptoms through the circadian modulation of Th2‐specific and Th17‐specific transcription factors in an AR mouse model. 7 However, the mechanism underlying CRD on AR is yet to be elucidated. Therefore, the present study established an exogenous light‐induced CRD mouse model to investigate the effect of CRD on allergic symptoms and explore the potential mechanisms.
2. MATERIALS AND METHODS
2.1. Animals
A total of 48 healthy male Balb/c mice, aged 6 weeks (body weight ∼18 g), were obtained from the Experimental Animal Center of Shanxi Medical University (Taiyuan, China). Mice were housed in a specific pathogen‐free atmosphere with ad libitum access to chow and water. The humidity of the rearing environment was 35% ± 5%, and the ambient temperature was 22.5°C ± 1.5°C. All animals were housed under a standard 12‐h:12‐h light/dark cycle (The light was on at 6:00 a.m. and off at 6:00 p.m.) to acclimatize to the environment for 1 week before subject to modeling. The experimental design was reviewed and approved by the Institutional Animal Care and Use Committee at Shanxi Medical University (approval no. 15657), and all the experiments were performed according to the Regulations on the Administration of Experimental Animals of the State Science and Technology Commission and the Guide for the Care and Use of Laboratory Animals (Institutional Animal Care and Use Committee, Shanxi Medical University).
2.2. CRD model and grouping
After acclimatization, mice were subjected to weekly 8‐h phase advances for 3 consecutive weeks to establish light‐induced CJL as CRD mouse model analogs, as described. 13 First, all untreated mice were equally and randomly divided into A and B groups. Then, group A was subjected to a 12‐h:12‐h light/dark cycle when the light turned on at 6:00 a.m. (corresponding to Zeitgeber time 0 [ZT0]) and turned off at 6:00 p.m. (corresponding to ZT12). Moreover, group B was subjected to a 8‐h:16‐h light/dark cycle for 7 consecutive days when the light turned on at 10:00 p.m. (ZT16) and turned off at 6:00 a.m. (ZT24) on the Monday of week 2, with the light on at 2:00 p.m. (ZT8) and off at 10:00 p.m. (ZT16) at week 3, and with the light on at 6:00 a.m. (ZT0) and off at 2:00 p.m. (ZT8) at week 4. After the final day of week 4, the mice (n = 8 per group) from groups A and B were randomly selected and euthanized either at ZT0 or ZT12, whereas a series of clock genes (Clock, Bmal1, Per2, and Rev‐erbα) from both SCN and nasal mucosa tissue in each mouse were compared and analyzed using real‐time polymerase chain reaction (RT‐PCR). Because ZT0 and ZT12 represent the acro‐phase or bathy‐phase for the core clock genes, we selected the two time points to confirm the CRD model (Figure 1A,B).
FIGURE 1.
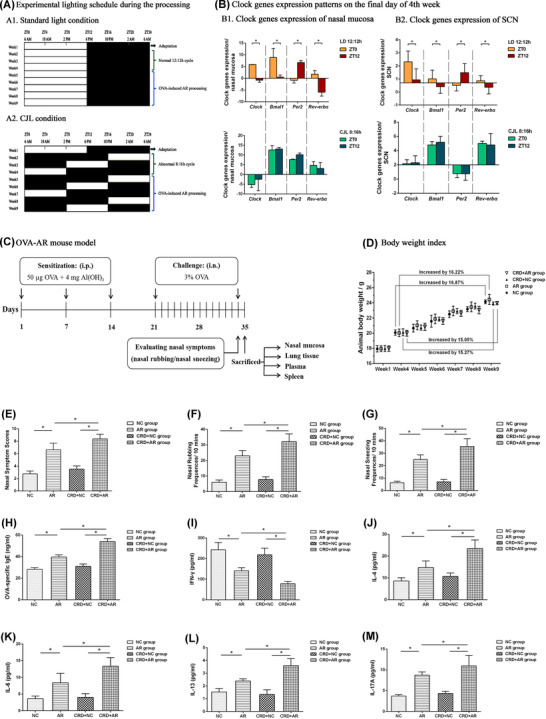
Establishment and evaluation of CRD and AR mouse models. (A) Experimental lighting schedule during the process. (A1) Standard 12‐h:12‐h light/dark cycles. (A2) Aberrant 8‐h:16‐h CJL cycles. After 1‐week adaptation, mice were housed under standard light condition (A1) or CJL condition (A2) for 3 consecutive weeks. On day 1 of week 5, OVA‐sensitized AR mouse models were induced and established. (B) The core clock gene expression patterns on the final day of week 4. To evaluate the CRD mouse model, the expression of various clock genes at ZT0 or ZT12 for untreated mice under (A1) or (A2) were detected by RT‐PCR (n = 4 per group). (B1) Clock genes expression of nasal mucosa. (B2) Clock genes expression of SCN. (C) Protocol for OVA‐induced AR mouse model. Mice in both AR and CRD+AR groups were sensitized with 50 μg OVA + 4 mg Al(OH)3 on days 1, 7, and 14. From days 21−34, mice were challenged intranasally daily with 3% OVA solution in PBS (50 μl per nostril). PBS was used instead of OVA in both NC and CRD+NC groups. (D) The body weight changes during the experimental process (n = 8 per group). (E–G) Nasal symptom scores over 10 min were recorded after final OVA challenge. The data showed that nasal symptom scores in the CRD+AR group were significantly higher than those in the AR group (E), with markedly increased nasal rubbing (F) and nasal sneezing (G) in the CRD+AR group as compared with the AR group (n = 8 per group). (H–M) Levels of plasma OVA‐sIgE and Th‐specific cytokines in mice were measured by ELISA. The data showed that the levels of plasma OVA‐sIgE (H), IL‐4 (J), IL‐6 (K), IL‐13 (L), and IL‐17A (M) in the CRD+AR group were significantly higher than those in the AR group, whereas the level of plasma IFN‐γ (I) in the CRD+AR group was significantly lower than that in the AR group (n = 8 per group). Values are expressed as the mean ± standard deviation; *p < 0.05. Abbreviations: AR, allergic rhinitis; CRD, circadian rhythm disruption; NC, negative control
After evaluating the CRD animal model, the rest of mice from group A were randomly divided into negative control (NC) group and AR group as a positive control that were maintained under normal lighting conditions, whereas the rest of mice from group B were randomly divided into CRD+NC group and CRD+AR group with abnormal CJT lighting condition. Subsequently, the ovalbumin (OVA)‐sensitized AR animal model was established (Figure 1C). The body weight was monitored regularly once a week. During the whole process, the daily behavior and activities in each mouse was observed and recorded (Figure 1D).
2.3. Establishment of OVA‐sensitized AR mouse model
On day 1 of week 5, mice were immunized and challenged with OVA (Sigma‐Aldrich, St. Louis, MO, USA), according to our previously described method. 7 Briefly, mice in both AR and CRD+AR group were intraperitoneally injected with 50 μg OVA in phosphate‐buffered saline (PBS) mixed with an equal volume of 4 mg/ml aluminum hydroxide gel (Sigma‐Aldrich) as an adjuvant in a total volume of 1 ml on days 1, 7, and 14, respectively. This was followed by the intranasal administration of 3% OVA solution in PBS into the bilateral nasal cavity daily for 14 consecutive days (days 21−34). PBS alone was administered as a control for both the NC and CRD+NC groups.
2.4. Standard scoring methods for nasal symptoms
After the final OVA challenge, the local nasal excitation in each mouse was recorded at a 10‐min interval by using a video camera under an infrared lamp to avoid light‐induced circadian time phase advance or delay. In addition, the frequencies of nasal sneezing and rubbing were counted by blinded investigators in order to reduce the experimental error. The AR mouse model was successfully established and evaluated according to the standard scoring system in Table 1. A superposition method was used to obtain total scores, and a mean score of five or more points was considered to indicate that the mouse had AR. 17
TABLE 1.
Standard scoring system for evaluating nasal symptoms
| Symptoms score | Nasal rubbing | Runny nose | Nasal sneezing |
|---|---|---|---|
| 1 | Lightly scratching the nose | Flow to the nostrils | 1–3 times |
| 2 | Continuously scratching the nose and face | Flow beyond the nostrils | 4–10 times |
| 3 | Frequently scratching the nose and all over the body | Flow to the lips | >11 times |
2.5. Histology
On the next day, mice were decapitated, and the skin was removed between ZT10 and ZT12. The nasal mucosa and lung tissues were isolated and then fixed with 4% paraformaldehyde for 48 h at room temperature. The specimens were embedded in paraffin and sliced at a thickness of 4 μm. A graded series of ethanol was used for dehydration, followed by staining the sections with hematoxylin and eosin (H&E), toluidine blue, periodic acid Schiff (PAS), and immunohistochemical (IHC) staining, respectively. 7 , 18 Five fields were selected randomly, whereas EOS, MC, and goblet cell numbers in each field (magnification, ×400) were counted using CaseViewer software (3D Histech, Israel). In addition, the optical density of anti‐Occludin and anti‐ZO‐1‐positive cells was analyzed through the ImageJ software system (NIH, Bethesda, MD, USA; http://imagej.nih.gov/ij/).
2.6. RT‐PCR
On the final day of week 4, nasal mucosa tissues derived from the untreated mice in groups A and B were randomly removed either at ZT0 or ZT12 to detect the diurnal variation of clock genes by RT‐PCR. Total RNA was prepared from SCN and nasal mucosa tissues using an RNAiso Plus kit (TaKaRa, Shiga, Japan). Then, complementary DNA (cDNA) was synthesized in a 10‐μl reaction using 5X PrimeScript RT Master Mix (TaKaRa) Clock, Bmal1, Per2, Rev‐erbα, and β‐actin were amplified in MicroAmp optical 96‐well reaction plates (Applied Biosystems, Foster City, CA, USA) on an ABI PRISM 7500 system, according to the manufacturer's instructions (Applied Biosystems).
When OVA or PBS challenge was finished,nasal mucosa and lung tissues derived from the treated mice in NC, AR, CRD+NC, and CRD+AR groups were collected and prepared to detect the TJs expression of ZO‐1 and Occludin messenger RNA (mRNA) by RT‐PCR. The transcript levels of target genes were normalized to the housekeeping gene β‐actin using the delta‐dalta threshold cycle (∆∆Ct) method. The mRNA levels were quantified using the specific primers listed in Table 2.
TABLE 2.
Primer sequences used for real‐time RT‐PCR determinations
| Primer sequence | ||
|---|---|---|
| Gene (species) | Forward | Reverse |
| Clock1 (mus) | 5′‐CGCTCCCGTGAAAGAAAAGC‐3′ | 5′‐GCCGTCTTCTGTGTGACTGA‐3′ |
| Bmal1 (mus) | 5′‐AATGGCGGACCAGAGAATGG‐3′ | 5′‐TGCATATTCTAACTGGTAGTCAGTG‐3′ |
| Per2 (mus) | 5′‐AGTGAGCAGTCTGCCAAAGC −3′ | 5′‐ CCTCATTAGCCTTCACCTGCT‐3′ |
| Rev‐erbα (mus) | 5′‐ TTCGGAGGAGCATTCAGCAA −3′ | 5′‐ GGCCAAATCGAACAGCATCTC −3′ |
| Occludin (mus) | 5′‐GTCCTCCTGGCTCAGTTGAA‐3′ | 5′‐AGATAAGCGAACCTGCCTCG‐3′ |
| ZO‐1 (mus) | 5′‐GATGTTTATGCGGACGGTGG‐3′ | 5′‐CATTGCTGTGCTCTTAGCGG‐3′ |
| β‐actin (mus) | 5′‐AGATCAAGATCATTGCTCCTCCT‐3′ | 5′‐ACGCAGCTCAGTAACAGTCC‐3′ |
Abbreviations: mus, Mus musculus; Per, Period; RT‐PCR, real‐time polymerase chain reaction; ZO‐1, zonula occludens‐1.
2.7. Measurement of OVA‐specific IgE level and Th‐related cytokines concentration
Blood samples were collected in ethylenediamine tetraacetic acid (EDTA)‐containing tubes through cardiac puncture under general anesthesia, and plasma was obtained by centrifugation for 15 min at 1000g and stored at −80°C until use. The plasma levels of OVA‐specific IgE were measured using a 96‐well microplate and enzyme‐linked immunosorbent assay (ELISA) kits (OVA‐specific IgE; BlueGene, Shanghai, China), whereas the plasma levels of cytokines, including interferon γ (IFN‐γ), interleukin 4 (IL‐4), IL‐6, IL‐13, and IL‐17A, were detected using ELISA kits (Abcam, Beijing, China), according to the manufacturer's instructions. The absorbance was measured at 450 nm on an ELISA reader (Cytation3; BioTek, Winooski, VT, USA).
2.8. Isolation and culture of splenocyte
The spleens were removed aseptically under ice‐chilled conditions and isolated using a mouse splenocyte separator kit (Solarbio, Beijing, China). Briefly, samples diluted in PBS (1:1, vol/vol) were layered onto low‐gradient splenocyte separator solution (1:3, vol/vol) and harvested by centrifugation at 800g for 20 min. The interface between the diluent and transparent separator solution containing splenocytes was then collected, followed by centrifugation at 100g for 5 min and washed twice with sterile PBS. The cells were in a 24‐well plate at a density of 1 × 10⁶ cells/well in RPMI‐1640 (Gibco, Gaithersburg, MD, USA) containing 10% fetal bovine serum (Gibco) with penicillin‐streptomycin (Gibco), and cultured for 18 h at 37°C in a humidified atmosphere of 5% CO2.
2.9. Flow cytometric analysis of Th1, Th2, Th17, and Treg proportion
For cell‐surface staining, splenocytes were stained with phycoerythrin (PE)‐cyanine5‐labeled anti‐mouse CD4 antibody (eBioscience, San Diego, CA, USA) and PE‐labeled anti‐mouse CD25 antibody (eBioscience). For intracellular staining, the cells were fixed and permeabilized using a fixation/permeabilization solution kit (eBioscience), followed by incubation with a PE‐labeled anti‐mouse IL‐4 antibody (eBioscience), a flourescein isothiocyanate (FITC)‐labeled anti‐mouse IFN‐γ antibody (eBioscience), an allophycocyanin (APC)‐labeled anti‐mouse IL‐17A antibody (eBioscience), and a FITC‐labeled anti‐mouse Foxp3 antibody (eBioscience), according to manufacturer instructions. Flow cytometric data for Th1 (CD4+IL‐4+T cells), Th2 (CD4+IFN‐γ+T cells), Th17 (CD4+IL‐17A+T cells), and Treg cells (CD4+CD25+Foxp3+T cells) were analyzed by flow cytometry (FACS Calibur; BD, USA).
2.10. Statistical analysis
The data are presented as the mean ± standard deviation (SD). SPSS, version 20 (IBM, Armonk, NY, USA) was used for data analyses. Measurement data with normal distribution in both groups were compared using an unpaired Student's t test. Measurement data without normal distribution in either or neither of the two groups was conducted using nonparametric Mann‐Whitney U test. p < 0.05 was considered statistically significant.
3. RESULTS
3.1. Evaluation of the CRD mouse model
On the last day of week 4 the core clock genes, including Clock, Bmal1, Per2, and Rev‐erbα from both SCN and nasal mucosa tissues in the untreated mice from group A or group B, were detected by RT‐PCR. The expression of clock genes in group A under normal 12‐h:12‐h condition exhibited circadian fluctuation, with a peak in Clock, Bmal1, and Rev‐erbα mRNA expression at ZT0 (6:00 a.m.) and with the nadir at ZT12 (6:00 p.m.); however, the effect was opposite with the nadir of Per2 mRNA expression at ZT0 and peak of that at ZT12. Nevertheless, the expression of these genes lost rhythm in group B under abnormal 8:16 h‐advanced CJL condition, thus suggesting that aberrant light‐dark cycles could induce and establish a CRD animal model (Figure 1B).
In addition, behavioral tests showed that nocturnal activities in mice in both CRD+NC and CRD+AR groups disappeared gradually, and diurnal activities increased from the beginning of week 5 due to rhythmic alteration of locomotor activity in the observation period as compared to the animals in the NC and AR groups. With the delay in the modeling time, these behavioral characteristics became obvious, indicating that light‐induced CRD apparently influenced the daily activities and mental behavior.
To further identify the effect of CRD on the treated mice, the body weight was recorded at week 4. After establishing the OVA‐AR model at the end of week 9, the body weight in the NC and the AR groups increased by 16.87% and 16.22%, respectively, whereas that in the CRD+NC and CRD+AR groups increased by 15.27% and 15.05%, respectively. These data suggested that the circadian environmental disruption of CJL had a negative effect on the body weight gain in mice (Figure 1D).
3.2. Influence of CRD on allergic symptoms after OVA sensitization
After intranasal administration, the incidence of nasal rubbing and sneezing in each mouse increased significantly in both AR and CRD+AR groups, whereas the total nasal symptom score was >5 points, indicating that OVA‐induced AR models were established successfully (p < 0.05).
As shown in Figure 1E–G, the score of the NC group was 2.75 ± 0.46 and that of the CRD+NC group was 3.50 ± 0.53; however, no significant difference was detected between the two groups. The score of 6.63 ± 1.06 in the AR group was significantly lower than 8.38 ± 0.74 in the CRD+AR group, with a marked increase in the frequency of nasal rubbing and sneezing in the CRD+AR group (p < 0.01). The data demonstrated that CRD aggravated the nasal allergic symptoms in AR mice.
3.3. Pathological features of respiratory mucosa tissues
The leukocyte infiltration and mucus secretion in the nasal mucosa are hallmarks of AR. In order to substantiate the influence of CRD on the local immune response, respiratory mucosa tissues were collected from treated mice and examined using histological staining. As shown in Figures 2A–F and 3A–F, a large number of inflammatory cells, including EOS infiltration, MC degranulation, and goblet cell hyperplasia, were observed in both nasal mucosa and lung tissues in the OVA‐induced AR mice as compared to those in the control mice (p < 0.01). The number of EOSs in the nasal mucosa in the CRD+AR group was significantly higher than that in the AR group (p < 0.01), whereas that in the lung tissues was similar in both groups (p > 0.01). On the other hand, the number of MCs and goblet cells in both nasal mucosa and lung tissues were significantly increased in the CRD+AR group than that in the AR group (all p < 0.01). In addition, these inflammatory cells were only slightly increased in the CRD+NC group as compared to the NC group, albeit with no significant difference.
FIGURE 2.
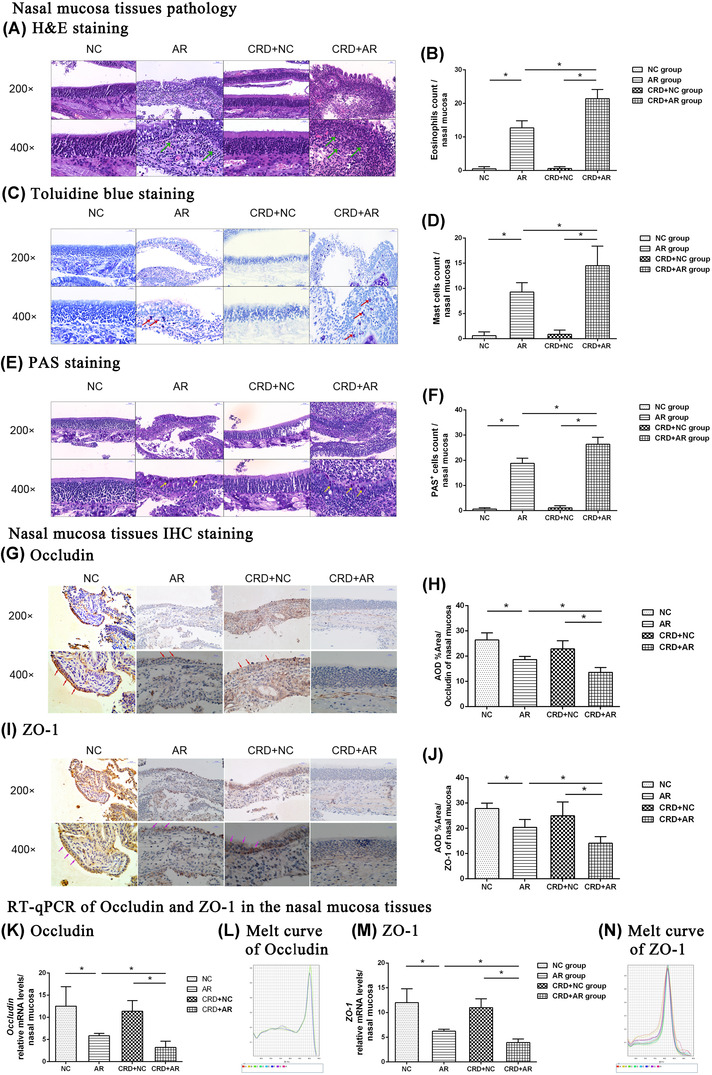
Histological analysis of nasal mucosa tissues was performed by H&E, Toluidine blue, and PAS staining (magnification, ×200, ×400), while TJ expression of Occludin and ZO‐1 from nasal mucosa tissues was detected by RT‐PCR and IHC staining. The green (A), red (C), and yellow (E) arrows indicate EOS, MC, and goblet cell, respectively. The number of EOS (B), MC (D), and goblet cells (F) at magnification ×400 was counted, respectively. In addition, the nasal epithelial cell membrane stained in brown was recorded as positive immunostaining. The red arrows (G) indicate anti‐Occludin‐positive cells, whereas the purple arrows (I) indicate anti‐ZO‐1‐positive cells in the pathological sections. The data showed that Occludin and ZO‐1 mRNA (K, L; M, N) and protein (H, J) expression in the CRD+AR group was significantly lower than that in the AR group. Values are expressed as the mean ± standard deviation (n = 8 per group); *p < 0.05. Abbreviations: AR, allergic rhinitis; CRD, circadian rhythm disruption; NC, negative control; EOS, eosinophil; MC, mast cell; TJ, tight junction; ZO‐1,‐zonula occludens‐1
FIGURE 3.
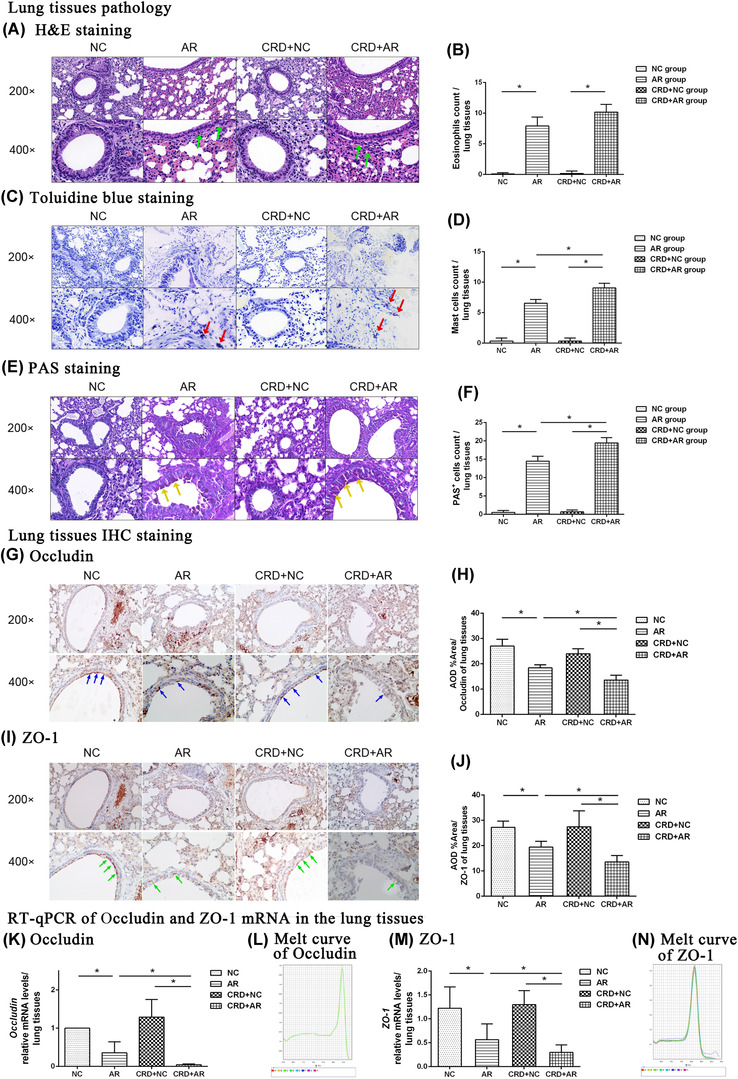
Histological analysis of lung tissues was performed by H&E, Toluidine blue, and PAS staining (magnification, ×200, ×400), while TJ expression of Occludin and ZO‐1 from lung tissues was detected by RT‐PCR and IHC staining. The green (A), red (C), and yellow (E) arrows indicate EOSs, MCs, and goblet cells, respectively. The number of EOS (B), MC (D), and goblet cells (F) under ×400 magnification was counted, respectively. Moreover, the bronchial epithelial cell membrane stained in brown was recorded as positive immunostaining. The blue arrows (G) indicate anti‐Occludin‐positive cells, whereas the green arrows (I) indicate anti‐ZO‐1‐positive cells in the serial pathological sections. The data showed that Occludin and ZO‐1 mRNA (K, I; M, N) and protein (H, J) expression in the CRD+AR group decreased significantly as compared to that in the AR group. Values are expressed as the mean ± standard deviation (n = 8 per group); *p < 0.05. Abbreviations: AR, allergic rhinitis; CRD, circadian rhythm disruption; NC, negative control; EOS, eosinophil; MC, mast cell; TJ, tight junction; ZO‐1, zonula occludens‐1
3.4. Measurement of airway epithelial barrier dysfunction in mice
To further evaluate the effect of CRD on mucosal permeability, we measured the levels of Occludin and ZO‐1 expression in both nasal mucosa and lung tissues by different methods. As shown in Figures 2G–N and 3G–N, Occludin and ZO‐1 expression in the airway mucosa in both AR and CRD+AR groups decreased significantly in comparison to the NC and CRD+NC groups, indicating that the increased mucosal permeability after OVA challenge was associated with severe rhinorrhea in the pathogenesis of AR (p < 0.01). Moreover, the expression of Occludin and ZO‐1 from both nasal mucosa and lung tissues in the CRD+AR group was significantly lower than that in the AR group (all p < 0.01). However, the expression of Occludin and ZO‐1 in the CRD+NC group was slightly lower than that in the NC group, but not significantly. These findings indicated that CRD could exacerbate nasal inflammatory response by disrupting respiratory airway epithelial barrier integrity.
3.5. Effect of CRD on OVA‐sIgE and cytokine concentration in plasma
To further determine the effect of CRD on the systemic immune response, the level of OVA‐sIgE and T‐cell cytokines in plasma were measured. As shown in Figure 1H–M, the levels of OVA‐s IgE and Th2‐associated cytokines (IL‐4, IL‐6, IL‐13, IL‐17A) were significantly upregulated in OVA‐induced AR mice as compared to those in both NC and CRD+NC groups (all p < 0.01), suggesting that Th2‐like (Th2‐dominated and Th17‐dominated) immune response play a critical role in the development of OVA‐sensitized AR. In addition, the plasma OVA‐sIgE concentration 53.93 ± 2.80 ng/ml in the CRD+AR group was significantly higher than that 39.59 ± 2.02 ng/ml in the AR group (p < 0.01); however, no significant difference was detected between the CRD+NC and NC groups. Moreover, the levels of Th2‐associated cytokines IL‐4, IL‐6, IL‐13, and IL‐17A in the CRD+AR group increased significantly as compared to those in the AR group (p < 0.05), whereas the level of Th1‐associated cytokine IFN‐γ in the CRD+AR group decreased significantly as compared to that in the AR group (p < 0.05). The levels of Th2‐associated cytokines showed a slight increase and the level of Th1‐associated cytokine showed a slight decrease in the CRD+NC group as compared to the NC group, albeit not significantly.
3.6. Effect of CRD on Th1, Th2, Th17, and Treg proportion in splenocytes
Next, the Th1 cells (CD4+IL‐4+T cells), Th2 cells (CD4+IFN‐γ+T cells), Th17 cells (CD4+IL‐17A+T cells), and Treg cells (CD4+CD25+Foxp3+T cells) were isolated from the spleen, and the proportion of these cells were measured by flow cytometry (Figure 4).
FIGURE 4.
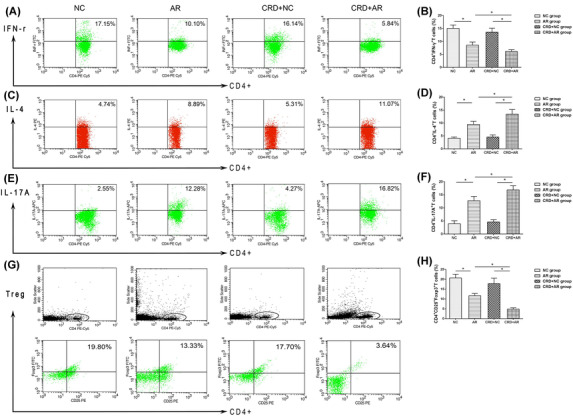
Proportions of Th1, Th2, Th17A and Treg cells derived from splenocytes were detected by flow cytometry. Treg cells represent CD4+ CD25+Foxp3+T cells. Flow cytometric image of Th1 cells (A), Th2 cells (C), Th17A (E) and Treg cells (G) were analyzed. The data indicated that the percentage of Th2 cells (D) and Th17A cells (F) in the CRD+AR group was significantly higher than that in the AR group, whereas that of Th1 (B) and Treg (H) cells in the CRD+AR group was significantly lower than that in the AR group, but no significant difference was observed in both NC and CRD+NC groups. Values are expressed as the mean ± standard deviation (n = 8 per group); *p < 0.05. Abbreviations: AR, allergic rhinitis; CRD, circadian rhythm disruption; NC, negative control.
The proportion of Th2 and Th17 cells were significantly upregulated, and the proportion of Th1 and Treg cells were significantly downregulated in OVA‐induced AR mice (p < 0.01). Supposedly, the number of Th2 cells and Th17 cells was significantly higher in the CRD+AR group than that in the AR group (p < 0.01), whereas the number of Th1 cells was significantly lower in the CRD+AR group than that in the AR group (p < 0.01). In addition, in splenocyte CD4+T cells, the proportion of Treg cells 4.85% ± 0.66% in the CRD+AR group was significantly lower than that 11.66% ± 1.12% in the AR group (p < 0.01). Interestingly, the proportion of Th2 cells and Th17 cells was increased slightly in the CRD+NC group, whereas the proportion of Th1 cells and Treg cells decreased slightly in the CRD+NC group, but no significant difference was detected in these Th cells as compared to the NC group.
4. DISCUSSION
The 2017 Nobel Prize for Physiology or Medicine was awarded to three American scientists for their discoveries in the genetic and molecular mechanisms underlying the biological clock in the organisms. 19 Typically, the circadian clock drives a wide variety of physical activities in humans, such as wake‐sleep cycle, hormone secretion, body temperature, and food intake. 20 The integrated advantage of the biological clock system is to align the internal clock activity with external environmental conditions based on the circadian time phase advance or delay, thus allowing flexibility and adaptation to the 24‐h changes in the environment. 20 , 21 However, modern lifestyle in the real world, including overtime work, shift work, light exposure at night, and irregular eating habits, cause circadian desynchrony from physiology to pathology. 4 , 5 The disrupted circadian rhythms have negatively impacted human health and a highly increased risk of metabolic and allergic diseases. 5 , 12 However, the precise mechanism associated with CRD and AR is yet unclear.
In the present study, we induced and established the CRD mouse model by weekly 8‐h advance, experimentally mimicking the common CJL phenomena in modern society. 13 These results demonstrated that CJL aggravates the murine AR process by lowering the expression of local TJs in the upper and lower respiratory mucosa and strengthening systemic Th2‐like immune response in the spleen tissue. The experimental animal models to identify the organization of the mammalian circadian system from molecules to physiology helped to understand how CRD works on AR response, further implying that allergic diseases associated with circadian disruption and immune deviation in modern lifestyle can be treated by organized working schedules and chrono‐medical strategy.
It is well known that light is the most potent environmental regulator, and an abnormal light period influences the sleep/wake cycles, thereby disrupting the circadian rhythm. 7 , 8 In natural conditions, the SCN subsequently resets and synchronizes peripheral clocks via the rhythmic release of neuronal‐hormonal mediators, primarily using the hypothalamic‐pituitary‐adrenal (HPA) axis and the autonomic nervous system. 3 The primary clock genes, Clock, Bmal1, Per2, and Rev‐erbα, showed a temporal pattern in mice under normal 12‐h:12‐h light/dark condition, which was correlated with the rhythmic secretion of endogenous glucocorticoid, suggesting that the HPA axis regulates the biological clock activities. 3 , 22 However, the expression of these clock genes expression did not show daily variations in mice under abnormal 8‐h:16‐h CJL condition. Thus, it was speculated that CJL corresponded roughly to social stress, interfered with HPA axis activity, and contributed to the desynchronization between central oscillation and peripheral oscillation, including nasal mucosa and lung tissue. During OVA‐sensitized animal models, nocturnal activities gradually disappear and weight loss is elevated in both CRD+NC and CRD+AR groups as compared to that in both NC and AR groups. This phenomenon could be attributed to irregular light exposure‐induced hyperexcitability of the sympathetic nervous system, which in turn, contributed to the increased energy expenditure in daily activities in the CRD mice. Based on the standard scoring system, the results showed that nasal scores in the CRD+AR group were significantly higher than those in the AR group, indicating that CRD worsened inflammatory response in AR mice.
AR is a chronic inflammation of the nasal mucosa, mainly causing nasal hypersensitivity and asthma‐like symptoms. 7 , 9 Recent findings have reported that impaired airway epithelial barrier function plays a vital role in the development of AR, which is associated with disrupted expression and altered function of TJs. 16 TJs consist of different transmembrane proteins, such as Occludin family, ZO family, and junctional adhesion molecules. 14 , 15 , 16 The dysfunction of TJ proteins weakens the intercellular adhesion and promotes epithelial permeability and inflammation in the nasal mucosa. 16 In the current study, the data showed that the expression of TJs, Occludin and ZO‐1, was dramatically lower in OVA‐sensitized AR mice, suggesting that increased epithelial permeability in both nasal mucosa and lung tissues was positively correlated with allergic symptoms, such as rhinorrhea and respiratory mucus secretion, in the AR mice. The current findings were in line with the prior findings, that is, reduced expression of Occludin and ZO‐1 was observed in the patients with AR. In addition, the expression of Occludin and ZO‐1 in both nasal mucosa and lung tissues significantly decreased in the CRD+AR group as compared to that in the AR group. These findings showed that CRD reduces the expression of TJs and increases the allergic symptoms in AR mice, thus implying the concept of “one airway, one disease.” 23 Importantly, other features, such as EOS infiltration, MC degranulation, and goblet cell secretion, were more distinct in the CRD+AR group than in the AR group, further indicating that environmental disruption of circadian rhythm aggravates the local inflammation in the respiratory mucosa in the process of AR.
Interestingly, the major symptoms of AR exhibited ∼24‐h rhythmicity, which was partly explained by circadian clock‐modulated neural‐immuno‐endocrinal mechanism. 7 , 22 In the OVA‐induced AR models, mice treated with sublingual immunotherapy (SLIT) at ZT4 (10:00 a.m.) showed a marked reduction in production in OVA‐sIgE, IL‐4, IL‐10, and IL‐13 relative to mice treated at ZT16 (10:00 p.m.). This finding indicated that SLIT was a more effective treatment in the resting phase than in the active phase for AR. 24 Moreover, the temporal regulation of Th‐cells and Th‐specific cytokines by the circadian clock may be linked to the daily fluctuation in some allergic diseases, such as rheumatoid arthritis, asthma, and FA. 4 , 10 Accumulating evidence suggested that the rhythmic expression of TJs is directly affected by Th2‐type cytokines. 14 These data investigated that the high levels of Th2‐type cytokines may decrease the expression of TJs in the intestinal tissues, causing increased allergic diarrhea and weight loss in mice with FA. 14 Accompanied by low ZO‐1 and Occludin levels in the nasal mucosa, the scores of rhinorrhea were significantly higher in the HDM‐sensitized AR patients; moreover, IL‐4 disrupts nasal epithelial integrity and aggravate nasal symptoms. 16 Importantly, our data demonstrated that plasma levels of IL‐4, IL‐6, IL‐13, and IL‐17A dramatically increased in the CRD+AR group with a marked decrease in the plasma IFN‐γ level as compared to the AR group, suggesting that CRD worsened the Th2‐ and Th17‐dominated immune response in the development of AR. These data were aligned with a previous study, wherein CJL developed severe asthma‐like symptoms in mice, including increased airway resistance, methacholine sensitivity, and muc5ac expression in the lung tissues. 13 Furthermore, the induction of AS in Bmal1–/– mice, which lacked a functional circadian clock, led to obvious EOS infiltration and incremental IL‐5 levels in the lung and serum. 13 Subsequently, the levels of Th2 and Th17 cells derived from splenocytes were markedly upregulated in the CRD+AR group as compared to the AR group, whereas the levels of Th1 and Treg cells derived from splenocytes were markedly downregulated in the CRD+AR group as compared to the AR group. Taken together, CRD augmented the systemic immune response by regulating Th1/Th2 and Th17/Treg immune balance in the process of AR. Similarly, recent studies have demonstrated that nurses involved in shift work showed a distinctly increased incidence of FA, thereby indicating that alteration of clock activity not only influences periodic expression of CLOCK protein in peripheral B cells but also enhances susceptibility to allergic diseases. 5
Herein, we successfully modified and established aberrant light‐induced CJL and OVA‐sensitized AR mouse model according to previous protocols in order to explore how irregularly exogenous light stimulus affected AR by modulating the clock activity in modern society. The molecular regulation of clock genes, such as Rev‐erbα on AR during the CRD processing needed to be further investigated. On the other hand, the objective environment in animal experiments was easy to be strictly controlled, as mice were housed under weekly 8‐h‐advanced 8‐h:16‐h light/dark condition, which mimicked the chronic CJL in humans. 13 However, several external factors, including sleeping, working, and eating habits, cause a disturbance in human activities. Thus, how to apply these findings from animal studies to human diseases remains to be elucidated with respect to the circadian clock, which is a potent regulator of allergic airway inflammation. 25 , 26
5. CONCLUSION
In summary, CRD decreases the local TJs expression in the upper and lower respiratory epithelial mucosa and prompts the whole Th2 and Th17 type immune response, thus aggravating nasal allergy in mice. These findings reveal effective lifestyle interventions and the clock modifier application that might provide us a new therapeutic treatment for AR in modern society. These phenomena suggested that individuals should standardize their daily schedule to avoid a higher risk of allergic diseases from chronic stress.
CONFLICTS OF INTEREST
None.
ACKNOWLEDGMENTS
The authors would like to acknowledge Yan Gao, Xiao‐Min Zhao and Meng Li at the Department of Pathology, the Second Hospital, Shanxi Medical University, Taiyuan, China, for their technical support and professional assistance. This research was financially supported by National Natural Science Foundation of China (NO.81670914, 81870707, 81970865, 82171119, 82171120), Research Project of health commission of Shanxi Province (NO.2021062), Doctoral Project of Shanxi Province (NO. SD2006), Doctoral Project of Shanxi Medical University (NO. XD2009), Doctoral Project of the Second Hospital of Shanxi Medical University (NO. 202001‐1).
Cheng F‐Li, An Y‐F, Xue J‐M, et al. Circadian rhythm disruption exacerbates Th2‐like immune response in murine allergic airway inflammation. Int Forum Allergy Rhinol. 2022;12:757–770. 10.1002/alr.22914
REFERENCES
- 1. Zheng M, Wang X, Wang M, et al. Clinical characteristics of allergic rhinitis patients in 13 metropolitan cities of China. Allergy. 2021;76:577‐581. [DOI] [PubMed] [Google Scholar]
- 2. Nakao A. Clockwork allergy: how the circadian clock underpins allergic reactions. J Allergy Clin Immunol. 2018;142:1021‐1031. [DOI] [PubMed] [Google Scholar]
- 3. Paganelli R, Petrarca C, Di Gioacchino M. Biological clocks: their relevance to immune‐allergic diseases. Clin Mol Allergy. 2018;16:1. [DOI] [PMC free article] [PubMed] [Google Scholar]
- 4. Nakao A. Circadian regulation of the biology of allergic disease: clock disruption can promote allergy. Front Immunol. 2020;11:1237. [DOI] [PMC free article] [PubMed] [Google Scholar]
- 5. Yang H, Yang LT, Liu J, et al. Circadian protein CLK suppresses transforming growth factor‐β expression in peripheral B cells of nurses with day‐night shift rotation. Am J Transl Res. 2018;10:4331‐4337. [PMC free article] [PubMed] [Google Scholar]
- 6. Spadaro G, Giurato G, Stellato C, et al. Basophil degranulation in response to IgE ligation is controlled by a distinctive circadian clock in asthma. Allergy. 2019;75:158‐168. [DOI] [PubMed] [Google Scholar]
- 7. Cheng FL, An YF, Han ZQ, et al. Period2 gene regulates diurnal changes of nasal symptoms in an allergic rhinitis mouse model. Int Forum Allergy Rhinol. 2020;10:1236‐1248. [DOI] [PMC free article] [PubMed] [Google Scholar]
- 8. Hong F, Pan S, Xu P, et al. Melatonin Orchestrates Lipid Homeostasis through the Hepatointestinal Circadian Clock and Microbiota during Constant Light Exposure. Cells. 2020;9(2):489. [DOI] [PMC free article] [PubMed] [Google Scholar]
- 9. Xue JM, Zhao MZ, Ma F, et al. Survivin facilitates T‐helper 2‐biased inflammation in the airway. Int Forum Allergy Rhinol. 2019;9:656‐664. [DOI] [PubMed] [Google Scholar]
- 10. Storms W. Pharmacologic approaches to daytime and nighttime symptoms of allergic rhinitis. J Allergy Clin Immunol. 2004;114:S146‐S53. [DOI] [PubMed] [Google Scholar]
- 11. Kim HK, Kim HJ, Kim JH, et al. Asymmetric expression level of clock genes in left vs. right nasal mucosa in humans with and without allergies and in rats: circadian characteristics and possible contribution to nasal cycle. PLoS One. 2018;13(3):e0194018. [DOI] [PMC free article] [PubMed] [Google Scholar]
- 12. Yang G, Zhang H, Liu Y, et al. Alternation of circadian clock modulates forkhead box protein‐3 gene transcription in CD4(+) T cells in the intestine. J Allergy Clin Immunol. 2016;138:1446‐1449 e10. [DOI] [PubMed] [Google Scholar]
- 13. Ehlers A, Xie W, Agapov E, et al. BMAL1 links the circadian clock to viral airway pathology and asthma phenotypes. Mucosal Immunol. 2018;11:97‐111. [DOI] [PMC free article] [PubMed] [Google Scholar]
- 14. Tanabe K, Kitagawa E, Wada M, et al. Antigen exposure in the late light period induces severe symptoms of food allergy in an OVA‐allergic mouse model. Sci Rep. 2015;5:14424. [DOI] [PMC free article] [PubMed] [Google Scholar]
- 15. Kyoko OO, Kono H, Ishimaru K, et al. Expressions of tight junction proteins Occludin and Claudin‐1 are under the circadian control in the mouse large intestine: implications in intestinal permeability and susceptibility to colitis. PLoS One. 2014;9:e98016. [DOI] [PMC free article] [PubMed] [Google Scholar]
- 16. Steelant B, Farré R, Wawrzyniak P, et al. Impaired barrier function in patients with house dust mite‐induced allergic rhinitis is accompanied by decreased occludin and zonula occludens‐1 expression. J Allergy Clin Immunol. 2016;137:1043‐1053.e5. [DOI] [PubMed] [Google Scholar]
- 17. Li J, Lin X, Liu X, et al. Baicalin regulates Treg/Th17 cell imbalance by inhibiting autophagy in allergic rhinitis. Mol Immunol. 2020;125:162‐171. [DOI] [PubMed] [Google Scholar]
- 18. Crist H, Hennessy M, Hodos J, et al. Acute invasive fungal rhinosinusitis: frozen section histomorphology and diagnosis with PAS stain. Head Neck Pathol. 2019;13:318‐326. [DOI] [PMC free article] [PubMed] [Google Scholar]
- 19. Lemmer B. The circadian clock is now ticking even in Stockholm—Nobel prize in medicine 2017. Dtsch Med Wochenschr. 2017;142:1897‐1900. [DOI] [PubMed] [Google Scholar]
- 20. Shimba A, Ikuta K. Glucocorticoids regulate circadian rhythm of innate and adaptive immunity. Front Immunol. 2020;11:2143. [DOI] [PMC free article] [PubMed] [Google Scholar]
- 21. Koritala BSC, Cakmakli S. The human circadian clock from health to economics. Psych J. 2018;7:176‐196. [DOI] [PubMed] [Google Scholar]
- 22. Honma A, Yamada Y, Nakamaru Y, et al. Glucocorticoids reset the nasal circadian clock in mice. Endocrinology. 2015;156:4302‐4311. [DOI] [PubMed] [Google Scholar]
- 23. Samitas K, Carter A, Kariyawasam HH, Xanthou G. Upper and lower airway remodelling mechanisms in asthma, allergic rhinitis and chronic rhinosinusitis: the one airway concept revisited. Allergy. 2018;73(5):993‐1002. [DOI] [PubMed] [Google Scholar]
- 24. Igarashi S, Suzuki K, Nakamura Y, et al. The efficacy of sublingual immunotherapy for allergic rhinitis may vary with the time of day. Int Arch Allergy Immunol. 2016;171:111‐118. [DOI] [PubMed] [Google Scholar]
- 25. Sulli G, Manoogian ENC, Taub PR, Panda S. Training the circadian clock, clocking the drugs, and drugging the clock to prevent, manage, and treat chronic diseases. Trends Pharmacol Sci. 2018;39:812‐827. [DOI] [PMC free article] [PubMed] [Google Scholar]
- 26. Krakowiak K, Durrington HJ. The role of the body clock in asthma and COPD: implication for treatment. Pulm Ther. 2018;4:29‐43. [DOI] [PMC free article] [PubMed] [Google Scholar]