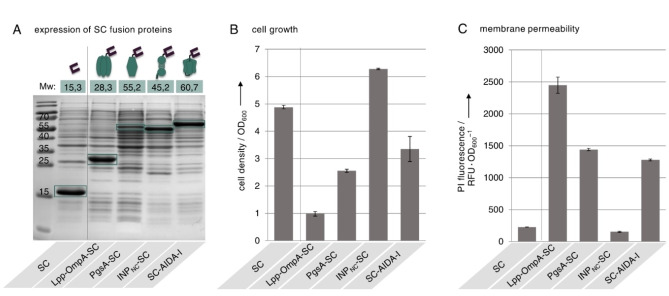
Figure 2.
Protein expression, growth and membrane permeability of E. coli cells expressing SC fused to different membrane anchors. Cells expressing the SC intracellularly or as genetic fusion to the membrane anchors Lpp‐OmpA, PgsA, INPNC or AIDA‐I were analyzed 20 h after of induction of protein expression. (A) Total protein fractions separated by Coomassie stained SDS‐PAGE (15 % (w/v) acrylamide). The expected molecular weight (Mw) of each protein as well as the molecular weight of marker bands is given in kDa. The bands of the detected proteins are outlined in green. (B) Density of cell cultures determined by measuring the OD600. (C) Permeability of the cell membrane determined by incubation with the membrane impermeable DNA intercalating dye propidium iodide (PI). A high PI fluorescence signal is related to increased membrane permeability. Details about the staining procedure are given in Figure S1. Error bars were obtained from at least two independent experiments.

