

Abstract
Chronic overexposure to fluoride can have deleterious effects in the musculoskeletal system. Some fluorine‐containing therapeutics, such as voriconazole, release fluoride through metabolism. Therefore, drug‐related fluoride exposure should be assessed for novel therapeutics suspected of releasing fluoride through metabolism. Two trials were conducted to identify the optimal method of assessing drug‐related fluoride exposure. In trial 1, designed to assess reproducibility of fluoride pharmacokinetics in urine and plasma, 14 participants were administered a fluoride‐restricted diet and once‐daily doses of sodium fluoride (2.2 mg [1 mg of fluoride] on days 1 and 2; and 13.2 mg of sodium fluoride [6 mg of fluoride] on days 3 and 4). In trial 2, designed to confirm the selected method for fluoride detection, 12 participants were administered a fluoride‐restricted diet and randomized to receive voriconazole (400 mg twice, 12 hours apart, on day 1 [131 mg/d of fluoride maximum], then 3 doses of 200 mg every 12 hours [65.3 mg/d of fluoride maximum]) or placebo. Plasma fluoride concentrations and urinary fluoride excretion were assessed in each trial. Assessment of plasma fluoride concentrations in trial 1 was limited by 301 of 854 samples (35.2%) below the lower limit of quantitation. Urine fluoride excretion was readily measured and demonstrated a decrease from baseline during the fluoride‐restricted diet phase, as well as dose‐proportional increases with fluoride administration. In trial 2, increases in urine fluoride were successfully observed in participants administered voriconazole. In conclusion, fluoride exposure was optimally assessed by urinary fluoride excretion in conjunction with strict dietary fluoride restrictions, as measurements were consistent and reproducible.
Keywords: assay, fluoride, plasma, urine, voriconazole
Optimal exposure to fluoride has beneficial effects on teeth and bone, and the ability of fluoride to inhibit dental caries is widely recognized. 1 , 2 However, acute overexposure to fluoride can lead to fluoride toxicity, which, although uncommon, usually occurs following intake of >5 mg/kg in adults. 2 Chronic fluoride toxicity (long‐term exposure to >6 mg/day) is associated with dental and skeletal fluorosis. 3 , 4 Dental effects are predominantly observed in children whose teeth are still developing, whereas skeletal effects, including changes in bone mineral density, greater bone fragility, and a higher risk of fractures, are of greater concern in adults. 3 , 4 Ligaments and tendons can become calcified in individuals with skeletal fluorosis, reducing mobility. 3
Water is a predominant source of dietary fluoride. 1 In 2011, the US Department of Health and Human Services recommended fluoride concentration of 0.7 mg/L in drinking water to maintain cavity prevention benefits while limiting the risk of dental fluorosis. 5 , 6 The US Environmental Protection Agency reference dose for fluoride (maximum daily intake of fluoride that is considered likely to be without harmful effect during a lifetime) is 0.08 mg/kg/d (equivalent to 4.8 mg/d for a 60‐kg adult), 7 although the average person in the United States is exposed to a much lower amount (1.8‐2.7 mg/d from fluoridated drinking water alone, which is the chief source of dietary fluoride). 1
Some fluorine‐containing pharmacologic therapies, such as the fluoridated triazole antifungal agent voriconazole, are associated with metabolic release of fluoride (plasma fluoride concentration 13‐14 μM with chronic exposure). 4 , 8 , 9 , 10 Prolonged treatment with voriconazole has been linked to fluoride‐related skeletal toxicity and adverse events, such as skeletal fluorosis and periostitis. 4 , 8 , 9 , 10
Fluoride urinary excretion has been routinely employed to evaluate immediate fluoride exposure, with subsequent development of plasma methods; however, assessing drug‐related fluoride exposure is challenging because fluoride concentrations in blood and urinary fluoride excretion are highly variable. Dietary fluoride absorption is rapid, with plasma concentrations peaking within 60 minutes and returning to baseline within 11 to 15 hours. 2 Fluoride in plasma is rapidly deposited in bone, where it maintains an equilibrium with plasma levels or is excreted via the kidneys. 1 , 2
Reliable methods of assessing fluoride exposure, which could correlate with toxicity, are needed. 11 An initial trial (trial 1) was conducted to investigate how to assess drug‐related exposure to fluoride and the longitudinal reproducibility of fluoride pharmacokinetics (PK) in urine and plasma following repeated doses of sodium fluoride. A second trial (trial 2) was conducted to confirm that the selected method (based on plasma and urine fluoride PK parameters) could detect drug‐induced changes in fluoride exposure following administration of voriconazole, a fluoride‐releasing compound.
Methods
Trials were performed at a single center in Lincoln, Nebraska, and were reviewed and approved by Chesapeake Institutional Review Board (Columbia, Maryland) before commencement. Both trials were conducted in accordance with the Good Clinical Practice and International Council for Harmonization guidelines, and all participants provided written informed consent before enrollment in accordance with US Food and Drug Administration Regulations.
Trial 1 Design
Trial 1 (Figure 1A) had an open‐label, 3‐period, fixed‐sequence design. No drug administration occurred during a 7‐day run‐in (period 1). In period 2, which began immediately after period 1, participants received an oral dose of 2.2 mg of sodium fluoride (1 × 2.2‐mg chewable tablet; equivalent to 1 mg of fluoride) on days 1 and 2, and 13.2 mg of sodium fluoride (6 × 2.2‐mg chewable tablets; equivalent to 6 mg of fluoride) on days 3 and 4. It was assumed that steady‐state plasma fluoride levels would be achieved within 2 days based on an approximate plasma fluoride half‐life of 6 hours. 12 Period 3 repeated the regimen applied in period 2 after a 5‐day washout period.
Figure 1.
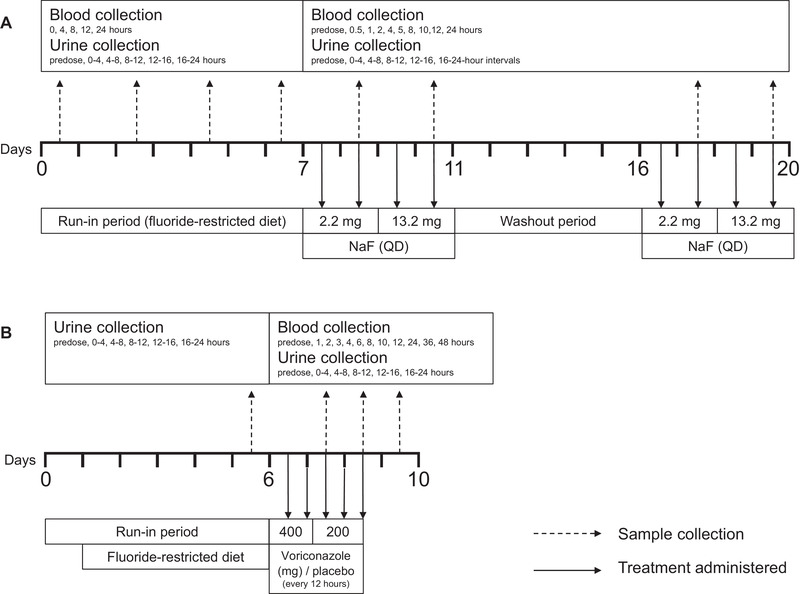
Trial design. Treatment regimen is indicated by dashed arrows, and sample (blood and urine) collection is indicated by solid arrows for trial 1 (A) and trial 2 (B). NaF, sodium fluoride; QD, once daily.
Participants consumed a standardized fluoride‐restricted diet (estimated fluoride intake <0.4 mg/d) throughout the trial, eliminating all fluoride‐containing products (eg, tap water, dietary supplements, fluoride‐containing toothpaste, tea). Participants fasted for at least 8 hours before trial drug administration (periods 2 and 3) and period 1 index time (time of day at which the study drug was scheduled to be administered in periods 2 and 3) and continued to fast for at least 4 hours on PK sampling days. Participants refrained from consuming known sources of calcium for 4 hours before and 2 hours after dosing with sodium fluoride in periods 2 and 3.
Water consumed by participants was defluoridated. Intake of water and other fluids (except water provided with dosing) was restricted for 1 hour before and 1 hour after the period 1 index time or time of dosing in periods 2 and 3. During the trial, defluoridated water was administered to ensure adequate urine volume for fluoride analysis. In period 1, participants consumed 240 mL of defluoridated water on days 1, 3, 5, and 7 at index time and then at least 200 mL 1, 3, and 6 hours later. In periods 2 and 3, each participant consumed 240 mL of defluoridated water at time of dosing then at least 200 mL at 1, 3, and 6 hours after dosing. Additional defluoridated water was administered at the investigator's discretion and the amount was recorded.
Eligible participants were healthy adult men aged 19 to 55 years with a body mass index of 18.0 to 32.0 kg/m2 and calcium, magnesium, phosphorus, and parathyroid hormone levels within normal limits. Participants with a history or presence of a clinically significant medical or psychiatric condition or any illness that, in the opinion of the investigator, might confound the results of the trial or pose a risk to the participants, including hyperparathyroidism, were excluded. An estimated creatinine clearance (CrCl) ≥90 mL/min based on the Cockcroft‐Gault equation was required.
Trial 2 Design
Trial 2 (Figure 1B) had a randomized, single‐blind, placebo‐controlled, 2‐period design. Period 1 included a 5‐day run‐in phase where participants consumed a standardized fluoride‐restricted diet until trial completion. During period 2, participants were randomized 1:1 to receive voriconazole (400 mg twice [131 mg/d of fluoride maximum], 12 hours apart, on day 1, followed by 3 doses of 200 mg every 12 hours [65.3 mg/d of fluoride maximum], a regimen that was expected to reach fluoride steady state within 24 hours) or placebo every 12 hours.
Eligible participants were adult males and females (of non‐childbearing potential) aged 21 to 55 years with a body mass index of ≤35.0 kg/m2 and calcium, magnesium, phosphorus, and parathyroid hormone levels within normal limits. Individuals with a history of clinically significant abnormalities or diseases, hypersensitivity to voriconazole or its excipients, intolerance of galactose, lactase deficiency, glucose‐galactose malabsorption, significant multiple and/or severe allergies, or an anaphylactic reaction or significant intolerability to prescription or nonprescription drugs or food were ineligible. Individuals with a corrected QT interval ≥450 milliseconds were excluded. An estimated CrCl ≥90 mL/min based on the Cockcroft‐Gault equation was required.
Fluoride Sampling and PK Analysis
For trial 1 (Figure 1A), blood samples for the determination of plasma fluoride concentrations were collected at 0, 4, 8, 12, and 24 hours on days 1, 3, 5, and 7 of period 1, relative to the index time. Blood samples were collected before dosing and at 0.5, 1, 2, 4, 5, 8, 10, 12, and 24 hours after dosing on days 2 and 4 of periods 2 and 3. PK parameters evaluated included area under the fluoride concentration‐time curve from 0 to 24 hours (AUC0‐24), maximum plasma fluoride concentration, and time to maximum plasma fluoride concentration. Apparent clearance and apparent terminal half‐life were calculated in periods 2 and 3.
For trial 1, urine samples for determination of fluoride excretion were collected before dosing/before index time on day 1 and at fixed intervals after dosing/after index time (0‐4, 4‐8, 8‐12, 12‐16, and 16‐24 hours) on days 1, 3, 5, and 7 in period 1 and on days 2 and 4 of periods 2 and 3. PK parameters evaluated included amount of fluoride excreted during the 24‐hour period after dosing (Ae0‐24) on days 1, 3, 5, and 7 of period 1, and on days 2 and 4 of periods 2 and 3. Renal clearance of fluoride and the fraction of fluoride excreted during the 24‐hour period after dosing were calculated in periods 2 and 3.
For trial 2 (Figure 1B), blood samples for the determination of plasma fluoride concentrations were collected after dosing on days 3 and 4 of period 2. Urine samples were collected at fixed intervals on the final day of period 1. In period 2, urine samples were collected between 12 to 16 and 16 to 24 hours on day 2 and 4‐ or 8‐hour intervals on days 3 and 4. To assess completeness of urine collection for each participant, a 12‐ or 24‐hour CrCl was assessed using serum and urine creatinine concentrations on each day that urine collection was performed. No participants were identified as having incomplete urine collection by this method. Ae0‐24 for participants administered placebo or voriconazole was assessed from the 12‐hour time point on day 2 to the corresponding time point on day 3.
Analytical Methods
Plasma and urine samples were analyzed for fluoride content by Quest Diagnostics (Chantilly, Virginia) using direct ion‐specific electrode potentiometry using Orion Fluoride Electrode with a separate reference electrode. Voriconazole plasma concentrations were analyzed by inVentiv Health Clinique (Quebec, Canada) using ultraperformance liquid chromatography, followed by tandem mass spectrometry. The analytical range was 0.0143 to 5.73 μM.
Data Analysis
Plasma PK parameters were calculated using Phoenix WinNonlin software (version 6.3). Maximum plasma fluoride concentration and time to maximum plasma fluoride concentration values were obtained directly from plasma concentration‐time data. AUC0‐24 was calculated using the linear up/log down trapezoidal method. Apparent terminal half‐life was calculated via standard methods. Apparent clearance was calculated as dose/AUC0‐24. Concentration values that were below the lower limit of quantification (LLOQ) of the assay (1.05 μM) were imputed as being half the LLOQ (ie, 0.526 μM). Fluoride Ae0‐24 was determined by the product of the urine excretion and volume during the 24‐hour collection interval. Fraction of fluoride excreted during the 24‐hour period after dosing was calculated as the sum of fraction excreted (quotient of Ae and dose) over the entire 24‐hour collection interval. Renal clearance of fluoride was determined as the quotient of Ae0‐24 and AUC0‐24.
Statistical calculations were performed using SAS version 9.4 (SAS Institute, Cary, North Carolina).
In period 1 of trial 1, individual plasma fluoride AUC0‐24 values were ln‐transformed and analyzed with a linear mixed‐effect model with a fixed‐effect term for day. The Kenward‐Roger adjustment was used to calculate denominator degrees of freedom for fixed effects. A 90% confidence interval (CI) was constructed for the difference in least‐squares means on the ln‐scale for fluoride AUC0‐24. Exponentiation provided a 90%CI for AUC0‐24 geometric mean ratios (GMRs) of interest. The AUC0‐24 GMR 90%CIs for day 3/day 1, day 5/day 3, and day 7/day 5 were compared with the interval (0.70‐1.43) to determine stability to balance confidence with a reasonable sample size. Ae0‐24 was analyzed using the same statistical model.
In periods 2 and 3 of trial 1, fold change from baseline was computed with baseline AUC0‐24 and Ae0‐24, calculated as mean values from days 3, 5, and 7 in period 1. Reproducibility of plasma fluoride concentrations and urine fluoride excretion between the periods was analyzed with a linear mixed‐effects model with a fixed‐effect term for period. A 90%CI was constructed for the difference in least‐squares means on the ln‐scale for AUC0‐24 and Ae0‐24. Exponentiation provided a 90%CI for the AUC0‐24 and Ae0‐24 GMRs (period 3/period 2).
For trial 2, urine and plasma fluoride PK were descriptively summarized. The relationship of urine fluoride with plasma voriconazole PK was explored using scatter plots to visualize associations. Baseline was defined as on the final day of period 1.
Results
Participant Disposition and Baseline Characteristics
A total of 14 and 12 male participants were enrolled in trial 1 and trial 2, respectively. All participants completed each trial per protocol. Trial 2 initiated 6 months after trial 1 completed (Table 1).
Table 1.
Demographic and Baseline Clinical Characteristicsa
| Trial 1 | Trial 2 | |
|---|---|---|
| Characteristic | N = 14 | N = 12 |
| Age, y, mean (SD) | 37.6 (9.7) | 38.8 (7.5) |
| Range | 20‐53 | 28‐53 |
| Race, n (%) | ||
| White | 8 (57.1) | 9 (75.0) |
| Black or African American | 6 (42.9) | 2 (16.7) |
| Multiple | 0 | 1 (8.3) |
| Ethnicity, n (%) | ||
| Hispanic or Latino | 2 (14.3) | 3 (25.0) |
| Not Hispanic or Latino | 12 (85.7) | 9 (75.0) |
| Weight, kg, mean (range) | 85.2 (60‐106) | 92.1 (73‐113) |
| Height, cm, mean (range) | 178.4 (165‐188) | 176.7 (168‐182) |
| BMI, kg/m2, mean (range) | 26.7 (21‐32) | 29.5 (24‐34) |
BMI, body mass index; SD, standard deviation.
Only adult males were eligible for trial 1, and only adult males were enrolled for trial 2.
Fluoride PK Parameters
In period 1 of trial 1, where participants were administered a fluoride‐restricted diet alone, plasma fluoride concentrations were stable from day 3 onward as demonstrated by 90%CIs of GMRs for day 5/day 3 and day 7/day 5 being within the prespecified bounds of 0.70 to 1.43 (Table 2). However, plasma fluoride levels were below the LLOQ in 180 of 280 samples (64.3%). Urine fluoride excretion declined from day 1 to day 7, with the greatest decrease occurring from day 3 to day 5, despite meeting the definition for stability from day 1 onward (Table 2).
Table 2.
Plasma and Urine Fluoride PK in Healthy Male Participants Administered a Fluoride‐Restricted Diet for 7 Days (Period 1): Trial 1 a
| Matrix | Fluoride PK Parameters (N = 14) | Day 1 | Day 3 | Day 5 | Day 7 |
|---|---|---|---|---|---|
| Plasma | AUC0‐24, μM • h, GM (95%CI) | 22.1 (16.7‐29.2) | 16.9 (14.4‐19.7) | 18.4 (14.9‐22.6) | 17.3 (15.2‐19.7) |
| Cmax, μM, GM (95%CI) | 1.5 (1.0‐2.2) | 1.1 (0.8‐1.4) | 1.2 (1.0‐1.6) | 1.1 (0.8‐1.3) | |
| tmax, h, median (range) | 4.0 (0.0‐23.9) | 0.0 (0.0‐23.9) | 6.0 (0.0‐24.0) | 4.1(0.0‐24.0) | |
| Urine | Ae0‐24, μmol, GM (95%CI) | 38.5 (31.5‐47.1) | 35.2 (29.3‐42.1) b | 27.5 (23.0‐32.8) | 26.5 (22.2‐31.5) |
| Day 3/Day 1 | Day 5/Day 3 | Day 7/Day 5 | |||||
|---|---|---|---|---|---|---|---|
| GMR (90%CI) | Pseudo within‐participant %CV c | GMR (90%CI) | Pseudo within‐participant %CV c | GMR (90%CI) | Pseudo within‐participant %CV c | ||
| Plasma | AUC0‐24, μM • h | 0.76 (0.65‐0.90) | 24.1 | 1.09 (0.97‐1.22) | 16.8 | 0.94 (0.79‐1.13) | 26.6 |
| Urine | Ae0‐24, μmol | 0.91 (0.85‐0.98) | 10.8 | 0.78 (0.75‐0.82) | 6.7 | 0.96 (0.92‐1.01) | 7.6 |
Ae0‐24, amount excreted during urine collection over the 24‐hour period after dosing; AUC0‐24, area under the concentration‐time curve from 0 to 24 hours after dosing; CI, confidence interval; Cmax, maximum plasma concentration; %CV, coefficient of variation; GM, geometric mean; GMR, geometric mean ratio; PK, pharmacokinetic; tmax, time to maximum plasma concentration.
Back‐transformed least‐squares mean and CI from linear mixed‐effects model performed on natural log‐transformed values.
n = 13.
Pseudo within‐subject %CV = 100 × √[(σA 2 + σB 2 − 2×σAB)/2], where σA 2 and σB 2 are the estimated variances on the log scale for the 2 treatments and σAB is the corresponding estimated covariance, each obtained from the linear mixed‐effects model.
In periods 2 and 3 of trial 1, where participants were administered once‐daily fluoride on a fluoride‐restricted diet, plasma PK assessments were not reproducible, with values below LLOQ in 121 of 574 samples (21.1%; Table 3). Plasma AUC0‐24 GMRs (90%CI) for period 3/period 2 were 0.76 (0.69‐0.83) and 0.90 (0.86‐0.95) at the lower and higher sodium fluoride doses, respectively. In contrast, urine Ae0‐24 for period 3/period 2 demonstrated reproducibility of urine PK (Table 3), with Ae0‐24 GMRs (90%CI) of 1.01 (0.96‐1.07) and 0.96 (0.90‐1.02) at the lower and higher sodium fluoride doses, respectively.
Table 3.
Plasma and Urine Fluoride PK in Healthy Male Participants Administered 2.2 mg Sodium Fluoride on Days 1 and 2, and 13.2 mg Sodium Fluoride on Days 3 and 4 and a Fluoride‐Restricted Diet Across Periods 2 and 3: Trial 1
| Sodium Fluoride 2.2 mg | Sodium Fluoride 13.2 mg | ||||||||
|---|---|---|---|---|---|---|---|---|---|
| Period 2 | Period 3 | Period 2 | Period 3 | ||||||
| Matrix | Fluoride PK Parameters | n | n | n | n | ||||
| Plasma | AUC0‐24, μM • h, GM (95%CI) a | 14 | 27.1 (24.8‐29.6) | 14 | 20.5 (18.7‐22.4) | 14 | 59.7 (56.1‐63.5) | 14 | 53.9 (50.0‐58.1) |
| Fold change from baseline AUC0‐24, b GM (SD) c | 14 | 1.5 (0.5) | 14 | 1.2 (0.4) | 14 | 3.4 (1.0) | 14 | 3.0 (0.9) | |
| Cmax, μM, GM (%CV) | 14 | 2.60 (16.0) | 14 | 2.59 (32.0) | 14 | 12.4 (24.1) | 14 | 11.6 (10.3) | |
| tmax, h, median (min‐max) | 14 | 0.53 (0.51‐4.02) | 14 | 0.50 (0.50‐8.03) | 14 | 0.50 (0.50‐1.00) | 14 | 0.50 (0.50‐1.00) | |
| CL/F, L/h, GM (%CV) | 14 | 1.9 (15.5) | 14 | 2.6 (15.7) | 14 | 5.3 (10.7) | 14 | 5.9 (13.1) | |
| Apparent terminal t½, h, GM (%CV) d | 1 | 13.2 (–) | 0 | – (–) | 8 | 17.0 (55.2) | 9 | 9.6 (53.2) | |
| Urine | Ae0‐24, μmol, mean (95%CI) a | 14 | 55.7 (48.8‐63.7) | 14 | 56.5 (49.7‐64.2) | 14 | 214 (192‐237) | 14 | 205 (191‐219) |
| Fold change from baseline Ae0–24, e GM (SD) c | 14 | 1.7 (0.3) | 14 | 1.8 (0.3) | 14 | 6.7 (1.5) | 14 | 6.4 (1.9) | |
| CLR, L/h, GM (%CV) | 14 | 2.1 (31.4) | 14 | 2.8 (26.0) | 14 | 3.6 (25.3) | 14 | 3.8 (20.4) | |
| fe0‐24, GM (%CV) | 14 | 1.1 (23.5) | 14 | 1.1 (22.4) | 14 | 0.7 (18.2) | 14 | 0.65 (11.9) | |
| Period 3/Period 2 | GMR (90%CI) | Pseudo within‐participant %CV f | GMR (90%CI) | Pseudo within‐participant %CV f | |||||
| Plasma | AUC0‐24, μM • h | 0.76 (0.69‐0.83) | 14.6 | 0.90 (0.86‐0.95) | 7.7 | ||||
| Urine | Ae0‐24, μmol | 1.01 (0.96‐1.07) | 7.6 | 0.96 (0.90‐1.02) | 9.3 | ||||
Ae0‐24, amount excreted in urine during the 24‐hour period after dosing; AUC0‐24, area under the concentration‐time curve from 0 to 24 hours after dosing; CI, confidence interval; CL/F, apparent clearance after oral administration; CLR, renal clearance; Cmax, maximum plasma concentration; %CV, coefficient of variation; fe0‐24, fraction excreted during the 24‐hour period after dosing; GM, geometric mean; GMR, geometric mean ratio; PK, pharmacokinetic; SD, standard deviation; t½, half‐life; tmax, time to maximum plasma concentration.
Back‐transformed least‐squares mean and CI from linear mixed‐effects model performed on natural log‐transformed values.
Baseline is the mean value from days 3, 5, and 7 in period 1.
GM is calculated as exp[sum(log[postdose/baseline])/n] and SD is calculated as √([exp(2μ+2s2)]‐[exp(2μ+s2)]) where μ is the mean change from baseline on the log scale and s is the SD of change from baseline on the log scale.
Due to the insufficient number of measurable concentrations and concentrations close to the LLOQ in the terminal phase, apparent terminal t½ values were not calculated for some participants.
Baseline is the value on day 6 of period 1 (after 5 days of a fluoride‐restricted diet).
Pseudo within‐subject %CV = 100 × √([σA 2 + σB 2 − 2×σAB]/2), where σA 2 and σB 2 are the estimated variances on the log scale for the 2 treatments, and σAB is the corresponding estimated covariance, each obtained from the linear mixed‐effects model.
For trial 2, where participants were administered voriconazole or placebo under dietary fluoride restrictions, plasma and urine fluoride PK are reported in Table 4. Following voriconazole or placebo dosing, 16 of 72 (22.2%) and 71 of 72 (98.6%) of the plasma samples, respectively, were below the LLOQ. The geometric mean plasma fluoride AUC from time 0 to 12 hours values were higher following administration of voriconazole compared with placebo; quantitative interpretation should be approached with caution due to the large number of samples in the placebo group below the LLOQ.
Table 4.
Plasma and Urine Fluoride PK in Healthy Participants Administered Voriconazole or Placebo for 3 Days Under Conditions of a Fluoride‐Restricted Diet: Trial 2
| Placebo | Voriconazole | |
|---|---|---|
| (n = 6) | (n = 6) | |
| Plasma PK parameters [Link] , b | ||
| AUC0‐12, μM • h, AM (SD) | 6.7 (0.9) | 30.7 (11.9) |
| AUC0‐48, μM • h, AM (SD) | 25.6 (0.9) | 79.3 (27.5) |
| Cmax, μM, AM (SD) | 1.0 (1.1) | 4.5 (1.6) |
| tmax, h, median (min‐max) | 0.0 (0.0‐3.0) | 0.5 (0.0‐1.0) |
| Urine PK parameter | ||
| Ae0‐24 change from baseline, c μmol, AM (SD) | 5.4 (22.7) | 301 (86.6) |
Ae0‐24, amount of fluoride excreted from 0 to 24 hours after dosing; AM, arithmetic mean; AUC0‐12, area under the concentration‐time curve from 0 to 12 hours after dosing; AUC0‐48, area under the concentration‐time curve from 0 to 48 hours after dosing; CI, confidence interval; Cmax, maximum plasma concentration; max, maximum; min, minimum; PK, pharmacokinetic; SD, standard deviation; tmax, time to maximum plasma concentration.
Fluoride concentration values that were below the LLOQ were imputed as being half the LLOQ (ie, 0.526 μM). Note that 16 of 72 (22.2%) and 71 of 72 (98.6%) of the plasma samples following voriconazole and placebo, respectively, were below the LLOQ.
Back‐transformed least‐squares mean and CI from linear mixed‐effects model performed on natural log‐transformed values.
Baseline was defined as day 6 of period 1 in trial 2.
The arithmetic mean urine fluoride Ae0‐24 at voriconazole steady state was ≈7‐fold higher than baseline (351.66 μmol following voriconazole vs 50.55 μmol at baseline; Figure 2). By comparison, arithmetic mean fluoride Ae0‐24 in participants administered placebo was generally comparable with baseline (38.87 μmol following placebo vs 33.43 μmol at baseline; Figure 2). Mean (standard deviation [SD]) change from baseline in fluoride Ae0‐24 was +301.10 (86.62) μmol and +5.44 (22.74) μmol for voriconazole and placebo, respectively (Table 4).
Figure 2.
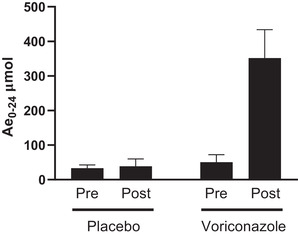
Urine fluoride PK. Urine fluoride concentration (Ae0‐24, mean ± SD) following the administration of placebo (N = 6) or voriconazole (N = 6) under conditions of a fluoride‐restricted diet to healthy adult participants is shown. Ae0‐24, arithmetic mean fluoride excreted in the urine over a 24‐hour interval; PK, pharmacokinetics; post, the mean value from 12 hours (day 2) to 12 hours (day 3) of period 2; pre, day 5 of a fluoride‐restricted diet of period 1; SD, standard deviation.
Safety
Three participants (21.4%) administered sodium fluoride in trial 1 reported treatment‐emergent adverse events (constipation, arthralgia, and headache); none were considered by the investigator to be drug related. No adverse events were reported in participants administered voriconazole.
Discussion
Reliable methods of assessing fluoride exposure, following administration of fluoride‐releasing compounds, are needed because release of high amounts of fluoride increases risk of skeletal fluorosis in adults, which is potentially associated with changes in bone mineral density, greater bone fragility, and higher fracture risk. 3 , 4 , 11 Two trials were conducted to establish fluoride PK; one aimed to assess study design aspects as well as longitudinal reproducibility of plasma and urine assays to measure fluoride, while the second trial aimed to confirm method selection.
Available plasma assays for fluoride can be useful to confirm very high fluoride concentrations associated with acute toxicity; however, these assays are not designed to measure fluoride concentrations expected with the drugs and doses employed in these trials. Fluoride exposure following oral administration is best assessed using urine because measurements are more consistent and reproducible when sampling urine vs plasma. Collecting urine samples is less invasive than obtaining blood samples for fluoride analysis, although in some instance, collection processes may be cumbersome. Measuring fluoride in plasma was limited by fluoride concentrations generally being below the LLOQ when a fluoride‐restricted diet was implemented; additionally, a proportion of samples (22%) failed to exceed the LLOQ after administration of voriconazole, known to increase fluoride exposure when metabolized.
An approximately dose‐proportional relationship was observed between fluoride intake and fluoride excreted in urine, suggesting that estimated fluoride exposure in individuals administered drugs that release fluoride can be benchmarked against national and international recommendations. 7 , 13 Notably, utility of measuring urine fluoride levels to assess drug‐induced increases in fluoride exposure was successfully applied in trial 2 when increased fluoride levels were observed in urine of participants administered voriconazole, known to dose‐dependently increase plasma fluoride levels. 4 , 8 , 9 , 10 When applying the dose‐dependent relationship between oral fluoride intake and urine fluoride excretion observed in trial 1, it was estimated that participants administered voriconazole 200 mg twice daily were exposed to 9.7 mg/day of metabolism‐derived fluoride.
Other studies have investigated the utility of assessing fluoride exposure in urine samples, but intertrial heterogeneity is common, and most have not used a standardized or fluoride‐restricted diet to effectively determine a dose‐exposure relationship. 11 In particular, when assessing drug‐related increases in fluoride exposure, as opposed to dietary or environmental exposure, it is essential to control exogenous fluoride intake and to account for the impact of food on bioavailability. 11 Notably, the amount of fluoride excreted in urine continued to decline up to day 7 after initiating a fluoride‐restricted diet in trial 1, although the decline was minimal from day 5 to day 7. Therefore, a 5‐day run‐in period was selected to establish a stable baseline in trial 2.
Heterogeneity of past studies of urinary fluoride, coupled with limited disclosure of trial methodology, made it necessary to develop and confirm a protocol for assessing fluoride levels prior to examining drug‐related fluoride exposure in trial 2. 11 Likewise, relationships between fluoride intake/fluoride excretion in urine and urine/plasma fluoride concentrations have rarely been explored. 11 Current findings suggest that urine fluoride excretion, measured over an extended period of time (ie, several hours), may offer improved sensitivity and address the apparent variability in plasma fluoride levels observed in these trials; it offers a more representative measure of mean fluoride levels as opposed to a measure at a single time point that could be affected by the equilibrium between bone and plasma fluoride levels. 2 , 9 , 14 A similar approach has been used to assess daily sodium intake by measuring urinary sodium excretion over a 24‐hour period. 15
Demonstrating consistency of urine fluoride excretion among individuals receiving a fluoride‐restricted diet has important implications for toxicologic studies of novel therapies. The potential for novel therapies to release fluoride when metabolized may be predicted by their molecular structure and data gathered during preclinical studies, and the method used in these trials may be used to quantify the amount of fluoride released in humans and to characterize the degree of dose dependence. Data on fluoride release generated in early‐stage studies of novel therapies suspected of increasing fluoride exposure in humans may then be used to guide benefit‐risk assessments in larger clinical studies or studies involving prolonged exposure to a therapy.
No serious or unexpected adverse events were identified when administering supraphysiologic doses of fluoride to trial participants for a short duration. This is consistent with previous reports suggesting that acute fluoride toxicity only occurs when fluoride intake exceeds 5 mg/kg. 2
Limitations
The high proportion of measurements below LLOQ for plasma fluoride assays limited the ability to accurately assess plasma PK parameters following oral fluoride administration. While more sensitive assays for fluoride in blood and urine may be available, they are not readily accessible outside of an academic research setting.
Small sample size with participants from a limited geographic range limits the generalizability compared with an international, multicenter trial. In particular, fluoride exposure is subject to geographic variation, predominantly related to variations in fluoride content in water supplies. However, this study did account for inter‐individual variability by assessing changes from baseline as well as application of a strict fluoride‐restricted diet, which was an inherent strength of this study. For example, in trial 2, participants who were given voriconazole showed a mean change from baseline urine fluoride at 301 μmol (SD, 87 μmol) compared with placebo at 5 μmol (SD, 23 μmol). The methodology applied here provides an estimate of daily fluoride exposure for comparison against reference levels but has not been established as a method of monitoring chronic exposure or establishing the potential of a novel therapy to cause fluoride‐related toxicity. The influence of typical dietary fluoride on plasma and urine fluoride PK was not examined.
Conclusions
Analysis of urinary fluoride excretion, in conjunction with dietary fluoride restrictions, may offer an optimal method of assessing drug‐related changes in fluoride exposure among individuals administered investigational therapies with the potential to affect fluoride levels.
Conflicts of Interest
G.G., D.J.R., S.Z., A.S., P.L., S.A.S., and M.I. are/were employees of Merck Sharp & Dohme Corp., a subsidiary of Merck & Co., Inc., Kenilworth, New Jersey (MSD) when the trials were conducted. C.T. is an employee of Celerion, Lincoln, Nebraska, the contract research organization engaged by MSD to conduct the trial.
Data Sharing Statement
MSD data sharing policy, including restrictions, is available at: http://engagezone.msd.com/dsdocumentation.php. Requests for access to the clinical trial data can be submitted through the EngageZone site or via email to: dataaccess@merck.com.
Funding
Funding for this research was provided by MSD.
Acknowledgments
The authors thank the participants and clinical research staff who participated in the trials. Medical writing and editorial assistance, under the direction of the authors, were provided by Apothecom (London, UK) in accordance with Good Publication Practice (GPP3) guidelines. This assistance was funded by Merck Sharp & Dohme Corp., a subsidiary of Merck & Co., Inc., Kenilworth, New Jersey.
References
- 1. Palmer CA, Gilbert JA. Position of the Academy of Nutrition and Dietetics: the impact of fluoride on health. J Acad Nutr Diet. 2012;112(9):1443‐1453. [DOI] [PubMed] [Google Scholar]
- 2. Martinez‐Mier EA. Fluoride: its metabolism, toxicity, and role in dental health. J Evid Based Complementary Altern Med. 2012;17(1):28‐32. [Google Scholar]
- 3. Aoun A, Darwiche F, Al Hayek S, Doumit J. The fluoride debate: the pros and cons of fluoridation. Prev Nutr Food Sci. 2018;23(3):171‐180. [DOI] [PMC free article] [PubMed] [Google Scholar]
- 4. Sidhu HS, Venkatanarasimha N, Bhatnagar G, Vardhanabhuti V, Fox BM, Suresh SP. Imaging features of therapeutic drug‐induced musculoskeletal abnormalities. Radiographics. 2012;32(1):105‐127. [DOI] [PubMed] [Google Scholar]
- 5. US Department of Health and Human Services Federal Panel on Community Water Fluoridation. U.S. Public Health Service Recommendation for Fluoride Concentration in Drinking Water for the Prevention of Dental Caries. Public Health Rep. 2015;130(4):318‐331. [DOI] [PMC free article] [PubMed] [Google Scholar]
- 6. US Department of Health and Human Services . Proposed HHS recommendation for fluoride concentration in drinking water for prevention of dental caries. Fed Regist. 2011;76:2383‐2388. [Google Scholar]
- 7. EPA . Fluoride: exposure and relative source contribution analysis. Report 820‐R‐10‐015. https://www.epa.gov/sites/production/files/2019-03/documents/fluoride-exposure-relative-report.pdf. Published 2010. Accessed May 2021.
- 8. Gerber B, Guggenberger R, Fasler D, et al. Reversible skeletal disease and high fluoride serum levels in hematologic patients receiving voriconazole. Blood. 2012;120(12):2390‐2394. [DOI] [PubMed] [Google Scholar]
- 9. Moon WJ, Scheller EL, Suneja A, et al. Plasma fluoride level as a predictor of voriconazole‐induced periostitis in patients with skeletal pain. Clin Infect Dis. 2014;59(9):1237‐1245. [DOI] [PMC free article] [PubMed] [Google Scholar]
- 10. Wermers RA, Cooper K, Razonable RR, et al. Fluoride excess and periostitis in transplant patients receiving long‐term voriconazole therapy. Clin Infect Dis. 2011;52(5):604‐611. [DOI] [PubMed] [Google Scholar]
- 11. Idowu OS, Azevedo LB, Valentine RA, et al. The use of urinary fluoride excretion to facilitate monitoring fluoride intake: a systematic scoping review. PLoS One. 2019;14(9):e0222260. [DOI] [PMC free article] [PubMed] [Google Scholar]
- 12. Ekstrand J, Ehrnebo M. The relationship between plasma fluoride, urinary excretion rate and urine fluoride concentration in man. J Occup Med. 1983;25(10):745‐748. [DOI] [PubMed] [Google Scholar]
- 13. Scientific Committee on Health and Environmental Risks . Critical review of any new evidence on the hazard profile, health effects, and human exposure to fluoride and the fluoridating agents of drinking water. https://ec.europa.eu/health/scientific_committees/environmental_risks/docs/scher_o_122.pdf. Published 2010. Accessed February 2021.
- 14. Buzalaf MAR, Whitford GM. Fluoride metabolism. Monogr Oral Sci. 2011;22:20‐36. [DOI] [PubMed] [Google Scholar]
- 15. Zhang JY, Yan LX, Tang JL, et al. Estimating daily salt intake based on 24 h urinary sodium excretion in adults aged 18‐69 years in Shandong, China. BMJ Open. 2014;4(7):e005089. [DOI] [PMC free article] [PubMed] [Google Scholar]