

Abstract
Influenza is an infectious respiratory disease with significant morbidity and mortality rates among people of all ages. Influenza viruses spread and evolve rapidly in the human population. Different immune histories, given by previous exposures to influenza virus infections and/or vaccinations, result in a great diversity of humoral and cellular immune responses. Understanding protective immune responses induced against circulating virus strains and potential pandemic strains is vital for infection prevention and disease mitigation. Vaccine formulations for seasonal influenza must be reformulated annually to stay abreast of occurring virus mutations. Assays to measure the capacity of antibodies to neutralize influenza viruses provide a good estimate of protection against future infections with strains similar or identical to those used in the assay. Here, we describe a detailed protocol of our standard in vitro microneutralization assay to assess the neutralization activity of polyclonal sera or purified monoclonal antibodies. © 2022 The Authors. Current Protocols published by Wiley Periodicals LLC.
This article was corrected on 27 August 2022. See the end of the full text for details.
Basic Protocol: Microneutralization assay to assess virus inhibition by serum or monoclonal antibodies
Support Protocol 1: Preparation of cDMEM
Support Protocol 2: Preparation and aliquoting of TPCK‐treated trypsin
Support Protocol 3: Inactivation of serum samples by RDE treatment
Keywords: influenza, neutralization, microneutralization, hemagglutinin, HA, neuraminidase, NA
INTRODUCTION
Influenza viruses belong to the Orthomyxoviridae family and are classified into four types: A, B, C, and D (Krammer & Palese, 2020). Although these viruses affect a diverse range of hosts in nature, only influenza A and B viruses cause significant seasonal outbreaks in the human population (Krammer et al., 2018). The respiratory disease caused by influenza virus infections represents a global challenge annually. In the US, from 2019 to 2020 alone, there were approximately 35 million influenza‐related illnesses and 20,000 influenza‐related deaths (CDC, 2021a). Influenza viruses spread primarily via airborne droplets and, once they infiltrate the human body, attach to epithelial cells in the upper and lower respiratory tracts (Krammer & Palese, 2020). Entry into host cells is mediated by the surface glycoprotein hemagglutinin (HA), which binds to sialic acid receptors on target cells (Krammer & Palese, 2020). Once attached, viruses enter cells via endocytosis and can replicate their genome (Dou, Revol, Ostbye, Wang, & Daniels, 2018; Lakadamyali, Rust, & Zhuang, 2004). Following protein expression, virions are assembled and can exit the cells, a process mediated by the surface glycoprotein neuraminidase (NA), which bears catalytic activity and cleaves terminal sialic acids from N‐linked glycans near the budding site to prevent virion aggregation on the cell surface (McAuley, Gilbertson, Trifkovic, Brown, & McKimm‐Breschkin, 2019).
During early childhood, influenza viruses prime the immune system and leave an imprint that shapes responses to future exposures. However, sterilizing immunity is difficult to achieve due to the constant evolution of these viruses and the constant challenge of antigenically drifted strains and different influenza virus subtypes (Carreno et al., 2020; Cobey & Hensley, 2017; Petrova & Russell, 2018). A means to prepare and reinforce the immune system to fight future infections is vaccination. The effectiveness of current influenza virus vaccines ranges between 40% and 60% during seasons when the circulating influenza virus strains match that of the vaccine (CDC, 2021b). According to the CDC, during the 2019‐2020 season, vaccination prevented an estimated 7.5 million influenza virus infections, 105,000 influenza‐related hospitalizations, and 6,300 influenza‐related deaths. Although the viral HA currently represents the main target of vaccination against influenza virus, substantial changes to the HA and NA occur due to viral antigenic drift (Krammer & Palese, 2015), rendering available vaccines ineffective or partially ineffective and making annual vaccine reformulation a necessity (Kim, Webster, & Webby, 2018). Alternative vaccination strategies, including NA‐based vaccines and approaches for a universal influenza vaccine that prevent seasonal and pandemic influenza virus infections are needed (Nachbagauer et al., 2021; Sautto, Kirchenbaum, & Ross, 2018; Strohmeier et al., 2021; Zost, Wu, Hensley, & Wilson, 2019). These promising vaccines are still in the research and development phase and are under intensive investigation.
Assays to monitor immune responses elicited following natural infection and vaccination are needed to evaluate the potential level of protection that an individual has acquired. Typically, these assays are performed using serum or plasma samples collected at different time points through the course of an infection or vaccination. Moreover, specimens from animal models such as mice, hamsters, guinea pigs, ferrets, and non‐human primates used in studies to mimic human influenza virus infection or vaccination conditions are commonly tested (Carreno et al., 2020; McMahon et al., 2019; Mifsud, Tai, & Hurt, 2018). In particular, the neutralization assay can provide information about the level and potency of the antibodies that directly block influenza viruses during the replication cycle. Hence, these functional assays provide estimates of the level of protection that the host might display if exposed to a particular influenza virus strain tested. Various types of neutralization assays with distinct setups and reagents are used in laboratories worldwide. Plaque reduction neutralization (PRNT) assays and microneutralization assays are most commonly used due to their robustness and accuracy. PRNTs are reliable, but typically require higher sample volumes and are more limited in the number of samples that can be tested at once. By contrast, microneutralization assays require lower serum volumes and can be arranged in a setup that allows testing of dozens to hundreds of samples simultaneously. In terms of the virus used, pseudotyped influenza viruses can be used to study the neutralization of highly pathogenic or (pre‐) pandemic strains that otherwise would require a biosafety level 3 (BSL‐3) facility (Carnell, Ferrara, Grehan, Thompson, & Temperton, 2015). Although using pseudotyped virus particles can lead to rough estimates of neutralization against live viruses, the correlation is not optimal, especially because they only measure inhibition of entry, not inhibition of viral egress, HA maturation, NA activity, or multicycle replication. Another option is to use wildtype isolates or reverse genetics–based viruses that carry the HA and NA of the desired strain in an attenuated and safe A/Puerto Rico/8/34 backbone (Beare, Schild, & Craig, 1975; Belser et al., 2017; Campbell et al., 2014; Matsuoka et al., 2003; Ping et al., 2015; Rodriguez et al., 2009). Several readouts can be used in microneutralization assays, including staining for de novo–synthesized viral proteins (e.g., nucleoprotein), cytopathic effect (CPE), or HA activity of the supernatant. The latter is simple but objective, whereas staining for viral proteins requires more complex steps, and determination of CPE can be very subjective. The setting described here relies on live viruses (including those based on reverse genetics) and an HA assay as the readout, and provides accurate and reproducible results.
CAUTION: The Basic Protocol and Support Protocol 3 involve work with mammalian cells, human sera and plasma, and with infectious respiratory viruses known to cause disease in humans. Influenza virus is a BSL‐2 or BSL‐3 pathogen and in some cases classified as select agent. Appropriate guidelines and regulations for the use and handling of human‐derived materials and pathogenic microorganisms in accordance with local regulations should be followed. Personal protective equipment (PPE) should be used according to local guidelines when working with influenza viruses. Work should be performed in a biosafety cabinet (e.g., Thermo Scientific, cat. no. 1323TS) at all times. Residues should be discarded according to institutional guidelines for potentially infectious pathogens. For additional information, refer to Meechan & Potts (2020).
MICRONEUTRALIZATION ASSAY TO ASSESS VIRUS INHIBITION BY SERUM OR MONOCLONAL ANTIBODIES
This protocol describes an in vitro microneutralization assay to assess the inhibitory capacity of antibodies contained in polyclonal sera or purified monoclonal antibodies (mAbs). The assay is performed in a 96‐well plate format, allowing high‐throughput sample processing. It uses live seasonal influenza viruses and viruses produced through reverse genetics that express the HA and NA of seasonal, avian, or pandemic strains in a safe and attenuated A/Puerto Rico/8/34 backbone. It involves addition of sera or mAbs both during the virus incubation period and after inoculum removal to mimic physiological conditions in which detectable antibodies in serum are continuously present.
First, the virus needs to be titered using a 50% tissue culture infectious dose (TCID50) assay, which will take 2‐5 days. This is important to determine optimal infection conditions. The microneutralization assay itself is outlined in Figure 1. Serum or mAb samples are serially diluted in 96‐well plates. Virus is added to the serum/mAb samples and incubated for 1 hr to allow neutralization of the virus inoculum. The neutralized virus/serum/mAb mix is then added to MDCK cells. After a period of 1 hr, the infection procedure is stopped, additional serum/mAb is added to the cells, and the cells are grown for 48‐72 hr to allow time for several rounds of the full viral life cycle in the presence of antibodies. Finally, the supernatant is used in a hemagglutination assay with red blood cells to determine the presence of virus and the degree of neutralization.
Figure 1.
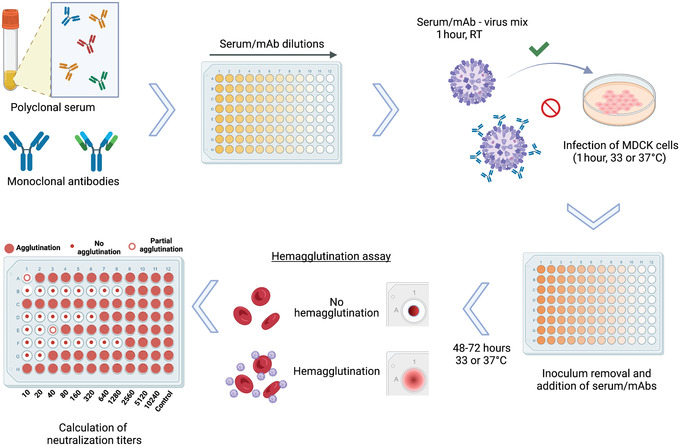
Overview of microneutralization assay for influenza virus serology. Antibodies in polyclonal serum samples of different origin, or monoclonal antibodies (mAb) in distinct configurations including chimeric antibodies, Fab fragments, and others, can be assessed for their neutralization capacity against different strains and subtypes of influenza virus. After dilution of samples, the virus to be tested is added at 100 TCID50/50 µl and incubated for 1 hr at room temperature (RT). The serum/mAb–virus mix is transferred to confluent MDCK cells and incubated for 1 hr at 33° or 37°C, depending on the virus strain used. After inoculum removal, serum samples diluted in infection medium are added to the plates and incubated for 48‐72 hr at 33° or 37°C. A hemagglutination assay is performed to detect the presence of virus in cell supernatants and to calculate neutralization titers. Reciprocal titers (1:x serum dilution) are displayed as absolute values.
Serum samples are known to contain nonspecific virus inhibitors that may interfere with interpreting the activity of specific virus‐neutralizing antibodies. Thus, these nonspecific inhibitors must first be inactivated. This is described in Support Protocol 3.
Control samples may vary depending on the experimental setup and from laboratory to laboratory. A polyclonal serum or pool of several serum samples from individuals with high neutralization titers against influenza viruses is preferred. This pooled serum can be aliquoted and stored at −80°C for extended periods of time (>5 years) without significant decrease in titer. The initial dilution of this serum can vary depending on the titer, but a 1:100 initial dilution is typically used. Ideally, for each virus, three different control samples would be used covering a range of low, medium, and high neutralization. If these are not available, a control with medium to high reactivity should be used. If a neutralizing mAb is preferred, the initial concentration is set to 30 μg/ml. Ideally the control should display a high neutralization titer of >320.
Materials
Madin‐Darby canine kidney (MDCK) cells (ATCC, cat. no. PTA‐6500), confluent, grown in T175 cell culture flasks (Falcon, cat. no. 353112)
Phosphate‐buffered saline (PBS), pH 7.4 (Gibco, cat. no. 10010023)
0.05% trypsin‐EDTA (Gibco, cat. no. 25300054)
cDMEM (see Support Protocol 1)
0.4% trypan blue (Gibco, cat. no. 15250061)
Virus stock(s) to be tested
Control samples with low, medium, and high neutralization activity
Normocin (InvivoGen, cat. no. ant‐nr‐2)
UltraMDCK Serum‐free Renal Cell Medium (Lonza, cat. no. BEBP12‐749Q)
TPCK‐treated trypsin (see Support Protocol 2)
-
Samples to be tested:
Inactivated serum (see Support Protocol 3) at 1:10 dilution
mAbs at 30 μg/ml
Red blood cells (RBCs): chicken or turkey (Lampire, cat. nos. 7201403, 7209403), whole blood with Alsever's solution
Humidified culture incubator at 33° or 37°C ± 1°C with 5% ± 2% CO2 (Thermo Scientific, cat. no. 3424)
15‐ and 50‐ml sterile conical polypropylene tubes (Thermo Scientific, cat. nos. 339650 and 339652)
5‐, 10‐, 25‐, and 50‐ml sterile serological pipettes (Falcon, cat. nos. 356543, 357551, 357535, and 356550)
1.5‐ml microcentrifuge tubes (Eppendorf, cat. no. 022363204)
Cell counting slides (Countess, Thermo Fisher, cat. no. C10312)
Automated cell counter (Thermo Fisher Countess II FL, Marshall Scientific, cat. no. TF‐CACC2FL)
96‐well clear, flat‐bottom, polystyrene tissue culture plates, sterile (Corning, cat. no. CLS9102‐50EA)
Multichannel pipette, 30‐300 µl (Eppendorf, cat. no. 3125000060)
1‐ml barrier micropipette tips (Invitrogen, cat. no. 2079PK)
Sterile reagent reservoirs (Thermo Scientific, cat. no. 15075)
Microscope (Olympus prod. cat. no. CKX53, or equivalent)
96‐well U‐bottom plate
Multichannel aspirator (Corning, cat. nos. 4930, 4931)
Plate shaker (Wallac, cat. no. 1296‐004)
96‐well polystyrene conical bottom plates (Thermo Scientific, cat. no. 249570)
Count and seed MDCK cells
-
1
Record the cell passage number and date of the most recent split of MDCK cells in culture.
It is important to keep consistency between assay runs, as infectivity varies depending on cell passage number (typically p5‐p40). When seeding cells, only combine flasks that contain cells of the same passage number and were propagated in parallel.
-
2
Aspirate medium from confluent MDCK monolayers grown in T175 cell culture flasks.
A confluent flask can be expected to yield enough cells for four to six 96‐well plates. Each plate can accommodate up to twelve serum/mAb samples at the appropriate dilutions. One plate must be reserved for controls.
-
3
Add 10 ml PBS to flasks and wash monolayers by rocking back and forth.
-
4
Aspirate PBS and add 5 ml of 0.05% trypsin‐EDTA to detach and disaggregate monolayers. Tilt flasks to ensure that all cells are covered and incubate at 37°C until cells detach (10‐20 min).
The incubation time must not exceed 30 min.
-
5
Tap flasks until all cells are in suspension, then add cDMEM to a total volume of 10 ml/flask and transfer cells to a 50‐ml conical tube. If multiple flasks were used, pool cells at this step.
-
6
To count cells, mix the cell suspension up and down with a serological pipette and transfer a small aliquot (∼300 µl) to a microcentrifuge tube, then take 20 µl from this tube to a fresh microcentrifuge tube and add 20 µl of 0.4% trypan blue. Pipette 10 µl to side A and side B of the same cell counting slide and count the number of live cells per ml in both sides using an automated cell counter.
-
7
Calculate the mean number of live cells per ml by averaging the values from sides A and B.
-
8
Dilute cells to ∼1.5–3 × 10⁵ cells/ml in cDMEM. Make sure the cells are evenly distributed.
Each plate requires 10 ml cells, including the plate for controls. It is best to prepare a slightly larger volume than needed (∼5 ml excess) to account for pipetting losses.
-
9
Label the required number of clear, flat‐bottom 96‐well tissue culture plates with initials, date, and plate number.
-
10
Transfer cell suspension to a sterile reservoir, then transfer 100 µl suspension (∼1.5–3 × 10⁴ cells) to each well of the 96‐well plates using a multichannel pipette.
-
11
Rock gently and then incubate overnight in a 37°C incubator. Record time of incubation.
-
12
Before proceeding with the assay, verify visually that cells have reached 80%‐95% confluency and record the estimated confluency.
Do not proceed if the cells are not 80%‐95% confluent.
-
13
Thaw the virus stock(s) and control samples at 4°C.
Prepare infection medium
-
14
Add 2 ml Normocin to a freshly opened 1‐L bottle of UltraMDCK medium (0.2% v/v) and shake to mix.
-
15
Thaw the number of aliquots of TPCK‐treated trypsin needed to give 30 μl/plate.
-
16
Prepare at least 30 ml infection medium per plate by adding 30 μl/plate TPCK‐treated trypsin to 30 ml/plate UltraMDCK with Normocin. Mix well.
Infection medium should be prepared on the day of use and kept at 4°C.
Determine TCID50
The TCID50 to titer the virus stock should be determined before starting the microneutralization assay and will take 2‐5 days, depending on the virus.
-
17
Dilute virus stock 1:10 by adding 100 μl to a 1.5‐ml microcentrifuge tube containing 900 μl infection medium. Mix and then transfer 100 μl to another tube containing 900 μl infection medium to make a 1:100 dilution.
Make sure to change tips at every dilution step. Virus dilution steps are illustrated in Figure 2.
Figure 2.
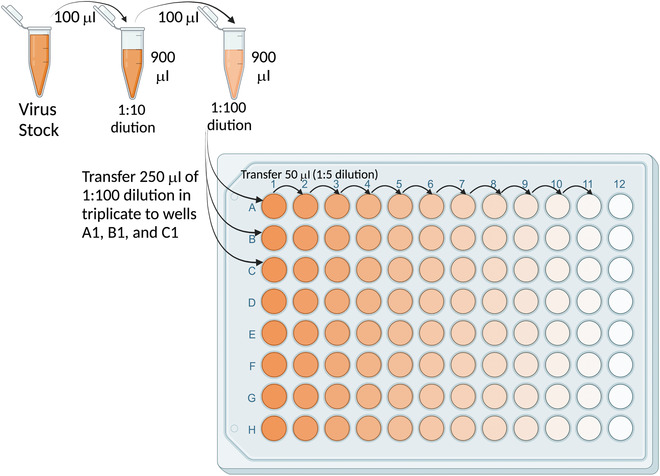
Configuration for dilution of virus stock to measure the 50% tissue culture infectious dose (TCID50).
-
18
Transfer 250 μl of 1:100 virus to triplicate wells (A1‐C1) of a 96‐well U‐bottom plate (Fig. 2).
-
19
Add 200 μl infection medium to columns 2‐12 of rows A‐C.
-
20
Serially dilute virus 5‐fold for ten dilutions (up to column 11) by transferring 50 μl for each dilution (Fig. 2). Remove 50 μl from column 11.
Make sure to change tips at every dilution step. The last column is left with infection medium only to serve as a no virus control.
-
21
Take a plate of MDCK cells (step 12) and verify that they are at the right confluency (80%‐95%).
The assay should not be started with subconfluent or overconfluent cells. If cells are subconfluent, the assay can be delayed until the desired confluency is reached.
-
22
Aspirate medium and wash cells with 200 μl PBS. Add 60 μl infection medium to the top three rows.
Only the top three rows of cells are required to accommodate the virus dilutions.
-
23
Transfer 60 μl of each virus dilution (including the no virus controls) to the corresponding wells in the plate of cells. Incubate 1 hr at 33° or 37°C, depending on the viral strain used, to allow virus absorption.
Pipette tips should be changed for transferring every virus dilution. Virus should be added carefully to the side of the wells to prevent damage to the cell monolayer.
Typically, influenza B viruses are grown at 33°C and influenza A viruses at 37°C.
-
24
Remove medium from all wells using a multichannel aspirator.
-
25
Wash with 200 µl PBS and remove by aspiration.
-
26
Add 100 μl infection medium to all wells and incubate 48 and 72 hr at 37°C.
The timepoint that yields a higher TCID50 is selected for the microneutralization assay.
-
27
Analyze cells under a microscope for CPE.
Wells with less diluted virus should display CPE (characterized by a change in cell morphology, with cells becoming rounded and detaching from the plate) and wells with more diluted virus should display less or no CPE. Controls without virus are used as a reference for the lack of CPE.
-
28
As a final readout, perform the HA assay as described in the last section of this protocol.
-
29
Determine which wells in the dilution series are positive for virus. Calculate the TCID50/ml of the virus stock using the Reed & Muench.
Various calculation spreadsheets for this can be found online. Alternatively, a single formula can be used as described in Ramakrishnan (2016).
Prepare plates of serially diluted serum/mAb samples
Once the TCID50 has been determined, the neutralization assay can be performed. The required number of 96‐well plates with MDCK cells must be prepared again according to steps 1‐12 one day ahead of time. Once the plates are ready, the serum dilutions can be started. Serial dilutions can be performed in two different configurations (Fig. 3). Left‐right dilutions (panel A) are preferred if high endpoint titers are expected because they allow more dilutions. Top‐down dilutions (panel B) allow more samples to be run per plate, but should be used only if neutralization titers are not expected to exceed an 8‐well dilution.
Figure 3.
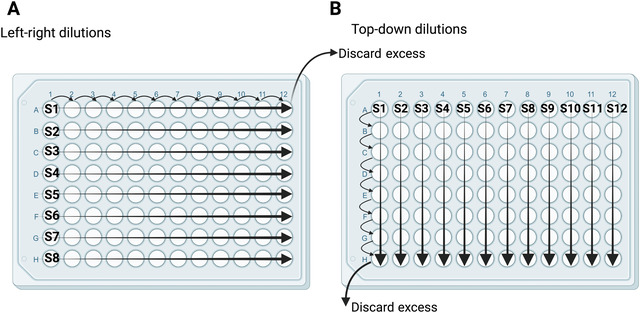
Two configurations for serial dilutions of serum and mAb samples. Left‐right dilutions (A) are best for samples with expected higher antibody titers. Top‐down dilutions (B) are best for processing more samples with lower expected antibody titers. S1‐S12 denote samples 1‐12. Regardless of configuration, serum samples are diluted two‐fold by transferring 120 μl to 120 μl infection medium, and mAb samples are diluted three‐fold by transferring 80 μl to 160 μl infection medium. An equal volume (120 or 80 μl) is removed from the last column or row.
-
30
Prepare the required number of empty 96‐well plates needed for the serum/mAb samples to be serially diluted. Number plates and label as serum or mAb dilutions (or similar).
-
31
On the lid, label each row (for left‐right dilutions) or column (for top‐down dilutions) with the sample ID or other information that correctly identifies the samples.
If multiple (e.g., longitudinal) samples from the same individual are being tested, all samples should be run on the same plate. If this is not possible, they should be run on consecutive plates.
-
32
Using a multichannel pipette, add infection medium (see steps 14‐16) to columns 2‐12 (for left‐right dilutions) or rows B‐H (for top‐down dilutions) on each dilution plate. Use 120 µl/well if testing serum samples or 160 µl/well if testing mAb samples.
-
33
Add 240 µl inactivated serum (diluted 1:10) or mAb (30 µg/ml initial concentration) to the first column (for left‐right dilutions) or first row (for top‐down dilutions).
-
34
Mix samples by pipetting with a multichannel pipette six to eight times, then make either a two‐fold dilution of serum samples by transferring 120 µl to the second column (left‐right dilutions) or second row (top‐down dilutions) or a three‐fold dilution of mAb samples by transferring 80 µl.
-
35
Change tips, mix the second row/column by pipetting six to eight times, and repeat the transfer from the second row/column to the third.
-
36
Continue until the last column/row is reached, then discard 120 μl (for serum samples) or 80 μl (for antibody samples) from the last column/row to make the volumes equal.
-
37
Prepare an empty 96‐well plate for controls and label as control dilutions (or similar).
-
38
Add 120 µl infection medium to all wells except column 1.
-
39
Add 240 µl infection medium to wells D1‐H1 for no virus and virus only controls. Add 240 µl of control sample to wells A1‐C1.
We typically assign only two wells for no virus controls, since no HA is expected and the phenotype is clear. This allows the controls to be kept to a single plate.
-
40
Mix column 1 by pipetting six to eight times with a multichannel pipette and transfer 120 µl to the second column.
-
41
Change tips, mix the second column by pipetting, and transfer to the next column. Continue to the last column and discard 120 µl from the last column. As above, change tips at every step.
Prepare virus for assay
-
42
Record the concentration of the virus stock in TCID50/50 μl along with all other information associated with stock (name, date, batch number, etc.).
-
43Calculate the required virus dilution factor (DF) according to the formula:
The desired final concentration is 100 × TCID50/50 µl. If the virus stock is 200,000 × TCID50/50 µl, the dilution factor is 2000.
-
44
Calculate the total volume of virus needed (V v) to give 7 ml per plate.
-
45Determine the dilution steps needed to reach the desired volume (V v) at a concentration of 100 × TCID50/50 µl. Record the dilution steps in the following format (shown for a 200,000 × TCID50/50 µl stock and three plates requiring a V v of 21 ml):
- 1:2 dilution (100 µl virus stock + 100 µl infection medium) → 100,000 TCID50/50 µl
- 1:10 dilution (100 µl previous dilution + 900 µl infection medium) → 10,000 TCID50/50 µl
- 1:10 dilution (300 µl previous dilution + 2.7 ml infection medium) → 1000 TCID50/50 µl
-
1:10 dilution (2.1 ml previous dilution + 18.9 ml infection medium) → 100 TCID50/50 µlNo single dilution step should be higher than 1:10, and no pipetted virus volume should be smaller than 50 µl. All dilution steps should be documented. Pipette tips need to be changed at every step.
-
46
Perform serial dilutions according to the documented steps. Use the smallest appropriate tube/flask for each dilution (e.g., microcentrifuge tube for volumes < 1.5 ml). Store diluted virus on ice until use.
Mix virus with serum/mAb
-
47
Prepare a new 96‐well plate for each serum/mAb dilution plate (step 36) and control dilution plate (step 41). Label the new plates as virus/serum or virus/mAb (or similar) and include the number of the corresponding dilution plate.
These new plates will be used for incubating virus with serum/mAb. For this purpose, half the volume of diluted samples will be transferred to the new plates. The remainder will be used later to replace serum/mAb after removal of inoculum.
-
48
Transfer 60 µl from each dilution plate to the corresponding new plate. Change tips after each transfer.
-
49
Add 60 µl virus to each well of the virus/serum or virus/mAb plates.
-
50
For the control plate, add 60 µl virus to rows A‐F and 60 µl infection medium to rows G‐H.
-
51
Incubate virus/serum plates 1 hr (50‐90 min) at room temperature (18°‐25°C) on a rocking platform at 625 rpm.
-
52
Keep the virus/serum/mAb plates on the shaker until use for infecting cells (step 56). Store the original dilution plates at 4°C until use for replacing serum/mAb (step 60).
Infect cells
-
53
Remove plates containing MDCK cells (step 12) from the incubator.
-
54
Aspirate medium and add 200 µl PBS per well using a reservoir and a multichannel pipette.
To keep cells from drying out, aspirate medium from a maximum of two plates at a time.
-
55
Label the top of each plate to correspond with serum/mAb and control dilution plates. Document which samples are run in each position for each plate.
-
56
Remove virus/serum (or mAb) plates and the control plate from the shaker. Working row by row, aspirate PBS from the first cell plate and replace with 100 µl from the corresponding virus/serum plate. Change tips between transfers to avoid cross‐contamination. When the last row is done, transfer the plate to the 33° or 37°C incubator.
The empty virus/serum plates can be discarded.
-
57
Document the temperature and time when the first plate was incubated.
-
58
Repeat infection for each plate, working one plate at a time and recording each time of infection.
Stop virus infection and replace serum
-
59
When the first plate has incubated for 1 hr, stop infection by removing the supernatant from all wells and adding 200 μl PBS. Change tips between rows/columns to prevent cross‐contamination. Document the time when infection was stopped.
-
60
Transfer 50 µl serum or Ab from the corresponding dilution plates (step 52) to the correct rows. Change tips after each transfer to avoid cross‐contamination.
The resulting serum/mAb dilution will be the same as during infection.
-
61
Return plate to the incubator. Document the incubation time and temperature (33° or 37°C).
-
62
Repeat steps 59‐61 for all plates, handling one plate at a time at 1 hr after infection.
-
63
Incubate plates for 48‐72 hr, depending on the virus. Document the incubation time.
The optimal incubation time is determined initially when the TCID50 is calculated and is detected by visible CPE in infected cells, indicative of productive viral replication, which allows a robust hemagglutination (HA) assay to be performed as the final readout.
Prepare RBCs for HA assay
-
64
Document the species and date of the RBC bleed.
The appropriate species of RBCs depends on the virus. Typically, chicken or turkey RBCs work well with most influenza virus strains. Contemporary seasonal influenza viruses may require the use of guinea pig RBCs.
-
65
Calculate the required volume of diluted blood (V db) as 7 ml times the number of plates.
-
66If the stock concentration of RBCs is at least 13%, calculate the required volume of RBC stock (V sb in ml) as:
Blood is diluted to 0.5% RBCs for the HA assay.
-
67
To wash and pellet RBCs, agitate the blood container to ensure assure even distribution of RBCs, then transfer the calculated volume (V sb) to a 50‐ml conical tube containing 45 ml PBS and mix by inverting. Centrifuge 5 min at 300 × g, 4°C, and remove the supernatant.
The pellet is considered to contain 100% RBCs.
-
68Calculate the volume of PBS (V PBS) needed to dilute the RBCs as:
-
69
Add V PBS to the pellet of RBCs and keep at 4°C until use (discard after the day of preparation).
Perform HA assay
-
70
Add 50 µl neat supernatant (step 63) to the corresponding wells of a 96‐well conical bottom plate in a mirror fashion.
-
71
Resuspend the 0.5% RBCs by inverting the tube several times and pour into a sterile reservoir. Pipette 50 µl to each well, being careful not to touch the wells.
-
72
Incubate 30‐60 min on ice or in a 2°‐8°C refrigerator to develop.
-
73
Read the HA assay and scan the plate for documentation.
Complete hemagglutination is considered to have occurred when the RBCs are still in suspension after the no virus controls have settled completely, which is seen as a visible pellet in the bottom of the plate (Fig. 4) that slides down if the plate is tilted at a 45° angle. When a portion of the RBCs is partially agglutinated (or partially settled), the absence of hemagglutination can be confirmed by tilting the plates at a 45° angle for 20‐30 s. If the settled RBC pellet slides down, that particular well is considered negative for agglutination (see last step of Fig. 1 and Fig. 4).
The last agglutination‐negative well for each sample is considered the endpoint dilution and is calculated assuming a 1:10 starting concentration in the first well (e.g., four agglutination‐negative wells would result in an endpoint titer of 1:80). A sample with no agglutination is considered negative and assigned a value of 5.
Figure 4.
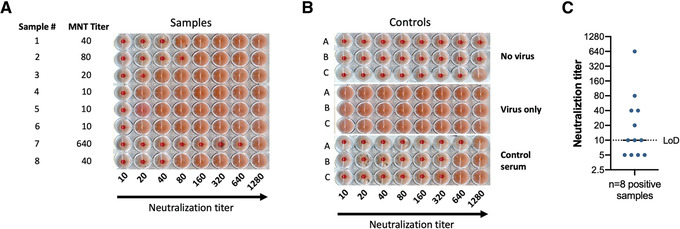
Results of a microneutralization assay against B/Brisbane/60/2008 using samples with variable titers. (A) Results for a sample plate. Sample number and microneutralization titer (MNT) are shown in the two left columns. As shown on the x axis, serum samples were first diluted 1:10 and then serially diluted 1:2. A lack of agglutination is indicated by a cell pellet at the bottom of the plate, whereas agglutination is indicated by a homogenous cloudy reddish cell suspension. (B) Controls used for experiment in (A). (C) Representation of plotting and neutralization titer visualization showing eight positive samples from panel A plus four negative samples. The limit of detection (LoD) of the assay is indicated by a dotted line. The negative samples are displayed below the LoD and positive samples are shown equal to or above the LoD. Reciprocal titers (1:x serum dilution) are displayed as absolute values.
-
74
Verify that all controls meet the qualifying criteria for the assay, which consist of reaching the previously assessed neutralization titer ± one titer value in at least two of the triplicates (Fig. 4B).
-
75
Record all titers in the digital data sheet associated with the particular study.
Support Protocol 1. PREPARATION OF cDMEM
Here, we describe the preparation of complete Dulbecco's modified Eagle medium (cDMEM) with 10% fetal bovine serum (FBS) and antibiotics (Normocin or penicillin‐streptomycin). cDMEM is used to culture MDCK cells employed in the microneutralization assay.
Materials
Two 500‐ml bottles DMEM with high glucose, l‐glutamine, phenol red, and sodium pyruvate (stored at 4°C, Gibco, cat. no. 11995065)
Two 50‐ml frozen aliquots FBS (heat‐inactivated for 30 min at 57°C, Gibco, cat. no. 16210072)
-
Antibiotic mixture (select one):
Two 1‐ml frozen aliquots of 100 μg/ml Normocin (1:500 dilution of stock, InvivoGen, cat. no. ant‐nr‐1)
100U/ml penicillin and 100μg/ml streptomycin (P/S, Gibco, cat. no. 15140122)
1 M HEPES (Gibco, cat. no. 15630080)
1‐L sterile vacuum filtration system (Stericup, Millipore, cat. no. SGCPU10RE)
Vacuum line (Thermo Scientific, cat. no. 13‐713‐03)
NOTE: To maintain sterility, all steps should be performed in a class II biological safety cabinet (Thermo Scientific, cat. no. 1323TS).
-
1
Thaw two 50‐ml aliquots of FBS overnight at 4°C.
-
2
If using Normocin, thaw two 1‐ml aliquots at room temperature before use.
Avoid repeated freeze‐thaw cycles; thaw only the aliquots needed.
-
3
Unpack the vacuum filtration system inside the biosafety cabinet. Connect the Stericup and Steritop filtration system to the biosafety cabinet's vacuum line.
-
4
Pour one 500‐ml bottle of DMEM into the Steritop bottle.
Confirm the expiration date of the DMEM before beginning.
-
5While the initial volume of DMEM is filtering, add the following:
- 100 ml FBS
- 2 ml Normocin or 10 ml P/S
- 10 ml 1 M HEPES
-
6
While still filtering, add the final 500 ml DMEM.
-
7
Once filtration is complete, unscrew the upper part (filter unit) of the Stericup and leave it sitting on the bottle. Aseptically unwrap the lid and close the bottom Stericup bottle with the lid.
-
8
Label as cDMEM with date of preparation, date of expiration (2 months), and initials of preparer. Store at 2°‐8°C.
Support Protocol 2. PREPARATION AND ALIQUOTING OF TPCK‐TREATED TRYPSIN
Here, we describe the procedure for preparing and aliquoting a working solution of commercially available TPCK‐treated trypsin. Treatment of trypsin protease with TPCK (l‐1‐tosylamide‐2‐phenylethyl chloromethyl ketone) inhibits chymotrypsin without affecting trypsin activity, providing higher cleavage specificity. Trypsin added to infection medium is able to catalytically cleave influenza virus hemagglutinin (HA0 into HA1/HA2), rendering the virus infectious. Influenza virus hemagglutinin activation is necessary for multicycle growth of the virus in cell culture. It should be noted that TPCK‐treated trypsin is inhibited by the presence of FBS in cell culture medium.
Materials
TPCK‐treated trypsin, lyophilized (Sigma, cat. no. T8802‐100MG)
DNase/RNase‐free distilled water (Invitrogen, cat. no. 10977‐015)
1.5‐ml microcentrifuge tubes (Eppendorf, cat. no. 022363204)
15‐ml polypropylene sterile conical tube (Thermo Scientific, cat. no. 339650)
1000‐µl barrier pipette tips (Thermo Scientific, cat. no. 2079PK)
NOTE: To maintain sterility, all steps should be performed in a class II biological safety cabinet (Thermo Scientific, cat. no. 1323TS).
Prepare 10,000× stock (10 mg/ml)
-
1
Remove the metal cover and rubber cap from a 100‐mg vial of lyophilized TPCK‐treated trypsin.
-
2
Add 10 ml ultrapure water and allow to rehydrate for 5 min at room temperature.
-
3
Pipette solution up and down ten times with a 1‐ml barrier pipette tip.
-
4
Dispense 1‐ml single‐use aliquots into 1.5‐ml microcentrifuge tubes.
-
5
Label as TPCK‐TR 10,000× (10 mg/ml) with lot number, date of freezing, date of expiration (2 years), and initials. Store at −20°C.
Prepare 1000× working solution (1 mg/ml)
-
6
Thaw an aliquot of 10,000× stock.
-
7
Pipette the entire aliquot into a 15‐ml conical tube containing 9 ml ultrapure water (total volume 10 ml).
-
8
Dispense 200‐µl single‐use aliquots into 1.5‐ml microcentrifuge tubes.
-
9
Label as TPCK‐TR 1000× (1 mg/ml) with lot number, date of freezing, date of expiration (2 years), and initials. Store at −20°C.
Support Protocol 3. INACTIVATION OF SERUM SAMPLES BY RDE TREATMENT
This protocol can be implemented to inactivate nonspecific virus inhibitors in human or animal serum samples using receptor‐destroying enzyme II (RDE II). The commercial enzyme used here is a filter‐sterilized, lyophilized culture supernatant of Vibrio cholerae Ogawa type 558.
Serum samples should be collected according to the specific laboratory's standard protocols. They are not highly sensitive to temperature changes, but should be stored at 4°C for short periods of time (up to 4 weeks) and at −20° or −80°C for extended periods of time (up to 5‐10 years or even longer at −80°C). To prevent a decrease in neutralization titers, samples should not undergo repeated freeze‐thaw cycles.
Materials
Receptor‐destroying enzyme II (RDE II, Denka Seiken, cat. no. YCC340122)
Serum samples
75% (v/v) ethanol
2.5% (w/v) sodium citrate (Fisher Scientific, cat. no. BP327‐1), filter sterilized
PBS (Gibco, cat. no. 10010023), filter sterilized
Ethanol‐proof marker (VWR, cat. no. 52877‐310)
1.5‐ml microcentrifuge tubes (Eppendorf, cat. no. 022363204)
37° and 56°C water baths (VWR, cat. no. 89501‐464)
Floating tube rack (Bel‐Art, cat. no. 12636475)
Prepare working stock of RDE
-
1
Dissolve lyophilized RDE II in 20 ml of PBS.
-
2
Prepare 1‐ml aliquots in 1.5‐ml tubes and store up to 2 years at −20°C.
Initiate RDE treatment
-
3
Thaw the required volume of RDE II working stock needed to give 75 μl per sample.
-
4
Use an ethanol‐proof marker to label sterile 1.5‐ml microcentrifuge tubes with sample ID and other information necessary to correctly identify the samples.
-
5
Transfer 25 µl of each serum sample to its corresponding tube.
-
6
Add 75 µl RDE working stock to each tube and mix well.
-
7
Close tubes, transfer to a floating rack for a water bath, and incubate 18‐20 hr at 37°C.
Stop treatment
-
8
Remove samples from water bath and spin briefly (5‐10 s at 100 × g) to bring down any condensation in the lid.
-
9
Place tubes in a sterile environment (e.g., biosafety cabinet) and spray the outside with 75% ethanol. Ensure that no ethanol residue is left on the tops of the tubes to avoid contaminating the sample.
-
10
Add 75 µl sterile 2.5% sodium citrate to each tube and mix well.
-
11
Close tubes, transfer to a floating rack, and incubate for 60 min (± 10 min) at 56°C.
Dilute inactivated samples
-
12
Remove samples from water bath and spin briefly (5‐10 s at 100 × g).
-
13
Return tubes to the sterile environment and spray with 75% ethanol. Ensure that no ethanol is left on the top of the tubes.
-
14
Add 75 µl sterile PBS to each tube and mix well. Store up to 72 hr at 4°C.
The serum is now inactivated and diluted 1:10.
COMMENTARY
Background Information
The neutralization assay described here is performed to measure the levels of influenza virus–neutralizing antibodies. Our assay has evolved to be performed in a BSL‐2/BSL‐2+ facility using a 96‐well plate setup to allow high sample throughput. Typically, up to 60 duplicate samples or 120 single samples can be processed by a single operator in one day. Moreover, the setup involves incubation of the test sera continuously through the viral infectious cycle to mimic physiological conditions of infection. Importantly, because the assay is multicycle and because serum/mAb is present at all times, the assay can measure inhibition of viral entry (usually mediated by anti‐HA antibodies), inhibition of virus egress (usually mediated by anti‐HA and anti‐NA antibodies), and inhibition of HA maturation (mediated by anti‐stalk antibodies) (Krammer, 2019). The virus therefore can detect classical neutralizing anti‐HA antibodies and to some extent anti‐stalk antibodies (weak entry inhibition, egress inhibition) and potentially NA‐inhibiting antibodies (egress inhibition) (Stadlbauer et al., 2019). The assay may lack accurate sensitivity, especially for NA‐inhibiting antibodies, and thus an NA inhibition assay may be better suited. This assay is able to provide information about the neutralization of live seasonal influenza viruses and safe, attenuated A/Puerto Rico/8/34‐based reassortant versions of human seasonal, pandemic, and animal influenza viruses. By using these safe reassortant strains, our assay circumvents the need to use certain live viruses that would require a BSL‐3 facility and/or are select agents in the U.S. Moreover, it employs a simple and objective readout based on a standard hemagglutination assay that takes at maximum one hour to perform. These characteristics reduce the time and complexity of the assay as compared to other assays that have been described, particularly those requiring staining of viral components (Crowe, Schwartz, Black, & Jaswaney, 1997; Gross, Bai, Jefferson, Holiday, & Levine, 2017; Kitikoon & Vincent, 2014) or other readouts (Zhao et al., 2018).
Critical Parameters and Troubleshooting
Various aspects should be taken into consideration to obtain optimal results when performing this assay. First, the conditions used when running the assay should match the conditions used to calculate the TCID50 in aspects including, but not limited to, the density and overall health of cells at the time of the assay, the composition of the culture and infection media, and the incubation times and temperature used. Strict protocol alignment will guarantee consistency between TCID50 calculation and sample runs. Moreover, adherence to the protocol through various runs will determine the reproducibility of the results. The reagents used must be stored at the appropriate temperatures (viruses should always be kept at −80°C, culture media and other reagents at 4°C, etc.). Furthermore, reagents used in a particular experiment should be from the same batch through all runs. Suitable controls should be included in every experiment to assess consistency and trending among different runs. Ideally, the same operator should process all the samples from a complete experiment to minimize inter‐operator variability in serological assays. For longitudinal sampling, it is best to have all samples from one individual or model animal on the same plate to minimize the impact of plate‐to‐plate variability.
The use of some specific reagents is essential to ensure that the assay works optimally. TPCK‐treated trypsin renders the virus hemagglutinin active, which allows multicycle replication of the virus. Moreover, treatment of serum samples with RDE permits specific identification of antibody‐mediated virus inhibition without contribution of virus inhibition by nonspecific serum factors. It is particularly important that the operator is fully trained in running and interpreting the hemagglutination assay, which represents the final readout of the microneutralization assay. The RBCs should be selected based on the virus used. Chicken or turkey RBCs are commonly used, but human, guinea pig, horse, or other sources may be more optimal depending on the virus. This can be tested with the respective viruses before assays are set up. Typically, chicken or turkey RBCs are used for H1N1, older strains of H3N2, and influenza viruses. Guinea pig or hamster RBCs are used for contemporary H3N2 strains, but this is not a general rule. Likewise, it is important to have robust virus replication in the assay. Incubation times may be optimized for each virus strain (e.g., 48, 72, or 96 hr). Typically influenza A viruses grow at 37°C for 2 days, while influenza B viruses grow at 33°C for 3 days, and titers between 105 and 106 PFU/ml are needed to result in a positive HA readout. If virus replication is too low, plates may give spotty readouts (some wells in the positive control are positive, some are negative) or the assay may fail. In such circumstances, sera may appear to be neutralizing, despite no inhibition of virus growth.
Overall, if the assay is performed systematically, it can yield robust results in a high‐throughput manner and, coupled with other serological and non‐serological parameters, can provide a picture of an individual's overall immune response under diverse scenarios of infection and vaccination. Suboptimal performance of the assay is typically due to technical flaws, e.g., detachment of subconfluent monolayers from microtiter plates or detachment due to rough treatment of the cells. This can be solved by ensuring the confluency of monolayers prior to the assay and by careful handling. Lack of control consistency among runs can be due to this same issue or inter‐operator variability or the use of different amounts of virus/sera/mAbs in separate assays. Lack of hemagglutination can be due to the use of expired and degraded RBCs or due to a lack of viral replication in the cells caused by the use of very late or early cell passages, stressing the importance of using a fresh batch of RBCs, assessing CPE before performing HA assay, and using fresh cells with an intermediate passage number (e.g., 5‐40) consistent with previous runs.
Understanding Results
The final readout of the microneutralization assay presented here is a hemagglutination assay, which measures the presence of virus in the supernatant of assay wells. A lack of hemagglutination of the RBCs signals the absence of virus at concentrations high enough to hemagglutinate, suggesting that the virus was neutralized by serum antibodies. This indirect measure permits calculation of the titer of neutralizing antibodies in the samples. As depicted in Figure 4A, samples containing neutralizing antibodies against B/Brisbane/60/2008 led to a lack of agglutination after a 3‐day incubation at 33°C. Samples display variable titers ranging from 10 to 640. Triplicate controls in Figure 4B include (1) a no virus control, which uses supernatants from uninfected cells and hence no agglutination is observed; (2) a virus only control, in which agglutination is detected in all wells due to the presence of virus; and (3) a control serum, in which a pooled polyclonal serum is used as a reference for specific neutralization. The previously calculated titer of this internal control serum was 1:320. As per our protocol, the control serum in this assay run met our established criteria of reaching the previously assessed neutralization titer ± one titer value in at least two of the triplicates. Finally, Figure 4C shows an example of how results are plotted. Typically, a log2 xy histogram displaying individual neutralization titers is used, as this allows one to appreciate the dispersion of individual values within the whole dataset. Of note, we report activity in the first well as a 1:10 titer, but this could arguably be reported as a 1:20 titer, because the addition of virus to the diluted serum constitutes another 1:2 dilution. Comparisons between groups, i.e., vaccinated individuals or animals assigned to different groups vs. controls or individuals receiving different adjuvanted vaccines (none of these depicted here) could be shown side by side. The geometric mean titer of the different groups can be compared using appropriate statistical analyses.
Time Considerations
The TCID50 protocol takes 3‐4 days in total starting from cell seeding, depending on the duration of the infection step (48, 72, or 96 hr). The microneutralization assay takes the same amount of time.
Author Contributions
Frans Cuevas: Investigation, writing original draft, review & editing; Hisaaki Kawabata: Investigation, writing original draft, review & editing; Florian Krammer: Conceptualization, funding acquisition, resources, supervision, visualization, writing original draft, review & editing; Juan Manuel Carreño: Conceptualization, investigation, project administration, supervision, visualization, writing original draft, review & editing.
Conflict of Interest
The Icahn School of Medicine at Mount Sinai has filed patent applications regarding influenza virus vaccines, SARS‐CoV‐2 vaccines, influenza therapeutics, and SARS‐CoV‐2 serological assays that name FK as inventor. FK is a consultant for Third Rock Ventures, Pfizer, and Avimex.
Corrections
In this publication, the following corrections have been made.
In the Figure 1 legend, “100 TCID50/ml” was corrected to “100 TCID50/50 µl”.
In step 60 of the Basic Protocol, “100 µl” was corrected to “50 µl”.
The current version online now includes these corrections and may be considered the authoritative version of record.
Acknowledgments
Development of the protocol described here was supported by the Centers of Excellence for Influenza Research and Response (75N93021C00014), the Collaborative Influenza Vaccine Innovation Centers (75N93019C00051), and the National Institute of Allergy and Infectious Diseases (U01 AI144616, R21 AI151917 and R01 AI154470) to FK. We would like to thank Mr. Brian Monahan for proof‐reading this protocol. Schematics in Figures 1, 2, and 3 were created using BioRender.
Cuevas, F. , Kawabata, H. , Krammer, F. , & Carreño, J. M. (2022). An in vitro microneutralization assay for influenza virus serology. Current Protocols, 2, e465. doi: 10.1002/cpz1.465
Published in the Microbiology section
Contributor Information
Florian Krammer, Email: florian.krammer@mssm.edu.
Juan Manuel Carreño, Email: jm.carreno@mssm.edu.
Data Availability Statement
Data sharing is not applicable to this article as no new data were created or analyzed in this study.
Literature Cited
- Beare, A. S. , Schild, G. C. , & Craig, J. W. (1975). Trials in man with live recombinants made from A/PR/8/34 (H0 N1) and wild H3 N2 influenza viruses. Lancet, 2(7938), 729–732. doi: 10.1016/s0140-6736(75)90720-5 [DOI] [PubMed] [Google Scholar]
- Belser, J. A. , Johnson, A. , Pulit‐Penaloza, J. A. , Pappas, C. , Pearce, M. B. , Tzeng, W. P. , … Tumpey, T. M. (2017). Pathogenicity testing of influenza candidate vaccine viruses in the ferret model. Virology, 511, 135–141. doi: 10.1016/j.virol.2017.08.024 [DOI] [PMC free article] [PubMed] [Google Scholar]
- Campbell, P. J. , Danzy, S. , Kyriakis, C. S. , Deymier, M. J. , Lowen, A. C. , & Steel, J. (2014). The M segment of the 2009 pandemic influenza virus confers increased neuraminidase activity, filamentous morphology, and efficient contact transmissibility to A/Puerto Rico/8/1934‐based reassortant viruses. Journal of Virology, 88(7), 3802–3814. doi: 10.1128/JVI.03607-13 [DOI] [PMC free article] [PubMed] [Google Scholar]
- Carnell, G. W. , Ferrara, F. , Grehan, K. , Thompson, C. P. , & Temperton, N. J. (2015). Pseudotype‐based neutralization assays for influenza: A systematic analysis. Frontiers in Immunology, 6, 161. doi: 10.3389/fimmu.2015.00161 [DOI] [PMC free article] [PubMed] [Google Scholar]
- Carreno, J. M. , Strohmeier, S. , Kirkpatrick Roubidoux, E. , Hai, R. , Palese, P. , & Krammer, F. (2020). H1 hemagglutinin priming provides long‐lasting heterosubtypic immunity against H5N1 challenge in the mouse model. mBio, 11(6), e02090–20. doi: 10.1128/mBio.02090-20 [DOI] [PMC free article] [PubMed] [Google Scholar]
- Centers for Disease Control and Prevention (CDC) . (2021a). Estimated flu‐related illnesses, medical visits, hospitalizations, and deaths in the United States—2019‐2020 flu season. Retrieved from https://www.cdc.gov/flu/about/burden/2019‐2020.html
- Centers for Disease Control and Prevention (CDC) . (2021b). Vaccine effectiveness: How well do flu vaccines work? Retrieved from https://www.cdc.gov/flu/vaccines‐work/vaccineeffect.htm#:~:text=While%20vaccine%20effectiveness%20(VE)%20can,used%20to%20make%20flu%20vaccines
- Cobey, S. , & Hensley, S. E. (2017). Immune history and influenza virus susceptibility. Current Opinion in Virology, 22, 105–111. doi: 10.1016/j.coviro.2016.12.004 [DOI] [PMC free article] [PubMed] [Google Scholar]
- Crowe, C. A. , Schwartz, S. , Black, C. J. , & Jaswaney, V. (1997). Mosaic trisomy 22: A case presentation and literature review of trisomy 22 phenotypes. American Journal of Medical Genetics, 71(4), 406–413. doi: 10.1002/(SICI)1096‐8628(19970905)71:4<406::AID‐AJMG7>3.0.CO;2‐R. [PubMed] [Google Scholar]
- Dou, D. , Revol, R. , Ostbye, H. , Wang, H. , & Daniels, R. (2018). Influenza A virus cell entry, replication, virion assembly and movement. Frontiers in Immunology, 9, 1581. doi: 10.3389/fimmu.2018.01581 [DOI] [PMC free article] [PubMed] [Google Scholar]
- Ferdinands, J. M. , Thompson, M. G. , Blanton, L. , Spencer, S. , Grant, L. , & Fry, A. M. (2021). Does influenza vaccination attenuate the severity of breakthrough infections? A narrative review and recommendations for further research. Vaccine, 39(28), 3678–3695. doi: 10.1016/j.vaccine.2021.05.011 [DOI] [PubMed] [Google Scholar]
- Gross, F. L. , Bai, Y. , Jefferson, S. , Holiday, C. , & Levine, M. Z. (2017). Measuring influenza neutralizing antibody responses to A(H3N2) viruses in human sera by microneutralization assays using MDCK‐SIAT1 cells. Journal of Visualized Experiments, (129), 56448. doi: 10.3791/56448 [DOI] [PMC free article] [PubMed] [Google Scholar]
- Kim, H. , Webster, R. G. , & Webby, R. J. (2018). Influenza virus: Dealing with a drifting and shifting pathogen. Viral Immunology, 31(2), 174–183. doi: 10.1089/vim.2017.0141 [DOI] [PubMed] [Google Scholar]
- Kitikoon, P. , & Vincent, A. L. (2014). Microneutralization assay for swine influenza virus in swine serum. Methods in Molecular Biology, 1161, 325–335. doi: 10.1007/978-1-4939-0758-8_27 [DOI] [PubMed] [Google Scholar]
- Krammer, F. (2019). The human antibody response to influenza A virus infection and vaccination. Nature Reviews Immunology, 19(6), 383–397. doi: 10.1038/s41577-019-0143-6 [DOI] [PubMed] [Google Scholar]
- Krammer, F. , & Palese, P. (2015). Advances in the development of influenza virus vaccines. Nature Reviews Drug Discovery, 14(3), 167–182. doi: 10.1038/nrd4529 [DOI] [PubMed] [Google Scholar]
- Krammer, F. , & Palese, P. (2020). Orthomyxoviridae: The viruses and their replication. In P. M. Howley, D. M. Knipe, & S. Whelan (Eds.) Fields virology, 7th ed., Vol. 1, Emerging viruses (pp. 596–648). Philadelphia, PA: Wolters Kluwer. [Google Scholar]
- Krammer, F. , Smith, G. J. D. , Fouchier, R. A. M. , Peiris, M. , Kedzierska, K. , Doherty, P. C. , … Garcia‐Sastre, A. (2018). Influenza. Nature Reviews Disease Primers, 4(1), 3. doi: 10.1038/s41572-018-0002-y [DOI] [PMC free article] [PubMed] [Google Scholar]
- Lakadamyali, M. , Rust, M. J. , & Zhuang, X. (2004). Endocytosis of influenza viruses. Microbes and Infection, 6(10), 929–936. doi: 10.1016/j.micinf.2004.05.002 [DOI] [PMC free article] [PubMed] [Google Scholar]
- Matsuoka, Y. , Chen, H. , Cox, N. , Subbarao, K. , Beck, J. , & Swayne, D. (2003). Safety evaluation in chickens of candidate human vaccines against potential pandemic strains of influenza. Avian Diseases, 47(3 Suppl), 926–930. doi: 10.1637/0005-2086-47.s3.926 [DOI] [PubMed] [Google Scholar]
- McAuley, J. L. , Gilbertson, B. P. , Trifkovic, S. , Brown, L. E. , & McKimm‐Breschkin, J. L. (2019). Influenza virus neuraminidase structure and functions. Frontiers in Microbiology, 10, 39. doi: 10.3389/fmicb.2019.00039 [DOI] [PMC free article] [PubMed] [Google Scholar]
- McMahon, M. , Kirkpatrick, E. , Stadlbauer, D. , Strohmeier, S. , Bouvier, N. M. , & Krammer, F. (2019). Mucosal immunity against neuraminidase prevents influenza B virus transmission in guinea pigs. mBio, 10(3), e00560–19. doi: 10.1128/mBio.00560-19 [DOI] [PMC free article] [PubMed] [Google Scholar]
- Meechan, P. J. , & Potts, J. (2020). Biosafety in microbiological and biomedical laboratories (6th ed.). Centers for Disease Control and Prevention (CDC) and National Institutes of Health (NIH). Retrieved from https://www.cdc.gov/labs/BMBL.html [Google Scholar]
- Mifsud, E. J. , Tai, C. M. , & Hurt, A. C. (2018). Animal models used to assess influenza antivirals. Expert Opinion on Drug Discovery, 13(12), 1131–1139. doi: 10.1080/17460441.2018.1540586 [DOI] [PubMed] [Google Scholar]
- Nachbagauer, R. , Feser, J. , Naficy, A. , Bernstein, D. I. , Guptill, J. , Walter, E. B. , … Krammer, F. (2021). A chimeric hemagglutinin‐based universal influenza virus vaccine approach induces broad and long‐lasting immunity in a randomized, placebo‐controlled phase I trial. Nature Medicine, 27(1), 106–114. doi: 10.1038/s41591-020-1118-7 [DOI] [PubMed] [Google Scholar]
- Petrova, V. N. , & Russell, C. A. (2018). The evolution of seasonal influenza viruses. Nature Reviews Microbiology, 16(1), 60. doi: 10.1038/nrmicro.2017.146 [DOI] [PubMed] [Google Scholar]
- Ping, J. , Lopes, T. J. S. , Nidom, C. A. , Ghedin, E. , Macken, C. A. , Fitch, A. , … Kawaoka, Y. (2015). Development of high‐yield influenza A virus vaccine viruses. Nature Communication, 6, 8148. doi: 10.1038/ncomms9148 [DOI] [PMC free article] [PubMed] [Google Scholar]
- Ramakrishnan, M. A. (2016). Determination of 50% endpoint titer using a simple formula. World Journal of Virology, 5(2), 85–86. doi: 10.5501/wjv.v5.i2.85 [DOI] [PMC free article] [PubMed] [Google Scholar]
- Rodriguez, A. , Perez‐Gonzalez, A. , Hossain, M. J. , Chen, L. M. , Rolling, T. , Perez‐Brena, P. , … Nieto, A. (2009). Attenuated strains of influenza A viruses do not induce degradation of RNA polymerase II. Journal of Virology, 83(21), 11166–11174. doi: 10.1128/JVI.01439-09 [DOI] [PMC free article] [PubMed] [Google Scholar]
- Sautto, G. A. , Kirchenbaum, G. A. , & Ross, T. M. (2018). Towards a universal influenza vaccine: Different approaches for one goal. Virology Journal, 15(1), 17. doi: 10.1186/s12985-017-0918-y [DOI] [PMC free article] [PubMed] [Google Scholar]
- Stadlbauer, D. , Zhu, X. , McMahon, M. , Turner, J. S. , Wohlbold, T. J. , Schmitz, A. J. , … Krammer, F. (2019). Broadly protective human antibodies that target the active site of influenza virus neuraminidase. Science, 366(6464), 499–504. doi: 10.1126/science.aay0678 [DOI] [PMC free article] [PubMed] [Google Scholar]
- Strohmeier, S. , Amanat, F. , Zhu, X. , McMahon, M. , Deming, M. E. , Pasetti, M. F. , … Krammer, F. (2021). A novel recombinant influenza virus neuraminidase vaccine candidate stabilized by a measles virus phosphoprotein tetramerization domain provides robust protection from virus challenge in the mouse model. mBio, 12(6), e0224121. doi: 10.1128/mBio.02241-21 [DOI] [PMC free article] [PubMed] [Google Scholar]
- Zhao, H. , Xu, K. , Jiang, Z. , Shao, M. , Liu, S. , Li, X. , … Li, C. (2018). A neuraminidase activity‐based microneutralization assay for evaluating antibody responses to influenza H5 and H7 vaccines. PLoS One, 13(11), e0207431. doi: 10.1371/journal.pone.0207431 [DOI] [PMC free article] [PubMed] [Google Scholar]
- Zost, S. J. , Wu, N. C. , Hensley, S. E. , & Wilson, I. A. (2019). Immunodominance and antigenic variation of influenza virus hemagglutinin: Implications for design of universal vaccine immunogens. Journal of Infectious Diseases, 219(Suppl_1), S38–S45. doi: 10.1093/infdis/jiy696 [DOI] [PMC free article] [PubMed] [Google Scholar]
Associated Data
This section collects any data citations, data availability statements, or supplementary materials included in this article.
Data Availability Statement
Data sharing is not applicable to this article as no new data were created or analyzed in this study.