

Abstract
Variation in foraging tactics and diet is usually attributed to differences in morphology, experience and prey availability. Recently, consistent individual differences in behaviour (personality) have been shown to be associated with foraging strategies. Bolder or more exploratory individuals are predicted to have a faster pace‐of‐life and offset the costs of moving more or in risky areas, with higher energetic gains by encountering profitable foraging opportunities and prey. However, the relationship between personality, foraging and diet is poorly understood.
We investigated how exploratory behaviour in red knots Calidris canutus is associated with foraging tactics and diet by combining laboratory experiments, field observations and stable isotope analysis. First, we developed a mobile experimental arena to measure exploration speed in controlled settings. We validated the method by repeated testing of individuals over time and contexts. This setup allowed us to measure exploratory personality at the field site, eliminating the need to bring birds into captivity for long periods of time. After releasing birds within days of their capture, we asked whether exploration speed was associated with differences in foraging tactics and diet in the wild.
We found that tactile foraging red knots mainly caught hard‐shelled prey that are buried in the sediment, whereas visual foraging knots only captured soft preys located close to or on the surface. We also found that faster explorers showed a higher percentage of visual foraging than slower explorers. By contrast, morphology (bill length and gizzard size) had no significant effect on foraging tactics. Diet analysis based on δ15N and δ13C stable isotope values of plasma and red blood cells confirmed our field observations with slower explorers mainly consumed hard‐shelled prey while faster explorers consumed more soft than hard‐shelled prey.
Our results show that foraging tactics and diet are associated with a personality trait, independent of morphological differences. We discuss how consistent behaviour might develop early in life through positive feedbacks between foraging tactics, prey type and foraging efficiency.
Keywords: animal personality, diet, exploration, foraging behaviour, foraging tactics, individual specialisation, pace‐of‐life, stable isotope analysis
Foraging tactics and diet are associated with a personality trait in red knots, independent of morphological differences. Slower explorers use only tactile foraging and eat hard‐shelled prey, while faster explorers use both tactile and visual foraging tactics and consume more soft than hard‐shelled prey. Photo credit Benjamin Gnep.

Özet
Yiyecek arama taktikleri ve beslenmede çeşitlilik genellikle morfoloji, deneyim ve av mevcudiyetindeki farklılıklara bağlanır. Davranıştaki tutarlı bireysel farklılıkların (kişiliklerin) yiyecek arama stratejileri ile ilişkili olduğu gösterilmiştir. Cesur veya kaşif bireyler daha riskli alanlarda veya daha fazla hareket etseler bile, bu riskin ya da fazla haraketin maliyetlerini karlı yiyecek arama fırsatları ve avlarla karşılaşarak yüksek enerji kazanımlarıyla dengelediği tahmin edilmektedir. Bununla birlikte, kişilik, yiyecek arama ve beslenme arasındaki ilişki şimdiye kadar tam olarak anlaşılamamıştır.
Laboratuvar deneylerini, saha gözlemlerini ve kararlı izotop analizini birleştirerek büyük kumkuşlarında Calidris canutus keşif davranışının yiyecek arama taktikleri ve beslenme biçimi ile nasıl ilişkili olduğunu araştırdık. İlk olarak, kontrollü ortamlarda kuşların keşif hızını ölçmek için deneysel bir kişilik testi geliştirdik. Bu deneysel yöntemi zaman ve bağlamlar içinde tekrar tekrar test ederek doğruladık. Kuşları yakalayıp test ettikten hemen sonraki günler içinde serbest bıraktık ve sahada aynı kuşları tekrardan bulup beslenme davranışlarını gözlemledik. Deneysel alanda ölçtüğümüz keşif hızının vahşi doğada yiyecek arama taktikleri ve beslenme farklılıklarıyla ilişkili olup olmadığını sorduk.
Dokunsal arama taktiği kullanan kumkuşların çoğunlukla kumun altında gömülü olan sert kabuklu (midye gibi) avları yakaladığını, görsel arama taktiği kullanan kumkuşlarının da yalnızca yüzeye yakın veya yüzeyde bulunan yumuşak (karides gibi) avları yakaladığını bulduk. Analiz sonuçlarımız hızlı kaşiflerin, yavaş kaşiflerden daha yüksek bir görsel arama taktiği kullandığını buna karşılık, morfolojinin (gaga uzunluğunun ve mide kası boyutunun) yiyecek arama taktikleri üzerinde önemli bir etkisi olmadigini gösterdi. Kandaki plazma ve kırmızı kan hücrelerinin δ15N ve δ13C kararlı izotop değerlerine dayanan beslenme analizimiz yavaş kaşiflerin esas olarak sert kabuklu avları tüketirken, hızlı kaşiflerin daha çok yumuşak avları tükettiğini göstererek saha gözlemlerimizi doğruladı.
Bulgularımız, yiyecek arama taktikleri ve beslenmenin, morfolojik farklılıklardan bağımsız olarak bir kişilik özelliği ile ilişkili olduğunu göstermektedir. Bu bulgular kişiliğin yiyecek arama taktikleri, av türü ve yiyecek arama verimliliği arasındaki olumlu geri bildirimler aracılığıyla yaşamın erken dönemlerinde geliştiğine işaret ediyor.
1. INTRODUCTION
Among‐individual variation in foraging behaviour and diet has been demonstrated across a wide range of taxa (also called ‘individual niche specialisation’; e.g. birds in Harris et al., 2014; insects in Heinrich, 1976; mammals in Tinker et al., 2007). This variation can be attributed to differences in prey availability and habitat, the cost‐benefit ratio of potential prey, and morphological variation among predators (Hinde, 1959; Kerfoot, 1967; Robinson & Holmes, 1982). Collectively, variation in foraging behaviour provides a basis for adaptation and speciation (Dill, 1983; Knudsen et al., 2010; van Valen, 1965), therefore, understanding the factors that cause and maintain among‐individual variation in foraging behaviour is an important topic in ecology (Araújo et al., 2011; Bolnick et al., 2003).
Among‐individual variation in foraging behaviour, such as in methods of detecting prey (hereafter foraging tactics), can develop during ontogeny through differences in experience. This is particularly prevalent when different prey species vary in habitat or behaviour (e.g. Ringler, 1983). By foraging for a certain food type, an individual can improve its foraging efficiency to detect, capture and process it (Heinrich, 1976). This feedback between foraging tactics, food type and foraging efficiency can create consistent variation in foraging behaviour between members of the same population (O’Brien et al., 1989). Among‐individual variation in foraging tactics is often attributed to morphological differences, such as feeding apparatus. For example, proboscis length is negatively related to diet diversity in multiple species of bumblebee (Goulson & Darvill, 2004). Additionally, shorter‐billed oystercatchers Haematopus ostralegus (Durell et al., 1993) and bar‐tailed godwits Limosa lapponica (Zwarts, 1985) forage on prey closer to or on the surface, whereas longer‐billed individuals find prey buried in the sand (reviewed in Durell, 2000). Variation in morphology of the gut has also been related to diet choice (Piersma et al., 1999). In brachyuran crabs, for example, stomach volume is inversely correlated with diet quality (Griffen & Mosblack, 2011).
Foraging behaviour and diet can also be associated with ‘consistent among‐individual differences in behaviour’ (also known as personality, behavioural syndromes or temperament, Gosling, 2001; Sih et al., 2004; Toscano et al., 2016). For example, shyer wandering albatrosses Diomedea exulans (showing little response to a novel object) have larger foraging patches that they exploit for longer period of time than bolder individuals (Patrick et al., 2017). Shyer barnacle geese Branta leucopsis scrounge on the food discoveries of bolder geese (Kurvers et al., 2010). Faster exploring great tits Parus major have also been shown to search food in different areas and move greater distances in search of prey (van Overveld & Matthysen, 2010) and faster exploring blue tits Cyanistes caeruleus are more likely to find new feeders in the wild (Herborn et al., 2010). According to the pace‐of‐life framework, explorative and bolder individuals in the ‘fast’ pace‐of‐life are expected to be less risk aversive, behave less cautiously, and have higher energy expenditure (Réale et al., 2010). The increased energy expenditure of exploratory and bold individuals (reviewed in Careau et al., 2008) could be compensated by an increased energy gain associated with their foraging behaviour. For example, even though there is a high energetic cost to exploration (Careau & Garland, 2012), individuals are also more likely to encounter profitable foraging opportunities and high‐quality prey types (e.g. Herborn et al., 2010). High cost of exploration and boldness may then have potentially high foraging gain (Bell & Sih, 2007; Brydges et al., 2008). How variation in diet and foraging tactics relate to personality is poorly understood and studying this in free‐living animals can help us to understand the causes and consequences of personality traits (Araújo et al., 2011; Réale et al., 2010; Wolf & Weissing, 2012).
The red knot Calidris canutus is a useful model system to study the relationship between individual foraging tactics, diet, morphology and exploratory personality. On the mudflats, red knots are known to be mollusc specialists and mainly use tactile foraging to find hard‐shelled prey buried in the sediment, such as edible cockles Cerastoderma edule (Piersma et al., 1998). Field observations show that red knots can also opportunistically feed on high‐quality soft prey located on the surface, such as brown shrimp Crangon crangon (Zwarts et al., 1992). Although the specific foraging tactic used to capture soft prey has not been reported for red knots, other shorebird species use visual foraging for this prey type (reviewed in Durell, 2000). Under laboratory conditions, individual red knots are consistent in their exploration of a novel environment (Bijleveld et al., 2014; Kok et al., 2019). Following the pace‐of‐life framework, we may expect that more exploratory red knots eat more high‐quality prey and thus use different foraging tactics. Indeed, more exploratory knots have been shown to have smaller gizzards (muscular stomach) indicating a higher quality diet (Bijleveld et al., 2014). However, a direct link between personality and diet has not yet been demonstrated.
Here, by combining laboratory experiments, field observations and stable isotope analyses, we ask whether faster exploring red knots eat more high‐quality prey than slower explorers, and whether this coincides with the use of different foraging tactics. We first developed a method to measure exploration speed in a controlled setting at the field site shortly after catching, removing the need to transport birds to indoor facilities and keeping them in captivity for longer periods (as in previous studies of this species Bijleveld et al., 2014; Kok et al., 2019). We were then able to catch, assay exploratory personality and release red knots within a few days after capture (with a WATLAS transmitter, Beardsworth et al., 2021; Bijleveld et al., 2021). Shortly after their release, we tracked and re‐sighted the same individuals on the mudflats, video‐recorded their behaviour to later calculate the percentage of tactile or visual foraging tactics. We then investigate whether foraging tactic use was related to exploration speed, gizzard size and bill length, and predicted that faster exploring knots use more visual foraging, have smaller gizzards, and/or shorter bills. We also investigated the relationship between exploration speed and diet using isotope analysis based on δ15N and δ13C stable isotope values from blood samples and predicted that isotopic signatures of faster exploring red knots reflect more soft prey in the diet than slower explorers. To assess the changes in diet over time, we compared isotopic signatures of blood plasma that integrate diet across c. 14 days and of red blood cells that integrate diet signatures across c. 45 days (Klaassen et al., 2010).
2. MATERIALS AND METHODS
2.1. Study site and animals
We studied the islandica subspecies of red knots Calidris canutus which breeds in the high Arctic of northern Greenland and north‐east Canada and winters in the large mudflat areas in western Europe (Piersma, 2007). We collected field data from September 2018 to October 2019 in the western Dutch Wadden Sea (53°15'N, 5°15'E) and conducted laboratory experiments at the experimental shorebird facility in the NIOZ Royal Netherlands Institute for Sea Research (53°00′12″N, 4°47′23″E). All necessary permits to catch, handle, tag, test and keep red knots were granted to the NIOZ by the Dutch law and regulation under protocol number NIOAVD8020020171505.
2.2. Captures, sampling, housing and personality tests
In total, 283 adult red knots were caught during four catching events between 14 August–19 September 2018, and 1 August–6 September 2019 in new moon periods by means of mist netting in the western Dutch Wadden Sea. Red knots were given a numbered metal ring for individual identification and their biometrics were measured (e.g. bill length). From the brachial vein a small blood sample (~80 μl) was taken for stable isotope analysis. Blood samples were separated into plasma and red blood cells by centrifugation (12 min, 6,500 g) and pipetted into separate glass vials and immediately stored in a freezer at the field site. At NIOZ, samples were stored at −20°C until further analysis. These samples were used to determine the stable carbon and nitrogen isotope ratios (δ13C and δ15N) from plasma and red blood cells separately. Samples were freeze‐dried before analysis on a Thermo Scientific (Flash 2000) organic element analyser coupled to a Delta V isotope ratio mass spectrometer via a Conflo IV. A microbalance (Sartorius XM1000P) was used to weigh 0.4–0.8 mg of the freeze‐dried samples into 5 × 9 mm tin capsules. Isotope values were calibrated to a certified acetanilide standard (Arndt Schimmelmann, Indiana University), controlled by certified urea and casein standards (Elemental Microanalysis) and corrected for blank tin capsules. Red knots which arrived recently in the Wadden Sea from Arctic breeding grounds with a terrestrial isotopic signature (Dietz et al., 2010) were excluded from these diet analyses (N excluded = 23 from plasma, N excluded = 46 from red blood cells).
The stable isotope ratios of the food sources from the study area were taken from Waddensleutels program that samples intertidal macrofauna across the Dutch Wadden Sea (Christianen et al., 2017). To discriminate the relative contribution of different prey items in the analysis, we grouped hard‐shelled prey (common cockle, Mean ± SD: δ15N, 11 ± 1.38; δ13C, –18.69 ± 1.26, N = 341 and Baltic tellin Limecola balthica, Mean ± SD: δ15N, 11.08 ± 2.5; δ13C, –16.03 ± 2.06, N = 151) as well as soft prey (brown shrimp, Mean ± SD: δ15N, 12.78 ± 1.04; δ13C, –14.9 ± 1.93, N = 119 and polychaete worm Nephtys hombergii, Mean ± SD: δ15N, 14.24 ± 1.43; δ13C, –14.86 ± 0.82, N = 39). By comparing the stable isotope compositions of the plasma and red blood cells with that of potential food items, we were able to analyse the relative contributions of different food items to the diet of birds.
Gizzard size was measured by A.D. using an ultrasound scanner (model Aquilla, Pie Medical Benelux, Maastricht, The Netherlands) as described by Dietz et al. (1999). Measurements of gizzard width and height (cm) were taken to estimate gizzard size in grams using formula −1.09 + 3.78 × (height × width, Bijleveld et al., 2014). Gizzard size was measured within 1 day after capture to be indicative of a bird's organ mass while free‐living (Dekinga et al., 2001). Right after ultrasound measurements, the birds were moved to temporary outdoor aviaries of 2 m × 0.75 m × 0.4 m (L × W × H) made of linen with a net floor covered in dried hemp (Hemparade). These aviaries were placed outside on natural sand/grass and provided with ad libitum food (live and dried mealworms) and water (freshwater and seawater). Group sizes in the aviaries were between 8 and 12 birds.
Exploratory personality was measured as response to a novel environment in two different setups: (a) a new method to measure exploration speed within 24 hr after capture in the field‐based mobile arena, and (b) an established method to measure explorative behaviour of captive red knots in the laboratory‐based indoor arena (Bijleveld et al., 2014).
2.2.1. Mobile arena
To score the exploration speed of captive red knots at the field site, we used a pyramid shaped mobile unit of 2 m × 2 m × 2 m (referred to as ‘mobile arena’; Figure S1). The floor of the unit consists of seawater of 20 cm depth in which four identical trays with wet sand (61 cm × 40 cm × 25 cm) were situated. Birds could explore these artificial patches in which no food was offered. A GoPro (Hero Black) camera was mounted at the ceiling to record the movement trajectories at 2 frames/s and another GoPro (Hero+) camera recorded behaviour from the side at 30 frames/s (Video S1). To standardise the procedure and motivate birds equally for the personality tests (like Bijleveld et al., 2014), we placed them individually into a holding pen without access to food. After 2 hr, we started the experiments by gently placing the bird on the sand patch in the experimental unit. Individual trials lasted 20 min per bird.
To calculate exploratory movement of individuals from videos recorded by the ceiling camera, we used video tracking software idtracker (Pérez‐Escudero et al., 2014). The software produced position data (x‐ and y‐coordinates) for every frame (each 0.5 s) during 20 min that a bird spent in the mobile arena. Between two subsequent frames, we used the distance between estimated positions to calculate speed. Errors in the positioning algorithm were filtered by excluding speeds higher than 200 cm/s. An individual's exploration speed was calculated as the average speed during each 20 min trial. An example video with tracks can be found in Video S2.
We investigated the repeatability of the exploration speed measured in the mobile arena to validate its consistency over time and context. At the field site, we tested 57 birds twice in the mobile arena with on average 5 days in between tests (range 3–7 days). Thirty of these birds were then brought into longer term captivity at NIOZ for establishing long‐term repeatability. At NIOZ, these birds were housed in flocks of 14 individuals in aviaries measuring 4 m × 2 m × 2.5 m lined with white Trespa foil (Trespa International B.V.). They were provided with running saltwater along a coated concrete surface, as well as a stretch of sand covered with 5 cm water. The birds were fed ad libitum with trout‐feed pellets (Produits Trouw) and had unlimited access to saltwater and freshwater for drinking and bathing. Because of health problems that developed in captivity (Milot et al., 2014), a few birds were not used in all of the long‐term measurements. To investigate the long‐term repeatability in exploration speed measured in the mobile arena, we tested birds for a third time within 136 days after first capture on average (range 135–137 days, N = 29), and for a fourth time within 176 days after first capture on average (range 175–177 days, N = 25, Table S1). These repeated measurements in captivity were conducted in the mobile arena and with identical settings as to those at the field site (i.e. with a 2‐hr acclimation period, inside the pyramid‐shaped arena).
2.2.2. Indoor arena
To investigate if exploration speed as measured in the mobile arena was comparable to the well‐established method measuring exploratory behaviour of captive red knots (Bijleveld et al., 2014; Kok et al., 2019), we additionally tested 24 red knots in the established method (from now on it will be referred to as ‘indoor arena’; Table 1; Figure S2). Indoor arena measurements were conducted 43 days after capture when red knots have adjusted to their captive conditions. The experimental arena in this method measured 7 m × 7 m × 3 m and was filled with 30 cm seawater. Five similar trays 1 m × 1 m × 35 cm were filled with wet sand and placed above the water surface for the birds to explore. The trays that contained no food were placed approximately 90 cm from the walls. Experimental birds were isolated, and food was removed 2 hr before the tests started. Five minutes before the testing, the bird was introduced into a side aviary adjacent to the experimental arena. The side aviary leads into the experimental arena through a sliding door that can be opened and closed remotely via a pulley mechanism. After the door was opened, the bird either flew themselves or after 5 min, it was gently herded into the experimental arena. Individual trials lasted 20 min. A GoPro Hero+camera was fitted such that it recorded the behaviour from the side. An observer, who was blind to the birds’ previously measured exploratory behaviour, watched the video recordings of each trial in slow speed and recorded the time that the focal bird spent exploring (probing and walking) using Cowlog event coding software (Pastell, 2016). For more details on the experimental procedure see, Bijleveld et al. (2014).
TABLE 1.
Controlled experiments and field observations were collected from red knots. Two different approaches were followed in two different field seasons. We validated the mobile experimental arena in 2018 with repeatedly testing wild caught birds at the field site short term (first two repeats within 5 days ± 2.2 after capture) and then in captivity long term (third and fourth repeat within 176 days ± 1 after capture). We additionally tested 24 of these birds in the indoor arena. In 2019, wild caught red knots were tested in the mobile arena and immediately after, they were released back to their natural habitat and tracked to record their foraging tactics in the field
| Year | Location | At the field site | In captivity | In the field | ||||
|---|---|---|---|---|---|---|---|---|
| Treatment | Catch | Mobile arena first repeat | Mobile arena second repeat | Mobile arena third repeat | Mobile arena fourth repeat | Indoor arena | Foraging observation | |
| 2018 | Number of birds | 111 | 111 | 57 | 29 | 25 | 24 | — |
| Repeatability short term (5 days ± 2.2) | R = 0.7, 95% CI (0.56, 0.82) | |||||||
| Repeatability long term (176 days ± 1) | R = 0.54, 95% CI (0.4, 0.66) | |||||||
| 2019 | Number of birds | 173 | 126 | — | — | — | — | 26 |
To compare measures of exploration between the mobile and indoor arena, exploration in the mobile arena was scored as mean speed and exploration in the indoor arena was scored as proportion of time spent on walking and probing (following the established method from earlier studies Bijleveld et al., 2014; Kok et al., 2019). To compare how well speed correlates with behaviour, we additionally scored exploration as the proportion of time spent probing and walking as well as mean speed for 75 red knots from their first trial in the mobile arena.
2.3. Foraging behaviour in the field
To investigate how exploration speed relates to the use of different foraging tactics, we caught and tested 126 red knots one time in the mobile arena in the summer of 2019. Right after the personality tests, red knots were released with unique combinations of colour rings and with a time‐of‐arrival (WATLAS) radio‐tag weighing ~4 g (approximately 3% of red knot body mass) to retrieve their locations in the Wadden Sea (Beardsworth et al., 2021; Bijleveld et al., 2021). The tagged birds were located through a website (www.nioz.nl/watlas) where the location of the tagged birds could be seen on a map in real‐time. Observers approached the flock of red knots (up to ~200 m) and searched for the focal bird with a 10 × 40 Swarovski telescope. Once the focal bird was found, observers filmed the bird using a video camera (Sony Camera A6000) attached to the scope. Focal birds were filmed for 20 min or up to the moment they flew away. Observations of foraging behaviour were conducted during the low‐tide period when large mudflat areas are available for red knots to forage. In total, recordings were collected from 38 different individuals. The distribution of the exploratory scores of these individuals can be seen in comparison with all bird’s exploratory scores in Figure S3.
The videos were processed with event logging software Boris (Friard & Gamba, 2016). Before starting the behavioural coding, the list of videos was randomized. To prevent observer bias, the observer was blind to the bird's exploratory score. The ethogram in which all relevant behaviours are described can be found in Table S1. In the field, red knots spend 74% of their time foraging on the mudflats during low‐tide periods (Figure S4). For the foraging tactic analysis, we restricted the analysis to the periods when the birds were actively foraging, so visual and tactile foraging added to 100% of the foraging time. We defined two types of foraging tactics: ‘tactile foraging’ when a bird is probing continuously with the bill into the substrate (Piersma et al., 1998), and ‘visual foraging’ when a bird is scanning the area in front of it and pecking at items seen on the substrate surface (Barbosa, 1995, see Video S3). In cases that we could identify the ingested prey (N = 136), we categorized it as hard‐shelled prey (N hard‐shelled = 73, e.g. cockles or Baltic tellins) or soft prey (N soft = 63, e.g. brown shrimp or polychaete worms) to investigate the relationship between foraging tactics and diet.
2.4. Statistical analysis
All data analyses were carried out in R statistical software v. 4.0.3 (R Core Team, 2021). We analysed the exploration personality of N 2018 = 111 and N 2019 = 126 individuals in N 2018 = 246 and N 2019 = 126 experimental trials (Table 1). Red knots that swam in the arena for more than 10 consecutive min (N mobile = 14, N indoor = 6) were removed from the arena because of welfare concerns for the bird (i.e. the risk of drowning or difficulty to thermoregulate with wet feathers), and its data excluded from the study. In the field, some videos had poor quality (due to distance between observer and the bird, and weather conditions) and the behaviour could not be scored. Therefore, these videos were excluded from the analysis. Final sample size for analysing the foraging tactics was N = 32 videos from N = 26 individuals. We were not able to calculate individual repeatability of foraging tactics because too few individuals had more than one recording (N = 6). In those cases, we averaged recordings for each individual and weighted with the video length.
After checking for collinearity, overdispersion and model assumptions (homogeneity and normality of residuals), we formulated four models using the lme4 package. First, a linear mixed‐effects model to quantify repeatability of exploration speed measured in the mobile arena. We used mean speed as the response variable, the number of the repeated measure as a fixed effect and individual identity as a random effect. Mean speed was log10 transformed to meet normality assumptions. Adjusted repeatability R was calculated with the rptr package (among‐individual variance divided by the total phenotypic variance) and confidence intervals and significance were calculated with parametric bootstrapping (Nakagawa & Schielzeth, 2010). Second, a linear mixed‐effects model to compare the individuals’ scores in the mobile arena (as log10 mean speed) and the indoor arena (as logit proportion of time spent walking and probing behaviour). We used behaviour in the indoor arena as the response variable and the speed in the mobile arena as a fixed. Third, a linear mixed‐effects model to compare speed with behaviour using the data from the first trial in the mobile arena. We used the logit proportion of time spent walking and probing behaviour as the response variable and the log10 of mean speed as a fixed effect. Fourth, we ran a quasibinomial generalized linear model with logit link function to test the effects of bill length, gizzard size and exploration speed (log10 mean speed cm/s) measured first time in the mobile arena on the response variable percentage of foraging tactics that were visual observed from the videos taken in the field. To investigate whether a particular foraging tactic (tactile and visual) resulted in ingesting certain prey types (soft and hard‐shelled), we ran a nonparametric Chi‐square test.
The relative contribution of potential prey types (soft and hard‐shelled) to the diet of individual red knots was estimated using an isotopic Bayesian mixing‐model programmed in the r‐package MixSIAR (Stock & Semmens, 2016). For the diet analysis, we decided to use the Bayesian approach, because Bayesian models estimate diet contributions while accounting for variability in both prey and consumer isotope data (Moore & Semmens, 2008; Parnell et al., 2010). Furthermore, continuous fixed effects (in our case, exploration speed) can be implemented in the model using the mixsiar package (see Stock et al., 2018 for further details). The MixSIAR model combines three different datasets and requires input of at least two stable isotopes (here δ15N and δ13C) of a consumer, its prey, and a diet‐tissue trophic discrimination factor. We used δ13C and δ15N of blood plasma (and red blood cells in separate analysis with identical parameters Figures S8 and S9) of red knots and as prey sources, we used mean and standard deviation of δ13C and δ15N from groups of hard‐shelled and soft prey. We did not measure discrimination factors ourselves therefore, we used general discrimination factors (for avian plasma: Δ15N: 2.82 ± 0.14‰ and Δ13C: –0.08 ± 0.38‰; red blood cells: Δ15N: 2.25 ± 0.2‰ and Δ13C: –0.2 ± 0.39‰ Caut et al., 2009). These values (Figure 2a) were then used to construct MixSIAR models with first exploration speed (log10 mean speed cm/s) measured in the mobile arena as a continuous fixed effect. We checked for convergence diagnostics and set the model to run for 100,000 iterations with three chains and discarded the first 50,000 iterations.
FIGURE 2.
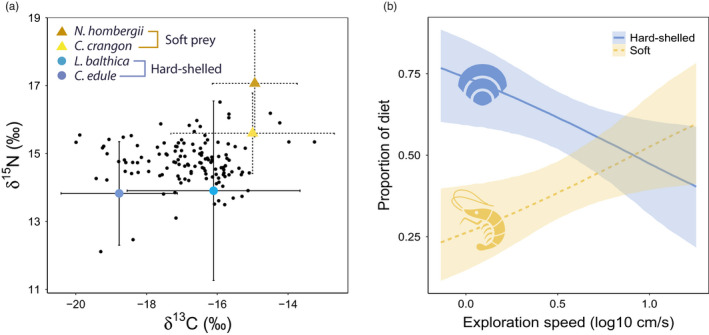
(a) Stable isotope ratios of carbon (δ13C, x axis) and nitrogen (δ15N, y axis) that were used in the MixSIAR diet analysis. Black dots are stable isotope values from the plasma of individual red knots. Stable isotope values of prey items are shown with mean ± SD as soft and hard‐shelled prey. (b) Diet proportions estimated using individual plasma stable isotope samples with MixSIAR (y axis) as a function of exploration speed (log10 mean speed cm/s, x axis) showing that slower explorers depend upon hard‐shelled prey while faster explorers consume both soft and hard‐shelled prey. Lines depict posterior medians, and shading displays the 95% Bayesian credible intervals
3. RESULTS
Exploration speed measured in the mobile arena 1 day after catching was highly repeatable within 7 days at the field site (R = 0.7, 95% CI (0.56, 0.82), p < 0.01, N = 57; Table 1). Long‐term repeatability in the mobile arena was also high within three trials in 136 days (R = 0.6, 95% CI (0.44, 0.73), p < 0.01, N = 29), and within four trials in 176 days (R = 0.54, 95% CI (0.4, 0.66), p < 0.01, N = 25; Table 1). The first exploration speed (log10 mean speed cm/sec) measured in the mobile arena was positively correlated with the proportion of time spent walking and probing measured in the indoor arena 43 days after capture at NIOZ (Intercept = −3.46, Slope = 5.34, SE = 1.36, Adj. R 2 = 0.38, p < 0.01, N = 24; Figure S5). Automated scoring of exploration speed (mean speed log10 cm/s) was positively correlated with manual coding of logit proportion of time spent walking and probing (Intercept = −3.64, Slope = 6.19, SE = 0.69, Adj. R 2 = 0.61, p < 0.001, N = 75, Figure S6).
In the field, red knots caught hard‐shelled prey only by using tactile foraging (100%) and caught soft prey mostly by using visual foraging (97%) and rarely by tactile foraging (3%, 2 = 134.35, p < 0.01, Figure 1a). The percentage of visual foraging tactics that were observed in the field was positively correlated with the exploration speed measured in the mobile arena: faster exploring red knots showed significantly higher percentage of visual foraging than slower explorers (Table 2; Figure 1b). Bill length and gizzard size did not explain the variation in the observed foraging tactics (Table 2).
FIGURE 1.
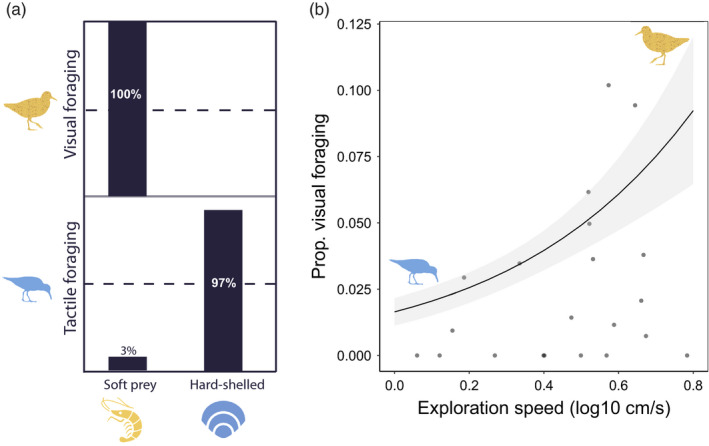
(a) Different foraging tactics (visual and tactile) leads to ingestion of different types of prey (soft and hard‐shelled). Knots using visual foraging only ingested soft prey while knots using tactile foraging ingested mainly hard‐shelled prey (97%) and rarely soft prey (3%). (b) Exploration speed (log10 mean speed cm/s) measured in the mobile arena for the first time (x axis) predicts the percentage of visual foraging observed in the field (y axis). Probabilities and 95% confidence intervals are predicted by a GLM with quasibinomial error distribution
TABLE 2.
Effects of exploration speed (log10 mean speed cm/sec), gizzard size and bill length on the percentage of visual foraging tactics observed in the field. Significance (p) is based on Wald statistics under the null hypotheses that the estimate is zero
| Variable | Estimate | SE | p‐value |
|---|---|---|---|
| Intercept | 1.1 | 4.04 | 0.81 |
| Exploration speed | 2.26 | 0.65 | <0.01 |
| Gizzard size | 0.17 | 0.18 | 0.37 |
| Bill length | −0.15 | 0.13 | 0.27 |
Stable isotope ratios (δ13C and δ15N) from plasma and red blood cells were highly correlated (Pearson's r for δ13C = 0.77 and δ15N = 0.68) which indicates consistency in diet over the c. 14 days before blood sampling to the c. 45 days before (Klaassen et al., 2010). Results from MixSIAR analysis using plasma that integrates diet from the past c. 14 days (Figure 2) were similar to those using red blood cells that integrates diet from the past c. 45 days (Klaassen et al., 2010; Figures S8 and S9). Stable isotope analysis of red knots with measured exploration speed in the mobile arena confirmed our field observations that faster exploring red knots have soft and hard‐shelled prey in their diet while slower exploring red knots relied heavily on hard‐shelled prey (Figure 2b). MixSIAR analysis using plasma showed that on average, red knots proportionally consumed more hard‐shelled prey (Median = 0.59, 2.5% CrI = 0.5, 97.5% CrI = 0.68) than soft prey (Median = 0.41, 2.5% CrI = 0.32, 97.5% CrI = 0.5). The model also predicted the proportion of soft prey as a function of exploration speed. For slower exploring red knots, the model estimate of p hard‐shelled prey is 0.76 (Median, 2.5% CrI = 0.61, 97.5% CrI = 0.88) and p soft prey is 0.24 (Median, 2.5% CrI = 0.12, 97.5% CrI = 0.39). For faster exploring red knots, model estimate of p hard‐shelled prey is 0.4 (Median, 2.5% CrI = 0.22, 97.5% CrI = 0.58) and p soft prey is 0.6 (Median, 2.5% CrI = 0.42, 97.5% CrI = 0.78). The posterior distributions of model estimates for slower and faster exploring red knots can be found in Figure S7.
4. DISCUSSION
We found that slower explorers use only tactile foraging and eat mainly hard‐shelled prey, while faster explorers use both tactile and visual foraging tactics and consume both soft and hard‐shelled prey. We show that exploration speed was highly repeatable over time and in different contexts for wild‐caught red knots. Bill length and gizzard mass did not explain differences in the use of foraging tactics. Our results demonstrate a direct link between personality traits, foraging tactics and diet, independent of morphological differences (Figure 3).
FIGURE 3.
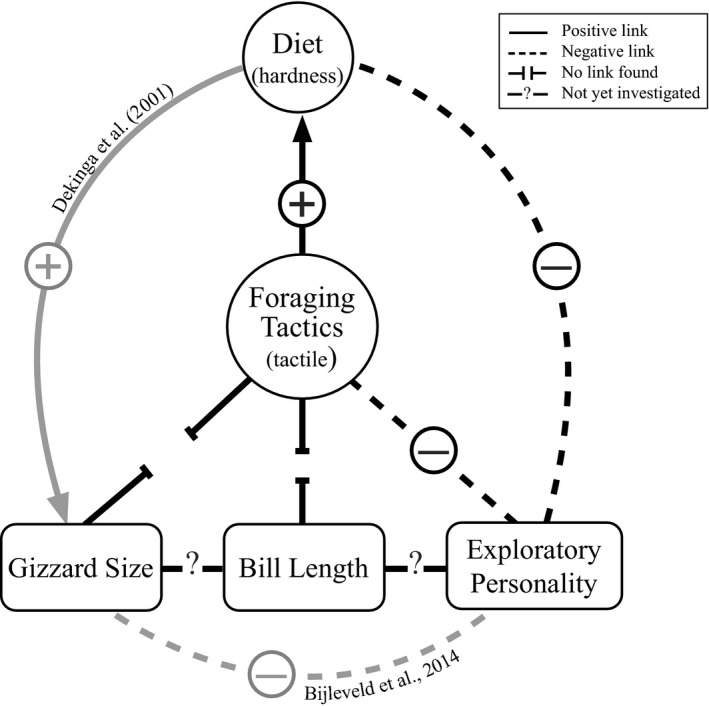
Conceptual diagram showing the links between foraging tactics, diet, exploratory personality, gizzard size and bill length. Positive and negative symbols indicate the relationship. Arrows indicate the direction. If the link is found in a different study (indicated in grey), the original study is referred
Previous research on red knots foraging on mudflats has shown that red knots are mollusc specialists that mainly feed on hard‐shelled prey that are buried in the sand and found by touch rather than sight (Piersma et al., 1998). In accordance with this, we observed that red knots primarily relied on tactile foraging, however, faster exploring birds also used visual foraging that resulted in combined diet of soft and hard‐shelled prey. Soft prey, such as shrimp, have higher energetic value and lower digestive processing costs than hard‐shelled prey (van Gils et al., 2003) but catching soft prey requires more active visual foraging and handling these prey takes longer than hard‐shelled prey (van Gils et al., 2005). By adding soft prey in the diet, faster exploring knots may offset the higher energetic cost of their movement with higher quality soft prey gain in a foraging context. While we did not investigate energy expenditure, our finding that exploration speed in red knots was correlated with prey quality matches with the pace‐of‐life literature and warrants further study.
During foraging, faster explorers used visual foraging up to 10% of the time. Yet stable isotope analysis predicted that the amount of soft prey in the diet of the fastest exploring birds could reach up to 60%. This discrepancy between video observations in the field and diet analysis by stable isotopes could be explained in two ways. First, finding individuals in the field was difficult (N = 26 re‐sightings out of 126 individuals for which we had blood samples for isotope analysis), and there was a tendency to resight slower red knots more often in the wild (as seen in Figure S3). Individuals with a higher exploratory personality have been shown to cover more ground when foraging in other species, such as great tits (van Overveld & Matthysen, 2010). Since our observations were conducted on a large intertidal mudflat, if faster explorers change location more frequently or forage further from land, they may be less likely to be observed. From the video observations, we may therefore have underestimated the percentage of visual foraging used in the population. Second, while spending small amounts of foraging time searching for soft prey, the contribution of energetically rich soft prey to the birds’ total biomass intake, and thus isotopic signal, could be proportionally much larger (van Gils et al., 2007).
Individual differences in morphology are often associated with the use of different foraging tactics (Barbosa & Moreno, 1999; Hespenheide, 1973). In our study, however, bill length was not associated with the percentage of foraging tactic use. This is similar to findings from a study on great knots Calidris tenuirostris, which showed that bill length was not related to diet, however, birds that ate softer prey had smaller gizzards (Zhang et al., 2019). We expected that birds that spent more time using the visual foraging tactic, thus with a higher proportion of soft prey in their diet, would also have smaller gizzards (Dekinga et al., 2001; Figure 3). Contrary to our predictions, we did not find an association between small gizzard size and the percentage of visual foraging tactic use. This may be because even faster exploring individuals, with the highest percentage of visual foraging, still consumed on average 40% hard‐shelled prey based on the stable isotope analyses. Likewise, the slower exploring birds also consumed 24% soft prey. Perhaps these mixed diets were large enough to reduce individual differences in gizzard size.
While many personality studies show repeatable behaviour between contexts in controlled conditions, few studies (e.g. Fraser et al., 2001; Harris et al., 2019) show a link between the behaviour measured in standardized experiments and behaviour in the wild (Carter et al., 2013). We showed that exploration speed is repeatable between contexts in controlled artificial conditions (notably without food), and that it correlates with ecologically relevant foraging tactics in the wild. Exploration speed and foraging tactics may be correlated because different foraging tactics themselves are associated with different movement speeds (Barbosa, 1995). In red knots, tactile foraging with continuous probing of the sediment is a relatively slow behaviour. In contrast, using a visual foraging tactic can involve quick scanning of the surface, which results in faster movement. Our standardised measurement of exploration speed as a personality trait therefore closely relates to foraging movement, which can be an inherent part of these foraging tactics. However, we show that exploratory movement in controlled conditions was repeatable in the absence of food. Moreover, the slow explorers often stood still during the trials and did not probe more than fast explorers (Video S1), which indicates that the standardised measure of exploration does not directly reflect probing behaviour as measured in the field. Interestingly, exploration speed predicts probing behaviour in the field. This suggests that foraging tactic itself is repeatable regardless of the environmental variation. Indeed, the correlation between isotopic signatures of plasma and red blood cells suggests consistency in diet, but whether foraging tactic itself is repeatable is unknown. To clarify the repeatability and thus flexibility of foraging tactics in the field with environmental variation, future studies should aim to repeatedly observe the same free‐living individuals.
Our results raise the question of where and how the consistent individual differences originate. Among‐individual variation could, for example, arise from differences in environmental influences or experience between individuals (Stamps & Groothuis, 2010). Especially the positive feedback between behaviour, learning and increased efficiency can gradually set individuals on different developmental trajectories and thus cause consistent individual differences in behaviour (Sih et al., 2015). There are, for instance, studies indicating that the prey environment experienced during early life, shapes an individual's foraging tactics (e.g. Heinsohn, 1991; Slagsvold & Wiebe, 2007). Competition between conspecifics is suggested to be a major factor affecting diet specialisation, foraging tactics and the emergence of personality traits (Bergmüller & Tab orsky, 2010). When competition for food is high, conspecifics can, for instance, reduce the amount of conflict by feeding on different types of food (e.g. Parent et al., 2014). Through positive feedback between learning to detect, catch and process food, this differentiation in diet can favour behavioural consistency and maintain among‐individual variation. When, to what extent and by which mechanisms consistent individual differences develop during ontogeny needs to be studied further and will likely provide interesting insights into the origin and maintenance of among‐individual variation between the members of the same population.
CONFLICT OF INTEREST
None of the authors have a conflict of interest.
AUTHORS' CONTRIBUTIONS
S.E. and A.I.B. designed the study; S.E. collected and analysed the data; S.E. drafted the first version of the manuscript. All authors contributed to writing of the final manuscript. All authors gave final approval.
Supporting information
Video S1
Video S2
Video S3
Supplementary Material
ACKNOWLEDGEMENTS
We thank Natuurmonumenten for permission to conduct this research on Griend. We thank field assistants, volunteers and students for helping with data collection, in particular Luc de Monte, Haley Shephard, Dieke de Boer, Maartje van Deventer, Daphne Haanen, Job ten Horn, Roeland Bom, Emma Penning, Benjamin Gnep and Nino Maag. We thank Ronald van Bommel for technical assistance with the stable isotope analyses. For the prey isotope data, we thank Waddensleutels, and in particular Sander Holthuijsen. We thank the crews of RV Navicula and RV Stern for sailing us around the Wadden Sea. We thank Sara R. Pant for valuable comments on the manuscript. We thank Ying Chi Chan for her suggestions on the design of the mobile arena. We thank Roel Bakker for building and maintaining the mobile arena. We also thank the anonymous referees and the associate editor for their constructive comments. This study was funded by the core funding of NIOZ and the NWO‐Veni grant to A.I.B. (VI.Veni.192.051).
Ersoy, S. , Beardsworth, C. E. , Dekinga, A. , van der Meer, M. T. J. , Piersma, T. , Groothuis, T. G. G. , & Bijleveld, A. I. (2022). Exploration speed in captivity predicts foraging tactics and diet in free‐living red knots. Journal of Animal Ecology, 91, 356–366. 10.1111/1365-2656.13632
Handling Editor Jennifer Gill
DATA AVAILABILITY STATEMENT
Data are available at the Dryad Digital Repository https://doi.org/10.5061/dryad.vmcvdncts (Ersoy et al., 2021).
REFERENCES
- Araújo, M. S. , Bolnick, D. I. , & Layman, C. A. (2011). The ecological causes of individual specialisation. Ecology Letters, 14, 948–958. 10.1111/j.1461-0248.2011.01662.x [DOI] [PubMed] [Google Scholar]
- Barbosa, A. (1995). Foraging strategies and their influence on scanning and flocking behaviour of waders. Journal of Avian Biology, 26, 182–186. 10.2307/3677317 [DOI] [Google Scholar]
- Barbosa, A. , & Moreno, E. (1999). Evolution of foraging strategies in shorebirds: An ecomorphological approach. The Auk, 116, 712–725. 10.2307/4089332 [DOI] [Google Scholar]
- Beardsworth, C. E. , Gobbens, E. , van Maarseveen, F. , Denissen, B. , Dekinga, A. , Nathan, R. , Toledo, S. & Bijleveld, A. I. (2021). Validating a high‐throughput tracking system: ATLAS as a regional‐scale alternative to GPS. bioRxiv 2021.02.09.430514. 10.1101/2021.02.09.430514 [DOI]
- Bell, A. M. , & Sih, A. (2007). Exposure to predation generates personality in threespined sticklebacks (Gasterosteus aculeatus). Ecology Letters, 10, 828–834. 10.1111/j.1461-0248.2007.01081.x [DOI] [PubMed] [Google Scholar]
- Bergmüller, R. , & Taborsky, M. (2010). Animal personality due to social niche specialisation. Trends in Ecology & Evolution, 25, 504–511. 10.1016/j.tree.2010.06.012 [DOI] [PubMed] [Google Scholar]
- Bijleveld, A. I. , Massourakis, G. , van der Marel, A. , Dekinga, A. , Spaans, B. , van Gils, J. A. , & Piersma, T. (2014). Personality drives physiological adjustments and is not related to survival. Proceedings of the Royal Society B: Biological Sciences, 281, 20133135. 10.1098/rspb.2013.3135 [DOI] [PMC free article] [PubMed] [Google Scholar]
- Bijleveld, A. I. , van Maarseveen, F. , Denissen, B. , Dekinga, A. , Penning, E. , Ersoy, S. , Gupte, P. , de Monte, L. , ten Horn, J. , Bom, R. , Toledo, S. , Nathan, R. , & Beardsworth, C. E. (2021). WATLAS: High resolution and real‐time tracking of many small birds in the Dutch Wadden Sea. bioRxiv. 10.1101/2021.11.08.467683 [DOI] [Google Scholar]
- Bolnick, D. I. , Svanbäck, R. , Fordyce, J. A. , Yang, L. H. , Davis, J. M. , Hulsey, C. D. , & Forister, M. L. (2003). The ecology of individuals: Incidence and implications of individual specialization. The American Naturalist, 161, 1–28. 10.1086/343878 [DOI] [PubMed] [Google Scholar]
- Brydges, N. M. , Colegrave, N. , Heathcote, R. J. P. , & Braithwaite, V. A. (2008). Habitat stability and predation pressure affect temperament behaviours in populations of three‐spined sticklebacks. Journal of Animal Ecology, 77, 229–235. 10.1111/j.1365-2656.2007.01343.x [DOI] [PubMed] [Google Scholar]
- Careau, V. , & Garland Jr., T. (2012). Performance, personality, and energetics: Correlation, causation, and mechanism. Physiological and Biochemical Zoology, 85, 543–571. 10.1086/666970 [DOI] [PubMed] [Google Scholar]
- Careau, V. , Thomas, D. , Humphries, M. M. , & Réale, D. (2008). Energy metabolism and animal personality. Oikos, 117, 641–653. 10.1111/j.0030-1299.2008.16513.x [DOI] [Google Scholar]
- Carter, A. J. , Feeney, W. E. , Marshall, H. H. , Cowlishaw, G. , & Heinsohn, R. (2013). Animal personality: What are behavioural ecologists measuring? Biological Reviews of the Cambridge Philosophical Society, 88, 465–475. 10.1111/brv.12007 [DOI] [PubMed] [Google Scholar]
- Caut, S. , Angulo, E. , & Courchamp, F. (2009). Variation in discrimination factors (Δ15N and Δ13C): The effect of diet isotopic values and applications for diet reconstruction. Journal of Applied Ecology, 46, 443–453. 10.1111/j.1365-2664.2009.01620.x [DOI] [Google Scholar]
- Christianen, M. J. A. , Middelburg, J. J. , Holthuijsen, S. J. , Jouta, J. , Compton, T. J. , van der Heide, T. , Piersma, T. , Sinninghe Damsté, J. S. , van der Veer, H. W. , Schouten, S. , & Olff, H. (2017). Benthic primary producers are key to sustain the Wadden Sea food web: Stable carbon isotope analysis at landscape scale. Ecology, 98, 1498–1512. 10.1002/ecy.1837 [DOI] [PubMed] [Google Scholar]
- Dekinga, A. , Dietz, M. W. , Koolhaas, A. , & Piersma, T. (2001). Time course and reversibility of changes in the gizzards of red knots alternately eating hard and soft food. Journal of Experimental Biology, 204, 2167–2173. 10.1242/jeb.204.12.2167 [DOI] [PubMed] [Google Scholar]
- Dietz, M. W. , Dekinga, A. , Piersma, T. , & Verhulst, S. (1999). Estimating organ size in small migrating shorebirds with ultrasonography: An intercalibration exercise. Physiological and Biochemical Zoology, 72, 28–37. 10.1086/316648 [DOI] [PubMed] [Google Scholar]
- Dietz, M. W. , Spaans, B. , Dekinga, A. , Klaassen, M. , Korthals, H. , van Leeuwen, C. , & Piersma, T. (2010). Do red knots (Calidris Canutus Islandica) routinely skip Iceland during southward migration? Condor, 112, 48–56. 10.1525/cond.2010.090139 [DOI] [Google Scholar]
- Dill, L. M. (1983). Adaptive flexibility in the foraging behavior of fishes. Canadian Journal of Fisheries and Aquatic Science, 40, 398–408. 10.1139/f83-058 [DOI] [Google Scholar]
- Durell, S. E. A. L. V. D. , Goss‐Custard, J. D. , & Caldow, R. (1993). Sex‐related differences in diet and feeding method in the oystercatcher Haematopus ostralegus . Journal of Animal Ecology, 62, 205–215. 10.2307/5495 [DOI] [Google Scholar]
- Ersoy, S. , Beardsworth, C. E. , Dekinga, A. , van der Meer, M. T. J. , Piersma, T. , Groothuis, T. G. G. , & Bijleveld, A. I. (2021). Data from: Exploration speed in captivity predicts foraging tactics and diet in free‐living red knots. Dryad Digital Repository, 10.5061/dryad.vmcvdncts [DOI] [PMC free article] [PubMed] [Google Scholar]
- Fraser, D. F. , Gilliam, J. F. , Daley, M. J. , Le, A. N. , & Skalski, G. T. (2001). Explaining leptokurtic movement distributions: Intrapopulation variation in boldness and exploration. The American Naturalist, 158, 124–135. 10.1086/321307 [DOI] [PubMed] [Google Scholar]
- Friard, O. , & Gamba, M. (2016). BORIS: A free, versatile open‐source event‐logging software for video/audio coding and live observations. Methods in Ecology and Evolution, 7, 1325–1330. 10.1111/2041-210x.12584 [DOI] [Google Scholar]
- Gosling, S. D. (2001). From mice to men: What can we learn about personality from animal research? Psychological Bulletin, 127, 45–86. 10.1037/0033-2909.127.1.45 [DOI] [PubMed] [Google Scholar]
- Goulson, D. , & Darvill, B. (2004). Niche overlap and diet breadth in bumblebees; are rare species more specialized in their choice of flowers? Apidologie, 35, 55–63. 10.1051/apido:2003062 [DOI] [Google Scholar]
- Griffen, B. D. , & Mosblack, H. (2011). Predicting diet and consumption rate differences between and within species using gut ecomorphology. Journal of Animal Ecology, 80, 854–863.://doi.org/ 10.1111/j.1365-2656.2011.01832.x [DOI] [PubMed] [Google Scholar]
- Harris, S. M. , Descamps, S. , Sneddon, L. U. , Bertrand, P. , Chastel, O. , & Patrick, S. C. (2019). Personality predicts foraging site fidelity and trip repeatability in a marine predator. Journal of Animal Ecology, 89, 68–79. 10.1111/1365-2656.13106 [DOI] [PMC free article] [PubMed] [Google Scholar]
- Harris, S. , Raya Rey, A. , Zavalaga, C. , & Quintana, F. (2014). Strong temporal consistency in the individual foraging behaviour of imperial shags Phalacrocorax atriceps . Ibis, 156, 523–533. 10.1111/ibi.12159 [DOI] [Google Scholar]
- Heinrich, B. (1976). The foraging specializations of individual bumblebees. Ecological Monographs, 46, 105–128. 10.2307/1942246 [DOI] [Google Scholar]
- Heinsohn, R. G. (1991). Slow learning of foraging skills and extended parental care in cooperatively breeding white‐winged choughs. The American Naturalist, 137, 864–881. 10.1086/285198 [DOI] [Google Scholar]
- Herborn, K. A. , Macleod, R. , Miles, W. T. S. , Schofield, A. N. B. , Alexander, L. , & Arnold, K. E. (2010). Personality in captivity reflects personality in the wild. Animal Behavior, 79, 835–843. 10.1016/j.anbehav.2009.12.026 [DOI] [Google Scholar]
- Hespenheide, H. A. (1973). Ecological inferences from morphological data. Annual Review of Ecology and Systematics, 4, 213–229. Retrieved from http://www.jstor.org/stable/2096811 [Google Scholar]
- Hinde, R. A. (1959). Behaviour and speciation in birds and lower vertebrates. Biological Reviews of the Cambridge Philosophical Society, 34, 85–127. 10.1111/j.1469-185x.1959.tb01303.x [DOI] [Google Scholar]
- Kerfoot, W. B. (1967). Correlation between ocellar size and the foraging activities of bees (Hymenoptera; Apoidea). American Naturalist, 101, 65–70. 10.1086/282470 [DOI] [Google Scholar]
- Klaassen, M. , Piersma, T. , Korthals, H. , Dekinga, A. , & Dietz, M. W. (2010). Single‐point isotope measurements in blood cells and plasma to estimate the time since diet switches. Functional Ecology, 24, 796–804. 10.1111/j.1365-2435.2010.01689.x [DOI] [Google Scholar]
- Knudsen, R. , Primicerio, R. , Amundsen, P. A. , & Klemetsen, A. (2010). Temporal stability of individual feeding specialization may promote speciation. Journal of Animal Ecology, 79, 161–168. 10.1111/j.1365-2656.2009.01625.x [DOI] [PubMed] [Google Scholar]
- Kok, E. M. A. , Burant, J. B. , Dekinga, A. , Manche, P. , Saintonge, D. , Piersma, T. , & Mathot, K. J. (2019). Within‐individual canalization contributes to age‐related increases in trait repeatability: A longitudinal experiment in red knots. The American Naturalist, 194, 455–469. 10.1086/704593 [DOI] [PubMed] [Google Scholar]
- Kurvers, R. H. J. M. , Prins, H. H. T. , van Wieren, S. E. , van Oers, K. , Nolet, B. A. , & Ydenberg, R. C. (2010). The effect of personality on social foraging: Shy barnacle geese scrounge more. Proceedings of the Royal Society B: Biological Sciences, 277, 601–608. 10.1098/rspb.2009.1474 [DOI] [PMC free article] [PubMed] [Google Scholar]
- le Durell, S. E. A. l. V. D. (2000). Individual feeding specialisation in shorebirds: Population consequences and conservation implications. Biological Reviews of the Cambridge Philosophical Society, 75, 503–518. 10.1111/j.1469-185x.2000.tb00053.x [DOI] [PubMed] [Google Scholar]
- Milot, E. , Cohen, A. A. , Vézina, F. , Buehler, D. M. , Matson, K. D. , & Piersma, T. (2014). A novel integrative method for measuring body condition in ecological studies based on physiological dysregulation. Methods in Ecology and Evolution, 5, 146–155. 10.1111/2041-210x.12145 [DOI] [Google Scholar]
- Moore, J. W. , & Semmens, B. X. (2008). Incorporating uncertainty and prior information into stable isotope mixing models. Ecology Letters, 11, 470–480. 10.1111/j.1461-0248.2008.01163.x [DOI] [PubMed] [Google Scholar]
- Nakagawa, S. , & Schielzeth, H. (2010). Repeatability for Gaussian and non‐Gaussian data: A practical guide for biologists. Biological Reviews of the Cambridge Philosophical Society, 85, 935–956. 10.1111/j.1469-185X.2010.00141.x [DOI] [PubMed] [Google Scholar]
- O’Brien, J. W. , Evans, B. I. , & Browman, H. I. (1989). Flexible search tactics and efficient foraging in saltatory searching animals. Oecologia, 80, 100–110. 10.1007/BF00789938 [DOI] [PubMed] [Google Scholar]
- Parent, C. E. , Agashe, D. , & Bolnick, D. I. (2014). Intraspecific competition reduces niche width in experimental populations. Ecology and Evolution, 4, 3978–3990. 10.1002/ece3.1254 [DOI] [PMC free article] [PubMed] [Google Scholar]
- Parnell, A. C. , Inger, R. , Bearhop, S. , & Jackson, A. L. (2010). Source partitioning using stable isotopes: Coping with too much variation. PLoS ONE, 5, e9672. 10.1371/journal.pone.0009672 [DOI] [PMC free article] [PubMed] [Google Scholar]
- Pastell, M. (2016). CowLog – Cross‐platform application for coding behaviours from video. Journal of Open Source Software, 4, e15. 10.5334/jors.113 [DOI] [Google Scholar]
- Patrick, S. C. , Pinaud, D. , & Weimerskirch, H. (2017). Boldness predicts an individual's position along an exploration‐exploitation foraging trade‐off. Journal of Animal Ecology, 86, 1257–1268. 10.1111/1365-2656.12724 [DOI] [PMC free article] [PubMed] [Google Scholar]
- Pérez‐Escudero, A. , Vicente‐Page, J. , Hinz, R. C. , Arganda, S. , & de Polavieja, G. G. (2014). idTracker: Tracking individuals in a group by automatic identification of unmarked animals. Nature Methods, 11, 743–748. 10.1038/nmeth.2994 [DOI] [PubMed] [Google Scholar]
- Piersma, T. (2007). Using the power of comparison to explain habitat use and migration strategies of shorebirds worldwide. Journal of Ornithology, 148, 45–59. 10.1007/s10336-007-0240-3 [DOI] [Google Scholar]
- Piersma, T. , Dekinga, A. , & Nebel, S. (1999). Reversible size‐changes in stomachs of shorebirds: When, to what extent, and why. Acta Ornithology, 34, 175–181. [Google Scholar]
- Piersma, T. , van Aelst, R. , Kurk, K. , Berkhoudt, H. , & Maas, L. R. M. (1998). A new pressure sensory mechanism for prey detection in birds: The use of principles of seabed dynamics? Proceedings of the Royal Society of London, Series B: Biological Sciences, 265, 1377–1383. 10.1098/rspb.1998.0445 [DOI] [Google Scholar]
- R Core Team . (2021). R: A language and environment for statistical computing. R Foundation for Statistical Computing. https://www.R‐project.org/ [Google Scholar]
- Réale, D. , Garant, D. , Humphries, M. M. , Bergeron, P. , Careau, V. , & Montiglio, P. O. (2010). Personality and the emergence of the pace‐of‐life syndrome concept at the population level. Philosophical Transactions of the Royal Society B: Biological Sciences, 365, 4051–4063. 10.1098/rstb.2010.0208 [DOI] [PMC free article] [PubMed] [Google Scholar]
- Ringler, N. H. (1983). Variation in foraging tactics of fishes. In D. L. G. Noakes, D. G. Lindquist, G. S. Helfman, & J. A. Ward (Eds.), Predators and prey in fishes: Proceedings of the 3rd biennial conference on the ethology and behavioral ecology of fishes, held at normal, Illinois, U.S.A., May 19–22, 1981 (pp. 159–171). Springer Netherlands. 10.1007/978-94-009-7296-4_18 [DOI] [Google Scholar]
- Robinson, S. K. , & Holmes, R. T. (1982). Foraging behavior of forest birds: The relationships among search tactics, diet, and habitat structure. Ecology, 63, 1918. 10.2307/1940130 [DOI] [Google Scholar]
- Sih, A. , Bell, A. , & Johnson, J. C. (2004). Behavioral syndromes: An ecological and evolutionary overview. Trends in Ecology & Evolution, 19, 372–378. 10.1016/j.tree.2004.04.009 [DOI] [PubMed] [Google Scholar]
- Sih, A. , Mathot, K. J. , Moirón, M. , Montiglio, P. O. , Wolf, M. , & Dingemanse, N. J. (2015). Animal personality and state–behaviour feedbacks: A review and guide for empiricists. Trends in Ecology & Evolution, 30, 50–60. 10.1016/j.tree.2014.11.004 [DOI] [PubMed] [Google Scholar]
- Slagsvold, T. , & Wiebe, K. L. (2007). Learning the ecological niche. Proceedings of the Royal Society B: Biological Sciences, 274, 19–23. 10.1098/rspb.2006.3663 [DOI] [PMC free article] [PubMed] [Google Scholar]
- Stamps, J. A. , & Groothuis, T. G. G. (2010). Developmental perspectives on personality: Implications for ecological and evolutionary studies of individual differences. Philosophical Transactions of the Royal Society B: Biological Sciences, 365, 4029–4041. 10.1098/rstb.2010.0218 [DOI] [PMC free article] [PubMed] [Google Scholar]
- Stock, B. C. , Jackson, A. L. , Ward, E. J. , Parnell, A. C. , Phillips, D. L. , & Semmens, B. X. (2018). Analyzing mixing systems using a new generation of Bayesian tracer mixing models. PeerJ, 6, e5096. 10.7717/peerj.5096 [DOI] [PMC free article] [PubMed] [Google Scholar]
- Stock, B. C. , & Semmens, B. X. (2016). MixSIAR GUI user manual. Version 3.1 (Github). https://github.com/brianstock/MixSIAR. 10.5281/zenodo.1209993 [DOI] [Google Scholar]
- Tinker, M. T. , Costa, D. P. , Estes, J. A. , & Wieringa, N. (2007). Individual dietary specialization and dive behaviour in the California sea otter: Using archival time–depth data to detect alternative foraging strategies. Deep Sea Research Part II: Topical Studies in Oceanography, 54, 330–342. 10.1016/j.dsr2.2006.11.012 [DOI] [Google Scholar]
- Toscano, B. J. , Gownaris, N. J. , Heerhartz, S. M. , & Monaco, C. J. (2016). Personality, foraging behavior and specialization: Integrating behavioral and food web ecology at the individual level. Oecologia, 182, 55–69. 10.1007/s00442-016-3648-8 [DOI] [PubMed] [Google Scholar]
- van Gils, J. A. , Dekinga, A. , Spaans, B. , Vahl, W. K. , & Piersma, T. (2005). Digestive bottleneck affects foraging decisions in red knots Calidris canutus. II. Patch choice and length of working day. Journal of Animal Ecology, 74, 120–130. 10.1111/j.1365-2656.2004.00903.x [DOI] [Google Scholar]
- van Gils, J. A. , Dekinga, A. , van den Hout, P. J. , Spaans, B. , & Piersma, T. (2007). Digestive organ size and behavior of red knots (Calidris canutus) indicate the quality of their benthic food stocks. Israel Journal of Ecology & Evolution, 53, 329–346. 10.1560/IJEE.53.3.329 [DOI] [Google Scholar]
- van Gils, J. A. , Piersma, T. , Dekinga, A. , & Dietz, M. W. (2003). Cost‐benefit analysis of mollusc‐eating in a shorebird. II. Optimizing gizzard size in the face of seasonal demands. Journal of Experimental Biology, 206, 3369–3380. 10.1242/jeb.00546 [DOI] [PubMed] [Google Scholar]
- van Overveld, T. , & Matthysen, E. (2010). Personality predicts spatial responses to food manipulations in free‐ranging great tits (Parus major). Biology Letters, 6, 187–190. 10.1098/rsbl.2009.0764 [DOI] [PMC free article] [PubMed] [Google Scholar]
- van Valen, L. (1965). Morphological variation and width of ecological niche. The American Naturalist, 99, 377–390. 10.1086/282379 [DOI] [Google Scholar]
- Wolf, M. , & Weissing, F. J. (2012). Animal personalities: Consequences for ecology and evolution. Trends in Ecology & Evolution, 27, 452–461. 10.1016/j.tree.2012.05.001 [DOI] [PubMed] [Google Scholar]
- Zhang, S. , Ma, Z. , Feng, C. , Melville, D. S. , van Gils, J. A. , & Piersma, T. (2019). Individual diet differences in a molluscivore shorebird are associated with the size of body instruments for internal processing rather than for feeding. Journal of Avian Biology, 50, e02255. 10.1111/jav.02255 [DOI] [Google Scholar]
- Zwarts, L. (1985). The winter exploitation of fiddler crabs Uca tangeri by waders in Guinea‐Bissau. Ardea, 73, 3–12. [Google Scholar]
- Zwarts, L. , Blomert, A. M. , & Wanink, J. H. (1992). Annual and seasonal variation in the food supply harvestable by knot Calidris canutus staging in the Wadden Sea in late summer. Marine Ecology Progress Series, 83, 129–139. 10.3354/meps083113 [DOI] [Google Scholar]
Associated Data
This section collects any data citations, data availability statements, or supplementary materials included in this article.
Supplementary Materials
Video S1
Video S2
Video S3
Supplementary Material
Data Availability Statement
Data are available at the Dryad Digital Repository https://doi.org/10.5061/dryad.vmcvdncts (Ersoy et al., 2021).