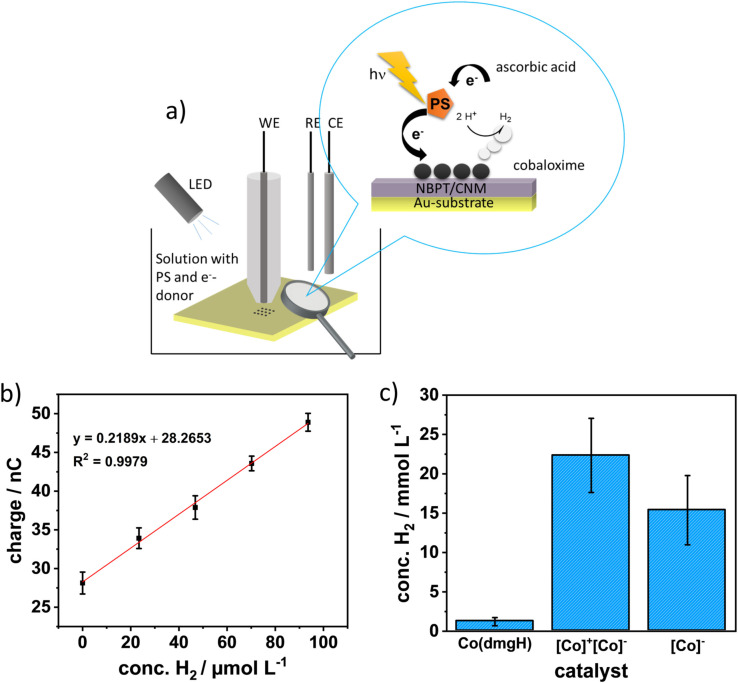
Figure 5.
a) Schematic of the SECM illumination experiment. b) Example calibrations curve for a Pd microsensor. c) Bar diagram of the H2 concentration yield after 1 h of illumination of three catalysts. Abbreviations of the x‐coordinate labelling is as follows: [Co(dmgH)2(py)Cl]=Co(dmgH), [Co(dmgH)2(py)2]+[Co(dmgBPh2)2Cl2]−=[Co]+[Co]−, and TBA+[Co(dmgBPh2)2Cl2]−=[Co]−. All experiments were performed under argon. Error bars reflect three measurements for [Co]+[Co]− and Co(dmgH), and two measurements for [Co]−.

