

Abstract
Aim
Analysis of distribution of p‐values of continuous differences between test and controls after randomization provides evidence of unintentional error, non‐random sampling, or data fabrication in randomized controlled trials (RCTs). We assessed evidence of highly unusual distributions of baseline characteristics of subjects enrolled in clinical trials in implant dentistry.
Materials and methods
RCTs published between 2005 and 2020 were systematically searched in Pubmed, Embase, and Cochrane databases. Baseline patient data were extracted from full text articles by two independent assessors. The hypothesis of non‐random sampling was tested by comparing the expected and the observed distribution of the p‐values of differences between test and controls after randomization.
Results
One‐thousand five‐hundred and thirty‐eight unique RCTs were identified, of which 409 (26.6%) did not report baseline characteristics of the population, and 671 (43.6%) reported data in forms other than mean and standard deviation and could not be used to assess their random sampling. Four‐hundred and fifty‐eight trials with 1449 baseline variables in the form of mean and standard deviation were assessed. The study observed an over‐representation of very small p‐values [<.001, 1.38%, 95% confidence interval (CI) 0.85–2.12 compared to the expected 0.10%, 95% CI 0.00–0.26]. No evidence of over‐representation of larger p‐values was observed. Unusual distributions were present in 2.38% of RCTs and more frequent in non‐registered trials, in studies supported by non‐industry funding, and in multi‐centre RCTs.
Conclusions
The inability to assess random sampling due to insufficient reporting in 26.6% of trials requires attention. In trials reporting suitable baseline data, unusual distributions were uncommon, and no evidence of data fabrication was detected, but there was evidence of non‐random sampling. Continued efforts are necessary to ensure high integrity and trust in the evidence base of the field.
Keywords: data integrity, implant dentistry, non‐random sampling, randomized clinical trials, risk of bias
Clinical Relevance.
Scientific rationale for study: Trust in scientific evidence is the key to applying best practices to clinical care. Concerns of bias have been raised in many medical disciplines. Most assessments are unable to address data but focus on process.
Principal findings: The study found no evidence of systematic misconduct. A small, yet significant, proportion of studies show traces of failed randomization and thus potential bias in implant dentistry trials. Studies with trial registration and industry funding seem to be less affected.
Practical implications: Significant bias is built into the body of evidence, yet there is no evidence of systematic problems. Evidence‐based implant dentistry remains the best approach to develop guidelines and make the best practice decisions. Researchers, editors, and peer reviewers need to continuously improve the integrity and trust of the evidence base.
1. INTRODUCTION
Bias in science, although relatively small in magnitude, has pervasive and far‐reaching effects (Fanelli et al., 2017). Surveys have indicated that 2% of scientists admit having engaged in serious questionable practice and 14% report being aware of colleagues having engaged in such practices (Fanelli, 2009). These are likely conservative estimates. In medicine, implications are far reaching when biased translational research is brought into clinics and when trials are included in systematic reviews that inform evidence‐based guidelines and best practices. Randomized controlled trials (RCTs) have been advocated as a key method to reduce bias and improve the evidence base of medicine and dentistry (Grimes & Schulz, 2002). A systematic analysis of sources of bias in RCTs, commissioned by the US Agency for Healthcare Research and Quality, has studied the impact of six domains of bias in RCTs: selection bias through randomization; confounding through design and analysis; detection bias through blinding and statistics; performance bias through fidelity to protocol; attrition bias through ITT (intention to treat) and other procedures to account for loss to follow‐up; and reporting bias through selective outcome reporting (Berkman et al., 2014). While data did not allow precise estimates, a trend towards amplified differences was observed in biased reports. In parallel, efforts have been made to assess the impact of interventions designed to decrease bias in terms of modification of perceptions and attitudes, acquisition of knowledge and skills, behavioural changes, and organizational changes (Marusic et al., 2016). Authors concluded that the effect of interventions was uncertain and noted that the use of a journal's author contribution form affected the truthfulness of the information supplied.
Efforts to improve the quality of clinical research and thus confidence in the results have included sensible actions focused on (i) improving the quality of reporting of trials through the establishment and implementation of design specific checklists, (ii) institutional research governance, and (iii) clinical trial registration in publicly accessible depositories. These efforts have focused on establishing robust processes aimed at the prevention of misconduct but have until recently failed to directly assess content and thus an essential component of the integrity of the data. High‐profile reports of scientific fraud have led to attempts to assess content in the hope to identify data fabrication or falsely reporting observational research as a randomized trial. John Carlisle, the Editor of Anesthesia, has pioneered the application of the Stouffer−Fischer statistical method to identify errors in reporting baseline data, non‐random sampling, and/or data fabrication (Carlisle, 2017; Carlisle & Loadsman, 2017; Adam, 2019). The method assumes that the p‐values of differences between the test and the control groups observed after randomization should follow a uniform distribution and that deviations can be detected. While the interpretation of the findings—in particular the ability to tell apart honest error from misconduct—and calls for routine application at article submission have been questioned (Mascha et al., 2017), the novel version of the Cochrane risk of bias tool (Rob2) (Sterne et al., 2019) has introduced greater scrutiny of the compulsory Table 1 according to the CONSORT guidelines to assess potential bias (question 1.3 in domain 1). Debate continues about the benefits of using statistics to identify unusual patterns of data during the monitoring of clinical trials, at article submission, and in bibliometric studies (Buyse et al., 1999; van den Bor et al., 2017; Cragg et al., 2021).
TABLE 1.
Impact of time on the number (proportion) of trials reporting baseline covariates after randomization (total number of trials = 1538)
| Period (number of publications) | Baseline description N (%) | p‐Value | |
|---|---|---|---|
| Not reported | Reported | ||
| 2005–2010 (N = 243) | 84 (34.6) | 159 (65.4) | <.01 |
| 2011–2015 (N = 486) | 132 (27.2) | 354 (72.8) | |
| 2016–2020 (N = 809) | 193 (23.9) | 616 (76.1) | |
Note: The p‐values were retrieved with the Cochran−Armitage trend test.
In implant dentistry, the challenges to establishing a credible evidence base have been well recognized and discussed in a meeting jointly convened 25 years ago by the American Academy of Periodontology and the US Food and Drug Administration (Buser & Tonetti, 1997; Scott & Runner, 1997; Weber et al., 1997). A decisive impulse towards high‐quality clinical research has been established by a series of evidence‐based workshops; among these, the VIII European Workshop focused on the design and quality of reporting of clinical research in implant dentistry (Lang & Zitzmann, 2012; Sanz & Chapple, 2012; M. Tonetti & Palmer, 2012) and reiterated the importance of well‐designed randomized controlled clinical trials in the field. Multiple systematic reviews focused on methodology have shown that bias in reported implant dentistry trials remains high (Faggion et al., 2014). Furthermore, recent analyses of retractions in dental research have indicated that implant dentistry appears to be a high‐risk discipline (Faggion et al., 2018; Rapani et al., 2020).
We hypothesize that unusual distributions are present after randomization of subjects in implant dentistry clinical trials, that extreme p‐values are not evenly distributed within the clinical trial population, and that specific risk indicators can be identified. The aims of this study were to (i) identify unusual distribution of baseline data in RCTs in implant dentistry and (ii) identify potential risk indicators for unusual distribution of baseline parameters after subject randomization.
2. METHODS AND MATERIALS
2.1. PICO question, search strategy, and screening
This was a systematic analysis of randomized clinical trials published between 1 January 2005 and 31 December 2020 in the field of implant dentistry (Population). The study considered any intervention related to implant dentistry including surgery, prosthetic reconstruction, guided bone regeneration (GBR), socket preservation, sinus grafting, and management of peri‐implantitis. Comparisons included no‐treatment controls and any other treatment. The primary outcome was the presence of highly unusual distributions of baseline characteristics between test and control groups in clinical trials. Additional outcomes included appropriate reporting of baseline data (Table 1 after randomization) and Cochrane risk of bias (RoB2) of studies with unusual distributions and a matched control study.
Trials were screened in Pubmed, Embase, and the Cochrane clinical trial library using the following search syntax:
(Dental implant(MESH) OR dental implantation(MESH) OR osseointegration(MESH) OR osseointegrated implant OR alveolar ridge augmentation OR alveolar ridge preservation OR socket preservation OR guided bone regeneration OR sinus augmentation OR sinus graft OR immediate implant OR delayed implant) AND (randomized clinical trial OR clinical trial OR clinical study[Title/Abstract] OR pragmatic trial[Title/Abstract]))) AND (“2005/01/01”[Date ‐ Publication]: “2020/12/31”[Date ‐ Publication]) Exclude: Embryo implantation. Citations were exported into a citation manager (Endnote X9) and duplicates were eliminated. Titles and abstracts were assessed by two trained raters (W.S.M. & Y.K.X., kappa=0.895 for inter‐examiner agreement) to eliminate irrelevant citations such as systematic reviews, meta‐analyses, non‐dental trials, clearly non‐randomized clinical trials. Discrepancies between examiners were resolved by discussion and consensus with a third investigator (S.J.Y.).
The full text of the identified articles were downloaded and analysed by two independent trained and calibrated raters (W.S.M. and Y.K.X.; kappa = 0.9424 for inter‐examiner agreement) to identify RCTs. A study was considered an RCT if described as such in the title, abstract, or text of the article. In case of disagreement between the raters, the specific study was discussed, and consensus reached with a third investigator (S.J.Y.). Methods followed the PRISMA guidelines for the relevant portions (Moher et al., 2009).
2.2. Data extraction
Experimental data were extracted using a piloted, custom‐made data collection form. Data from a specific study was extracted by a single investigator (X.M.) and independently checked by two additional investigators (S.J.Y. and X.R.). Trials reported in multiple publications (e.g., at different times of follow‐up) were assessed considering all publications of that trial. The following primary data was extracted:
Presence of baseline data describing test and control groups after randomization.
Presence and number of reported baseline variables and their type (categorical or numerical).
For each variable, frequencies (categorical) or means and standard deviations (numerical) and reported p‐values were entered for test and control group(s). The sample size for each group was also included.
For each study, the following characteristics were also recorded: (i) PMID; (ii) Year of publication; (iii) journal of publication; (iv) institution of the first author; (v) institution of the last author; (vi) type of institution (private practice, university, hospital, consortia, commercial clinical research organization); (vii) single‐centre or multicentre trial; (viii) whether trial registration reported or not reported in the publication; (ix) source of funding (institutional, commercial, no funding); and (x) primary trial area (new implant design or surface, implant timing or loading, aesthetics, bone augmentation, soft tissue augmentation, management or prevention of biological complications).
2.3. Risk of bias
Given the number of identified trials, risk of bias was limited to trials identified as having unusual distribution of baseline values and a matched random sample by journal, year of publication, and topic. The Cochrane RoB2 tool was employed (Sterne et al., 2019).
2.4. Statistical analysis
Data management and analyses were performed using SAS version 9.4 (SAS Institute, Cary, NC). All analyses were performed with the statistician masked with respect to the trial authors and institutions. All reported p‐values for t‐test of baseline covariates were recalculated by the biostatistician (X.Z.) based on reported mean, standard deviation, and the number of participants, using the following formula:
The expected distribution of p‐values from comparisons between randomized groups for continuous variables at baseline has been reported to be uniform (Bolland et al., 2019), with an equal likelihood of a p‐value for any decile, that is, the expected percentage is 10% in each decile.
The 95% confidence interval (CI) of the expected percentage was calculated to test whether the observed distribution was unusual. The area under the curve of the cumulative distribution function (AUC CDF) was also calculated to estimate the percentage of overall deviation from the expected distribution. Fisher's exact test was further used to compare the observed prevalence of p < .001 with the expected distribution. Non‐parametric Wilcoxon test was performed to compare the result of the Cochrane ROB2 assessment (ranked ordinal data) between trials with baseline p < .001 and trials without unusual distribution.
2.5. Contact with corresponding authors
All corresponding authors of the RCTs presenting unusual distributions were contacted via e‐mail and asked to verify if there was any unintentional error in the baseline data reported in their paper. A reminder was sent after 1 week. In case of no answer or unsatisfactory explanation, the unusual distribution was attributed to non‐random sampling.
3. RESULTS
3.1. Included studies and proportion of trials not reporting baseline values
Figure 1 illustrates the PRISMA diagram of the included studies. After removal of duplicates, the search identified 4522 publications, of which 2984 were excluded after the title/abstract screening as being clearly not RCTs or multiple publications arising from the same trial. One‐thousand five‐hundred and thirty‐eight articles reporting on RCTs were assessed as full text. Of these, 1080 (70.2%) were excluded, as they did not present the required baseline description of the test and control populations according to the CONSORT checklist; 409 (26.6%) did not present any baseline information, and 671 (43.6%) did not have baseline information with at least one variable in the form of mean and SD. Tables 1 and 2 show the distribution of trials failing to report baseline information by publication year and impact factor of the publishing journal. A significant decrease in the proportion of such studies was observed comparing reports published in 2005–2010, 2011–2015, and 2016–2020 (p < .01, Cochran Armitage trend test). Similarly, the proportion of studies reporting baseline information was significantly higher in journals with a higher impact factor (p < .01, Cochran−Armitage trend test). A total of 458 trials reporting on 1449 variables at baseline were included in all subsequent analyses. No included study used stratification or minimization in the randomization process.
FIGURE 1.
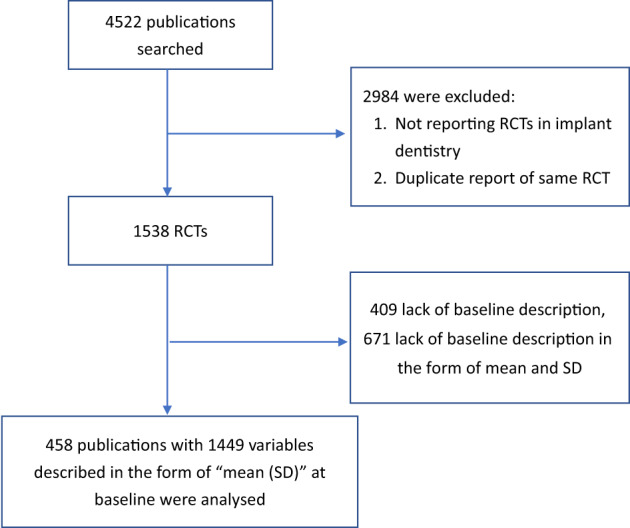
PRISMA diagram illustrating the included studies. RCTs, randomized controlled trials
TABLE 2.
Impact of the 2020 journal impact factor (IF) on the number (proportion) of trials reporting baseline covariates after randomization (total number of trials = 1538)
| Impact factor (number of publications) | Baseline description N (%) | p‐Value | |
|---|---|---|---|
| Not reported | Reported | ||
| IF < 1 (N = 118) | 37 (31.4) | 81 (68.6) | .009 |
| 1 ≤ IF < 3 (N = 423) | 129 (30.5) | 294 (69.5) | |
| 3 ≤ IF < 5 (N = 453) | 125 (27.6) | 328 (72.4) | |
| IF ≥ 5 (N = 544) | 118 (21.7) | 426 (78.3) | |
Note: p‐Values were retrieved with the Cochran–Armitage trend test. IF values of 2020 of the journals were used in the analysis.
3.2. Distribution of expected and observed p‐values
Figure 2 shows the expected and observed distribution of the p‐values of baseline characteristics of subjects randomized in the test and control groups. There was no over‐representation of p‐values >.5. p‐Values in the smallest decile, however, were over‐represented by 5.3% (p < .01, 95% CI 2.9–7.7%). The observed proportion of very small p‐values (<.001) was 1.38% (95% CI 0.85–2.12); this was significantly higher (p < .01, Chi‐squared test) than the expected proportion of 0.1% (95% CI 0.00–0.26%). The difference in the AUC of the cumulative observed and expected distributions of p‐values (Figure 3) provides a total estimate of deviations equal to 7.1% of variables. Very small p‐values (<.001) were observed in 13 RCTs (see Table S1). In the majority of these trials, only one variable had a very small p‐value. One study had four, another three, and one had two variables with very small p‐values. The corresponding authors of these RCTs were contacted. Seven replied but none reported that there were errors in the baseline data.
FIGURE 2.
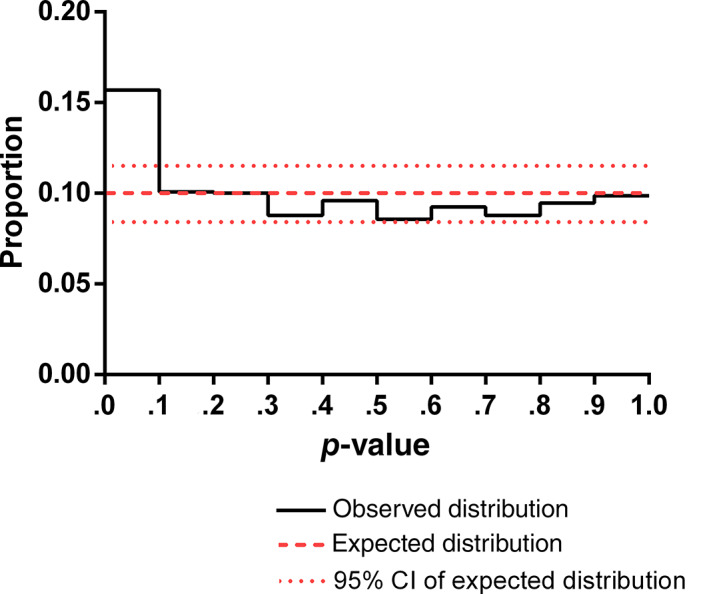
Expected and observed distribution of p‐values of baseline covariates after randomization. N = 1449 variables from 458 trials
FIGURE 3.
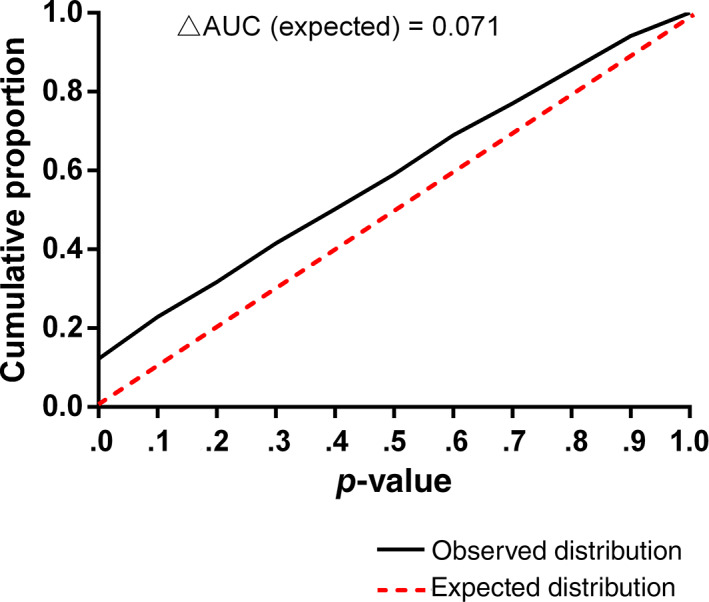
Cumulative proportion of expected and observed distribution of p‐values of baseline covariates after randomization. N = 1449 variables from 458 trials. AUC, area under the curve
3.3. Risk indicators of unusual distribution
Table 3 shows the significance of indicators of unusual distributions. No significant differences were observed for time of publication or type of institution. Multi‐centre trials had significantly higher proportions of unusual distributions (p = .013). Studies reporting commercial funding had significantly lower proportions of unusual distributions (p = .039) and so did studies with trial registration (p = .003).
TABLE 3.
Indicators of RCTs with unusual distribution (p < .001)
| Expected | Observed | 95% CI | p‐Values | ||
|---|---|---|---|---|---|
| Indicator (number of variables) | Proportion of p < .001 (%) | Chi‐square | |||
| Publication year | 2005–2010 (N = 170) | 0.1 | 0.59 | 0.01–3.23 | – |
| 2011–2015 (N = 364) | 0.1 | 1.92 | 0.78–3.92 | .268 | |
| 2016–2020 (N = 915) | 0.1 | 1.31 | 0.68–2.28 | .441 | |
| Type of institution | Hospital (N = 533) | 0.1 | 0.94 | 0.31–2.18 | – |
| University (N = 828) | 0.1 | 1.81 | 1.02–2.97 | .203 | |
| Clinical research organization (N = 31) | 0.1 | 0.00 | – | .999 | |
| Private practice/company (N = 57) | 0.1 | 0.00 | – | .999 | |
| Source of funding | No funding (N = 578) | 0.1 | 1.73 | 0.83–3.16 | – |
| Institutional funding (N = 372) | 0.1 | 2.42 | 1.11–4.54 | .465 | |
| Industrial funding (N = 499) | 0.1 | 0.20 | 0.00–1.11 | .039 | |
| Multi‐centre | No (N = 1327) | 0.1 | 1.13 | 0.63–1.86 | – |
| Yes (N = 122) | 0.1 | 4.10 | 1.34–9.31 | .013 | |
| Trial registration | No (N = 572) | 0.1 | 2.62 | 1.47–4.29 | – |
| Yes (N = 877) | 0.1 | 0.57 | 0.19–1.33 | .003 | |
Note: As the proportion of p < .001 was low in all subgroups, the significance of indicators of RCTs with unusual distribution was tested with Chi‐square in Poisson regression using the first group as the reference (ref = first) and a logarithmic link function. The 95% confidence interval (CI) was calculated using the following SAS procedure (Proc freq; table x/binomial; run;).
3.4. Risk of bias assessment
The application of the RoB2 Cochrane assessment resulted in 10 and 3 trials with unusual distribution showing “some concern” and “high risk” of bias, respectively. The matched control trials showed “some concern” and “low risk” of bias in eight and five trials, respectively. The difference in overall risk of bias between the two groups was significant (p = .006, Wilcoxon test). After excluding domain 1 of the RoB2 tool—the domain specifically related to randomization—however, there was no significant difference between the two groups (p = .778, Wilcoxon test).
4. DISCUSSION
The key results of this study were (i) the experimental indication of non‐random sampling in a small, yet relevant, proportion of papers reporting RCTs in implant dentistry, and (ii) the identification of specific risk indicators for non‐random sampling, namely lack of trial registration, non‐industry sponsorship, and multi‐centre trials. These conclusions can be drawn from the detected over‐representation of very small p‐values in the comparison of baseline covariates of test and control subjects after randomization. Very small p‐values can be the result of either an error of reporting or non‐random sampling/compromised randomization by inappropriate allocation concealment. An attempt to differentiate the two situations was made by contacting the corresponding authors of the original studies and inviting them to specifically check the results reporting on the baseline intergroup differences, share the presence of any errors along with their corrected values, and the pledge to ask the journal to publish an erratum. Authors did not report the presence of errors.
In dentistry, these data represent a first attempt to go beyond formal assessment of quality of reporting, which, by definition, does not address the matter of data integrity. While the employed statistical method has proved robust in identifying unusual distribution of p‐values of baseline differences, its interpretation has been the subject of debate (Mascha et al., 2017; Stang & Baethge, 2018). It is important to underline that while looking at changes between the observed and expected distribution is relatively robust, extrapolation to individual studies is problematic and the appearance of a specific study in the list of trials with unusual distribution does not equate to scientific misconduct. The most plausible alternative explanation is reporting error, and authors were offered the opportunity to correct any such instance. The presence in some studies of multiple very small p‐values appears noteworthy. Other statistical problems and limitations have been highlighted that require using this tool only as a screening method, which may call for additional investigation to better understand the circumstances of an individual study and its report. It is also important to understand that the method does not imply that papers that have not been flagged are free from scientific misconduct or other forms of bias. A case in point has been reported by Graziani et al. (2019) in their systematic review on early implant placement in anterior areas: they identified discrepancies in the randomization process and in multiple publications of a key trial, reported as RCT, which has not been identified in this study. In the consensus, the trial was considered at high risk of bias and probably invalid, with great impact on clinical recommendations (Tonetti et al., 2019). Another important limitation of this study is that, while the general view maintains that bias/misconduct inflate treatment effect, there are no specific estimates of the clinical relevance of the findings (Berkman et al., 2014).
This study showed that 2.8% of trials had unusual distributions at baseline. If such prevalence were to be fully attributed to non‐random sampling and serious scientific misconduct, the prevalence will be like that reported in the broader areas of science (Fanelli, 2009). Such prevalence, however, is probably a conservative estimate, as many trials (409 of 1538) in implant dentistry did not report baseline data after randomization (a CONSORT requirement) and thus could not be evaluated.
Of interest is the discussion of the observed unusual distribution in the context of retractions in dentistry and implant dentistry. Systematic analyses published in 2018 and 2020 have identified 138 and 180 retracted articles in dentistry, respectively (Faggion et al., 2018; Rapani et al., 2020); only a minority (8–12) were clinical trials. For these, scientific misconduct was by far the major reason for the retraction, which in 9 out of 10 cases was requested by the journal editor. Three of the retracted RCTs were in implant dentistry (Bottini et al., 2012; Pieri et al, 2012, Moll et al. 2012), and these represent 0.2% (3 out of 1538) of trials identified in this study.
The observed risk indicators of unusual distribution/non‐random sampling are important. Lack of trial registration was associated with higher proportion of unusual distributions and, to the best of our knowledge, represents the first observation of a potential benefit in terms of data integrity. It is reasonable to assume that the additional effort and surveillance associated with trial registration may have decreased the risk of unusual distribution/non‐random sampling. Prospective trial registration has been originally advocated to address publication bias (Simes, 1986), but it is now a critical component to improve data integrity and has been a requirement of leading dental Journals (Smaïl‐Faugeron et al., 2015). Currently, 475 trials on implant dentistry or dental/oral implant are registered in a public depository (information accessed from the WHO international clinical trial registration portal in August 2021); 153 of these are recruiting but only 58 of them (38%) have been prospectively registered. Concerted policy action towards a clear end to the moratorium of required prospective registration may now be warranted for all dental journals (Giannobile, 2015). The observed protective effect of industry funding of the trial is an important finding. The mandates to obtain high‐quality research for registration and post‐market surveillance of medical devices are probably a key factor. This finding also contributes to the ongoing discussion of the role of commercial funding in bias in implant dentistry research (Popelut et al., 2010; Dos Santos et al., 2019). Somehow unexpected was the observation that higher proportions of unusual distributions were observed in multi‐centre studies—trials that are frequently perceived as having better quality and less bias. Firstly, the sample included 122 trials (7.9% of the total sample) self‐reported as being multi centre. It comprised a wide spectrum of trials, from relatively small self‐funded studies to larger industry‐sponsored trials. In multi‐centre trials, randomization bias is a well‐known phenomenon that may arise from failure of randomization at some of the centres or from ineffective monitoring of the study sites (George & Buyse, 2015). As these studies carry additional weight in meta‐analyses and clinical guidelines, additional scrutiny seems justified, for example, by using semi‐automated electronic data monitoring systems that can flag unusual characteristics of subjects at specific study sites during subject recruitment (Buyse et al., 1999; van den Bor et al., 2017).
Analysis of the differences in the RoB2 scores for the papers with unusual distribution and randomly matched controls point to the fact that papers with unusual distribution were not obviously different in terms of perceived risk of bias in the non‐randomization/allocation concealment domains of the Cochrane risk of bias tool. This highlights that quality of reporting and substantive issues with a trial should be considered and assessed in parallel. Particular attention is called for an assessment of baseline covariates.
Of importance are also the additional findings suggesting that lack of reporting of baseline covariates—a critical requirement for the adherence to the CONSORT guidelines—remains highly prevalent in the implant dentistry body of evidence. The observed trend towards an improvement over time and in journals with higher impact factor is positive, but additional efforts are urgently required because 24% of the trials published in the latest 5‐year period did not comply with it (Table 1).
A few final considerations should be made. First, while this study detected no evidence of systematic misconduct in implant dentistry, there seems to be at least an order of magnitude discrepancy between retracted RCTs and trials with unusual distribution of baseline covariates (0.2% vs. 2.8%, respectively). The assessment of unusual distributions to learn more about randomization and allocation concealment explores only one of the six recognized domains of bias. There is no reason to believe that bias, serious misconduct, or fraud is limited to this aspect. Second, efforts to improve the current situation require more stringent enforcement of editorial policies and quality of reporting guidelines at manuscript submission and during the peer review. Ongoing changes in the business model of scientific publishing (Tonetti, 2019), however, pose formidable manpower and cost challenges. The introduction and implementation of semi‐automated systems, such as the ones routinely used for plagiarism checking, may help (Cragg et al., 2021). In parallel, research institutions should improve clinical research governance and monitoring of ongoing trials. Finally, incorporation of the current evidence in systematic reviews and clinical guidelines may require a more circumspect and conservative approach considering risk of bias, the overall assessment of the trials and their reports, and insight provided by expert opinion. The recent EFP S3 guidelines provide an important best‐practice example (Sanz et al., 2020).
CONFLICT OF INTEREST
Maurizio S. Tonetti received grant support and/or personal fees from Geistlich Pharma AG, Straumann AG, Nobel Biocare, and Sunstar SA, which are, however, unrelated to the present work. The other authors report no conflict of interest.
AUTHOR CONTRIBUTIONS
Maurizio S. Tonetti conceived the work; Maurizio S. Tonetti, Hong‐Chang Lai, Jun‐Yu Shi, Xiao Zhang, and Shu‐Jiao Qian designed the study; Shi‐min Wei, Kai‐Xiao Yan, and Min Xu acquired the data; Xiao Zhang analysed the data. All authors contributed to the interpretation of the data and the drafting of the report, and approved the final version and agree to be accountable for the work.
Supporting information
Appendix S1: Supporting information
ACKNOWLEDGEMENTS
This work was supported by grants 19MC 1910600 and shslczdzk01601 to the National Clinical Research Center for Oral Diseases, China, and the Hong Kong Human Medical Research Fund (HMRF) grant No. 07182796 to Maurizio S. Tonetti.
Shi, J.‐Y. , Zhang, X. , Qian, S.‐J. , Wei, S. , Yan, K.‐X. , Xu, M. , Lai, H.‐C. , & Tonetti, M. S. (2022). Evidence and risk indicators of non‐random sampling in clinical trials in implant dentistry: A systematic appraisal. Journal of Clinical Periodontology, 49(2), 144–152. 10.1111/jcpe.13571
Jun‐Yu Shi and Xiao Zhang contributed equally to this study.
Funding information Hong Kong Human Medical Research Fund (HMRF), Grant/Award Number: 07182796; National Clinical Research Center for Oral Diseases, China
DATA AVAILABILITY STATEMENT
Authors select to not share data.
REFERENCES
- Adam, D. (2019). The data detective. Nature, 571, 462–463. [DOI] [PubMed] [Google Scholar]
- Berkman, N. D. , Santaguida, P. L. , Viswanathan, M. , & Morton, S. C. (2014). AHRQ methods for effective health care. In The empirical evidence of bias in trials measuring treatment differences. Agency for Healthcare Research and Quality (US). [PubMed] [Google Scholar]
- Bolland, M. J. , Gamble, G. D. , Avenell, A. , Grey, A. , & Lumley, T. (2019). Baseline P value distributions in randomized trials were uniform for continuous but not categorical variables. Journal of Clinical Epidemiology, 112, 67–76. 10.1016/j.jclinepi.2019.05.006 [DOI] [PubMed] [Google Scholar]
- Bottini L.P., Ricci L., Piattelli A., Perrotti V., Iezzi G. (2012). RETRACTED: Bucco‐Lingual Crestal Bone Changes Around Implants Immediately Placed in Fresh Extraction Sockets in Association or not With Porcine Bone: A Non‐Blinded Randomized Controlled Trial in Humans. Journal of Periodontology, 88(12), 1374–1374. 10.1902/jop.2017.1712002 [DOI] [PubMed] [Google Scholar]
- Buser, D. A. , & Tonetti, M. (1997). Clinical trials on implants in regenerated bone. Annals of Periodontology, 2(1), 329–342. 10.1902/annals.1997.2.1.329 [DOI] [PubMed] [Google Scholar]
- Buyse, M. , George, S. L. , Evans, S. , Geller, N. L. , Ranstam, J. , Scherrer, B. , Lesaffre, E. , Murray, G. , Edler, L. , Hutton, J. , Colton, T. , Lachenbruch, P. , & Verma, B. L. (1999). The role of biostatistics in the prevention, detection and treatment of fraud in clinical trials. Statistics in Medicine, 18(24), 3435–3451. [DOI] [PubMed] [Google Scholar]
- Carlisle, J. B. (2017). Data fabrication and other reasons for non‐random sampling in 5087 randomised, controlled trials in anaesthetic and general medical journals. Anaesthesia, 72(8), 944–952. 10.1111/anae.13938 [DOI] [PubMed] [Google Scholar]
- Carlisle, J. B. , & Loadsman, J. A. (2017). Evidence for non‐random sampling in randomised, controlled trials by Yuhji Saitoh. Anaesthesia, 72(1), 17–27. 10.1111/anae.13650 [DOI] [PubMed] [Google Scholar]
- Cragg, W. J. , Hurley, C. , Yorke‐Edwards, V. , & Stenning, S. P. (2021). Dynamic methods for ongoing assessment of site‐level risk in risk‐based monitoring of clinical trials: A scoping review. Clinical Trials, 18(2), 245–259. 10.1177/1740774520976561 [DOI] [PMC free article] [PubMed] [Google Scholar]
- Dos Santos, M. B. F. , Agostini, B. A. , de Moraes, R. R. , Schwendicke, F. , & Sarkis‐Onofre, R. (2019). Industry sponsorship bias in clinical trials in implant dentistry: Systematic review and meta‐regression. Journal of Clinical Periodontology, 46(4), 510–519. 10.1111/jcpe.13100 [DOI] [PubMed] [Google Scholar]
- Faggion, C. M., Jr. , Huda, F. , & Wasiak, J. (2014). Use of methodological tools for assessing the quality of studies in periodontology and implant dentistry: A systematic review. Journal of Clinical Periodontology, 41(6), 625–631. 10.1111/jcpe.12251 [DOI] [PubMed] [Google Scholar]
- Faggion, C. M., Jr. , Ware, R. S. , Bakas, N. , & Wasiak, J. (2018). An analysis of retractions of dental publications. Journal of Dentistry, 79, 19–23. 10.1016/j.jdent.2018.09.002 [DOI] [PubMed] [Google Scholar]
- Fanelli, D. (2009). How many scientists fabricate and falsify research? A systematic review and meta‐analysis of survey data. PLoS One, 4(5), e5738. 10.1371/journal.pone.0005738 [DOI] [PMC free article] [PubMed] [Google Scholar]
- Fanelli, D. , Costas, R. , & Ioannidis, J. P. (2017). Meta‐assessment of bias in science. Proceedings of the National Academy of Sciences of the United States of America, 114(14), 3714–3719. 10.1073/pnas.1618569114 [DOI] [PMC free article] [PubMed] [Google Scholar]
- George, S. L. , & Buyse, M. (2015). Data fraud in clinical trials. Clinical Investigation (London), 5(2), 161–173. 10.4155/cli.14.116 [DOI] [PMC free article] [PubMed] [Google Scholar]
- Giannobile, W. V. (2015). Improving clinical trials in dentistry. Journal of Dental Research, 94(3 Suppl), 6s–7s. 10.1177/0022034515569308 [DOI] [PMC free article] [PubMed] [Google Scholar]
- Graziani, F. , Chappuis, V. , Molina, A. , Lazarin, R. , Schmid, E. , Chen, S. , & Salvi, G. E. (2019). Effectiveness and clinical performance of early implant placement for the replacement of single teeth in anterior areas: A systematic review. Journal of Clinical Periodontology, 46, 242–256. 10.1111/jcpe.13092 [DOI] [PubMed] [Google Scholar]
- Grimes, D. A. , & Schulz, K. F. (2002). An overview of clinical research: The lay of the land. Lancet, 359(9300), 57–61. 10.1016/s0140-6736(02)07283-5 [DOI] [PubMed] [Google Scholar]
- Lang, N. P. , & Zitzmann, N. U. (2012). Clinical research in implant dentistry: Evaluation of implant‐supported restorations, aesthetic and patient‐reported outcomes. Journal of Clinical Periodontology, 39(Suppl 12), 133–138. 10.1111/j.1600-051X.2011.01842.x [DOI] [PubMed] [Google Scholar]
- Marusic, A. , Wager, E. , Utrobicic, A. , Rothstein, H. R. , & Sambunjak, D. (2016). Interventions to prevent misconduct and promote integrity in research and publication. Cochrane Database of Systematic Reviews, 4(4), Mr000038. 10.1002/14651858.MR000038.pub2 [DOI] [PMC free article] [PubMed] [Google Scholar]
- Mascha, E. J. , Vetter, T. R. , & Pittet, J. F. (2017). An appraisal of the Carlisle–Stouffer–Fisher method for assessing study data integrity and fraud. Anesthesia and Analgesia, 125(4), 1381–1385. 10.1213/ANE.0000000000002415 [DOI] [PubMed] [Google Scholar]
- Moher, D. , Liberati, A. , Tetzlaff, J. , & Altman, D. G. (2009). Preferred reporting items for systematic reviews and meta‐analyses: The PRISMA statement. BMJ, 339, b2535. 10.1136/bmj.b2535 [DOI] [PMC free article] [PubMed] [Google Scholar]
- Moll, D. , Yildirim, M. , Spiekermann, H. , & Wolfart, S. (2012). Retracted. Telescopic crown‐retained removable partial dentures on teeth and implants: an 8‐ to 9‐year prospective randomized clinical trial Clin Oral Implants Res, 23(7):895. [DOI] [PubMed] [Google Scholar]
- Pieri, F. , Nicoli Aldini, F. , Fini, M. , Marchetti, C. , & Corinaldesi, G. (2012). Retracted. Rehabilitation of the atrophic posterior maxilla using short implants or sinus augmentation with simultaneous standard‐length implant placement: a 3‐year randomized clinical trial. Clin Implant Dent Relat Res, 14(6):924. [DOI] [PubMed] [Google Scholar]
- Popelut, A. , Valet, F. , Fromentin, O. , Thomas, A. , & Bouchard, P. (2010). Relationship between sponsorship and failure rate of dental implants: A systematic approach. PLoS One, 5(4), e10274. 10.1371/journal.pone.0010274 [DOI] [PMC free article] [PubMed] [Google Scholar]
- Rapani, A. , Lombardi, T. , Berton, F. , Del Lupo, V. , Di Lenarda, R. , & Stacchi, C. (2020). Retracted publications and their citation in dental literature: A systematic review. Clinical and Experimental Dental Research, 6(4), 383–390. 10.1002/cre2.292 [DOI] [PMC free article] [PubMed] [Google Scholar]
- Sanz, M. , & Chapple, I. L. (2012). Clinical research on peri‐implant diseases: Consensus report of Working Group 4. Journal of Clinical Periodontology, 39(Suppl 12), 202–206. 10.1111/j.1600-051X.2011.01837.x [DOI] [PubMed] [Google Scholar]
- Sanz, M. , Herrera, D. , Kebschull, M. , Chapple, I. L. C. , Jepsen, S. , Berglundh, T. , Sculean, A. , Tonetti, M. S. , & EFP Workshop Participants and Methodological Consultants . (2020). Treatment of Stage I–III periodontitis—The EFP S3 level clinical practice guideline. Journal of Clinical Periodontology, 47(Suppl 22), 4–60. [DOI] [PMC free article] [PubMed] [Google Scholar]
- Scott, P. D. , & Runner, S. (1997). The Food and Drug Administration and the regulation of clinical trials for endosseous implants. Annals of Periodontology, 2(1), 284–290. 10.1902/annals.1997.2.1.284 [DOI] [PubMed] [Google Scholar]
- Simes, R. J. (1986). Publication bias: The case for an international registry of clinical trials. Journal of Clinical Oncology, 4(10), 1529–1541. 10.1200/jco.1986.4.10.1529 [DOI] [PubMed] [Google Scholar]
- Smaïl‐Faugeron, V. , Fron‐Chabouis, H. , & Durieux, P. (2015). Clinical trial registration in oral health journals. Journal of Dental Research, 94(3 Suppl), 8s–13s. 10.1177/0022034514552492 [DOI] [PMC free article] [PubMed] [Google Scholar]
- Stang, A. , & Baethge, C. (2018). Imbalance p values for baseline covariates in randomized controlled trials: A last resort for the use of p values? A pro and contra debate. Clinical Epidemiology, 10, 531–535. 10.2147/clep.S161508 [DOI] [PMC free article] [PubMed] [Google Scholar]
- Sterne, J. A. C. , Savović, J. , Page, M. J. , Elbers, R. G. , Blencowe, N. S. , Boutron, I. , Cates, C. J. , Cheng, H.‐Y. , Corbett, M. S. , Eldridge, S. M. , Emberson, J. R. , Hernán, M. A. , Hopewell, S. , Hróbjartsson, A. , Junqueira, D. R. , Jüni, P. , Kirkham, J. J. , Lasserson, T. , Li, T. , … Higgins, J. P. T. (2019). RoB 2: A revised tool for assessing risk of bias in randomised trials. BMJ, 366, l4898. 10.1136/bmj.l4898 [DOI] [PubMed] [Google Scholar]
- Tonetti, M. , & Palmer, R. (2012). Clinical research in implant dentistry: Study design, reporting and outcome measurements: Consensus report of Working Group 2 of the VIII European Workshop on Periodontology. Journal of Clinical Periodontology, 39(Suppl 12), 73–80. 10.1111/j.1600-051X.2011.01843.x [DOI] [PubMed] [Google Scholar]
- Tonetti, M. S. (2019). Leadership in publishing. Journal of Dentistry, 87, 28–31. 10.1016/j.jdent.2019.05.006 [DOI] [PubMed] [Google Scholar]
- Tonetti, M. S. , Jung, R. E. , Avila‐Ortiz, G. , Blanco, J. , Cosyn, J. , Fickl, S. , Figuero, E. , Goldstein, M. , Graziani, F. , Madianos, P. , Molina, A. , Nart, J. , Salvi, G. E. , Sanz‐Martin, I. , Thoma, D. , Assche, N. V. , & Vignoletti, F. (2019). Management of the extraction socket and timing of implant placement: Consensus report and clinical recommendations of Group 3 of the XV European Workshop in Periodontology. Journal of Clinical Periodontology, 46(Suppl 21), 183–194. 10.1111/jcpe.13131 [DOI] [PubMed] [Google Scholar]
- van den Bor, R. M. , Vaessen, P. W. J. , Oosterman, B. J. , Zuithoff, N. P. A. , Grobbee, D. E. , & Roes, K. C. B. (2017). A computationally simple central monitoring procedure, effectively applied to empirical trial data with known fraud. Journal of Clinical Epidemiology, 87, 59–69. 10.1016/j.jclinepi.2017.03.018 [DOI] [PubMed] [Google Scholar]
- Weber, H. P. , Fiorellini, J. P. , & Jeffcoat, M. C. (1997). Clinical trials on placement of implants in existing bone. Annals of Periodontology, 2(1), 315–328. 10.1902/annals.1997.2.1.315 [DOI] [PubMed] [Google Scholar]
Associated Data
This section collects any data citations, data availability statements, or supplementary materials included in this article.
Supplementary Materials
Appendix S1: Supporting information
Data Availability Statement
Authors select to not share data.