

Abstract
In tumors, metabolic demand of cancer cells often outpaces oxygen supply, resulting in a gradient of tumor hypoxia accompanied with heterogeneous resistance to cancer therapeutics. Models recapitulating tumor hypoxia are therefore essential for developing more effective cancer therapeutics. Existing in vitro models often fail to capture the spatial heterogeneity of tumor hypoxia or involve high-cost, complex fabrication/handling techniques. Here, we designed a highly tunable microfluidic device that induce hypoxia through natural cell metabolism and oxygen diffusion barriers. We adopted a cleanroom-free, micromilling-replica-molding strategy and a microfluidic liquid-pinning approach to streamline the fabrication and tumor model establishment. We also implemented a thin-film oxygen diffusion barrier design, which was optimized through COMSOL simulation, to support both 2-D and 3-D hypoxic models. We demonstrated that liquid-pinning enables an easy, injection-based micropatterning of cancer cells of wide range of parameters, showing the high tunability of our design. Human breast cancer and prostate cancer cells were seeded and stained after 24 hours of 2-D and 3-D culture to validate the natural induction of hypoxia. We further demonstrated the feasibility of the parallel microfluidic channel design to evaluate dual therapeutic conditions in the same device. Overall, our new microfluidic tumor model serves as a user-friendly, cost-effective, and highly scalable platform that provides spatiotemporal analysis of the hypoxic tumor microenvironments suitable for high-content biological studies and therapeutic discoveries.
Keywords: Hypoxia, cleanroom-free, microfluidics, micromilling, breast cancer, prostate cancer
Graphical Abstract
INTRODUCTION
During cancer progression, the metabolic consumption rate of the highly proliferative tumor cells often outpaces the available oxygen supply delivered through the irregularly formed tumor vasculature resulting in a heterogeneous landscape of tumor regions with insufficient oxygen supply, i.e., hypoxia.1–3 Cancer cells may take on region-specific adaptations depending on the severity of hypoxia within those regions,4, 5 which further contributes to the plasticity and heterogeneity of cancer cells within the tumor1, 6–8 and results in different levels of sensitivity and resistance to cancer therapeutics.9–15 A faithful recapitulation of tumor hypoxia that allows for accurate assessments of phenotypic adaptation, heterogeneity, and therapeutic responses is therefore essential for the development of more effective cancer therapeutics.
Numerous in vivo and in vitro tumor models have been established to recapitulate tumor hypoxia and assess tumor phenotypes and treatment responses. In vivo models provide naturally formed or induced hypoxia and capture the complexity of the tumor progression in a living system.16–19 However, in vivo models face high sample-to-sample variability, high cost, and low-throughput, which makes them unfavorable for the early-stage preliminary screening of new cancer therapies.20–22 Instead, high-throughput in vitro hypoxic platforms are more suitable for the early-stage screening applications. Significant progress has been made to establish in vitro hypoxic models that mimics the in vivo tumor hypoxia. Micro-engineering and microfluidic techniques have been at the frontline of this progress.23–25 Compared to the conventional methods of hypoxia induction, such as hypoxia chambers26 or chemical methods27 that fail to capture the spatial heterogeneity of hypoxia in a tumor, microengineered platforms can provide control over a wide range of oxygen levels with different spatiotemporal variations.28, 29 Additionally, unlike tumor spheroid models, microengineered platforms support not only 3-D cell culture with extracellular matrix (ECM) network resembling the tumor microenvironment,30–32 but also high-content analysis with live-cell tracking and spatiotemporally resolved single-cell analysis.33, 34 Overall, these platforms supplement the in vivo hypoxia tumor models by providing a high level of spatiotemporal control, microscopic resolution, and reproducibility that are difficult to achieve in vivo. However, the actual adoptability and the scalability of these existing micro-engineered platforms remains in question.
The fabrication of these existing platforms most commonly relies on photolithography, which requires extensive cleanroom training and costly equipment that are not readily available, especially in a wet lab-oriented facility. Furthermore, these platforms are often fabricated using a material with high oxygen permeability (e.g., polydimethylsiloxane or PDMS), which requires intricate gas channels and tubing that are connected to an external gas source to maintain the needed oxygen gradient.28, 29, 35–37 These add handling complexity and bulkiness to the platforms. Other existing platforms that aim to recapitulate in vivo tumor hypoxia without the use of photolithographic fabrication process and external gas source are also limited in its throughput (e.g. 3-D organoid culture systems38) as they require long and complex culture conditions and/or in their adoptability (e.g. bioprinted systems39) as they require unique equipment that were specifically created to enable its own fabrication workflow. Overall, the limitations in the fabrication methods, material, handling, and active maintenance prevent the existing microengineered platforms from being widely utilized in settings beyond the site of fabrication.
To address these limitations, we have previously introduced micromilling-based hypoxia microdevices that naturally induce hypoxia in 2-D and 3-D tumor models, while eliminating the need for photolithography and external gas control.40–42 These microdevices have a “cap-and-base” design composed of cancer cells cultured between two oxygen diffusion barriers, which enables high-content imaging and spatially resolved analyses of cancer cell responses to hypoxic gradients, anticancer drugs, and cell-based therapy. However, the “cap-and-base” design adds an additional handling step for the user, where the cap must be assembled to the base during cell culture and thus serves as a potential source of error in the tumor model fabrication. Additionally, while a microfluidic channel was introduced in the 3-D microdevices,41, 42 the single-channel design limits its ability and throughput in assessing combinatory therapies or comparing multiple treatment conditions in the same model in a highly controlled manner.
In this paper, we introduce our next-generation, cleanroom-free microfluidic device capable of producing both 2-D and 3-D hypoxic tumor models. We streamlined the fabrication process and improved the throughput of our hypoxia model by replacing micromilled cap with a PC film, separating device assembly from cell culture, and implementing liquid pinning for easy, injection-based, highly tunable, micropatterning of cancer cells. We optimized the device design parameters through COMSOL simulations to achieve a unified design that induces hypoxia in cells cultured in both 2-D and 3-D. We further utilize a dual channel design for an enhanced, multidimensional evaluation of drug responses. Our updated platform thus serves as a user-friendly, cost-effective, and highly scalable platform that provides spatiotemporal analysis of the hypoxic tumor microenvironments suitable for high-content biological studies and therapeutic discoveries.
MATERIALS AND METHODS
Cell Culture
LNCaP human prostate cancer cells were obtained from American Type Culture Collection (ATCC, Manassas, VA, USA) and maintained in RPMI 1640 medium (Thermo Fisher, Waltham, MA, USA) supplemented with 10% fetal bovine serum (FBS; Sigma-Aldrich, St. Louis, MO, USA), 100 U mL−1 penicillin and 100 μg mL−1 streptomycin (1% P/S, Thermo Fisher, Waltham, MA, USA). MCF-7 human breast cancer cells were obtained from ATCC and maintained in high glucose Dulbecco’s Minimum Essential Medium (DMEM, Thermo Fisher, Waltham, MA, USA) supplemented with 10% FBS and 1% P/S. Cell lines were cultured according to the manufacturer’s protocol and were grown until 70% confluence before device seeding.
Metabolic Assay
Oxygen consumption rate (OCR) of MCF-7 and LNCaP cancer cells were measured using the Seahorse XF Cell Mito Stress Test (Agilent, Santa Clara, CA, USA). Prior to the assay, 10,000 cells/well were plated in a Seahorse 96-well plate and grown overnight in a cell culture incubator at 37 °C and 5% CO2. The assay was performed using a Seahorse XFe96 Analyzer (Agilent, Santa Clara, CA, USA) according to the manufacturer’s protocol. Assay media was XF DMEM supplemented with glucose (25 mM), pyruvate (1 mM), and L-Glutamine (2 mM). Cellular OCR was monitored in basal condition and after sequential loading with oligomycin (1.5 μM), FCCP (1 μM), and rotenone & antimycin A (0.5 μM), respectively (Supplementary Fig. S1).
COMSOL Multiphysics Modeling of Oxygen and Tirapazamine Diffusion
Oxygen gradients established within the microdevice were simulated with COMSOL Multiphysics® software (COMSOL, Stockholm, Sweden). The bottom surface of the microdevice (glass slide) was assumed impermeable to oxygen, while the outer polydimethylsiloxane (PDMS) surface of the device in direct contact with the atmosphere had a fixed concentration of oxygen corresponding to normoxic levels (0.2 mol m−3). The diffusion coefficients of oxygen through PDMS, polycarbonate (PC) film, and media were 3.25 × 10⁻⁹ m2 s−1, 2.0 × 10⁻¹¹ m2 s−1, and 3 × 10⁻⁹ m2 s−1, respectively.43–45 Cancer cells were modeled as a uniform thin layer on the glass slide under the central pillar for the 2-D tumor models, homogeneously distributed in ECM for the 3-D models.41 Since cancer cells are assumed to be homogenously distributed within the ECM, we have modeled the cell-laden ECM as a bulk that consumes oxygen at volumetric rates. Cellular OCR was assumed to follow the Michaelis-Menten kinetics:
where Rmax was set as the maximum OCR of MCF-7 cells (0.194 mol s−1 m−3) and LNCaP cells (0.13 mol s−1 m−3). These values were derived from Seahorse XF Cell Mito Stress Test measurements (Agilent, Santa Clara, CA, USA; Supplementary Fig. S1). We have taken the measured OCR of each cell line and calculated the maximal respiration rate following the manufacturer’s instructions. The calculated maximal respiration rate of each cell line was normalized by the total cell number and adjusted for their average cell volume (2-D) or cell density (3-D) to represent the Rmax of the Michaelis-Menten kinetics.46, 47 is the Michaelis-Menten constant corresponding to the oxygen concentration where consumption drops to half maximum. Necrosis is assumed to occur when the oxygen concentration falls below Ccr (critical concentration), and δ is the step-down function (flc1hs in COMSOL Multiphysics®) for the terminated oxygen consumption due to necrosis (C < Ccr).
Tirapazamine (TPZ) diffusion in the microdevice was also simulated with COMSOL. Boundary conditions were set so that the PDMS, PC, and glass surfaces in the device were all impermeable to TPZ diffusion. To examine the TPZ gradient across the tumor section, one of the two PDMS channels had an initial concentration of 0.025 mol m−3 and the other channel and tumor section had an initial TPZ concentration of 0 mol m−3. The diffusion coefficients of TPZ were assumed 9.58 × 10⁻¹⁰ m2 s−1 in the media and 6.2 × 10⁻¹¹ m2 s−1 in the Gelatin metacrylate (GelMA) bulk.48, 49 TPZ consumption/metabolism by the cancer cells was not considered for this diffusion simulation. Geometries of the microdevice were defined with physics-controlled mesh with an extremely fine element size (i.e., the spatial resolution of the simulation) in COMSOL.
Design, Fabrication, and Assembly of Microdevices
The master molds for the microdevices were designed in Autodesk Fusion 360 (Autodesk Inc., San Rafael, CA, USA) and milled in a PC block (Bantam Tools, Peekskill, NY, USA) using a desktop computer numerical control (CNC) milling machine (Nomad 883 Pro, Carbide 3D, Torrance, CA, USA). The PC mold of the hypoxia microdevice was designed to account for the thickness of the PC film (McMaster-Carr, Elmhurst, IL, USA) to achieve equal thickness of the tumor section in the normoxia and hypoxia microdevices. The accuracy and precision of the CNC machine along the Z-axis (thickness) was assessed. Briefly, 1000 μm (W) × 1000 μm (L) square prism protrusions with varying heights (50, 100, 250, 1000 μm) were milled in PC. Sylgard 184 (Dow Inc., Midland, MI, USA) PDMS was mixed at a ratio of 10:1 (base : curing agent) and cured over the milled surface at 65 °C overnight. The cured PDMS was peeled and cut to expose the cross-section, and then imaged on a Nikon inverted microscope to measure the height of the negative patterns. All the milled PC master molds were vapor polished with methylene chloride inside a fume hood to facilitate PDMS molding and plasma bonding of the replicated PDMS devices on glass slides.
To fabricate the normoxia and hypoxia microdevices, PDMS was cured from the PC master mold and punched with injection ports using disposable biopsy punches (Miltex®, Integra, Princeton, NJ,USA). For the hypoxia microdevices, PC sheets with 0.005” (~125 μm) and 0.01” (~250 μm) thicknesses (McMaster-Carr, Elmhurst, IL, USA) were cut into circles using a desktop craft cutter (Silhouette Cameo 2, Silhouette America, Lindon, Utah, USA). The circular PC films were inked with a thin layer of uncured PDMS formed by spinning a drop of uncured PDMS on a glass slide at 4000 rpm for 2 min. The PC films were then attached to the center of the PDMS microdevice and fixed by baking at 65 °C overnight. Both normoxia and hypoxia devices were plasma treated (Model PDC-001-HP, Harrick Plasma, Ithaca, NY, USA) for 60 s and assembled onto a clean glass slide for cell culture.
Surface Treatment Sweep for Liquid-pinning
For the plasma treatment sweep, hypoxia (PC-PDMS) and normoxia (PDMS only) microdevices were plasma treated for 0, 60, and 300 s before assembly onto a clean glass slide. For the surface coating sweep, Phosphate Buffered Saline (PBS; VWR, Radnor, PA, USA), 0.05% (w/v in sterile deionized water) Poly-D-Lysine (PDL; Advanced BioMatrix, Carlsbad, CA, USA), and human plasma fibronectin (1, 10, 20 ug/ml in PBS) (MilliporeSigma, Burlington, MA, USA) solutions were injected into the middle chamber of the assembled microdevices and incubated for 30 min at room temperature. The solutions were then gently aspirated, and the middle chamber was washed twice with sterile deionized water. All treated samples were injected with diluted food dye solution to visualize changes in liquid-pinning in the device.
2-D and 3-D Microfluidic Cell Culture
Prior to cell culture, the devices were sterilized by ultraviolet (UV) light for 30 min. After sterilization, 0.05% (w/v in sterile DI water) PDL was injected into the middle chamber through the cell injection port and incubated for 30 min at room temperature. The devices were then rinsed twice with sterile DI water and filled with PBS, which was aspirated right before cell seeding.
For the validation of the impact of PC thickness on hypoxia profiles, MCF-7 cells were 2-D cultured in hypoxia microdevices with different PC film thicknesses (125 μm and 250 μm). LNCaP cells were 2-D cultured in hypoxia microdevice with 250 μm PC film thickness. For all 2-D culture conditions, cells were injected into the middle chamber through the cell injection port at 60,000 cells in RPMI 1640 medium and allowed to attach at 37 °C and 5% CO2 for 2 hours. After confirming cell attachment, medium was introduced to the side channels for continued incubation.
For the 3-D tumor model, LNCaP cells were cultured in a hypoxia microdevice fabricated with 0.01” PC film thickness. LNCaP cells were resuspended in GelMA and 10X DMEM (Gibco, Waltham, MA, USA) to achieve a density of 10 million cells mL−1 in 10% GelMA and 1X DMEM,41 and injected into the middle chamber. The device was then exposed to filtered UV light from X-Cite 120PC Q® (wavelength: 375 ± 14nm, power: 6.0 ± 0.26 mW cm−2; Excelitas Technologies Corp., Waltham, MA, USA) for 120 s to crosslink. After exposure, medium was introduced to the side channels for continued incubation.
Confirmation of Hypoxic Gradient in 2-D Tumor Model
In the 2-D normoxia or hypoxia tumor models with MCF-7 cells or LNCaP cells, medium was removed from the side channels of the device after 20 hours of culture, and the devices were flushed with sterile PBS. The side channels were then aspirated and injected with BioTracker 520 Green Hypoxia Dye (Sigma-Aldrich, St. Louis, MO, USA) at 5 μM in cell culture medium, and incubated at 37 °C and 5% CO2 for 1 hour. The stain solution was subsequently removed from the side channels, and the devices were rinsed with sterile PBS before the re-introduction of fresh culture medium. After 3 hours of additional incubation, the live-stained samples were imaged at 10X magnification using a Nikon Ti-E inverted fluorescent microscope. The samples were subsequently used for Glut-1 immunostaining and DAPI nuclear counterstain (see 2.8).
Glut-1 Immunostaining
We used rabbit monoclonal anti-Glucose Transporter 1 (Glut-1) (ab115730, 1:200) (Abcam, Cambridge, MA, USA) as the primary antibody and Alexa Fluor 647-conjugated donkey anti-rabbit antibody (1:500) (Invitrogen, Waltham, MA, USA) as the secondary antibody to immunostain the samples. Briefly, the microdevices for the 2-D and 3-D tumor models were disassembled after 24 hours of culture. For the 2-D model, samples were fixed in 4% paraformaldehyde (PFA) for 15 min, permeabilized in 0.1% Triton X-100 (Fisher Scientific) for 15 min, and blocked with 4% bovine serum albumin (BSA; HyClone, Logan, UT, USA) for 1 hour. Samples were then incubated in primary antibody for 1 hour, rinsed 3 times in PBS, and incubated with secondary antibody for 1 hour at room temperature. For the 3-D model, samples were fixed in 4% PFA for 30 min, permeabilized with 0.1% Triton X-100 for 30 min and blocked with 4% BSA for 2 hours. Samples were then incubated with primary antibody overnight at 4 °C, rinsed 3x in PBS, and incubated with secondary antibody for 2 hours at room temperature. All immunostained samples were mounted with FluoroGel II containing DAPI (Electron Microscopy Sciences, Hatfield, PA, USA). Images were acquired at 10X magnification on a Nikon Ti-E inverted fluorescent microscope.
Cytotoxicity Assay under Tirapazamine Treatment
LNCaP cells were cultured in the 2-D or 3-D tumor model in normoxia or hypoxia microdevices for 24 hours. The regular medium in the side channels was then replaced by medium containing 25 μM tirapazamine (TPZ; Sigma Aldrich) before being incubated for another 24 hours. For the cytotoxicity assay, the devices were disassembled and stained with 1 μM calcein-AM (Sigma-Aldrich, St. Louis, MO, USA) and 1 μM propidium iodide (PI) (Thermo Fisher, Waltham, MA, USA) for 30 min at room temperature.
Image Analysis
Images were analyzed with the ImageJ software (NIH, Bethesda, MD, USA). Fluorescent intensity of the BioTracker dye and Glut-1 immunostaining was binned radially in concentric circles from the center of the micropattern. The intensities of BioTracker staining were normalized by the signal at the edge of the micropattern. The Glut-1 intensities were normalized by dividing the total fluorescent intensity by the number of cells counted in DAPI channel in each spatial region. In cytotoxicity assay, the numbers of calcein positive (live) cells and PI positive (dead) cells were counted in the same concentric regions. For the 2-D tumor model, areal density of living cells was used as an indication of cancer cell survival as many of the dead cells were washed away during the live/dead staining. For the 3-D tumor model, cell viability was quantified as the fraction of live cells (with positive calcein signal) in the total live and dead cells. All data are plotted using Prism 9 (GraphPad Software Inc. San Diego, CA, USA).
Statistical Analysis
All statistical analyses were performed using Prism 9 (GraphPad Software Inc. San Diego, CA, USA). All data were presented in mean ± S.D. Linear regression was used for measured vs. target heights of the milled PC protrusions. Two-way analysis of variance (ANOVA) followed by Šídák’s multiple comparisons test (assuming independence between comparisons) was performed for Biotracker dye fluorescence and Glut-1 expression in 2-D and 3-D LNCaP tumor models. In all statistical analysis, p < 0.05 was considered significant.
RESULTS
A Microfluidic Hybrid Model is Designed to Recapitulate Tumor Hypoxia in 2-D and 3-D
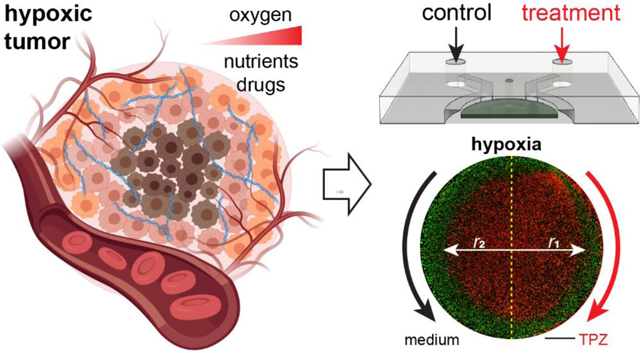
In vivo, the growth of cancer cells in solid tumors often exceeds the limit of oxygen supply from the nearest vasculature, resulting in gradients of oxygenation or hypoxia in tumors (Fig. 1A). The phenomenon is mainly caused by a combined effect of oxygen consumption (reaction) and diffusion in the tumor. While this is often simulated mathematically by analyzing a tumor section between two insulated boundaries without oxygen flux, we can experimentally recapitulate it in vitro by culturing a layer of cancer cells between two oxygen diffusion barriers (referred to as the “tumor section”), both in 2-D monolayers and 3-D ECM-embedded formats40–42 (Fig. 1B). Here, we designed a new generation of hypoxia models by integrating a polycarbonate (PC) film directly in a microfluidic device as the oxygen barrier (Fig. 1C). The design featured a central hypoxic tumor section lined with the PC film at the top and a glass substrate at the bottom (not shown) (Fig. 1C,D). The tumor section was surrounded by two microfluidic channels (1mm width × 800μm height) for the delivery of oxygen, nutrients, and therapeutic drugs and/or immune cells (Fig. 1D,G). Cancer cells were loaded through cell injection ports to create 2-D and 3-D tumor sections by a liquid pinning process, where a drop of cells with desired number (in medium, for 2-D) or density (in ECM gel before curing) were injected and held underneath the central pillar by the surface tension at the liquid-air interface50–52 (Fig. 1E,F). The device geometry and liquid pinning created a micropattern of cancer cell layer/bulk with desired shape, area and/or volume as a tumor model. The whole design and assembly were streamlined to improve the throughput and handling of the device for downstream cell culture studies and imaging-based phenotypic analyses.
Figure 1.
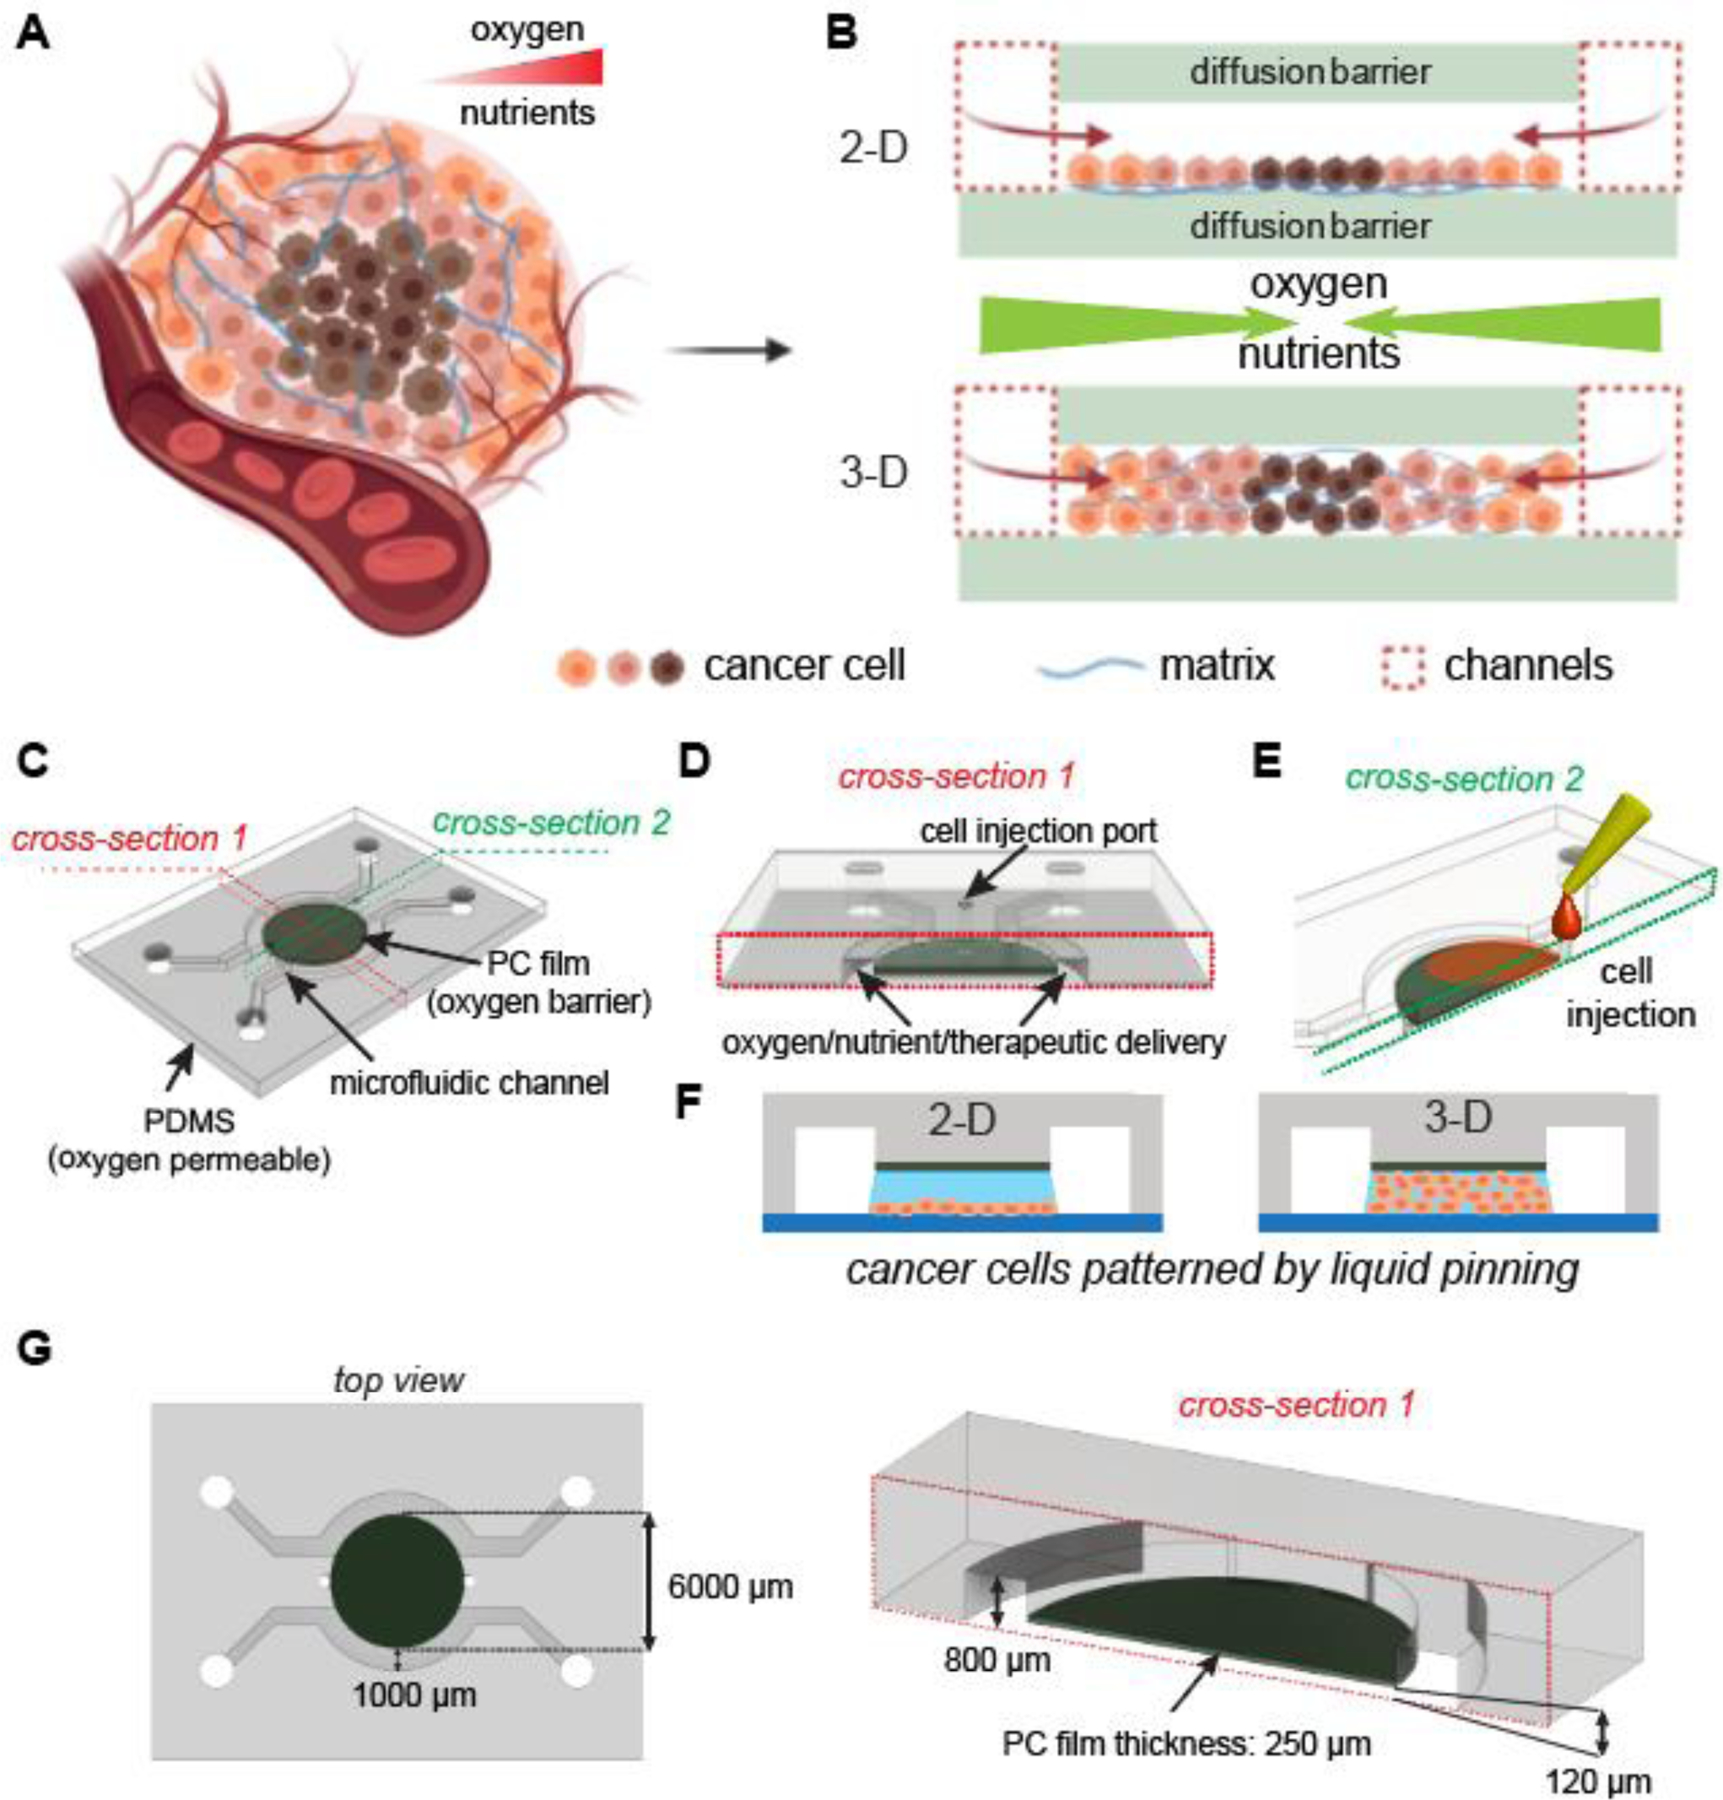
Integrated microfluidic design of 2-D and 3-D tumor hypoxia models. (A) Tumor hypoxia in vivo (Created with BioRender.com). (B) Recapitulating tumor hypoxia in vitro in 2-D and 3-D models with diffusion barriers. (C) Design of hypoxia microdevice with a polycarbonate (PC) film as the top oxygen diffusion barrier. (D) Cross-section (red dashed lines) of tumor region and delivery/treatment channels. (E) Cross-section (green dashed lines) of tumor region and cell injection ports. (F) Liquid pinning for forming 2-D and 3-D tumor sections in the microdevice. (G) Dimensions of the microdevice most frequently used in this study.
Micromilling and Liquid-Pinning Cover a Wide Range of Parameters in Tumor Section
We next examined whether the micromilling and liquid pinning approaches can achieve the desired sizes of tumor sections40–42 in the new microfluidic hypoxic tumor model design. We chose the computer numerical control (CNC) micromilling to fabricate the microfluidic mold for its lower cost and shorter turnaround compared to the cleanroom-based photolithographic approaches53, 54. We milled the microfluidic mold in bulk PC and vapor-polished it for casting PDMS microfluidic devices through replica molding54, 55 (Fig. 2A). To form the oxygen diffusion barrier, we utlized a craft cutter to cut PC films in circular shapes and bond them to the center of the device through a spun PDMS layer and curing (Fig. 2A), which did not significantly alter the diffusion gap size (Supplementary Fig. S2). We designed two parallel sets of microfluidic devices, hypoxia and normoxia devices, as paired control for the oxygen conditions. The two only differ in the presence of the PC film for generating hypoxia (Fig. 2B). From a fabrication standpoint, it is crucial to precisely control the thickness of the protrusion in the micromilled PC master mold, so that the replica-molded middle chamber of the hypoxia device is precisely compensated for the thickness of the PC film to achieve the same height of the tumor section as in the normoxia device (Fig. 2B, right). Using milling, soft lithography, and cross-sectioning, we found that the milled PC protrusions matched the target values with a margin of error of 2~6% (at the 95% confidence interval), and a slope of linear regression at 0.9998, which indicates a 1:1 realization of the design parameters in the final devices (Fig. 2C).
Figure 2.
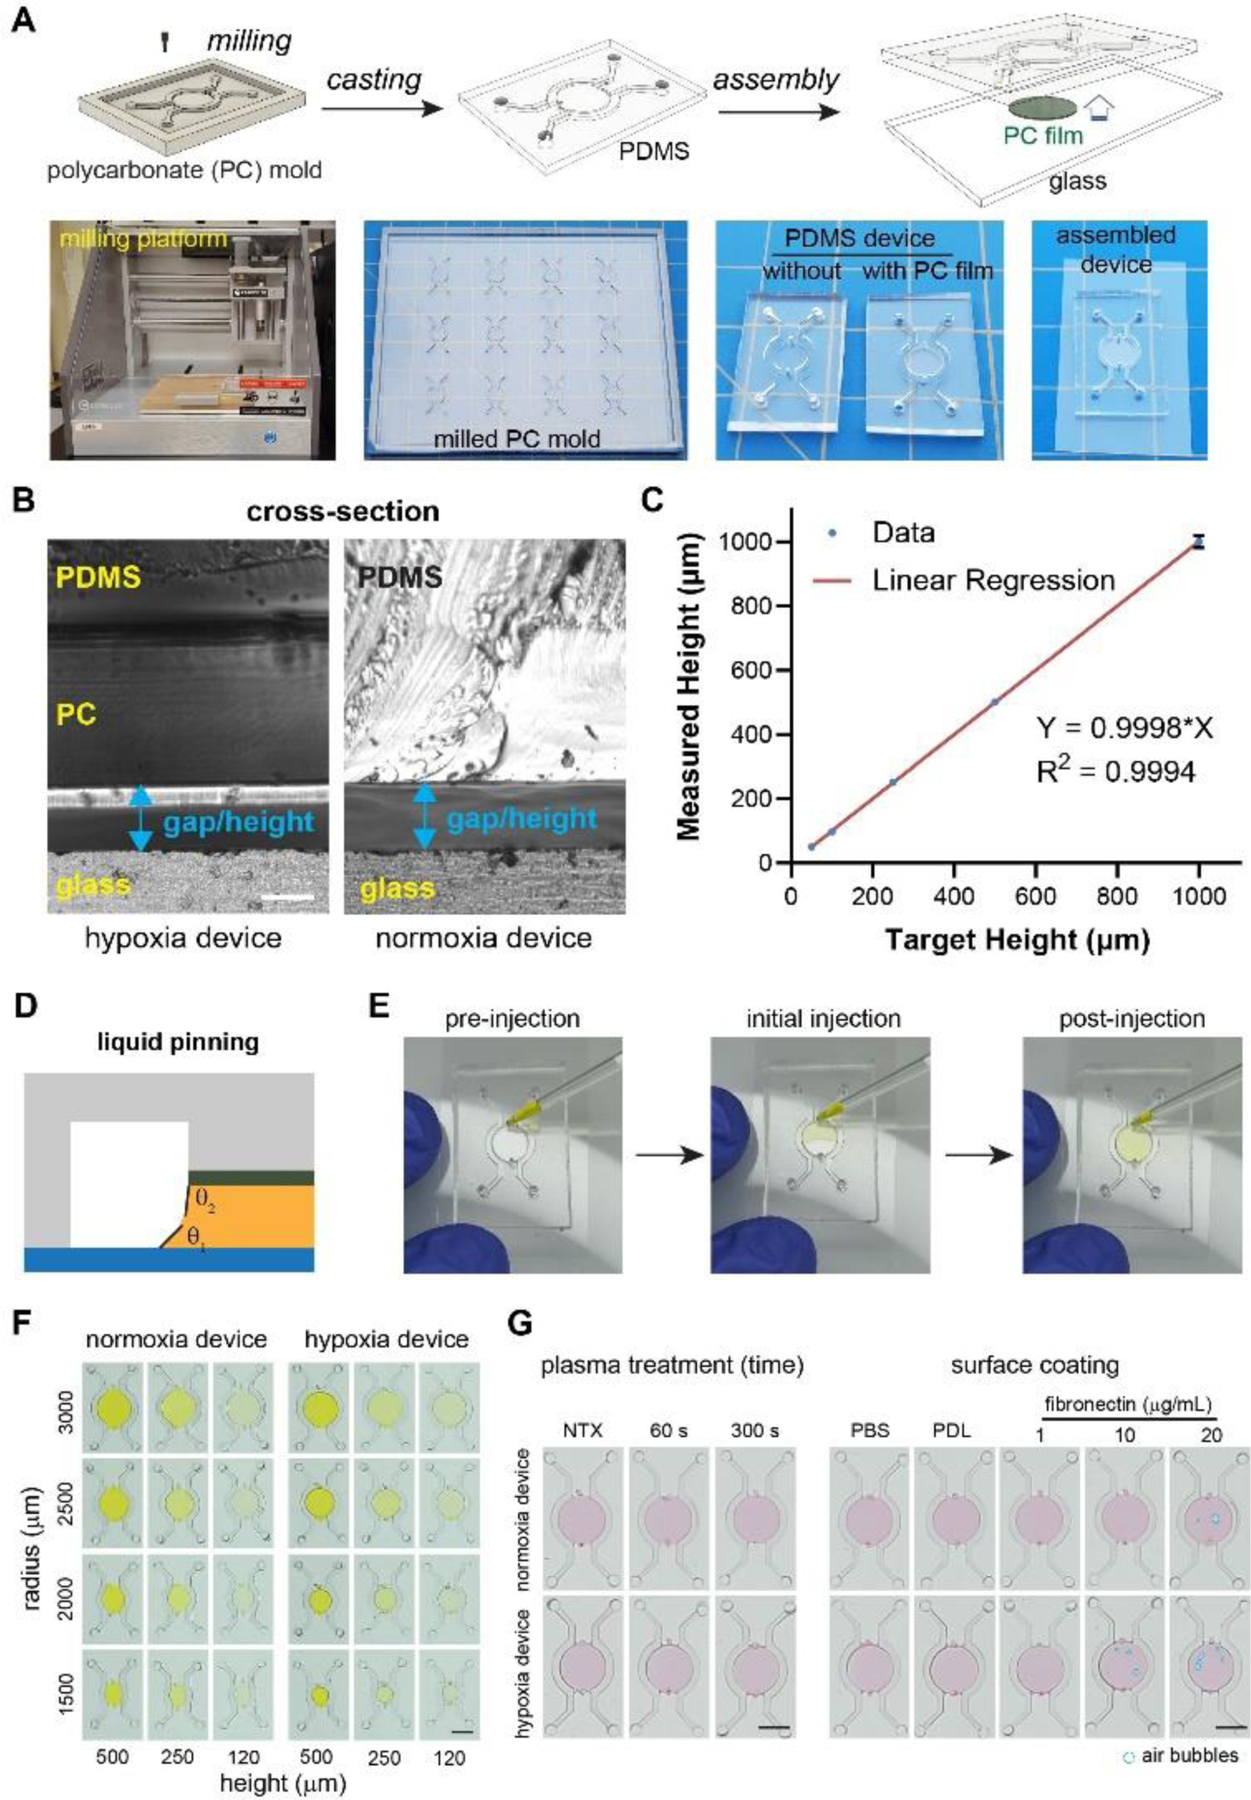
Cleanroom-free micromilling and liquid pinning approaches to create microdevices and tumor sections. (A) Illustration and images of micromilling, replica molding, and device assembly. (B) Cross-sections of hypoxia (left) and normoxia (right) devices with hypoxia device design compensated for the PC film thickness to achieve equal gap size. Scale bar: 100 μm. (C) Characterization of micromilling accuracy. (D) Liquid pinning principle. (E) Liquid pinning process. (F) Radius and gap size sweep and (G) surface treatment sweep for liquid pinning for the formation of the tumor section in microdevices (NTX: non-treated; PDL: poly-D-lysine). Scale bars: 2 mm.
Liquid pinning50–52 was chosen to create a cancer cell monolayer or 3-D tumor section in our tumor model, for its ease of operation without requiring additional structural components (such as pillars) that may interfere with oxygen diffusion. It utilized surface tension at the liquid-substrate-air interface to hold the liquid within the small crevices of the device (i.e. the diffusion gap in the current design) (Fig. 2D). The whole process involved a single injection of the liquid with desired volume through the injection port to fill the gap (Fig. 2E, Supplementary Video 1), which can then be followed by incubation for cell adhesion for the 2-D tumor models, or gel curing for the 3-D tumor models. We found that within the tested range of tumor radii (120~500 μm) and diffusion gap heights (1500~3000 μm), liquid pinning can successfully confine the liquid under the central pillar region (Fig. 2F), thus allowing for the formation of 2-D and 3-D tumor sections in the model. This also suggested that the pattern and the volume of our tumor model can be readily tuned based on our experimental need. Surface treatments such as plasma bonding and surface coating can provide additional strength in the device assembly and resistance to cell (2-D) or gel (3-D) delamination.56 We tested plasma treatments with different durations, as well as surface coating with poly-D-lysine (PDL) and fibronectin at different concentrations (Fig. 2G). We found that a 60s plasma treatment generated a tightly bonded device, while PDL coating, unlike fibronectin, allowed for bubble-free formation of the liquid region (Fig. 2G). We thus moved forward with 60s plasma treatment and PDL coating for the subsequent studies.
Oxygen Profiles are Dependent on PC Film Thickness and Geometric Parameters
A key feature of the new tumor model design is the PC film at the top of the tumor section that serves as the oxygen diffusion barrier. The diffusion coefficient of oxygen in PC (2.0 × 10⁻¹¹ m2/s)44 is ~1/165 of that in PDMS (3.25 × 10⁻⁹ m2/s)43 and 1/150 of that in 37°C water (3.0 × 10⁻⁹ m2/s).45 With such discrepancy, in our previous design, the PC oxygen diffusion barrier was assumed as an insulated boundary to oxygen diffusion, as it has similar thicknesses to the medium (in millimeters). However, in a thin PC film design, the efficacy of oxygen blockade can be compromised by a shorter diffusion distance. To test this hypothesis, we performed a COMSOL Multiphysics simulation for the oxygen flow in the 2-D hypoxia model, following the oxygen consumption characteristics of MCF-7 cells (Fig. 3A). While most oxygen entered the tumor section through the diffusion gap as designed (red and blue arrows, Fig. 3A), some oxygen directly entered the tumor section through the PC film (gray threads in the middle, Fig. 3A). At the cross-section, it was clear that the oxygen flow pattern and the level of hypoxia in the tumor section were significantly altered by the assumption of oxygen impermeability (or permeability) for the thin PC film (Fig. 3B).
Figure 3.
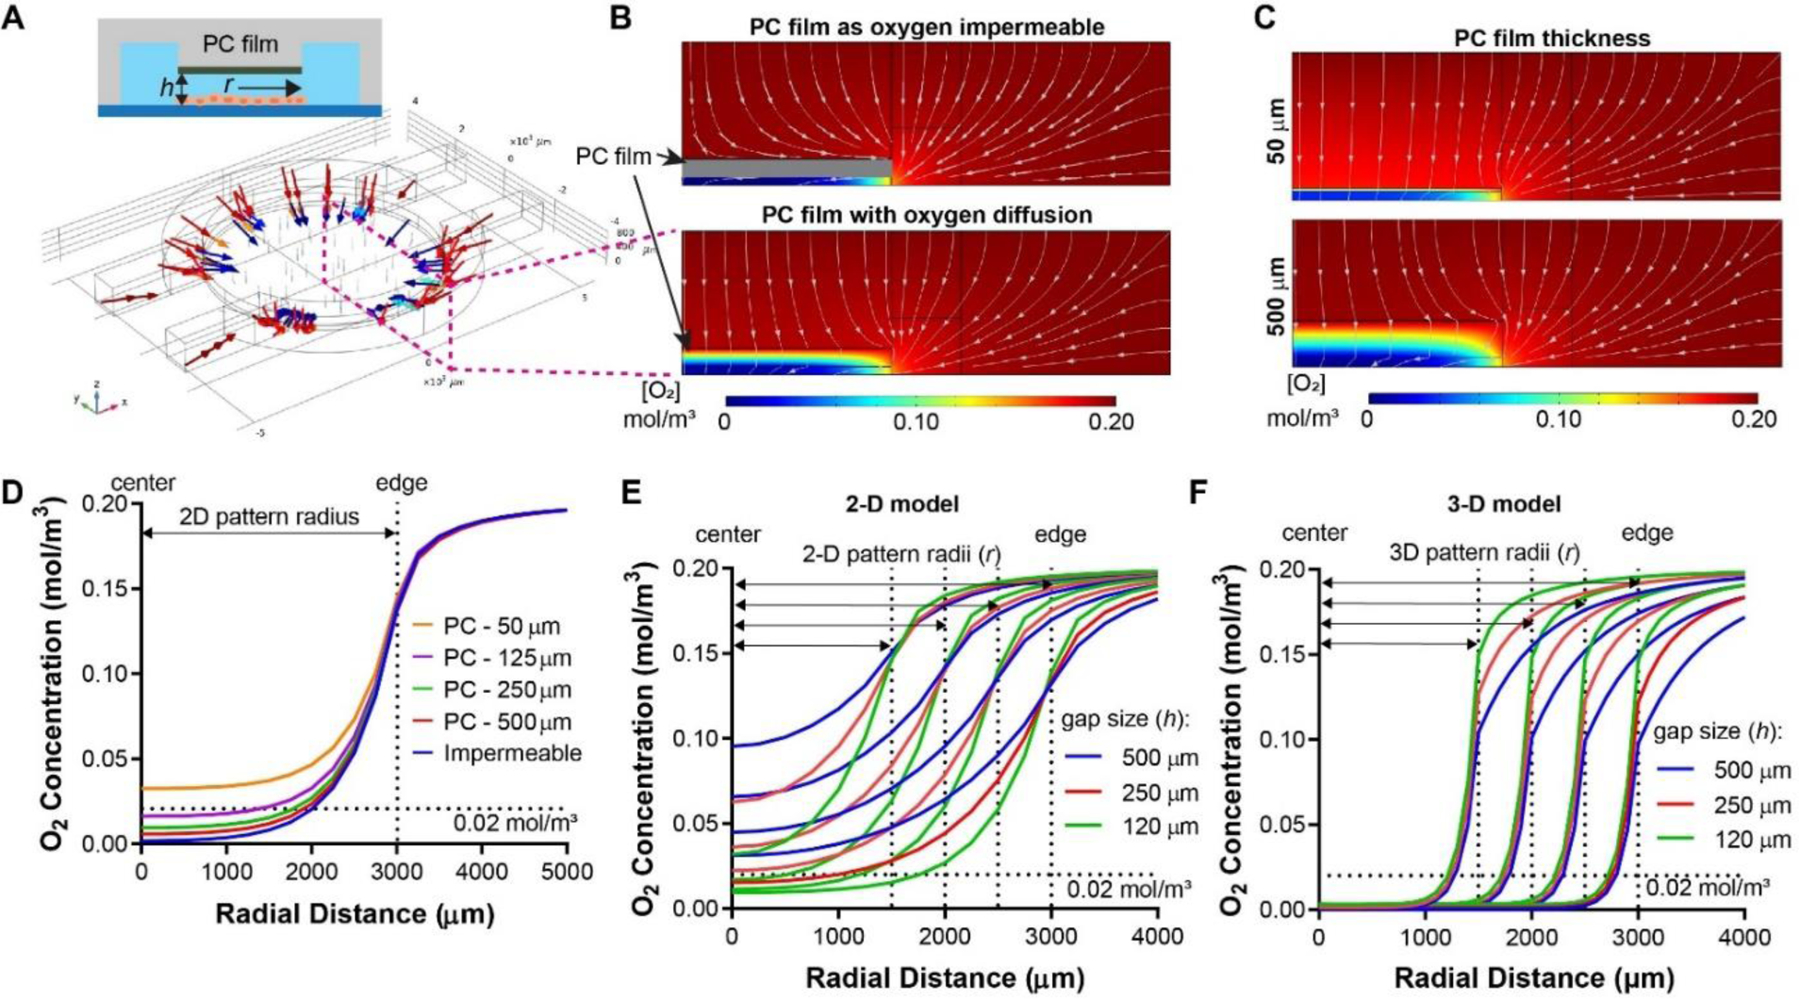
Impact of design parameters on oxygen profiles in hypoxic tumor models. (A) Paths of oxygen diffusion in a 2-D hypoxia model. (B) Oxygen diffusion path in the cross-sections assuming PC film with zero (top) or actual (bottom) oxygen diffusion coefficients. (C) Differences in oxygen profiles in the microdevices with different PC film thicknesses (50 μm vs. 500 μm). (D) Radial oxygen profile in 2-D microdevices with varying PC film thicknesses. Oxygen profiles are (E) highly dependent on radii and gap size in 2-D models, while (F) relatively insensitive to these parameters in 3-D models.
To better understand the impact of the PC film thicknesses, we performed a parameter sweep in the COMSOL simulation by varying the PC film thickness from 50 μm to 500 μm while keeping the diffusion gap on top of the cell layer constant (Fig. 3C) and compared the radial oxygen distribution along the cell layer in the 2-D models (Fig. 3D). As expected, we identified an inverse relationship between the thickness of the PC film and the degree of hypoxia in the device, with the impermeable condition achieving the lowest oxygen level. It has been found that tumors have varying oxygen levels at 0.3~4.2%, with an average of 2% in most tumors which triggers hypoxic responses in cells.4 With 2% (or 0.02 mol/m3) oxygen level as the threshold/criteria, all the simulated PC film thicknesses except 50 μm can achieve hypoxia within the model (Fig. 3D). On the other hand, while the model can achieve better hypoxia with thicker PC films, thicker PCs were more difficult to fabricate (using a craft cutter). Thus, we chose 250 μm PC films that are sufficient to generate hypoxia for our models in the subsequent cell culture studies (except for the hypoxia validation study for PC film thicknesses).
Next, we examined the spatial profiles of oxygen distribution across the tumor sections with different tumor radii (r) and heights of the diffusion gap (h) under the fixed PC film thickness (250 μm) (Fig. 3E,F), as r and h largely define the distance and rate of oxygen diffusion toward the center of tumor section (except that through the PC film). We performed a parameter sweep of h from 120, 250 to 500 μm, with r ranging from 1500 to 3000 μm at a 500 μm step for both 2-D and 3-D models and plotted the radial oxygen profile along the bottom surface of the device. Overall, the simulation predicted lower oxygen levels with larger tumor sections and narrower diffusion gaps (Fig. 3E,F). For the 2-D model, the hypoxia level was highly dependent on the r and h values (Fig. 3E). None of the gap sizes under 1500 μm radius were able to achieve the 2% threshold oxygen level. In larger tumor sections (3000 μm radius), the 250 μm gap size was barely enough to achieve the 2% hypoxia near the center of the central pillar (Fig. 3E, red curve). On the other hand, the 120 μm gap enabled large hypoxic cores in tumors at 2500 and 3000 μm radii (Fig. 3E, green curve). For the 3-D model, cancer cells are evenly embedded in ECM across the diffusion gap in the model (simulated at a volumetric density of 10 million cells/mL). In contrast to the 2-D model, the core of the 3-D model was deeply hypoxic and insensitive to the variations in r and h (Fig. 3F). There was also a steep oxygen gradient near the edge of the tumor section with all tumor sizes (Fig. 3F). The difference in oxygen levels at the top vs. the bottom of the tumor section (3000 μm radius, 120 μm gap size) was minimal within the hypoxic region (Supplementary Fig. S3). Combining the results from 2-D and 3-D models, we chose 3000 μm radius and 120 μm diffusion gap for the tumor sections in both models to streamline the device fabrication.
Thickness of PC Film Impacts Spatial Profiles of Hypoxia and Glut-1 Level in MCF-7 Model
We next created a 2-D hypoxic tumor model with MCF-7 breast cancer cells to validate the COMSOL simulation results on the importance of the PC film thickness in our design (Fig. 3A~D). We fabricated hypoxia devices with two PC film thicknesses, 125 μm and 250 μm, which resulted in two levels of hypoxia in the simulated 2-D tumor model (Fig. 3D, purple and green curves). Both PC film thicknesses were compensated in the fabrication of PC molds, so that the final diffusion gap size was fixed at 120 μm. We also prepared the normoxia devices with the same 120 μm gap size as controls. MCF-7 cells were injected into the hypoxia and normoxia microdevices through the cell injection ports and liquid pinning to form a circular monolayer (Fig. 4A). The hypoxia devices can be distinguished from the normoxia control by a brighter edge at the periphery of the tumor section due to light deflection (Fig. 4A, left). After 24 hours of culture, we stained the cancer cells with BioTracker 520 Green hypoxia dye, a fluorescent probe that detects hypoxia in living cells and has fluorescence intensity negatively correlated with oxygen level.57–59 We confirmed the induction of hypoxia indicated by the centrally elevated green fluorescence in both hypoxia devices (125 and 250 μm PC films) in stark contrast to the uniform, background-level signal in the normoxia controls (Fig. 4B). Importantly, the size of hypoxic region under the 250 μm-thick PC film was visibly larger than that under the 125 μm-thick PC film. We confirmed the difference by quantitative analysis of the radial fluorescence intensities (normalized by the edge fluorescence in the normoxia samples) (Fig. 4C). Notably, both hypoxia devices showed a plateau of BioTracker fluorescence intensities in the central region, with the 250 μm PC film having a higher intensity level (~2.5) than those under the 125 μm PC film (~1.8) (Fig. 4C), indicating a lower oxygen level under the 250 μm PC film. To confirm the phenotypic response in the hypoxic cancer cells, we further immunostained the cells against Glut-1, a glucose transporter. Glut-1 is often upregulated in cells experiencing hypoxia, which allows for increased glycolysis to compensate for the loss in the energy production through the oxygen-dependent oxidative phosphorylation.60, 61 Surprisingly, Glut-1 overexpression was only triggered in the hypoxia device with 250 μm PC film thickness (Fig. 4D,E), suggesting a more stringent requirement of the hypoxic level in inducing the Glut-1 expression in these cells. Overall, our results confirmed the importance of oxygen diffusion in PC film during the hypoxia device design, which should be assessed both in silico and in vitro.
Figure 4.
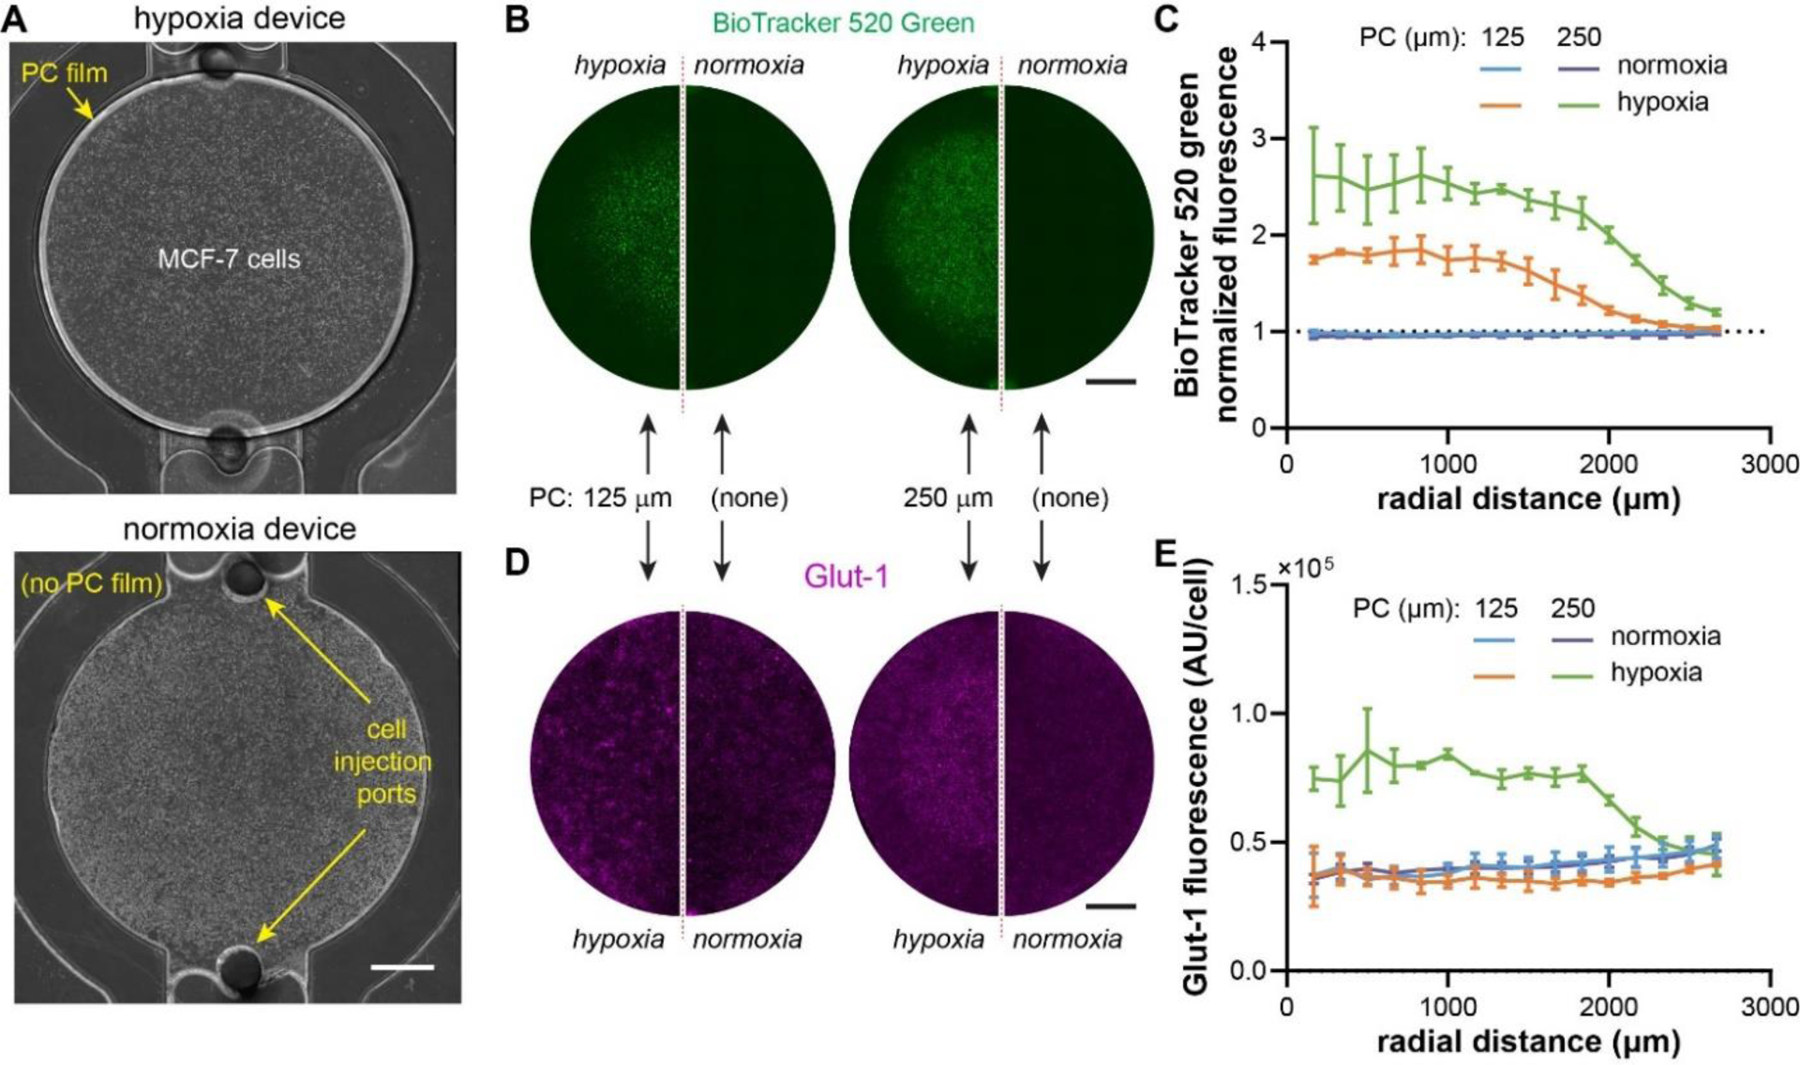
Validation of the impact of PC thicknesses on hypoxia profiles. (A) Bright field images of the hypoxia and normoxia devices injected with MCF-7 breast cancer cells. (B) Live staining of hypoxia with BioTracker 520 Green Hypoxia dye and (C) radial profile of BioTracker intensity. (D) Immunostaining of Glut-1 in MCF-7 cells and (E) quantification of radial profile of Glut-1 staining (normalized to cell density). (B), (D): normoxia: N= 3; hypoxia: N=3. Scale bars: 1mm.
Phenotypes and Drug Responses are Spatially Regulated in the Hypoxic Tumor Models
With the confirmation of model establishment with MCF-7 cells, we next applied 2-D and 3-D tumor models on LNCaP cells, a human prostate cancer cell line, to validate the hypoxic phenotypes of cancer cells in the models and their utilities for drug tests. COMSOL simulation showed that the oxygen profiles/responses of these cells were similar to those of MCF-7 cells under the same parameter sweeps (Supplementary Fig. S4, S5).
We first cultured LNCaP cells as a 2-D model in a monolayer in the hypoxia and normoxia devices for 24 hours and live-stained the cancer cells with the BioTracker hypoxia dye. We observed massive enhancement of hypoxia signal in cancer cells in the hypoxia device compared to the normoxia control (Fig. 5A), which was confirmed by quantitative analysis of the fluorescent intensities measured at the center, intermediate, and edge regions (Fig. 5B). With immunostaining, we confirmed that the LNCaP cells also had an upregulation of Glut-1 in the central and intermediate regions, whereas those near the edge remain similar to those in the normoxia device (Fig. 5C,D). We noticed that the cancer cell region with positive BioTracker staining was larger than that of high Glut-1 staining (Fig. 5A,C, right column), which was consistent but more obvious than that in MCF-7 cells (Fig. 4B~E, under 250 μm PC film). The result here suggests a more sensitive nature of the BioTracker staining in response to oxygen levels than the Glut-1 expression in these cells.
Figure 5.
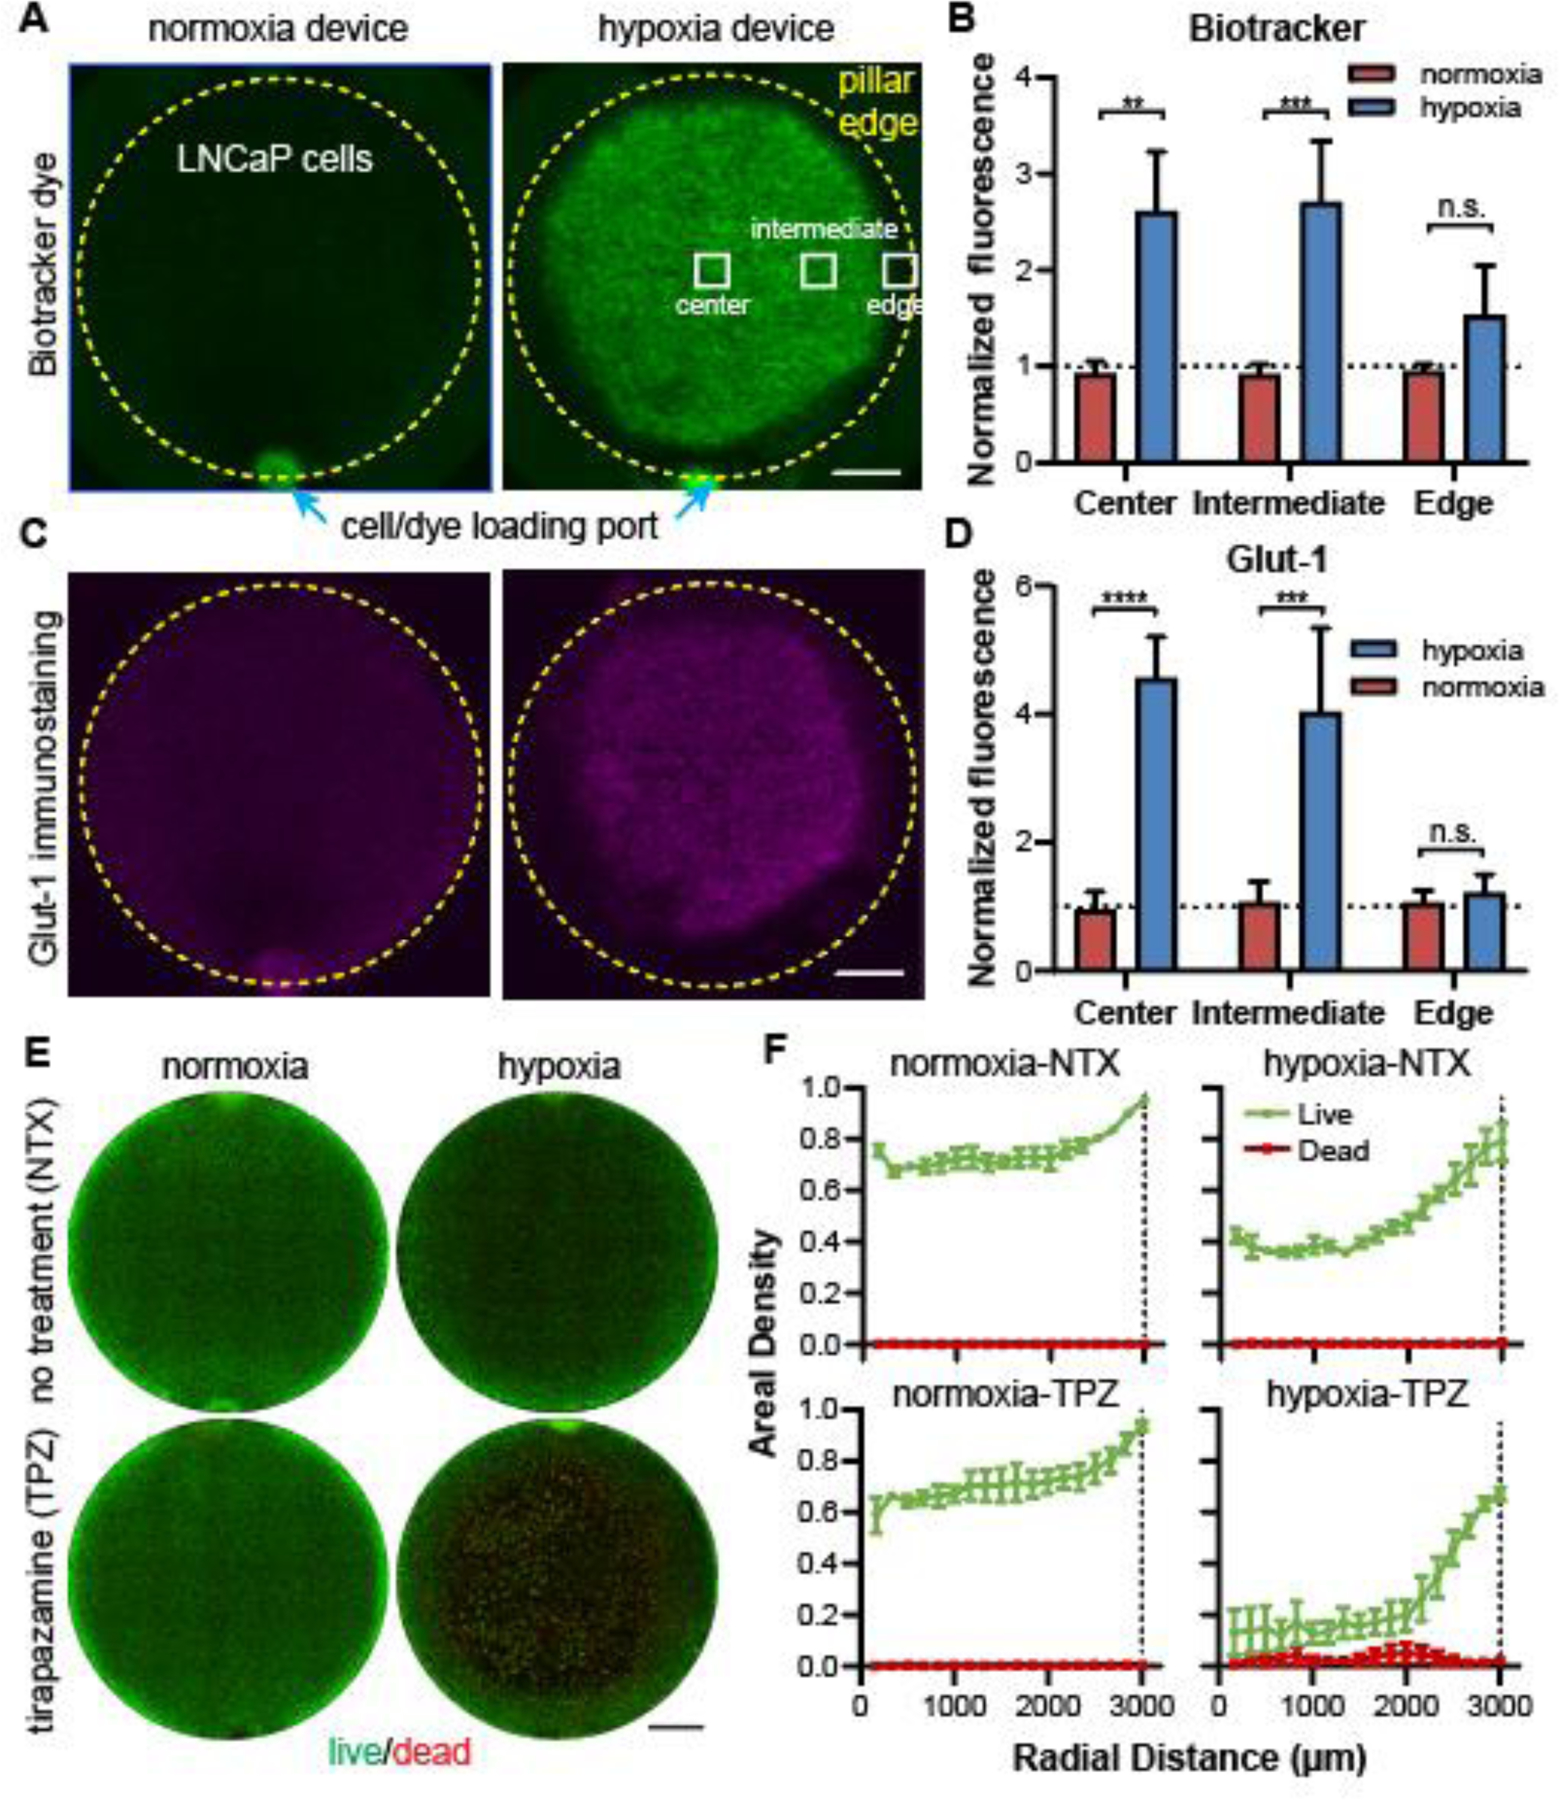
Confirmation of 2-D hypoxia in LNCaP prostate cancer model. (A) Images of LNCaP cells live-stained with BioTracker dye and (B) quantitative comparison in three representative regions in the normoxia and hypoxia devices. (C) Immunostaining of Glut-1 in LNCaP cells and (D) quantitative comparison of Glut-1 staining (normalized to cell density). (E) Live-dead staining of normoxia and hypoxia samples without or with tirapazamine (TPZ) treatment and (F) the radial profile of areal densities of live and dead cells. Scale bars: 1mm. (A), (C), (E): normoxia: N= 3; hypoxia: N=3, for each treatment condition. “n.s.”: not significant. **** p<0.0001, *** p<0.001, ** p<0.01.
We next tested whether the induced hypoxic phenotypes in cancer cells respond to cancer therapeutics. Tirapazamine (TPZ) is a hypoxia-activated cytotoxic drug that is 5- to 50-fold more selective at targeting hypoxic human cancer cells than their normoxic counterparts.62, 63 We infused in the microfluidic channels of both normoxia and hypoxia devices, and examined the cell viability through live-dead staining (live: by calcein in green; dead: by propidium iodide or PI in red) after 24 hours of treatment (Fig. 5E). We used the areal density of living cells as an indication of cancer cell survival in the 2-D models, as many of the dead cells were washed away during the live/dead staining, particularly in the TPZ-treated hypoxia model (Fig. 5E,F, lower right). Without TPZ, the hypoxic tumors showed a lower areal density of cancer cells in the center of the tumor sections (40% vs. 70% in normoxia) (Fig. 5F), indicating an inhibitory role of hypoxia on cancer cell growth. The TPZ treatment further reduced cancer cells to ~10% in the hypoxic core, whereas the same treatment had minimal effect on the normoxia model (Fig. 5F), confirming the hypoxic state of these cancer cells and the ability of TPZ in targeting them.
We also embedded LNCaP cells in GelMA to form 3-D tumor sections in the normoxia and hypoxia devices and examined the expression of Glut-1 in these models after 24 hours of incubation. The cancer cell dispersion and the structure of our 3-D cancer cell-laden matrix was comparable to the other microfluidic 3-D tumor models.64, 65 LNCaP cells maintained their rounded 3-D shapes within the GelMA matrix (Supplementary Fig. S6). For the 3-D models, we performed Glut-1 immunostaining instead of the BioTracker hypoxia dye to confirm the hypoxic phenotypes (Fig. 6A). This is for the consideration that the BioTracker dye needs to diffuse into the tumor section to stain the live cells, the process of which will lead to an inhomogeneous distribution of the reagent and compromise the interpretation of hypoxic levels. The Glut-1 immunostaining confirmed that cancer cells in the 3-D models exhibited similar radial patterns of glycolytic phenotypes as the 2-D models (Fig. 6B, Supplementary Fig. S7). Interestingly, as all the cancer cells were embedded in the ECM, it was much easier to determine the cell viability under TPZ treatment (Fig. 6C) by calculating the percentage of live cells in the combined live and dead cells (Fig. 6D). We found that 50% of cancer cells were killed at a radius of 2307 μm in the hypoxia model (r0 in Fig. 6D). This corresponded to an oxygen level of 0.002 mol/cm3 (or 0.2%) determined by COMSOL simulation. This indicates that IC50 of 24-hour TPZ incubated 3-D cultured LNCaP cells under 0.2% oxygen level is 25 μM.
Figure 6.
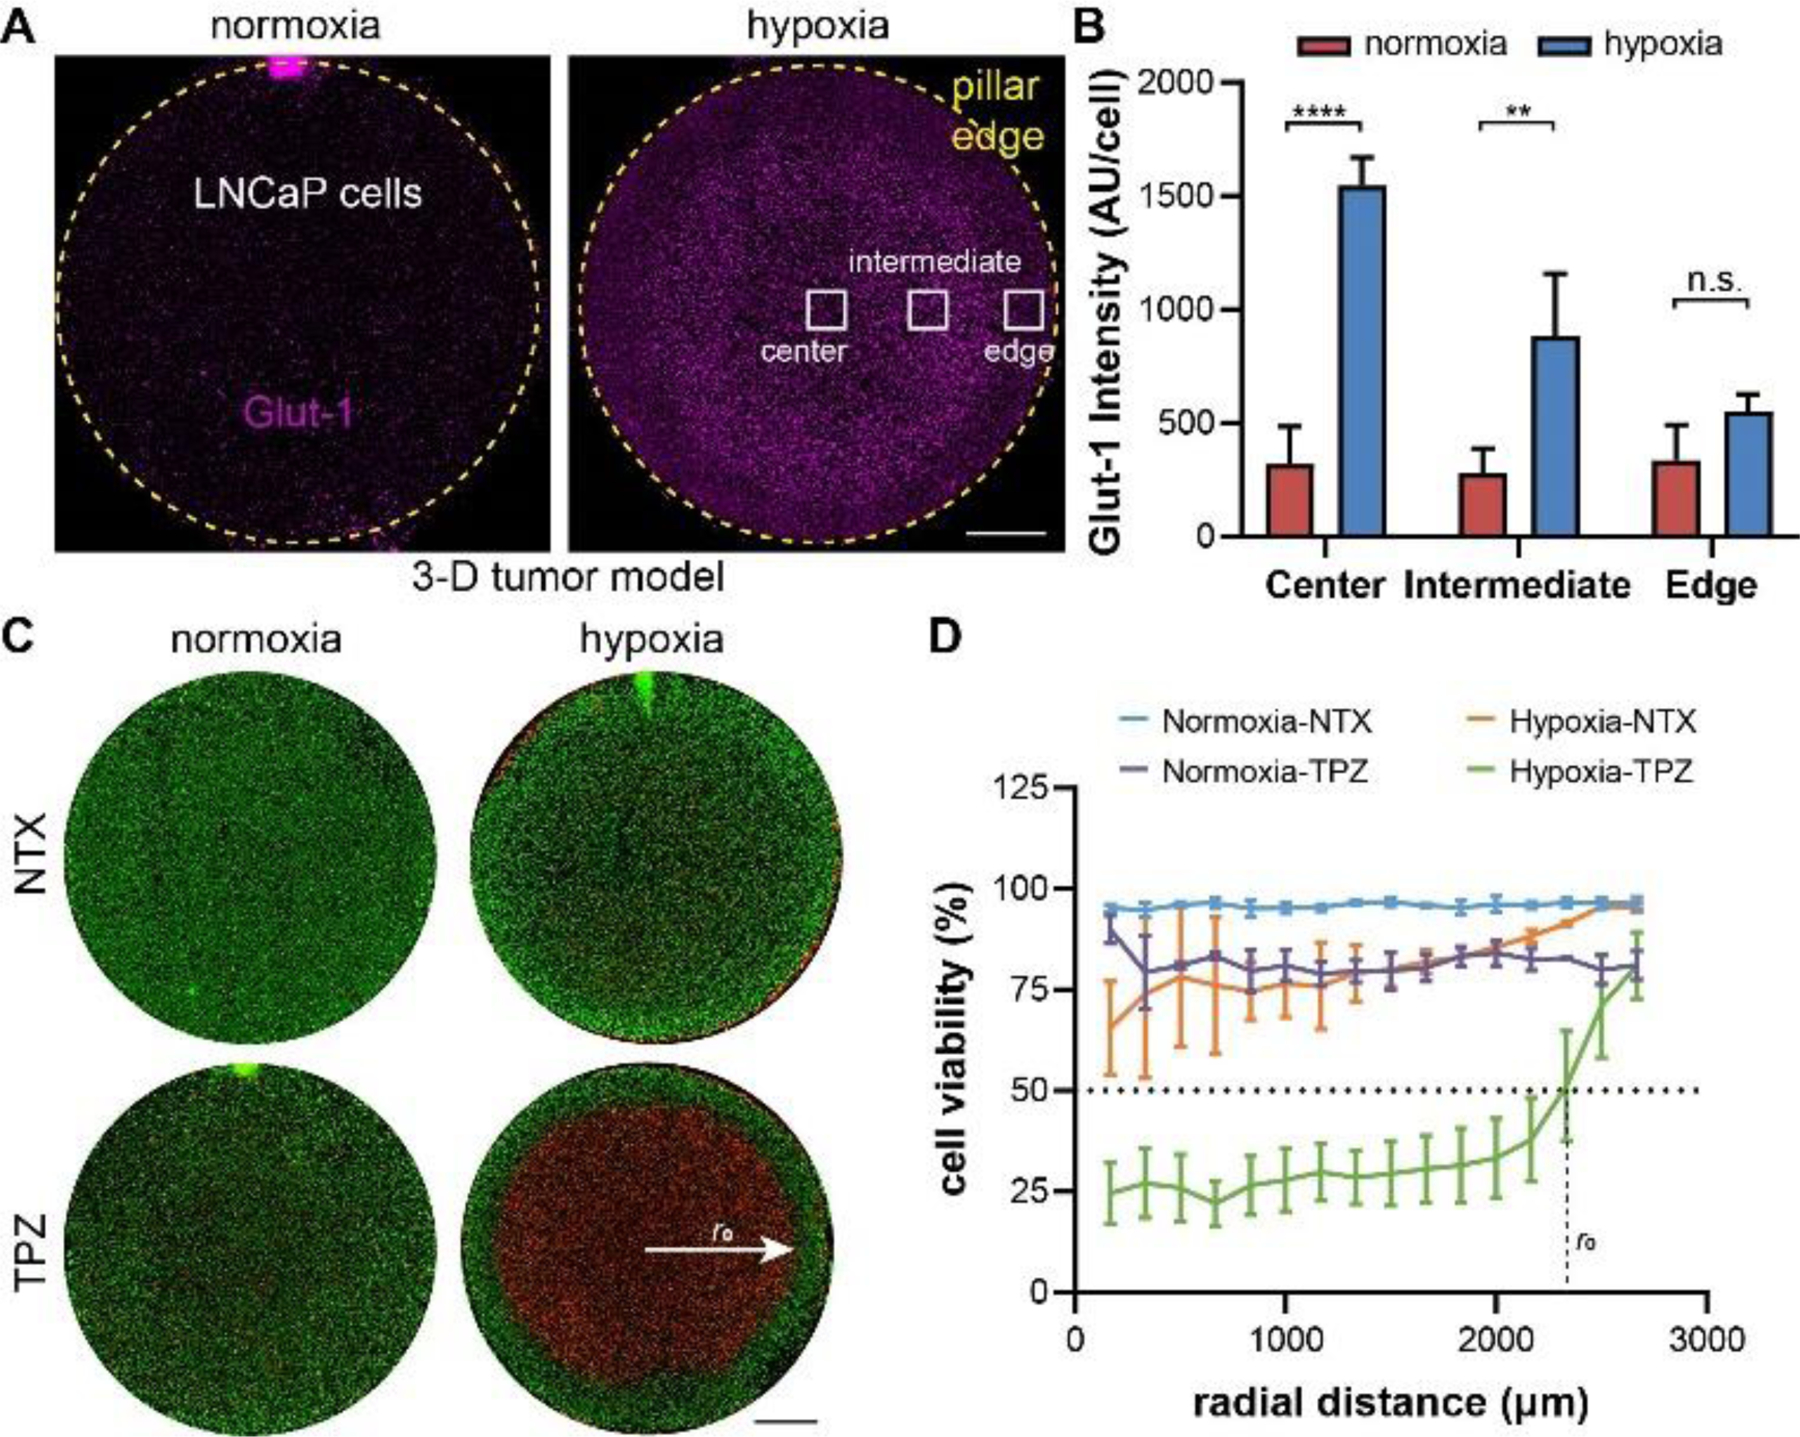
Confirmation of 3-D hypoxia in LNCaP prostate cancer model. (A) Immunostaining of Glut-1 in LNCaP cells and (B) quantitative comparison of Glut-1 staining (normalized to cell density). (C) Live-dead staining of normoxia and hypoxia samples without or with TPZ treatment and (D) the radial profiles of cell viability and the interpolation of radial distance with 50% cell killing. Scale bars: 1mm. (A), (B,C): normoxia: N= 3; hypoxia: N=3, for each treatment condition. “n.s.”: not significant. **** p<0.0001, ** p<0.01.
Dual Channel Design Allows for Multidimensional Evaluation of Drug Responses
A key advantage of the dual microfluidic channel design is the ability to assess the biological responses of the normoxic/hypoxia tumor models to different therapeutic conditions in the same device in a controlled manner, and to improve the throughput of analysis by reducing the sample numbers and imaging time (Fig. 7A). To demonstrate the feasibility, we infused the microfluidic channels of the 3-D models with a pair of control and treatment condition, i.e., no treatment (medium) vs. TPZ treatment (Fig. 7B). Similar to the results in the whole model treatment (Fig. 6C), the normoxic tumor did not exhibit any significant cell deaths; in contrast, there were massive cell deaths in the center of the hypoxic tumor section treated with TPZ from only one side (Fig. 7B). Interestingly, when examined closely, there was a difference between the TPZ side and the control side in the radii of the “death zone” at which 50% cells were killed (Fig. 7C, denoted as r1 and r2, respectively, where r1 = 2400 μm and r2 = 2140 μm). We performed COMSOL simulation to estimate the concentrations of TPZ and oxygen at these two locations (Fig. 7D,E). The results showed that r1 corresponded to an oxygen level [O2] of 0.003 mol/m3 (or 0.3%) and TPZ concentration [TPZ] of 0.0182 mM, whereas r2 corresponded to [O2] of 0.002 mol/m3 (or 0.2%) and [TPZ] of 0.0023 mM, reflecting a 9-fold increase of TPZ cytotoxicity by just a 0.1% decrease in oxygen concentration. The results showed a potential use of the dual-channel design to provide multidimensional readout in therapeutic evaluations.
Figure 7.
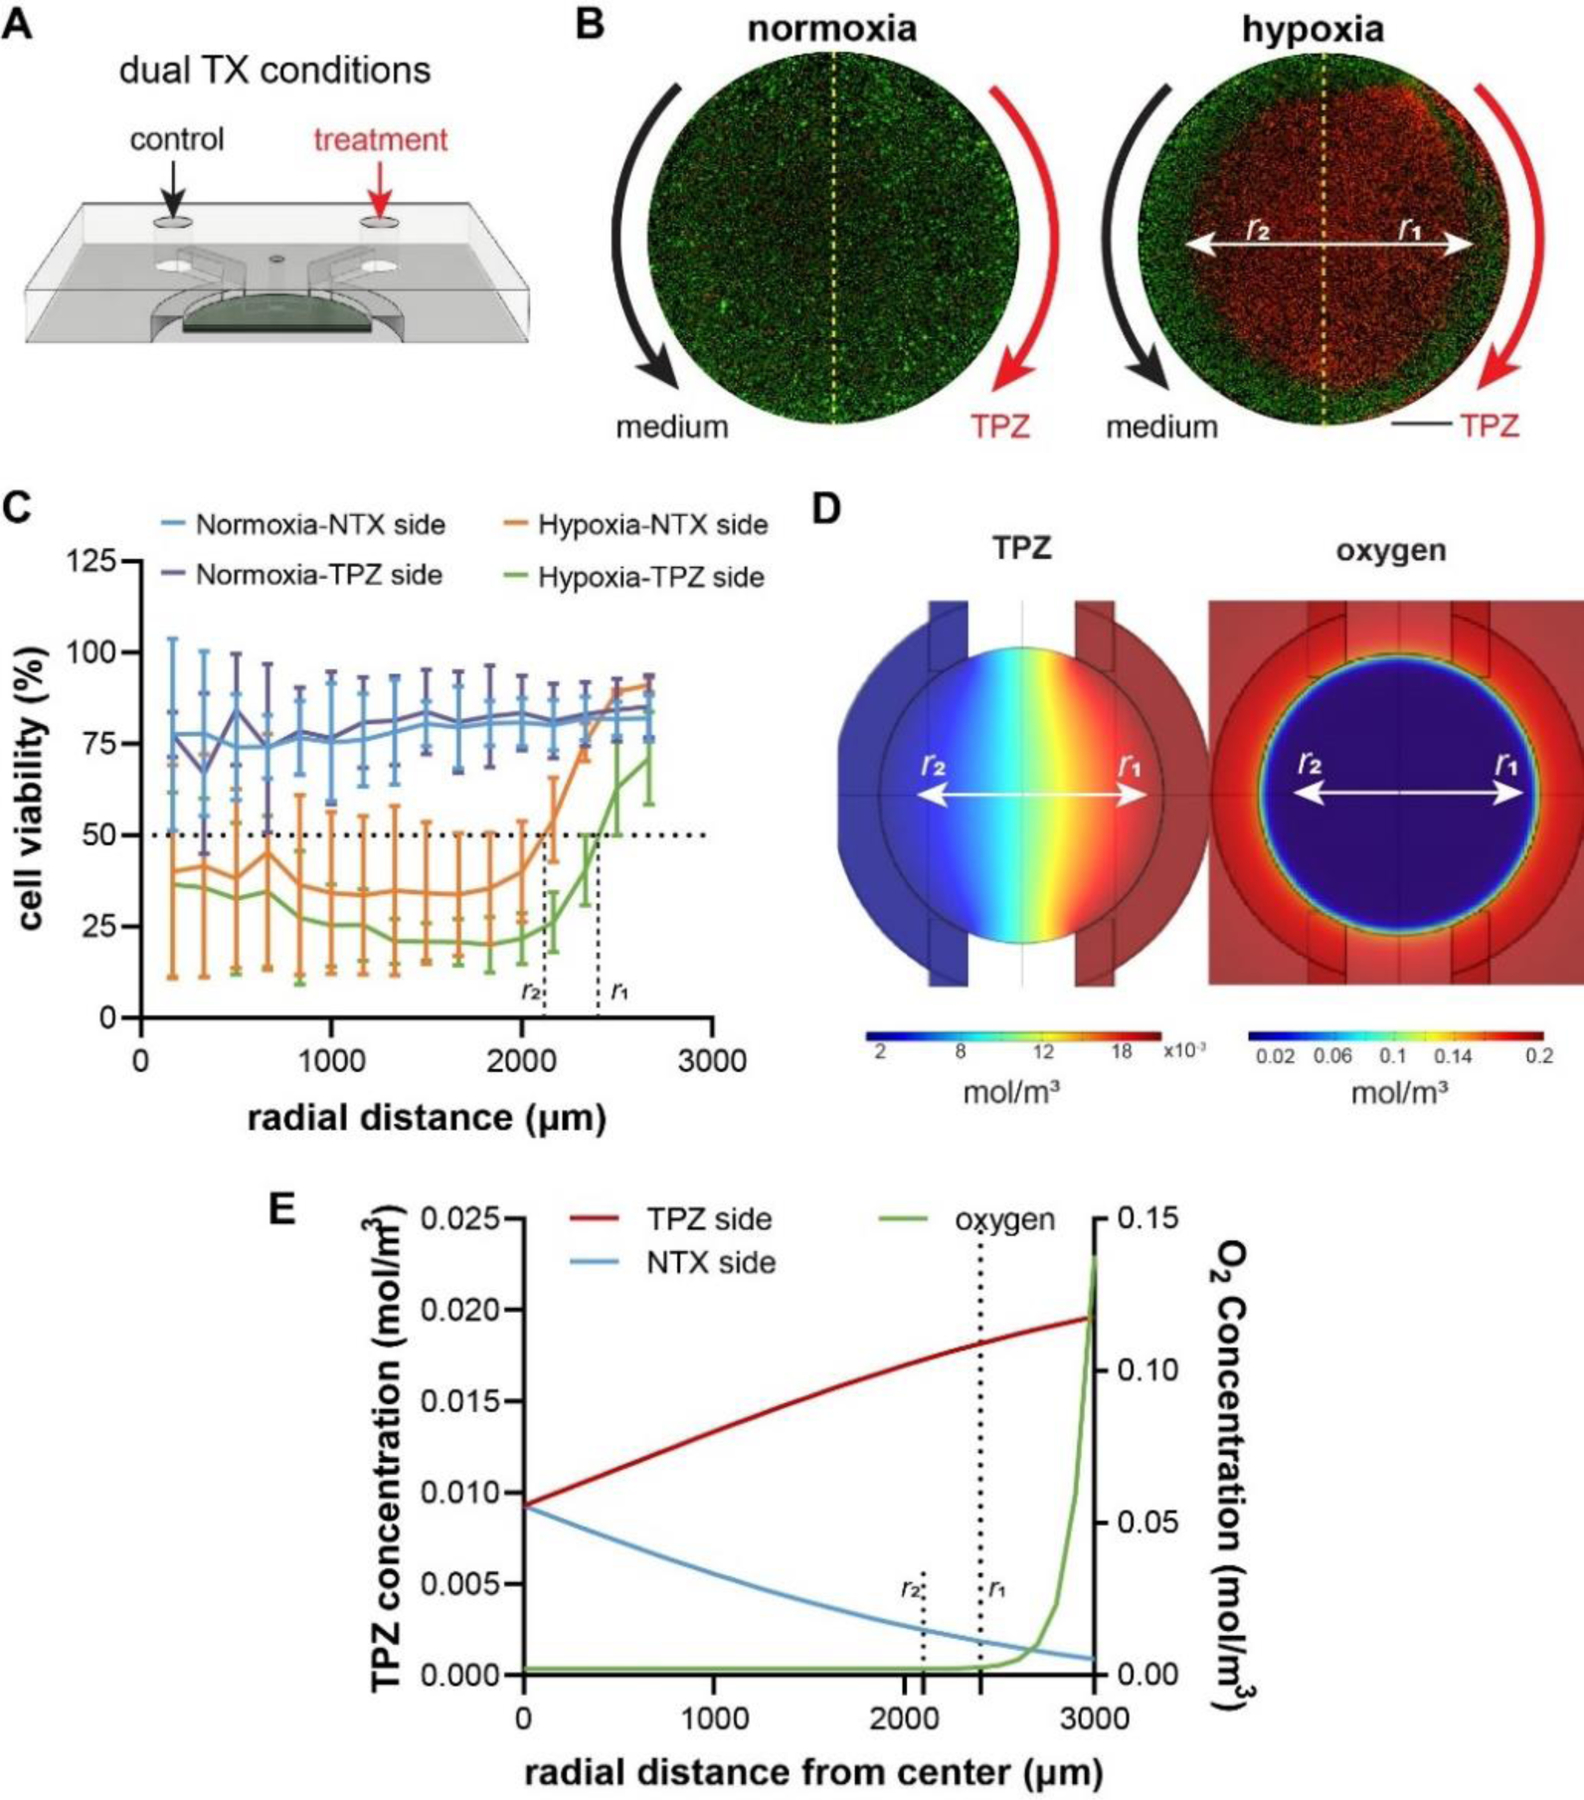
Application of parallel channels in the 3-D hypoxia model. (A) Potential usage of the dual channel design in evaluating parallel conditions in the same device. (B) Live-dead staining of normoxia and hypoxia samples with parallel no treatment and TPZ treatment conditions. Scale bar: 1mm. (C) The radial profiles of cell viability and the interpolation of radial distances with 50% cell killing. (D) COMSOL simulations of TPZ and oxygen levels in the device. (E) Calculation of critical TPZ and oxygen concentrations for 50% cell viability. Scale bars: 1mm. (B), (C): normoxia: N= 3; hypoxia: N=3, for each treatment condition.
DISCUSSION
The role of hypoxia in tumor progression can be studied in vitro utilizing a wide spectrum of tools, each with its own advantages and limitations. In conventional cultures, hypoxia has been induced with hypoxia chamber26 or chemical inducers of hypoxia-inducible factors27 (e.g. CoCl2). While the severity of the induced hypoxia in these models can be adjusted by controlling the oxygen partial pressure or the concentration of chemical inducers, they often involve a single concentration of oxygen/chemical for the whole culture, thus ignoring the spatial heterogeneity of oxygen levels and the resulted crosstalk seen in solid tumors. The tumor spheroid models66 recapitulate the spatial complexity of tumor hypoxia and metabolism, and are relatively easy to establish and scale up.67 However, it is difficult to interface with high-content analysis such as live-cell tracking and spatiotemporally resolved single-cell analysis. The more recent, patient-derived cancer organoids provide high genetic, proteomic, and morphological relevance to the in vivo tumor. While revolutionary for developing patient-specific therapies, it remains difficult to efficiently and reliably generate and expand the organoids.68 The complex handling and high costs also limit its scalability and throughput, and make it unsuitable for early stage drug development. Overall, there is still a need for a hypoxic tumor model that captures the spatial heterogeneity of tumor hypoxia, and is user/cost-friendly, scalable, and compatible with high-content analysis, to effectively provide mechanistic and therapeutic insights relevant to the in vivo tumors.
Here, we presented a single-piece microfluidic device with an integrated oxygen diffusion barrier (PC film) that supports the induction of hypoxia in both 2-D and 3-D patterned cancer cells without an external source of oxygen control. The entire device fabrication process has been accomplished using desktop micromilling machine and craft cutter. The fabrication of our microfluidic device is much more cost-effective compared to the traditional microfabrication methods that rely on photolithography. The standard photolithography process requires specialized equipment and large lab space with cleanroom facilities that are prohibitively expensive and thus, are not easily adaptable.69, 70 In comparison, utilizing micromilling as a fabrication method offers a unique advantage for its low start-up cost and high resolution.53 Therefore, the significant advantage of our platform is in its simplicity and low-cost in fabrication and high-scalability, without sacrificing function as a hypoxic tumor model. The fabrication tools (milling machine and craft cutter) and device materials are all commercially available through mass consumer market with user-friendly software interfaces, and are affordable and feasible for small laboratories even with limited engineering experiences or expertise.
Due to the microfluidic nature of our device, micropatterning in tumor model has been accomplished by a single injection to the cell culture chamber. The PC-PDMS integration and liquid-pinning approach significantly simplified the 2-D and 3-D tumor formation and eliminated additional preparation required by conventional micropatterning protocols (e.g. microcontact printing of ECM) and the necessity to assemble the microdevice during cell culture.40, 41 Additionally, liquid pinning can accommodate a variety of tumor radii and/or thicknesses in our device (Fig. 2F). Separating the device assembly from cell culture enables other researchers and clinicians with miniminal microfluidic fabrication background to utilize our device. Injection-based cell micropatterning and culture is critical to scalability, as fully automated microfluidic culture, where cells are micropatterned and cultured through injection pumps, has been on the rise.71–73 Because natural induction of hypoxia occurs in the micropatterned cancer cells through cell metabolism and integrated diffusion barriers, external source of gas control is not needed. This effectively eliminated gas tanks, tubes, pumps, valves, microfluidic control circuit, and other complex and bulky items that are generally required in the conventional microfluidic platforms that model hypoxic tumor.28, 29, 35–37
We optimized our device design by COMSOL simulations which determined a unified device design to achieve hypoxia in both 2-D and 3-D models. Notably, the oxygen (or hypoxia) profiles can be fine-tuned by adjusting device parameters such as gap size and oxygen barrier thickness (Fig. 3). The simulation predicted a steep oxygen gradient near the edge of the 3-D tumor section (Fig. 3F). For the device parameter used in our study (3000 μm radius and 120 μm diffusion gap), 2% threshold oxygen level is predicted to be achieved ~300 μm from the edge of the tumor section. This distance is at the same scale of the in vivo hypoxic tumor conditions, where hypoxia effects are reported to be measurable within a 100 μm distance from the tumor blood vessels in vivo.74 Notably, we chose oxygen consumption parameters (Rmax) based on Seahorse measurements of the used cell lines. While the true Rmax in Michaelis-Menten kinetics is difficult (if not impossible) to obtain experimentally (C→∞), our choice is based on the consideration that this value also represents the maximum rate of oxygen consumption that the cell can physically achieve (although under an alternative, non-physiological condition in Seahorse assay). This greatly enhanced the validity of the simulation results. This also provides a workflow for potential users to select and re-design their own parameters based on their tumor models of choice. Our simulation results on the influence of PC thickness on hypoxic level were experimentally confirmed through 2-D cultured MCF-7 cells, showing the impact of combining in vitro and in silico analyses. We further extended our application to 2-D and 3-D cultured LNCaP cells and performed proof-of-concept drug treatment studies with TPZ, thus showing the applicability of the platform for other tumor models and as a therapeutic assessment tool.
Interestingly, with the dual channel treatment set up, we observed large variations in cytotoxicity at the radial distances, particularly with those closer to the center (Fig. 7C). This is largely due to the complex profile of TPZ concentrations in our model (Fig. 7D, left), which differs in radial distributions along different directions. This means that in the radial analysis, the cytotoxicity data are lumped from regions with different TPZ concentrations in the same radial bins. The influence of this distortion comes the greatest near the center of the microdevice where 1) the cells are in the deepest level of hypoxia and 2) the different TPZ treatment concentration collides (under a steep TPZ concentration gradient). Overall, they resulted in the high variability particularly near the tumor center as seen in Fig. 7C. Our data analysis thus actually captured and reflected the complexity of the TPZ efficacy. Other potential approaches to improve multifactorial analysis may include changing the shape of the tumor model to orthogonally overlap the TPZ and oxygen gradients. In the current study, simulation of TPZ diffusion did not consider TPZ consumption/metabolism by the cancer cells. To mimic a more realisitc spatiotemporal drug concentration profile, factors such as drug consumption rate, stability of the drug, and the change in the live cancer cell population can be considered in the simulation in the future.
Our hypoxia models have shown phenotypic heterogeneity (e.g., Glut-1 expression) induced by hypoxia. We have immunostained our cells with Glut-1 as Glut-1 has been established as an intrinsic phenotypic marker for hypoxic cancer cells75–78 with significant clinical relevance. Glut-1 expression of human uterine cervis squamous cell carcinoma cells drastically increased when the oxygen centration decreased from 5% to 1%79. In cancer patients, overexpression of Glut-1 is associated with poor clinical outcomes (e.g., higher rate of recurrence and poorer survival)80. We have previously shown a high degree of correlation between the radial profiles of Glut-1 expression and reduced pimonidazole (an exogenous hypoxia marker that is reduced in hypoxic enviroments)40. In our 2-D microfluidic device, Glut-1 overexpression was only triggered in the MCF-7 cells cultured in the hypoxia device with 250 μm PC film thickness (Fig. 4D,E), suggesting a more stringent requirement of the hypoxic level in inducing the Glut-1 expression in these cells.
In the current study, we have relied on immunostaining to examine the heterogeneous phenotypic responses (e.g. Glut-1 expression) induced by a gradient of hypoxia. Glut-1 is only one of the numerous markers heterogeneously regulated under the hypoxic tumor microenvironment. Notably, due to the thin-layer format, our platform can be easily interfaced with higher-content spatial analysis tools such as laser capture microdissection40 and RNA sequencing81 that we have previously utilized, or other spatial analysis tools to examine the heterogeneity at the transcriptomic/proteomic and/or single-cell levels82, 83. We can further achieve rapid readout in drug screening assays or monitor the dynamic spatiotemporal changes of cellular behaviors in real-time by utilizing biosensors such as those detecting hypoxic signaling84 or Glut-1 trafficking85. In addition, our platform is compatible and capable of incorporating other tumor-specific stromal cells (e.g., cancer-associated fibroblast)86 or immune cells (e.g., regulatory T cells, tumor associated macrophages)87 to gain a more comprehensive mechanistic understanding on how tumor progresses in the context of both hypoxia and stromal cells. Additionally, the model can be used to assess the impact of ECM types on cancer cell behavior under hypoxia in both 2-D and 3-D contexts. We can also finely-tune the ECM porosity, density, stiffness, and other mechanical parameters in 3-D to study mechanical-responses in hypoxic tumors. We can further integrate tumor vasculature in the microfluidic channels to evaluate tumor-vascular crosstalk and angiogenesis.42 We have shown our platform as a scalable tool for preclinical evaluation of chemotherapeutics. Additionally, the platform can be used to assess the efficacy of cell-based therapeutics (e.g., conventional and chimeric antigen receptor T cells, natural killer cells).41, 42, 65, 88 It can further be utilized to compare the efficacy of different cell therapies/conditions in a highly controlled manner, by using the parallel channels within the same device. Overall, our new microfluidic tumor model serves as a user-friendly, cost-effective, and highly scalable platform that provides spatiotemporal analysis of the hypoxic tumor microenvironments suitable for high-content biological studies and therapeutic discoveries.
CONCLUSION
Here, we presented a microfluidic device with an integrated oxygen diffusion barrier (PC film) that supports the induction of hypoxia in both 2-D and 3-D patterned cancer cells without an external source of oxygen control. We optimized our device design by COMSOL simulations which determined a unified device design to achieve hypoxia in both 2-D and 3-D models. The significant advantage of our platform is in its simplicity and low-cost in fabrication and high-scalability, without sacrificing function as a hypoxic tumor model. The fabrication tools (milling machine and craft cutter) and device materials are all commercially available through mass consumer market with user-friendly software interfaces, and are affordable and feasible for small laboratories even with limited engineering experiences or expertise. We confirmed the induction of the hypoxic gradient in 2-D and 3-D cultured MCF-7 and LNCaP cells and performed proof-of-concept drug treatment studies with TPZ, thus showing the applicability of the platform for other tumor models and as a therapeutic assessment tool. Overall, our new microfluidic tumor model serves as a user-friendly, cost-effective, and highly scalable platform that provides spatiotemporal analysis of the hypoxic tumor microenvironments suitable for high-content biological studies and therapeutic discoveries.
Supplementary Material
ACKNOWLEDGMENT
This work was supported by an NIH National Cancer Institute grant (R01CA220012), an NIH National Institute of Biomedical Imaging and Bioengineering Trailblazer Award (R21EB024748), a STOP CANCER Marni Levine Memorial Research Career Development Award, the USC Viterbi School of Engineering, and the USC Provost’s PhD Fellowship. This research was also supported by shared resources from an NIH National Cancer Institute Award (P30CA014089).
Funding Sources
NIH National Cancer Institute (R01CA220012)
NIH National Institute of Biomedical Imaging and Bioengineering (R21EB024748)
ABBREVIATIONS
- ECM
extracellular matrix
- PDMS
polydimethylsiloxane
- OCR
oxygen consumption rate
- PC
polycarbonate
- TPZ
tirapazamine
- CNC
computer numerical control
- GelMA
gelatin methacrylate
- PDL
poly-D-lysine
Footnotes
Supporting Information
- Seahorse XF Cell Mito Stress Test Profile of MCF7 and LNCaP cells (Figure S1); Impact of PDMS bonding layer on device gap size (Figure S2); COMSOL simulation of oxygen profiles in a hypoxic MCF7 tumor model (top surface vs. bottom surface) (Figure S3); COMSOL simulation of oxygen profiles in hypoxic LNCaP tumor models (Figure S4); COMSOL simulation of oxygen profile kinetics at the center of the hypoxic tumor models (Figure S5); Distribution of LNCaP cells in 3-D culture in a hypoxia device (Figure S6); A higher magnification image of Glut-1 stained 3-D LNCaP cells at the center, intermediate, and edge of the hypoxic and normoxic microdevice (Figure S7).
- Supplementary video: Video demonstrating the working principle of the liquid pinning process by pipetting a color dye solution into the injection port of the microdevice.
There are no conflicts to declare.
REFERENCES
- (1).Petrova V; Annicchiarico-Petruzzelli M; Melino G; Amelio I The hypoxic tumour microenvironment. Oncogenesis 2018, 7 (1), 10. DOI: 10.1038/s41389-017-0011-9. [DOI] [PMC free article] [PubMed] [Google Scholar]
- (2).Muz B; de la Puente P; Azab F; Azab AK The role of hypoxia in cancer progression, angiogenesis, metastasis, and resistance to therapy. Hypoxia 2015, 3, 83–92. [DOI] [PMC free article] [PubMed] [Google Scholar]
- (3).Donato C; Kunz L; Castro-Giner F; Paasinen-Sohns A; Strittmatter K; Szczerba BM; Scherrer R; Di Maggio N; Heusermann W; Biehlmaier O; et al. Hypoxia Triggers the Intravasation of Clustered Circulating Tumor Cells. Cell Rep 2020, 32 (10), 108105. DOI: 10.1016/j.celrep.2020.108105 From NLM. [DOI] [PMC free article] [PubMed] [Google Scholar]
- (4).McKeown SR Defining normoxia, physoxia and hypoxia in tumours-implications for treatment response. Br J Radiol 2014, 87 (1035), 20130676–20130676. DOI: 10.1259/bjr.20130676 PubMed. [DOI] [PMC free article] [PubMed] [Google Scholar]
- (5).Chen P-S; Chiu W-T; Hsu P-L; Lin S-C; Peng IC; Wang C-Y; Tsai S-J Pathophysiological implications of hypoxia in human diseases. Journal of Biomedical Science 2020, 27 (1), 63. DOI: 10.1186/s12929-020-00658-7. [DOI] [PMC free article] [PubMed] [Google Scholar]
- (6).Qiu G-Z; Jin M-Z; Dai J-X; Sun W; Feng J-H; Jin W-L Reprogramming of the Tumor in the Hypoxic Niche: The Emerging Concept and Associated Therapeutic Strategies. Trends in Pharmacological Sciences 2017, 38 (8), 669–686. DOI: 10.1016/j.tips.2017.05.002 (acccessed 2021/08/28). [DOI] [PubMed] [Google Scholar]
- (7).Ancel J; Perotin J-M; Dewolf M; Launois C; Mulette P; Nawrocki-Raby B; Dalstein V; Gilles C; Deslée G; Polette M; et al. Hypoxia in Lung Cancer Management: A Translational Approach. Cancers 2021, 13 (14), 3421. [DOI] [PMC free article] [PubMed] [Google Scholar]
- (8).Pandkar MR; Dhamdhere SG; Shukla S Oxygen gradient and tumor heterogeneity: The chronicle of a toxic relationship. Biochimica et Biophysica Acta (BBA) - Reviews on Cancer 2021, 1876 (1), 188553. [DOI] [PubMed] [Google Scholar]
- (9).Dagogo-Jack I; Shaw AT Tumour heterogeneity and resistance to cancer therapies. Nature Reviews Clinical Oncology 2018, 15 (2), 81–94. [DOI] [PubMed] [Google Scholar]
- (10).Terry S; Buart S; Chouaib S Hypoxic Stress-Induced Tumor and Immune Plasticity, Suppression, and Impact on Tumor Heterogeneity. Front Immunol 2017, 8, 1625. DOI: 10.3389/fimmu.2017.01625 From NLM. [DOI] [PMC free article] [PubMed] [Google Scholar]
- (11).Meacham CE; Morrison SJ Tumor heterogeneity and cancer cell plasticity. Nature 2013, 501 (7467), 328–337. [DOI] [PMC free article] [PubMed] [Google Scholar]
- (12).Janku F Tumor heterogeneity in the clinic: is it a real problem? Therapeutic Advances in Medical Oncology 2014, 6 (2), 43–51. [DOI] [PMC free article] [PubMed] [Google Scholar]
- (13).Hompland T; Fjeldbo CS; Lyng H Tumor Hypoxia as a Barrier in Cancer Therapy: Why Levels Matter. Cancers 2021, 13 (3), 499. [DOI] [PMC free article] [PubMed] [Google Scholar]
- (14).Wang B; Zhao Q; Zhang Y; Liu Z; Zheng Z; Liu S; Meng L; Xin Y; Jiang X Targeting hypoxia in the tumor microenvironment: a potential strategy to improve cancer immunotherapy. Journal of Experimental & Clinical Cancer Research 2021, 40 (1), 24. [DOI] [PMC free article] [PubMed] [Google Scholar]
- (15).Jing X; Yang F; Shao C; Wei K; Xie M; Shen H; Shu Y Role of hypoxia in cancer therapy by regulating the tumor microenvironment. Molecular Cancer 2019, 18 (1), 157. [DOI] [PMC free article] [PubMed] [Google Scholar]
- (16).Gargiulo G Next-Generation in vivo Modeling of Human Cancers. Frontiers in Oncology 2018, 8, 429. [DOI] [PMC free article] [PubMed] [Google Scholar]
- (17).Tammela T; Sage J Investigating Tumor Heterogeneity in Mouse Models. Annual Review of Cancer Biology 2020, 4 (1), 99–119. [DOI] [PMC free article] [PubMed] [Google Scholar]
- (18).Zheng X; Wang X; Mao H; Wu W; Liu B; Jiang X Hypoxia-specific ultrasensitive detection of tumours and cancer cells in vivo. Nature Communications 2015, 6 (1), 5834. DOI: 10.1038/ncomms6834. [DOI] [PubMed] [Google Scholar]
- (19).Godet I; Shin YJ; Ju JA; Ye IC; Wang G; Gilkes DM Fate-mapping post-hypoxic tumor cells reveals a ROS-resistant phenotype that promotes metastasis. Nature Communications 2019, 10 (1), 4862. DOI: 10.1038/s41467-019-12412-1. [DOI] [PMC free article] [PubMed] [Google Scholar]
- (20).Ingber DE Is it Time for Reviewer 3 to Request Human Organ Chip Experiments Instead of Animal Validation Studies? Advanced Science 2020, 7 (22), 2002030. DOI: 10.1002/advs.202002030. [DOI] [PMC free article] [PubMed] [Google Scholar]
- (21).Gengenbacher N; Singhal M; Augustin HG Preclinical mouse solid tumour models: status quo, challenges and perspectives. Nature Reviews Cancer 2017, 17 (12), 751–765. DOI: 10.1038/nrc.2017.92. [DOI] [PubMed] [Google Scholar]
- (22).Day C-P; Merlino G; Van Dyke, T. Preclinical Mouse Cancer Models: A Maze of Opportunities and Challenges. Cell 2015, 163 (1), 39–53. DOI: 10.1016/j.cell.2015.08.068. [DOI] [PMC free article] [PubMed] [Google Scholar]
- (23).Sontheimer-Phelps A; Hassell BA; Ingber DE Modelling cancer in microfluidic human organs-on-chips. Nature Reviews Cancer 2019, 19 (2), 65–81. DOI: 10.1038/s41568-018-0104-6. [DOI] [PubMed] [Google Scholar]
- (24).Byrne MB; Leslie MT; Gaskins HR; Kenis PJA Methods to study the tumor microenvironment under controlled oxygen conditions. Trends in Biotechnology 2014, 32 (11), 556–563. DOI: 10.1016/j.tibtech.2014.09.006 (acccessed 2021/08/29). [DOI] [PMC free article] [PubMed] [Google Scholar]
- (25).Shi Y; Cai Y; Cao Y; Hong Z; Chai Y Recent advances in microfluidic technology and applications for anti-cancer drug screening. TrAC Trends in Analytical Chemistry 2021, 134, 116118. DOI: 10.1016/j.trac.2020.116118. [DOI] [Google Scholar]
- (26).Matthiesen S; Jahnke R; Knittler MR A Straightforward Hypoxic Cell Culture Method Suitable for Standard Incubators. Methods and Protocols 2021, 4 (2), 25. [DOI] [PMC free article] [PubMed] [Google Scholar]
- (27).Rana NK; Singh P; Koch B CoCl2 simulated hypoxia induce cell proliferation and alter the expression pattern of hypoxia associated genes involved in angiogenesis and apoptosis. Biological Research 2019, 52 (1), 12. DOI: 10.1186/s40659-019-0221-z. [DOI] [PMC free article] [PubMed] [Google Scholar]
- (28).Funamoto K; Zervantonakis IK; Liu Y; Ochs CJ; Kim C; Kamm RD A novel microfluidic platform for high-resolution imaging of a three-dimensional cell culture under a controlled hypoxic environment. Lab on a Chip 2012, 12 (22), 4855–4863, 10.1039/C2LC40306D. DOI: 10.1039/C2LC40306D. [DOI] [PMC free article] [PubMed] [Google Scholar]
- (29).Koens R; Tabata Y; Serrano JC; Aratake S; Yoshino D; Kamm RD; Funamoto K Microfluidic platform for three-dimensional cell culture under spatiotemporal heterogeneity of oxygen tension. APL Bioengineering 2020, 4 (1), 016106. DOI: 10.1063/1.5127069. [DOI] [PMC free article] [PubMed] [Google Scholar]
- (30).Choi Y; Hyun E; Seo J; Blundell C; Kim HC; Lee E; Lee SH; Moon A; Moon WK; Huh D A microengineered pathophysiological model of early-stage breast cancer. Lab Chip 2015, 15 (16), 3350–3357. DOI: 10.1039/c5lc00514k From NLM. [DOI] [PMC free article] [PubMed] [Google Scholar]
- (31).Ahn J; Lim J; Jusoh N; Lee J; Park T-E; Kim Y; Kim J; Jeon NL 3D Microfluidic Bone Tumor Microenvironment Comprised of Hydroxyapatite/Fibrin Composite. Frontiers in Bioengineering and Biotechnology 2019, 7 (168), Original Research. DOI: 10.3389/fbioe.2019.00168. [DOI] [PMC free article] [PubMed] [Google Scholar]
- (32).Liverani C; De Vita A; Minardi S; Kang Y; Mercatali L; Amadori D; Bongiovanni A; La Manna F; Ibrahim T; Tasciotti E A biomimetic 3D model of hypoxia-driven cancer progression. Scientific Reports 2019, 9 (1), 12263. DOI: 10.1038/s41598-019-48701-4. [DOI] [PMC free article] [PubMed] [Google Scholar]
- (33).Ma Y-HV; Middleton K; You L; Sun Y A review of microfluidic approaches for investigating cancer extravasation during metastasis. Microsystems & Nanoengineering 2018, 4 (1), 17104. DOI: 10.1038/micronano.2017.104. [DOI] [Google Scholar]
- (34).Lin Z; Luo G; Du W; Kong T; Liu C; Liu Z Recent Advances in Microfluidic Platforms Applied in Cancer Metastasis: Circulating Tumor Cells’ (CTCs) Isolation and Tumor-On-A-Chip. Small 2020, 16 (9), 1903899. DOI: 10.1002/smll.201903899. [DOI] [PubMed] [Google Scholar]
- (35).Chang C-W; Cheng Y-J; Tu M; Chen Y-H; Peng C-C; Liao W-H; Tung Y-C A polydimethylsiloxane–polycarbonate hybrid microfluidic device capable of generating perpendicular chemical and oxygen gradients for cell culture studies. Lab on a Chip 2014, 14 (19), 3762–3772, 10.1039/C4LC00732H. DOI: 10.1039/C4LC00732H. [DOI] [PubMed] [Google Scholar]
- (36).Gao Y; Stybayeva G; Revzin A Fabrication of composite microfluidic devices for local control of oxygen tension in cell cultures. Lab on a Chip 2019, 19 (2), 306–315, 10.1039/C8LC00825F. DOI: 10.1039/C8LC00825F. [DOI] [PMC free article] [PubMed] [Google Scholar]
- (37).Busek M; Grünzner S; Steege T; Klotzbach U; Sonntag F Hypoxia-on-a-chip: Generating hypoxic conditions in microfluidic cell culture systems. Current Directions in Biomedical Engineering 2016, 2 (1), 71–75. DOI: doi: 10.1515/cdbme-2016-0019. [DOI] [Google Scholar]
- (38).Hubert CG; Rivera M; Spangler LC; Wu Q; Mack SC; Prager BC; Couce M; McLendon RE; Sloan AE; Rich JN A Three-Dimensional Organoid Culture System Derived from Human Glioblastomas Recapitulates the Hypoxic Gradients and Cancer Stem Cell Heterogeneity of Tumors Found In Vivo. Cancer Research 2016, 76 (8), 2465–2477. DOI: 10.1158/0008-5472.Can-15-2402. [DOI] [PMC free article] [PubMed] [Google Scholar]
- (39).Yi H-G; Jeong YH; Kim Y; Choi Y-J; Moon HE; Park SH; Kang KS; Bae M; Jang J; Youn H; et al. A bioprinted human-glioblastoma-on-a-chip for the identification of patient-specific responses to chemoradiotherapy. Nature Biomedical Engineering 2019, 3 (7), 509–519. DOI: 10.1038/s41551-019-0363-x. [DOI] [PubMed] [Google Scholar]
- (40).Ando Y; Ta HP; Yen DP; Lee S-S; Raola S; Shen K A Microdevice Platform Recapitulating Hypoxic Tumor Microenvironments. Scientific Reports 2017, 7 (1), 15233. [DOI] [PMC free article] [PubMed] [Google Scholar]
- (41).Ando Y; Siegler EL; Ta HP; Cinay GE; Zhou H; Gorrell KA; Au H; Jarvis BM; Wang P; Shen K Evaluating CAR-T Cell Therapy in a Hypoxic 3D Tumor Model. Advanced Healthcare Materials 2019, 0 (0), 1900001. DOI: doi: 10.1002/adhm.201900001. [DOI] [PMC free article] [PubMed] [Google Scholar]
- (42).Ando Y; Oh JM; Zhao W; Tran M; Shen K Engineering a Vascularized Hypoxic Tumor Model for Therapeutic Assessment. Cells 2021, 10 (9), 2201. [DOI] [PMC free article] [PubMed] [Google Scholar]
- (43).Markov DA; Lillie EM; Garbett SP; McCawley LJ Variation in diffusion of gases through PDMS due to plasma surface treatment and storage conditions. Biomedical Microdevices 2014, 16 (1), 91–96. DOI: 10.1007/s10544-013-9808-2. [DOI] [PMC free article] [PubMed] [Google Scholar]
- (44).Wang B; Ogilby PR Activation barriers for oxygen diffusion in polystyrene and polycarbonate glasses: effects of codissolved argon, helium, and nitrogen. Canadian Journal of Chemistry 1995, 73 (11), 1831–1840. DOI: 10.1139/v95-226 (acccessed 2021/08/03). [DOI] [Google Scholar]
- (45).Buchwald P FEM-based oxygen consumption and cell viability models for avascular pancreatic islets. Theoretical Biology and Medical Modelling 2009, 6 (1), 5. [DOI] [PMC free article] [PubMed] [Google Scholar]
- (46).Wagner BA; Venkataraman S; Buettner GR The Rate of Oxygen Utilization by Cells. Free radical biology & medicine 2011, 51 (3), 700–712. [DOI] [PMC free article] [PubMed] [Google Scholar]
- (47).Oprea-Lager DE; van Kanten MP; van Moorselaar RJA; van den Eertwegh AJM; van de Ven PM; Bijnsdorp IV; Hoekstra OS; Geldof AA [18F]fluoromethylcholine as a chemotherapy response read-out in prostate cancer cells. Molecular Imaging and Biology 2015, 17 (3), 319–327. [DOI] [PubMed] [Google Scholar]
- (48).Suhaimi H; Wang S; Das DB Glucose diffusivity in cell culture medium. Chemical Engineering Journal 2015, 269, 323–327. [Google Scholar]
- (49).van Stroe-Biezen SAM; Everaerts FM; Janssen LJJ; Tacken RA Diffusion coefficients of oxygen, hydrogen peroxide and glucose in a hydrogel. Analytica Chimica Acta 1993, 273 (1), 553–560. [Google Scholar]
- (50).Vulto P; Podszun S; Meyer P; Hermann C; Manz A; Urban GA Phaseguides: a paradigm shift in microfluidic priming and emptying. Lab on a Chip 2011, 11 (9), 1596–1602, 10.1039/C0LC00643B. DOI: 10.1039/C0LC00643B. [DOI] [PubMed] [Google Scholar]
- (51).Garbarino F; Kistrup K; Rizzi G; Hansen MF Burst pressure of phaseguide structures of different heights in all-polymer microfluidic channels. Journal of Micromechanics and Microengineering 2017, 27 (12), 125015. DOI: 10.1088/1361-6439/aa97b7. [DOI] [Google Scholar]
- (52).Curtis A; Cheng JJ; Hui EE Cell patterning by surface tension pinning in microfluidic channels. Biomicrofluidics 2020, 14 (2), 024102–024102. DOI: 10.1063/1.5140990 PubMed. [DOI] [PMC free article] [PubMed] [Google Scholar]
- (53).Guckenberger DJ; de Groot TE; Wan AMD; Beebe DJ; Young EWK Micromilling: a method for ultra-rapid prototyping of plastic microfluidic devices. Lab on a chip 2015, 15 (11), 2364–2378. DOI: 10.1039/c5lc00234f PubMed. [DOI] [PMC free article] [PubMed] [Google Scholar]
- (54).Yen DP; Ando Y; Shen K A cost-effective micromilling platform for rapid prototyping of microdevices. Technology (Singap World Sci) 2016, 4 (4), 234–239. DOI: 10.1142/S2339547816200041 PubMed. [DOI] [PMC free article] [PubMed] [Google Scholar]
- (55).Carugo D; Lee JY; Pora A; Browning RJ; Capretto L; Nastruzzi C; Stride E Facile and cost-effective production of microscale PDMS architectures using a combined micromilling-replica moulding (μMi-REM) technique. Biomedical microdevices 2016, 18 (1), 4–4. DOI: 10.1007/s10544-015-0027-x PubMed. [DOI] [PMC free article] [PubMed] [Google Scholar]
- (56).Harnett EM; Alderman J; Wood T The surface energy of various biomaterials coated with adhesion molecules used in cell culture. Colloids and Surfaces B: Biointerfaces 2007, 55 (1), 90–97. DOI: 10.1016/j.colsurfb.2006.11.021. [DOI] [PubMed] [Google Scholar]
- (57).Mertes P-M; Collange O; Coliat P; Banerjee M; Diringer M-C; Roche A; Delabranche X; Chaban V; Voegelin M; Bernard A; et al. Liposomal encapsulation of trans-crocetin enhances oxygenation in patients with COVID-19-related ARDS receiving mechanical ventilation. Journal of Controlled Release 2021, 336, 252–261. DOI: 10.1016/j.jconrel.2021.06.033. [DOI] [PMC free article] [PubMed] [Google Scholar]
- (58).Pewklang T; Wet-osot S; Wangngae S; Ngivprom U; Chansaenpak K; Duangkamol C; Lai R-Y; Noisa P; Sukwattanasinitt M; Kamkaew A Flavylium-Based Hypoxia-Responsive Probe for Cancer Cell Imaging. Molecules 2021, 26 (16), 4938. [DOI] [PMC free article] [PubMed] [Google Scholar]
- (59).Piao W; Tsuda S; Tanaka Y; Maeda S; Liu F; Takahashi S; Kushida Y; Komatsu T; Ueno T; Terai T; et al. Development of Azo-Based Fluorescent Probes to Detect Different Levels of Hypoxia. Angewandte Chemie International Edition 2013, 52 (49), 13028–13032. DOI: 10.1002/anie.201305784. [DOI] [PubMed] [Google Scholar]
- (60).Sadlecki P; Bodnar M; Grabiec M; Marszalek A; Walentowicz P; Sokup A; Zegarska J; Walentowicz-Sadlecka M The role of Hypoxia-inducible factor-1 α , glucose transporter-1, (GLUT-1) and carbon anhydrase IX in endometrial cancer patients. Biomed Res Int 2014, 2014, 616850–616850. DOI: 10.1155/2014/616850 PubMed. [DOI] [PMC free article] [PubMed] [Google Scholar]
- (61).Zhang J-Z; Behrooz A; Ismail-Beigi F Regulation of glucose transport by hypoxia. American Journal of Kidney Diseases 1999, 34 (1), 189–202. DOI: 10.1016/S0272-6386(99)70131-9. [DOI] [PubMed] [Google Scholar]
- (62).Johnson CA; Kilpatrick D; Roemeling R. v.; Langer C; Graham MA; Greenslade D; Kennedy G; Keenan E; O’Dwyer PJ Phase I trial of tirapazamine in combination with cisplatin in a single dose every 3 weeks in patients with solid tumors. Journal of Clinical Oncology 1997, 15 (2), 773–780. DOI: 10.1200/jco.1997.15.2.773. [DOI] [PubMed] [Google Scholar]
- (63).Zeman EM; Brown JM; Lemmon MJ; Hirst VK; Lee WW SR-4233: A new bioreductive agent with high selective toxicity for hypoxic mammalian cells. International Journal of Radiation Oncology*Biology*Physics 1986, 12 (7, Part 1), 1239–1242. DOI: 10.1016/0360-3016(86)90267-1. [DOI] [PubMed] [Google Scholar]
- (64).Carvalho MR; Barata D; Teixeira LM; Giselbrecht S; Reis RL; Oliveira JM; Truckenmüller R; Habibovic P Colorectal tumor-on-a-chip system: A 3D tool for precision onco-nanomedicine. Science Advances 2019, 5 (5), eaaw1317. DOI: doi: 10.1126/sciadv.aaw1317. [DOI] [PMC free article] [PubMed] [Google Scholar]
- (65).Ayuso JM; Rehman S; Virumbrales-Munoz M; McMinn PH; Geiger P; Fitzgerald C; Heaster T; Skala MC; Beebe DJ Microfluidic tumor-on-a-chip model to evaluate the role of tumor environmental stress on NK cell exhaustion. Science Advances 2021, 7 (8), eabc2331. DOI: 10.1126/sciadv.abc2331. [DOI] [PMC free article] [PubMed] [Google Scholar]
- (66).Leek R; Grimes DR; Harris AL; McIntyre A Methods: Using Three-Dimensional Culture (Spheroids) as an In Vitro Model of Tumour Hypoxia. Adv Exp Med Biol 2016, 899, 167–196. DOI: 10.1007/978-3-319-26666-4_10 From NLM. [DOI] [PubMed] [Google Scholar]
- (67).Kim HN; Habbit NL; Su C-Y; Choi N; Ahn EH; Lipke EA; Kim D-H Microphysiological Systems as Enabling Tools for Modeling Complexity in the Tumor Microenvironment and Accelerating Cancer Drug Development. Advanced Functional Materials 2019, 29 (22), 1807553. DOI: 10.1002/adfm.201807553. [DOI] [Google Scholar]
- (68).LeSavage BL; Suhar RA; Broguiere N; Lutolf MP; Heilshorn SC Next-generation cancer organoids. Nature Materials 2022, 21 (2), 143–159. DOI: 10.1038/s41563-021-01057-5. [DOI] [PubMed] [Google Scholar]
- (69).Sharma H; Nguyen D; Chen A; Lew V; Khine M Unconventional Low-Cost Fabrication and Patterning Techniques for Point of Care Diagnostics. Annals of Biomedical Engineering 2011, 39 (4), 1313–1327. DOI: 10.1007/s10439-010-0213-1. [DOI] [PMC free article] [PubMed] [Google Scholar]
- (70).Nguyen H-T; Thach H; Roy E; Huynh K; Perrault CM-T Low-Cost, Accessible Fabrication Methods for Microfluidics Research in Low-Resource Settings. Micromachines (Basel) 2018, 9 (9), 461. DOI: 10.3390/mi9090461 PubMed. [DOI] [PMC free article] [PubMed] [Google Scholar]
- (71).Kane KIW; Moreno EL; Hachi S; Walter M; Jarazo J; Oliveira MAP; Hankemeier T; Vulto P; Schwamborn JC; Thoma M; et al. Automated microfluidic cell culture of stem cell derived dopaminergic neurons. Scientific Reports 2019, 9 (1), 1796. DOI: 10.1038/s41598-018-34828-3. [DOI] [PMC free article] [PubMed] [Google Scholar]
- (72).Schuster B; Junkin M; Kashaf SS; Romero-Calvo I; Kirby K; Matthews J; Weber CR; Rzhetsky A; White KP; Tay S Automated microfluidic platform for dynamic and combinatorial drug screening of tumor organoids. Nature Communications 2020, 11 (1), 5271. DOI: 10.1038/s41467-020-19058-4. [DOI] [PMC free article] [PubMed] [Google Scholar]
- (73).Tong A; Pham QL; Shah V; Naik A; Abatemarco P; Voronov R Automated Addressable Microfluidic Device for Minimally Disruptive Manipulation of Cells and Fluids within Living Cultures. ACS Biomaterials Science & Engineering 2020, 6 (3), 1809–1820. DOI: 10.1021/acsbiomaterials.9b01969. [DOI] [PubMed] [Google Scholar]
- (74).Vaupel P; Kallinowski F; Okunieff P Blood flow, oxygen and nutrient supply, and metabolic microenvironment of human tumors: a review. Cancer Res 1989, 49 (23), 6449–6465. From NLM. [PubMed] [Google Scholar]
- (75).Airley R; Loncaster J; Davidson S; Bromley M; Roberts S; Patterson A; Hunter R; Stratford I; West C Glucose transporter glut-1 expression correlates with tumor hypoxia and predicts metastasis-free survival in advanced carcinoma of the cervix. Clin Cancer Res 2001, 7 (4), 928–934. From NLM. [PubMed] [Google Scholar]
- (76).Hoskin PJ; Sibtain A; Daley FM; Wilson GD GLUT1 and CAIX as intrinsic markers of hypoxia in bladder cancer: relationship with vascularity and proliferation as predictors of outcome of ARCON. British Journal of Cancer 2003, 89 (7), 1290–1297. DOI: 10.1038/sj.bjc.6601260. [DOI] [PMC free article] [PubMed] [Google Scholar]
- (77).Isoda T; Engles J; Wahl R Hypoxia marker pimonidazole accumulation and glucose transporter-1 expression are strongly correlated in rodent breast cancers. Journal of Nuclear Medicine 2010, 51 (supplement 2), 1101–1101. [Google Scholar]
- (78).Chung F-Y; Huang M-Y; Yeh C-S; Chang H-J; Cheng T-L; Yen L-C; Wang J-Y; Lin S-R GLUT1 gene is a potential hypoxic marker in colorectal cancer patients. BMC Cancer 2009, 9, 241–241. DOI: 10.1186/1471-2407-9-241 PubMed. [DOI] [PMC free article] [PubMed] [Google Scholar]
- (79).Sørensen BS; Hao J; Overgaard J; Vorum H; Honoré B; Alsner J; Horsman MR Influence of oxygen concentration and pH on expression of hypoxia induced genes. Radiotherapy and Oncology 2005, 76 (2), 187–193. DOI: 10.1016/j.radonc.2005.06.037 (acccessed 2021/11/01). [DOI] [PubMed] [Google Scholar]
- (80).Achalandabaso Boira M; Di Martino M; Gordillo C; Adrados M; Martín-Pérez E GLUT-1 as a predictor of worse prognosis in pancreatic adenocarcinoma: immunohistochemistry study showing the correlation between expression and survival. BMC Cancer 2020, 20 (1), 909. DOI: 10.1186/s12885-020-07409-9. [DOI] [PMC free article] [PubMed] [Google Scholar]
- (81).Begum HM; Ta HP; Zhou H; Ando Y; Kang D; Nemes K; Mariano CF; Hao J; Yu M; Shen K Spatial Regulation of Mitochondrial Heterogeneity by Stromal Confinement in Micropatterned Tumor Models. Scientific Reports 2019, 9 (1), 11187. DOI: 10.1038/s41598-019-47593-8. [DOI] [PMC free article] [PubMed] [Google Scholar]
- (82).Marx V Method of the Year: spatially resolved transcriptomics. Nature Methods 2021, 18 (1), 9–14. DOI: 10.1038/s41592-020-01033-y. [DOI] [PubMed] [Google Scholar]
- (83).Lundberg E; Borner GHH Spatial proteomics: a powerful discovery tool for cell biology. Nat Rev Mol Cell Biol 2019, 20 (5), 285–302. DOI: 10.1038/s41580-018-0094-y From NLM. [DOI] [PubMed] [Google Scholar]
- (84).Erapaneedi R; Belousov VV; Schäfers M; Kiefer F A novel family of fluorescent hypoxia sensors reveal strong heterogeneity in tumor hypoxia at the cellular level. EMBO J 2016, 35 (1), 102–113. DOI: 10.15252/embj.201592775 PubMed. [DOI] [PMC free article] [PubMed] [Google Scholar]
- (85).Li Z-Y; Shi Y-L; Liang G-X; Yang J; Zhuang S-K; Lin J-B; Ghodbane A; Tam M-S; Liang Z-J; Zha Z-G; et al. Visualization of GLUT1 Trafficking in Live Cancer Cells by the Use of a Dual-Fluorescence Reporter. ACS Omega 2020, 5 (26), 15911–15921. DOI: 10.1021/acsomega.0c01054. [DOI] [PMC free article] [PubMed] [Google Scholar]
- (86).Sahai E; Astsaturov I; Cukierman E; DeNardo DG; Egeblad M; Evans RM; Fearon D; Greten FR; Hingorani SR; Hunter T; et al. A framework for advancing our understanding of cancer-associated fibroblasts. Nature Reviews Cancer 2020, 20 (3), 174–186. DOI: 10.1038/s41568-019-0238-1. [DOI] [PMC free article] [PubMed] [Google Scholar]
- (87).Gajewski TF; Schreiber H; Fu Y-X Innate and adaptive immune cells in the tumor microenvironment. Nature immunology 2013, 14 (10), 1014–1022. DOI: 10.1038/ni.2703 PubMed. [DOI] [PMC free article] [PubMed] [Google Scholar]
- (88).Ayuso JM; Truttschel R; Gong MM; Humayun M; Virumbrales-Munoz M; Vitek R; Felder M; Gillies SD; Sondel P; Wisinski KB; et al. Evaluating natural killer cell cytotoxicity against solid tumors using a microfluidic model. OncoImmunology 2019, 8 (3), 1553477. DOI: 10.1080/2162402X.2018.1553477. [DOI] [PMC free article] [PubMed] [Google Scholar]
Associated Data
This section collects any data citations, data availability statements, or supplementary materials included in this article.