Abstract
The application of the exciton chirality method (ECM) to interpret electronic circular dichroism (ECD) spectra is a well‐established and still popular approach to assign the absolute configuration (AC) of natural products, chiral organic compounds, and organometallic species. The method applies to compounds containing at least two chromophores with electric dipole allowed transitions (e.g., π–π* transitions). The exciton chirality rule correlates the sign of an exciton couplet (two ECD bands with opposite sign and similar intensity) with the overall molecular stereochemistry, including the AC. A correct application of the ECM requires three main prerequisites: (a) the knowledge of the molecular conformation, (b) the knowledge of the directions of the electric transition moments (TDMs), and (c) the assumption that the exciton coupling mechanism must be the major source of the observed ECD signals. All these prerequisites can be easily verified by means of quantum‐mechanical (QM) calculations. In the present review, we shortly introduce the general principles that underpin the use of the ECM for configurational assignments and survey its applications, both classic ones and some reported in the recent literature. Based on these examples, we will stress the advantages of the ECM but also the key requisites for its correct application. Additionally, we will discuss the dependence of the couplet sign on geometrical parameters (angles α,β,γ between TDMs), which can be helpful for discerning the sign of exciton chirality in ambiguous situations. Finally, we will present a molecular orbital (MO) description of the exciton coupling phenomenon.
Keywords: absolute configuration, electric transition dipole moment, electronic circular dichroism, exciton coupling, molecular conformation, TD‐DFT calculations
1. INTRODUCTION
Chirality is omnipresent in life and related processes. The fraction of products extracted from natural sources containing one or more stereogenic elements is above 80%. 1 Pharmaceutically active compounds, either derived from natural products or synthesized ex novo, are chiral in over 60% cases. 1 It is also very well known that different stereoisomers of chiral substances, including enantiomers, very often display different pharmacology, ADME (absorption, distribution, metabolism, excretion), and toxicology. 2 As a consequence, a complete stereochemical elucidation, including the assignment of the absolute configuration (AC), is a necessary requirement in natural products isolation and drug discovery. By far, the most accurate method for assigning ACs is x‐ray diffraction. 3 , 4 , 5 This method is however restricted to crystalline materials of compounds containing “heavy” elements, that is, exhibiting strong enough anomalous dispersion.
Chiroptical methods are a family of spectroscopic techniques based on the interaction between chiral, non‐racemic matter with circularly polarized light. 6 , 7 In the context of AC assignment of natural products, the most popular methods are optical rotation (OR), electronic circular dichroism (ECD or simply CD), vibrational CD (VCD), and Raman optical activity (ROA). Nowadays, all these quantities can be calculated by quantum‐mechanical (QM) means with good accuracy and acceptable computational cost for medium‐size molecule. 8 Therefore, the comparison between experimental and calculated spectra has become the most popular approach for assigning the AC of natural products, either using a single technique or a combination thereof. 9 , 10 , 11 , 12 , 13 This computational approach is apparently very immediate and easily available to nonexperts. However, caution must be put in the choice of the correct calculation method. 14 Another critical point is the correspondence between the input geometries and the actual conformational ensemble. For that reason, an efficient and accurate conformational analysis is imperative, based also on experimental data. 14 , 15
Despite the advancement and increasing popularity of QM calculations, there are several means available for interpreting chiroptical spectra that are able to provide AC assignments without calculations; this is especially true for ECD. 16 The most important of such approaches is represented by the exciton chirality method (ECM). The theoretical basis of ECM lies in the concepts of exciton coupling, coupled oscillators, and group polarizability, which were developed by Davydov, Kuhn, and Kirkwood. 17 , 18 , 19 The first application of these concepts to organic stereochemistry was provided by Mason. 20 However, only after the report of the dibenzoate chirality rule by Harada and Nakanishi for compounds containing a diol moiety convertible into a bis(benzoate), 21 a general protocol was established for the assignment of ACs by the ECM. Then, the method was extended to compounds with different skeletons and functionalities 22 , 23 and eventually applied by Berova, Nakanishi, Harada, and several other authors to a huge amount of diverse natural compounds and other substrates, 24 , 25 , 26 , 27 , 28 , 29 , 30 , 31 including metal coordination compounds. 32 , 33
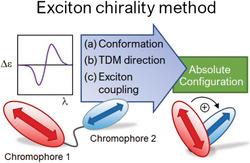
In essence, ECM applies to a chiral molecule containing two or more separate (i.e., nonconjugated) chromophores undergoing electric‐dipole allowed electronic transitions (Figure 1). If a compound lacks the necessary chromophore(s), one may select among a whole family of derivatizing agents to be covalently linked to the chiral skeleton; by a proper choice thereof, the detection limit of exciton‐coupled ECD spectra may be lowered down to sub‐μg, or even below if detected in emission by fluorescence‐detected CD (FDCD). 34 , 35 If the chromophores, or—more accurately—the electric transition dipole moments (TDMs) are properly arranged with respect to each other, the molecule will display an ECD spectrum characterized by an exciton couplet, which arises from the through‐space exciton coupling between the TDMs. The couplet consists of two bands of opposite sign and similar intensity. If the two coupling transitions are the same, occurring on two equal chromophores, exciton coupling is said to be degenerate (degenerate exciton coupling [DEC]) and the couplet crossover point (i.e., where it crosses the CD baseline) occurs in correspondence of the chromophore UV maxima. Otherwise, for energetically separated transitions, one will observe two separated ECD bands, each in correspondence with one UV maximum; in this case, nondegenerate exciton coupling (NDEC) occurs. The ECD couplet has a sign, defined as the same of the long‐wavelength component (Figure 1). This sign correlates with the absolute angle of twist defined by the two TDMs in a way summarized by the so‐called exciton chirality rule: A positive couplet signifies that the two TDMs define a positive chirality, that is, when viewed along the line connecting the dipoles, one would need a clockwise rotation to move from the dipole in the front onto that in the back (Figure 1). The chirality defined by the TDMs is therefore a consequence of both the molecule AC and the molecular conformation. If a good molecular model is available, which is not always an easy piece of information to obtain, looking at the ECD spectrum will provide an immediate AC assignment. Moreover, contrary to other methods for chiroptical analysis used in the past and now faded out, such as many sector rules, 6 ECM is not empirical in nature as it is based on a well‐established theoretical basis. 4 , 7 , 22
FIGURE 1.
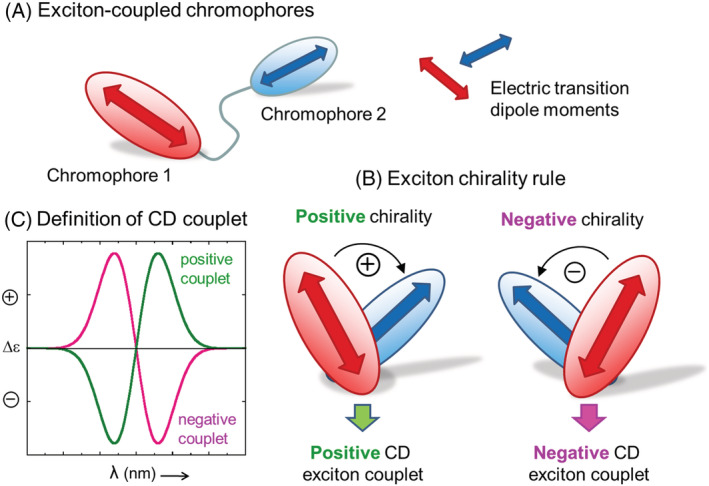
(A) Schematic representation of two exciton‐coupled chromophores undergoing electric dipole allowed transitions and their transition dipole moments (TDMs). (B) Definition of CD exciton couplet and its sign. (C) Formulation of the exciton chirality rule
The combination of the aforementioned qualities makes the ECM still often employed in the AC assignment of natural products and other compounds, despite today's prevalence of QM calculations. This is demonstrated by the already quoted reviews that extend up to 2017, 25 , 26 , 27 , 28 , 29 , 30 , 31 and by several other papers appeared in the meanwhile. 36 , 37 , 38 , 39 , 40 , 41 , 42 , 43 , 44 , 45 , 46 , 47 , 48 , 49 , 50 , 51 , 52 In the present review, we will deal in particular with compounds already containing two or more chromophores, or covalently derivatized therewith; however, it is worth mentioning that AC assignments based on ECM are also possible through supramolecular non‐covalent approaches 53 or by the use of various dynamic probes. 54
The aim of the present contribution is not to cover exhaustively the recent literature about ECM, but to use selected examples to discuss in a critical and illustrative way the principles and prerequisites that need to be met for a correct application of the ECM. These latter include:
the knowledge of the molecular conformation, that is, the spatial relationship between coupled chromophores and the presence or absence of any conformational ambiguity;
the knowledge of transition moment direction within each chromophore;
the confidence that the ECM dominates the ECD spectrum, that is, that other mechanisms of optical activity (intrinsic chirality due to chromophore distortion or conjugation between chromophores) can be excluded.
We will use the same lettered list (a)–(c) several times in the following, that is, any time that these prerequisites will be involved in the discussion. ECM should not be applied unless all these pieces of information have been collected and all prerequisites met. If not, its application is not justified and may lead to the correct AC assignment just fortuitously or lead to incorrect AC assignments. In the last years, we have demonstrated that both situations occurred in many recent literature reports, 36 , 37 , 38 , 55 and several other cases will be discussed in this review. This is especially inconvenient nowadays because simple QM calculations, without resorting to full and costly ECD calculations, may easily provide the desired information. Using both “classic” and recent examples, we will emphasize which are, and how to meet, the necessary criteria for a safe and accurate application of the ECM, which might compete in reliability with QM ECD calculations. Additionally, we will discuss the geometrical dependence of the couplet sign on the reciprocal arrangement of TDMs in a quantitative way. Finally, we will present a molecular orbital (MO) description of the ECM phenomenon.
2. CRITERIA AND PREREQUISITES FOR A CORRECT APPLICATION OF THE ECM
In order to apply the ECM to assign the AC of any compound, this latter must contain two or more chromophores, giving rise to electric‐dipole allowed electronic transitions. The chromophores must be (relatively) close in space but not conjugated with each other or involved in charge‐transfer transitions. The ECD spectrum should contain a diagnostic ECD couplet (defined above; see Figure 1), or at least one of its components should be clearly recognized (normally its long‐wavelength one). At first sight, one may expect that these facts can be simply assessed by looking at the molecular diagram and ECD spectrum. At this point, the three‐dimensional (3D) molecular structure comes into play, because one must establish the chirality defined by the two transition dipole moments to correlate it with the ECD couplet sign.
Knowing the molecular structure requires the molecular conformation to be established by a combination of molecular modeling and experimental techniques. Only on some occasions can this step be skipped, for example, for conformationally restricted compounds where the reciprocal arrangement between chromophores is unambiguous. In general, however, the conformational ensemble needs to be investigated, and all the relevant conformers determined, that is, those bringing the largest contribution to the experimental ECD spectrum. This concept attains to requisite (a) of our lettered list.
Once the conformation(s) is (are) known, one must correctly “put” in place each transition dipole within the respective chromophore. This requires the direction of TDMs within each chromophore be known in advance; otherwise, it must be established before applying the ECM (requisite (b) of the list).
Finally, one must correlate the experimental ECD spectrum with the exciton coupling between the chromophores. This necessitates, first of all, a safe identification of the ECD couplet. Second, one must assume that the ECD spectrum is actually dominated by the exciton coupling mechanism, whereas other sources of ECD signals are negligible (requisite (c) of the list).
None of the steps above is trivial, and the importance of correctly assessing all of them is easily overlooked by nonexperts. Application of ECM is possibly immediate and straightforward, and for the very same reason prone to errors. In the following sections, we will analyze how the prerequisites (a)–(c) listed above were—or were not—accounted for in some classic cases and in recent examples of application of the ECM.
3. OVERVIEW OF SELECTED ECM APPLICATIONS
In this section, we will overview selected applications of the ECM to organic compounds. Our classification in Sections 3.1, 3.3 will be based on the nature of the main chromophore(s) responsible for exciton‐coupled ECD spectra. The reason for this choice is because requisites (b) and (c) depend largely, if not exclusively, on the type of the chromophore(s). Conformational issues (requisite (a)) will be recalled several times in Sections 3.1, 3.4 and treated more in detail in Section 3.5.
3.1. Exciton coupling between aromatic chromophores
Aromatic chromophores such as benzene and naphthalene derivatives undergo π–π* transitions, which are often amenable to exciton chirality treatment in a straightforward way, because the orientation of TDMs is well known by previous studies and/or dictated by the chromophore symmetry. This is not necessarily true for any aromatic chromophore, though. We will discuss first two classic applications of ECM to bis(benzoates) and biaryls and then a recent example of apparently incorrect application of the ECM leading to a wrong AC assignment.
3.1.1. Bis(benzoates)
The first historical and most classic example of application of the ECM is that of steroidal bis(benzoates) (1). 21 , 22 These compounds are ideal because all requisites mentioned above are fully met:
The polycyclic steroidal skeleton assures a certain rigidity of the system, so the only possible degree of conformational freedom is around the ester linkage, which is well established (Figure 2) 21 , 22 ;
The p‐substituted benzoate chromophore is well characterized; the most important electronic π–π* transition occurs at 230–300 nm, and it is polarized along the long axis of the chromophore (Scheme 1), 22 which has an effective C2v symmetry. A short‐axis transition occurs too, but it is weaker than long‐axis one, that is, its transition dipole is smaller. Moreover, because of the partially allowed rotation around the C–O bond, any transverse transition concurs less efficiently to the exciton coupling 56 ;
The CD spectrum of 1 is by far dominated by the exciton coupling between the two benzoates. In fact, steroidal mono‐benzoates have much weaker CD spectra. 22
FIGURE 2.
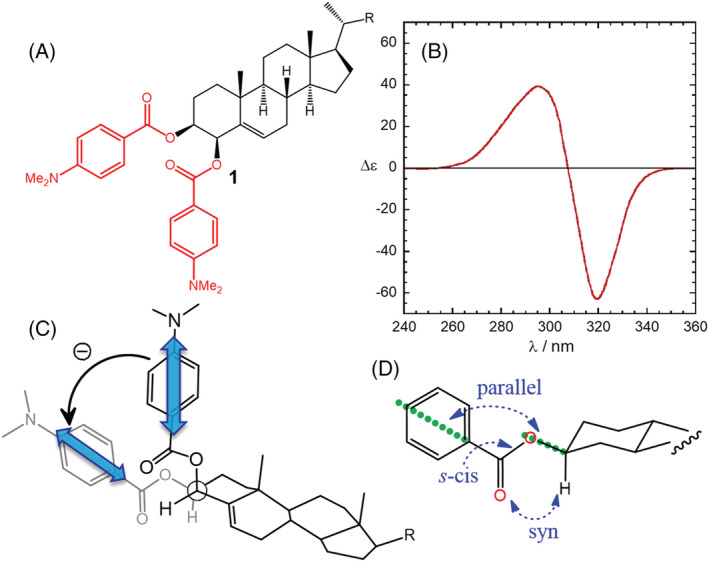
Application of the ECM to cholest‐5‐ene‐3β,4β‐diol bis(p‐dimethylaminobenzoate) (1). (A,B) Diagram and ECD spectrum (ethanol) showing a negative exciton couplet. Adapted with permission from ref. 57 Copyright 1974 American Chemical Society. (C) Negative helicity defined by the two transition dipoles. (D) Preferential conformation around each ester bond
SCHEME 1.
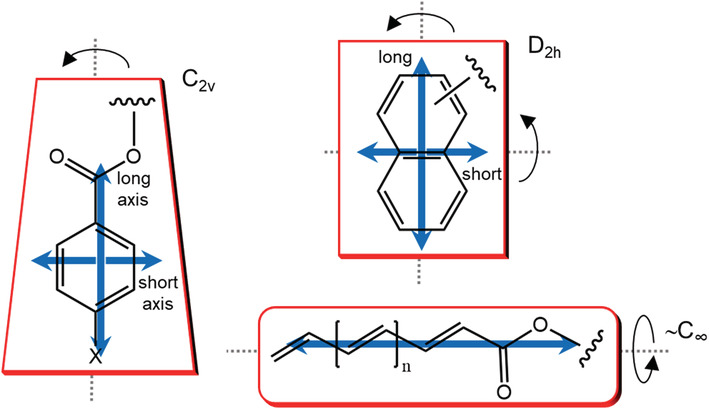
Privileged chromophores for ECM applications. Blue double arrows represent the possible orientation of transition dipole moment according to the related effective symmetry, whose “shape” is suggested by red frames; the main symmetry elements are indicated by dotted lines and curved arrows
Summarizing, with compounds like 1, (a) there is no conformational ambiguity; (b) the transition dipole direction is known without any doubt; (c) other possible sources of ECD signals do not interfere with the exciton coupling. Such advantages make the benzoate groups ideal chromophores in the so‐called derivatization strategy, that is, when the compound lacks suitable chromophores for exciton coupling but these latter can be easily introduced by chemical derivatization. By choosing a proper substituent X at the para position of the p‐X‐C6H4‐COO− moiety, the wavelength maximum of the main π–π* transition may be modulated from 229 nm (X = H) to 244 nm (X = Br) and 257 nm (X = OMe), up to 307 nm (X = NMe2, data in methanol). 22 , 24 In all such cases, the effective C2v symmetry is preserved. The possibility of tuning the chromophore transition wavelength allows one to select the most suitable region of the spectrum to observe the diagnostic couplet, which is especially useful to avoid interference from preexisting chromophores. In that respect, several derivatizing agents have been developed for hydroxy and amino groups aimed at the introduction of redshifted chromophores. 29 , 58 , 59 One of them is based on tetraarylporphyrins (Section 3.1.4).
3.1.2. Biaryls: 1,1′‐Binaphthyls
A second wide family of compounds for which the exciton coupling mechanism is known to work remarkably well is that of biaryls, of which 1,1′‐binaphthyls (2) are a significant example. 60 In these compounds, requisites (b) and (c) mentioned above are again fully met. The naphthalene chromophore has D2h symmetry and undergoes a long‐axis π–π* transition around 220 nm, which gives rise to a strong ECD couplet in 1,1′‐binaphthyls (Figure 3). The short‐axis π–π* transition at 280 nm is weaker, and its coupling is negligible in 2 because two such transitions lie parallel to each other. From the viewpoint of exciton coupling, C2v‐ and D2h‐symmetric chromophores behave similarly (Scheme 1). Concerning requisite (a), the only degree of conformation freedom is the rotation around the 1,1′‐bond, which is rather free for dihedral angles between 60° and 110°. This axis of chirality is in fact the only stereogenic element in 1,1′‐binaphthyls. The value assumed by the dihedral angle is the major factor influencing ECD spectra, and, conversely, ECD spectra are good reporters of the absolute geometry around that axis. 61 , 62
FIGURE 3.
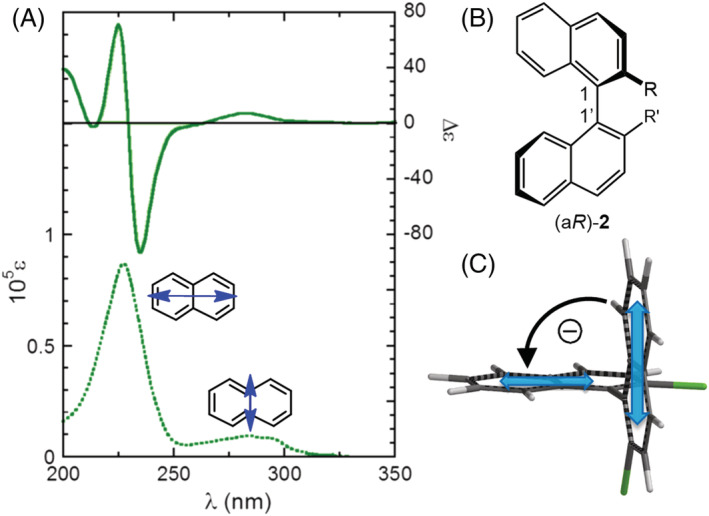
Application of the ECM to 1,1′‐binaphthyls (2). (A,B) Diagram and ECD spectrum of (aR)‐2,2′‐bis(chloromethyl)‐1,1′‐binaphthalene (R = CH2Cl, acetonitrile) showing a negative exciton couplet in the region of the long‐axis transition. (C) Chirality defined by the two transition dipoles: A negative chirality (and couplet) is found for (aR) axial chirality
Recent applications of ECM to biaryl compounds include bis(indole) alkaloids 63 and BODIPY dimers, 64 , 65 though these latter are complicated by the fact that the major π–π* transition around 500 nm is also magnetically dipole allowed.
3.1.3. Benzene derivatives with different substitution patterns
In p‐substituted benzoates and naphthalene derivatives, the orientation of the TDMs is dictated by the chromophore C2v or D2h symmetry. However, benzene derivatives with different substitution patterns may lack any axial symmetry element, so their π–π* transitions may assume any orientation in the ring. Before applying the ECM, it is thus compulsory to know or study the exact orientation of the TDM. The classic study by Collet and Gottarelli on C 3‐cyclotriveratrylenes (3, Figure 4) demonstrated the dependence of ECD spectra on the nature of ring substituents. 66 , 67 The sign of the exciton couplets observed in correspondence with 1La and 1Lb transitions of the benzene chromophores is dictated by the orientation of the TDMs, which ultimately depends on X and Y. As an example, with Y=OMe, the 1Lb couplet is positive for X = OH and negative for X = OAc. A similar phenomenon occurs for chiral resorcin[4]arenes. 68
FIGURE 4.

Chiral cyclotriveratrylenes studied by Collet and coworkers. A tilt of 1Lb TDM in the direction of red arrow produces a negative couplet, and in the direction blue arrow a positive couplet in the 1Lb region, respectively
A more recent example will help us in demonstrating the importance of a correct assessment of TDM directions, that is, requisite (b) in our lettered list, in compounds containing complex benzene chromophores. The ferulic acid derivative ligusticumaldehyde A (4, Scheme 2) contains two aromatic rings that can be described as a 1,2‐dimethoxybenzene and a 3,4‐dimethoxybenzaldehyde (substituted dihydrobenzofuran ring). 69
SCHEME 2.
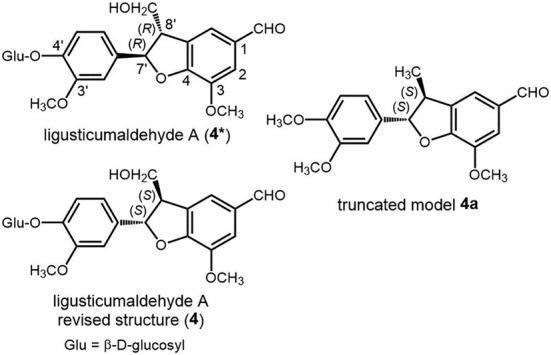
Diagram of the original structure of ligusticumaldehyde A (4*), its revised structure (4), and the truncated model used in our analysis (4a)
The ECD spectrum of 4 (Figure 5) shows various bands above 200 nm, two of which (at 232 and 297 nm) were interpreted as a positive exciton couplet arising from the NDEC between the two benzene chromophores. NDEC has been employed in several instances for AC assignments; 22 , 25 , 29 however, it needs extra caution because it is intrinsically weaker than DEC (see Section 3.2.2). In the case of compound 4, the ECD spectrum is indeed weak (|Δε| < 0.5 M−1 cm−1), which should itself warn against a simple exciton interpretation. To rationalize the hypothetical positive couplet in the ECD of 4, the authors used the molecular model shown in Figure 5B where the two straight arrows indicate the directions of the relevant TDMs. 69 However, the correct orientation of the 300‐nm transition of the 2,3‐dihydrobenzofuran‐5‐carbaldehyde moiety is not along the C‐2/C‐8′ direction, as depicted in Figure 5B, but rather along the C‐1/C‐4 direction, as depicted in Figure 5C (see Supporting Information, which contains the details about all calculations run purposely for the present review). This fact turns the positive chirality into a negative chirality, which is at odds with the observed couplet (if any). We must conclude that the absolute stereochemistry at C‐7′ and C‐8′ of ligusticumaldehyde A (4*) 69 is incorrect and it must be revised as 4 in Scheme 2. To confirm our structural revision, we run ECD calculations with time‐dependent density functional theory (TD‐DFT) on the truncated model 4a (Scheme 2), showing a good agreement with the experimental spectrum for the revised (7'S,8'S) configuration and featuring a positive exciton chirality between the relevant TDMs (Figure 5A,D). It must be stressed that in the case of compound 4, the issue related to TDM directions (requisite (b) in lettered list) is particularly critical because the relevant TDMs are almost coplanar in the significant conformation, meaning that a small rotation in TDM directions may reverse the exciton chirality. In similar situations, assignments based on simple drawings like in Figure 5B are very prone to errors; a numerical evaluation of the geometrical factor allied with exciton chirality is especially desirable in these cases (see Section 4.1). More in general, any aromatic chromophore devoid of symmetry axes should be subdued to QM calculations to ascertain the actual direction(s) of TDMs, before application of the ECM. 40 , 70 , 71
FIGURE 5.
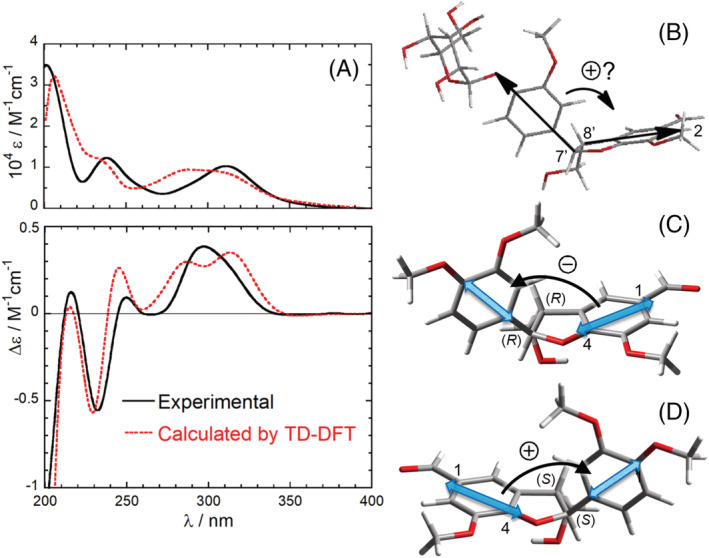
Application of the ECM and ECD calculations to ligusticumaldehyde A (4). (A) Experimental UV (top) and ECD (bottom) spectra (methanol) compared with the TD‐DFT calculated spectra for model (7'S,8'S)‐4a (this work). (B) Supposed positive helicity defined by the two transition dipoles for 4*. (C) Negative helicity defined by the two transition dipoles shown on the lowest energy conformer of (7'R,8'R)‐4a. The direction of the TDM on the right was established by TD‐DFT calculations on 7‐methoxy‐3‐methyl‐2,3‐dihydrobenzofuran‐5‐carbaldehyde. (D) Correct positive exciton chirality for the revised configuration (7'S,8'S)‐4a. Experimental spectra and panel (b) adapted from ref. 69 Copyright 2018, with permission from Elsevier. See Supporting Information for calculation details
3.1.4. Exciton coupling over large distances: Tetrarylporphyrins as “superbenzoates”
The use of tetraarylporphyrins as ECD reporter groups, which has been pioneered by Berova, Nakanishi, and coworkers, represents one of the most successful applications of the ECM in the last 25 years. The main advantage of using (tetraphenyl)porphyrin (TPP; Scheme 3) and its metal complexes (M‐TPP) as ECD probes is the redshifted and very intense UV‐Vis absorption, both in the Soret region (380–420 nm with ε = 400–450 000) and Q‐band region (500–600 nm), also accompanied by fluorescence emission. The redshifted position avoids interference from preexisting chromophores (see Section 3.1.1), while the high ε values and fluorescence emission allow for a highly diagnostic detection at very low concentrations (μM and below).
SCHEME 3.
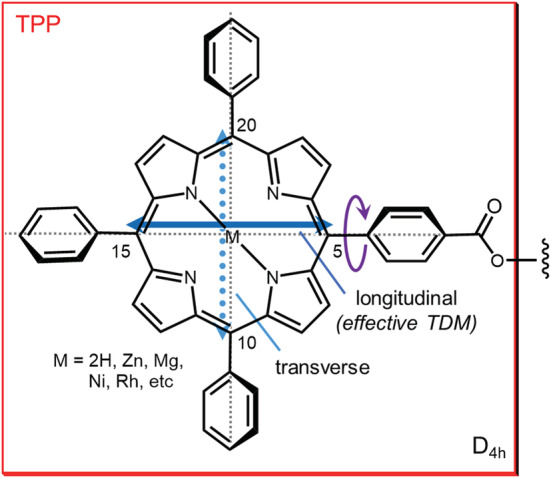
Tetraarylporphyrins as “superbenzoates.” The Soret band can be described as a circular oscillator arising from the combination of two orthogonal TDMs. Due to the libration depicted by the purple arrow, the transverse component couples less effectively, and the exciton coupling is dominated by the longitudinal component that behaves as the effective TDM
In our classification of privileged chromophores for ECM applications, TPP and M‐TPP may look anomalous. In fact, they belong (exactly or effectively) to D4h point group, meaning, for example, that the Soret transition, having Eu symmetry in the D4h point group, cannot be described in terms of a single TDM but rather as a circular oscillator, that is, the combination of two orthogonal TDMs oriented in the aromatic plane (Scheme 3). 56 At first sight, this fact would tremendously complicate the exciton analysis of chiral bis‐TPP derivatives, because one would need to consider four different exciton coupling terms. In fact, however, 5‐(4′‐carboxyphenyl)‐TPP (TPP‐COOH) or its metalated analogues can be used as an alternative to benzoate‐like ECD reporter groups for ECM analysis of chiral systems, as they behave for almost all intents as “superbenzoates.” 72 To understand the situation, one must consider the libration (wide‐amplitude rotation) around the C5‐phenyl bond in Scheme 3. Multiple evidence demonstrated that this dihedral angle may freely oscillate between 45° and 135°. 56 As a consequence, the magnitude of the transverse component of the Soret circular oscillator is reduced, and the strength of the exciton coupling involving this component is also reduced. Then, the exciton coupling between two TPP chromophores attached to a chiral skeleton, for example a chiral diol, will be dominated by the longitudinal components, which behave like a single “effective” TDM oriented parallel to the two C–O bonds, as in standard benzoates (Scheme 3). The advantage of using TPP or M‐TPP instead of benzoates or similar chromophores is obvious: The large ε values guarantee strong exciton couplet amplitudes, and the coupling may extend over large distances. This is spectacularly exemplified by the red‐tide toxin brevetoxin B. Here, two TPP groups were attached at the two extrema of the polyoxygenated polycyclic skeleton, lying at a final distance of 40–50 Å, yet enough to produce a weak exciton couplet in the ECD spectrum of derivative 5 (Scheme 4). 73 That such couplet is due to a real exciton coupling between the very distant TPP chromophores was proved later by TD‐DFT calculations. 74 Another noteworthy example is represented by gymnocin‐B, a second toxic marine polycyclic polyether. In this case, the distance between the two TPP chromophores of derivative 6 (Scheme 4) amounted to approximately 30 Å. 75 The synthesis of 6 called for the development of an efficient derivatization protocol for hindered secondary alcohols, also in light of the very low quantity of starting material. In the end, the ECD spectrum was collected using a sample of only 11 μg of 6.
SCHEME 4.
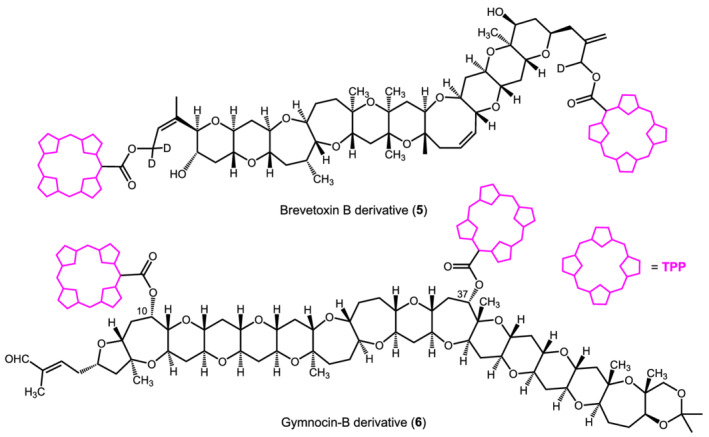
Diagrams of brevetoxin B (5) and gymnocin‐B (6) bis‐TPP derivatives analyzed by means of ECM by Berova, Nakanishi, and coworkers. ECD data for 5 (nm [Δε], (CH3OH/H2O 4:1)): 419 (+11), 414 (−15); for 6 (CH2Cl2): 421 (−6), 408 (+1). The estimated distance between the TPP chromophores is 40–50 Å for 5 and 29 Å for 6. 73 , 75
At this point, it is useful to look at the application of TPP probes from the viewpoint of the ECM prerequisites epitomized by our lettered list. The nature of Soret transitions is well established, including the effective TDM approximation (requisite (b)). The prevalence of exciton coupling as leading ECD mechanism is assured by the redshifted Soret bands (requisite (c)). Concerning requisite (a), any bis‐TPP derivative must of course be subject to a proper conformational investigation, as was indeed the case for both brevetoxin B and gymnocin‐B derivatives, using molecular mechanics and nuclear magnetic resonance (NMR).
Although not covered by the present review, it must be recalled here that tetraarylporphyrin ECD probes are especially useful in the form of “tweezers”: In this supramolecular approach, an achiral bis‐M‐TPP compound forms a 1:1 complex with a chiral analyte or a multifunctional derivative thereof. 76 , 77 , 78 , 79 The analyte chirality dictates the orientation assumed by the two TPP rings in the complex, which gives rise to an exciton couplet in the Soret region whose sign is correlated with the analyte AC.
3.2. Exciton coupling between polyenes, enones, and related systems
Enones and more extended conjugated systems (dienones, trienones, and so on) have been frequently considered in ECM applications. 22 Interestingly enough, the exciton coupling between a polyenone‐type chromophore (retinal) dominates the chiroptical signature of bacteriorhodopsin and related proteins. 80 , 81 , 82 The main electronic transition on these systems is the π–π* transition, which occurs at 260 nm in simple enones, but it is progressively shifted to longer wavelengths upon increasing the conjugation. However, endocyclic enones may be distorted from planarity and become, as it is said, intrinsically chiral or belonging to first‐sphere chirality. 83 Such intrinsically chiral chromophores have their own CD spectra, and exciton coupling may not be anymore the leading source of ECD signals (see below). A long polyene chain, on the contrary, will preserve its planarity more efficiently because of extended conjugation; moreover, it may be thought to have an effective cylindrical symmetry where any practically relevant transition is polarized along the axis (Scheme 1). Therefore, prerequisites (b) and (c) above are often well satisfied, and the only uncertainty remains the molecular conformation (a), which needs to be properly investigated.
3.2.1. Quasi‐degenerate coupling in polyenones
As an example of quasi‐degenerate exciton coupling in polyenone derivatives, we consider saturnispol A (7) isolated from marine‐derived Trichoderma saturnisporum. 39 This compound contains two trienone moieties: one extending from C‐1 to C‐14 (Figure 6) and the other from C‐8 to C‐23. The ECD spectrum of 7 displays a clear‐cut negative couplet around 360 nm, which can be safely attributed to the exciton coupling between the main π–π* transitions of the trienone chromophores. In fact, there are no other strong chromophores in the molecule. For the reasons explained above, there are no doubts about the direction of the relevant transition, which is long‐axis polarized. The fused polycyclic skeleton and the network of intramolecular hydrogen bonds impart rigidity to the whole structure, fixing the two trienones in a specific position. The molecular conformation of saturnispol A (7) was studied by conformational searches with molecular mechanics and geometry optimizations with density functional theory (DFT). Moreover, although not explicitly stated in the original publication, 39 it appears that measured nuclear Overhauser effect (NOE) correlations were rationalized looking at the energy‐minimized molecular models. The lowest energy structure was seemingly employed to assign the chirality between trienoate transition dipoles (Figure 6), thus establishing the AC in a correct way. This latter was also checked by running TD‐DFT calculations. Summing up, requisites (b) and (c) are fully satisfied for saturnispol A, and requisite (a) was also well complied with.
FIGURE 6.
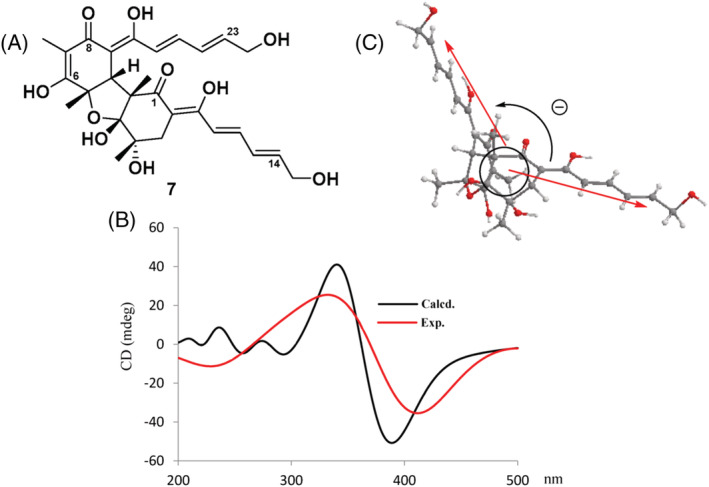
Application of the ECM to saturnispol A (7). (A,B) Diagram and ECD spectrum (in methanol; concentration and path length not reported) showing a negative exciton couplet. The black curve is the TD‐DFT‐calculated ECD (from the original paper). (C) Negative helicity defined by the two transition dipoles. Adapted from ref. 39
3.2.2. NDEC between enones
Nondegenerate exciton coupling (NDEC) may occur between any two different chromophores with suitable electric‐dipole allowed transition dipoles and properly arranged in space. However, there is a warning: NDEC is always weaker than the degenerate case 7 , 22 and may produce weak “couplets,” which can be easily overruled by other sources of ECD signals. This means that requisite (c) in our lettered list cannot be taken for granted. The larger the energy difference between the two chromophore transitions, the weaker will be their mutual exciton coupling. 22 With “weak” chromophores such as simple enones, a small difference in the substitution pattern may be enough to remove the degeneracy between two chromophores and convert a moderately strong DEC into a much weaker NDEC. Nakanishi et al. reported the well‐known case of quassin (8, Figure 7), a renowned insecticide, which contains two equivalent α‐methoxyenones, giving rise to a clear‐cut symmetrical positive exciton ECD couplet centered around 250 nm (Figure 7). 84 More recently, the AC of a novel quassinoid, perforalactone C (9), was again established by the ECM. 85 Here, however, the C‐11/C‐13 enone is not substituted at C‐12, and the degeneracy with the C‐1/C‐3 enone is removed. This is enough to reduce the exciton coupling strength to ~5% of the previous degenerate case. 38 In fact, the ECD spectrum of 9 shows only a faint couplet (Figure 7), which is actually due to other source of ECD signals (each enone chromophore in 9 is embedded in a chiral ring). This example emphasizes the importance of recognizing a diagnostic ECD couplet with no or little interference from other structural factors capable of generating CD signals of comparable strength, that is, point (c) in our list of prerequisites.
FIGURE 7.
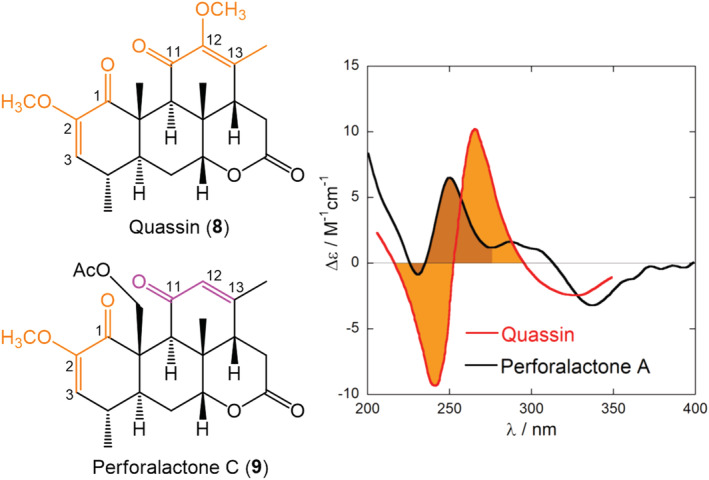
Diagram and ECD spectra (methanol) of quassin (8) and perforalactone (9) containing degenerate and nondegenerate enone systems, respectively. Adapted from ref. 38 Copyright 2017, with permission from Wiley
3.3. Elusive NDEC in allylic benzoates
It may happen that one of the two transitions involved in NDEC occurs at too high energy (or short wavelengths, <200 nm) to be observed. This is the case of the alkene π–π* transition, which is polarized along the double bond direction and normally occurs at 195 nm. Nonetheless, this transition may be excitonically coupled to a second transition, for example, a benzoate π–π* transition. In this situation, only one component of the “couplet” will be observed, but this may be sufficient to assign the chirality defined by transition dipoles and hence the AC. In fact, the allylic benzoate method (Figure 8), also developed by Harada and Nakanishi, has been applied in several instances in the past. 22 , 86 , 87 In this situation, because of the weak NDEC, other sources of ECD signals may interfere with the assignment: Therefore, one must be sure that the (only) visible ECD band is actually due to the exciton coupling mechanism (requisite (c) in our lettered list). Such a confidence may be gained only if the observed chromophore transitions are well known and safely identified (requisite (b) of the list), and it is reinforced by acquiring the data of several similar compounds. This is indeed the case of many allylic p‐substituted benzoates such as 10 whose ECD spectra were collected in time. 22 , 31 , 87
FIGURE 8.
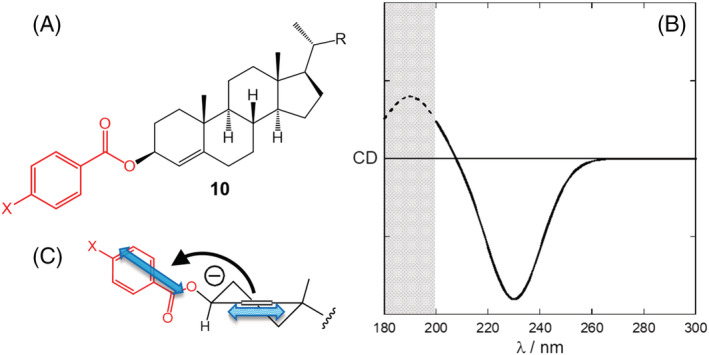
(A‐C) Allylic benzoate method applied to a cholest‐4‐en‐3β‐ol benzoates (10). The shaded region in (B) is normally not accessible experimentally or obscured by other bands. The spectrum is idealized; for cholest‐4‐en‐3β‐ol benzoate (X = H), the negative maximum has (nm [Δε], ethanol): 229.5 (−7)
3.3.1. Mistaken NDEC: Laucysteinamide A as an illustrative example
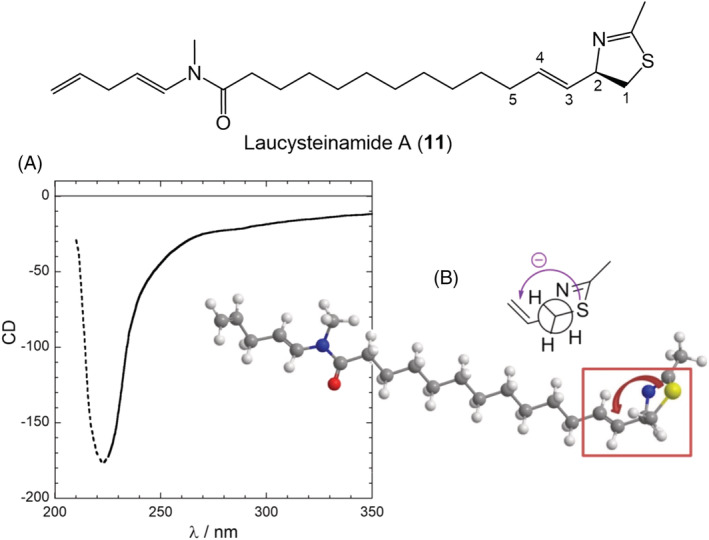
Because of the intrinsic weakness of the NDEC discussed above, special caution should be put when this mechanism is invoked and considered for AC assignment through the ECM. This is especially true when, as in the case of allylic benzoates, only one component of the “couplet” is apparent. This latter situation is complicated by the fact that one would observe a single weak ECD band, which may easily result from other sources than the invoked exciton coupling mechanism. A good educational example is offered by laucysteinamide A (11, Figure 9), a cytotoxic compound recently isolated from a cyanobacterium. 88 From the reported ECD spectrum of 11, though of poor quality (Figure 9), one can infer a weak negative ECD band above 200 nm. This band was assigned by the authors to the long‐wavelength component of a “couplet” due to the NDEC between the C‐3/C‐4 alkene and the thiazoline chromophore (absorbing >200 nm), thus reminiscent of a sort of allylic benzoate coupling. Application of the ECM thus led them to assign the AC as (2R)‐11. The assignment is correct, but fortuitous. In fact, none of prerequisites (a)–(c) discussed above seems to be fulfilled in the ECD analysis of 11:
No conformational analysis of 11 was run, or at least it was not reported, and ECM was applied to a single conformer whose relative population was unclear.
The direction of the TDM allied with the transition of the thiazoline chromophore supposedly involved in NDEC was not shown.
The nature of the transition of the thiazoline chromophore responsible for the ECD band >220 nm was not discussed.
Because we considered the case of laucysteinamide A a very pertinent educational example to highlight the procedure for a correct application of the ECM, we run before a complete structural and electronic analysis by DFT and TD‐DFT methods. 55 Here, we only briefly summarize the main results:
Compound 11 shows rather pronounced molecular flexibility both in the puckering of the thiazoline ring and in the rotamerism around C‐2/C‐3 bond, affecting the reciprocal orientation of the two chromophores.
Because of the lack of any axial symmetry element in the thiazoline ring, any transition can be polarized either in the (average) plane or perpendicular to it; therefore, the exact orientation of the TDM must be assessed.
The negative band at 220 nm is not due to a π–π* transition involved in NDEC but to a magnetic dipole allowed n–σ* transition centered on the sulfur atom.
Thus, laucysteinamide A (11) seems to be a quite unfortunate case where none of the prerequisites was met and lends itself as a very instructive example of the major pitfalls one may encounter on the way to assigning ACs by the ECM.
FIGURE 9.
Reported application of ECM to laucysteinamide A (11). (A) ECD spectrum of 11; the dotted portion <225 nm is probably an artifact due to the solvent (CH2Cl2) cutoff (CD units, concentration, and path length not reported). (B) Drawing used to establish exciton chirality reported in the original publication. Notice the absence of TDM directions. Adapted from ref. 55
3.4. ECM of flexible compounds: A challenge from conformation
Among the three prerequisites for a correct application of the ECM, prerequisite (a) concerning conformational aspects is probably the most difficult to tackle with. In fact, the necessity of an accurate knowledge of the molecular conformation applies equally to all compounds, independently of the nature of the chromophoric groups. The classic example in this context is represented by bis(p‐substituted benzoates) or bis(2‐anthroates) of acyclic 1,2‐diols, 1,3‐diols, and polyols. The situation for terminal 1,2‐diols, internal threo‐type 1,2‐diols, and internal erythro‐type 1,2‐diols is summarized in Scheme 5. 89 , 90 In all cases, three conformers may be envisaged, one leading to positive exciton chirality, one with negligible exciton chirality, and one leading to negative exciton chirality. For terminal 1,2‐diols and internal threo‐type 1,2‐diols, the left conformer in Scheme 5A,B is dominant; thus, a positive ECD couplet is expected (and observed) for compounds with the indicated configuration; this is (S) or (S,S) configuration if group R has lower priority than OH. Apart from reasoning on steric effects, the relative populations may be assessed by measuring vicinal NMR 3 J HH coupling constants, as shown in Scheme 5.
SCHEME 5.
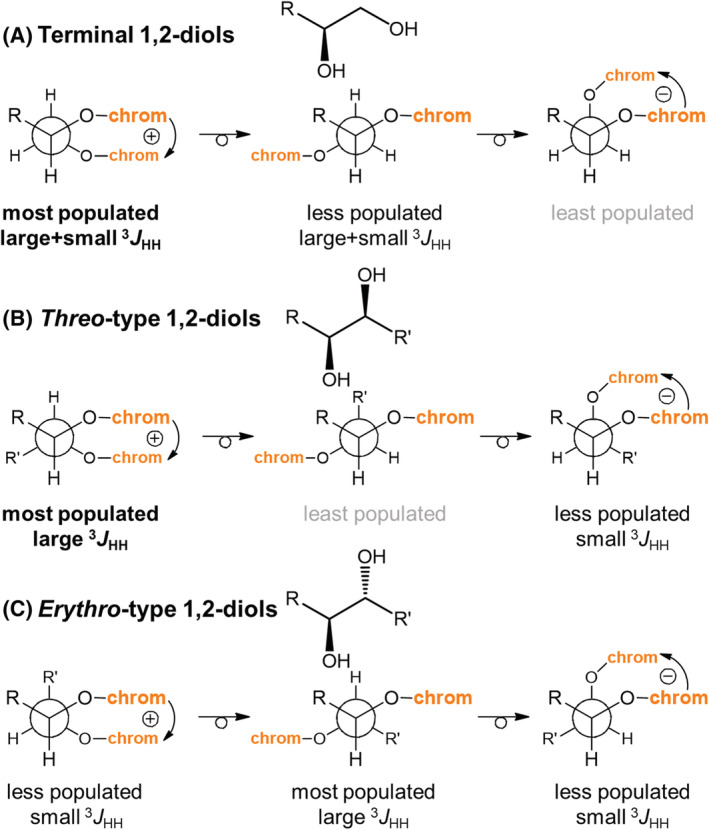
Application of the ECM to (A) terminal 1,2‐diols, (B) internal threo‐type 1,2‐diols, and (C) internal erythro‐type 1,2‐diols. “Chrom” indicates a p‐substituted benzoate or 2‐anthroate group
The situation for erythro‐type 1,2‐diols is much more complicated; here, the most populated conformer has roughly negligible exciton chirality, and the population of the other two conformers is hardly predictable or assessed by NMR (Scheme 5C). As a matter of fact, when R = R', we have an achiral meso structure, and when the two groups are similar, the ECD is weak. In the case of 1,3‐diols, the two diastereomers (syn and anti) are also associated with different chiroptical responses: For the most stable zigzag conformation, in the anti isomer, the two OH groups (and hence the attached benzoate chromophores) lie at an angle, which produces an exciton‐split ECD spectrum, whereas in the syn isomer they are almost parallel and the ECD is weak. 29 , 91
It must be stressed that, in some situations, one may employ ad hoc strategies aimed at reducing the conformational mobility. Rosini, Superchi, and coworkers have reported, for instance, the application of the ECM to acyclic 1,2‐diaryl‐1,2‐diols converted into 2,2‐dimethyl‐1,3‐dioxolanes, 92 , 93 , 94 and to acyclic 1‐aryl‐1,2‐diols into 4‐biphenylboronates. 95 , 96 These examples demonstrate that the best strategy for each specific situation should be sought to solve stereochemical problems in the most suitable way, also based on the ECM. 97
The important message from the case of acyclic 1,2‐ and 1,3‐diols is that, in the presence of flexible bis(chromophoric) compounds, one cannot infer the AC without knowing, or at least making a hypothesis, on the molecular conformation. The notion that ECD depends in a very sensitive way on conformation, and not only on configuration, is widespread. 91 Good educational examples exist of very similar compounds with the same AC assuming different conformations and thus having mirror‐image experimental ECD spectra. 98 , 99 For exciton‐coupled systems, the importance of conformational effects is especially cogent if they affect the reciprocal orientation between the two (or more) chromophores, which is the only factor determining the sign of exciton chirality. Recalling requisite (a) presented in Section 1, we state again that, before applying the ECM, one must investigate the molecular conformation, possibly by a combination of molecular modeling and experimental techniques, and establish all the relevant conformers. A discussion on modern methods for conformational analysis is postponed to Section 4.7. Most of the “good” examples of application of the ECM discussed so far took this requisite explicitly into account; see, for example, brevetoxin B and gymnocin‐B derivatives (5 and 6) and saturnispol A (7). In the case of bis(chromophoric) derivatives of cyclic 1,2‐diols (such as 1), ad hoc conformational investigation may be avoided because of the previous knowledge on the conformational behavior of the system (see Section 3.1.1 and Figure 2). Still, even for well‐known systems, unexpectedly assumed conformations may need to be considered to interpret the observed exciton‐coupled ECD spectrum. This has happened, for instance, for bis‐TPP derivatives of 1,2‐cyclohexane diol 73 and allylic benzoates with the double bond inserted in a flexible cycle. 31 When new derivatizing agents are developed as chromophoric probes in ECM, one should always investigate not only the electronic structure, namely, the direction of TDMs (point (b) in our lettered list), but also their conformational behavior around the point of attachment to the chiral moiety, by analyzing simple derivatives based e.g. on 1,2‐disubtituted cyclohexane or hexose scaffolds. 100 , 101 , 102 Especially tricky is the derivatization of amino compounds as aromatic amides and cyanines, because of the possible E/Z or s‐cis/s‐trans isomerism allied with the N–C(=O) tertiary amide and C–N(=C) imine bonds, respectively. 103 , 104
3.5. Critical survey of recent examples of ambiguous ECM analyses
In the recent literature, it is rather easy to find examples of incorrect or unjustified application of the ECM, in addition to the already discussed cases of perforalactone C (9) and laucysteinamide A (11). Some of them (12–20, Schemes 6 and 7) are surveyed in the present section, whose aim is to illustrate relatively common errors one may commit during ECM applications. In all cases, one or more of the following situations occur: The appearance of the ECD spectrum is elusive, in the sense that a clear‐cut exciton couplet is not appearing in a spectrum composed of multiple bands (requisite (c) in the lettered list); the nature of the electronic transitions responsible for the supposed couplet was not discussed, or misassigned (requisite (b)); the chromophores thought to be involved in ECM are actually conjugated and constitute a single intrinsically chiral chromophore (also pertains to requisite (c)).
SCHEME 6.
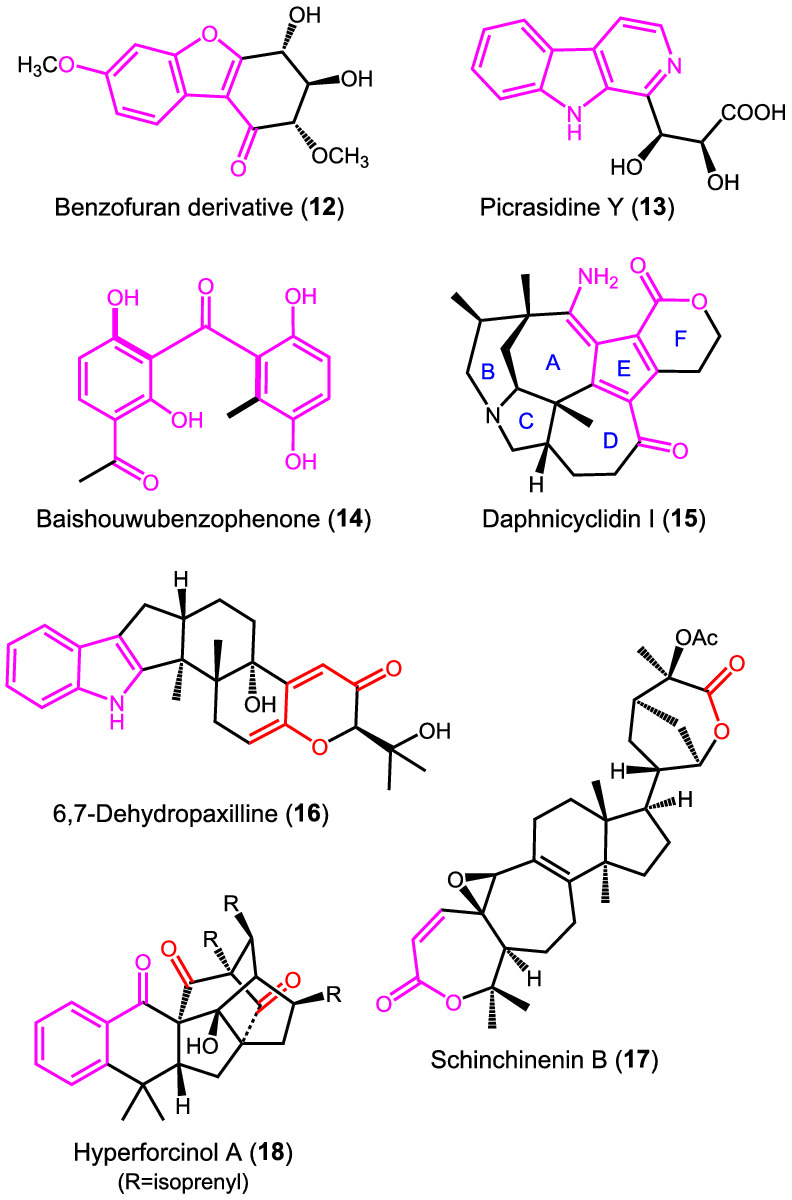
Diagrams of compounds 12–18 surveyed in this section. In all cases, the absolute stereostructures reported in the original publications are shown. Drawn in colors are the distinguishable chromophores
SCHEME 7.
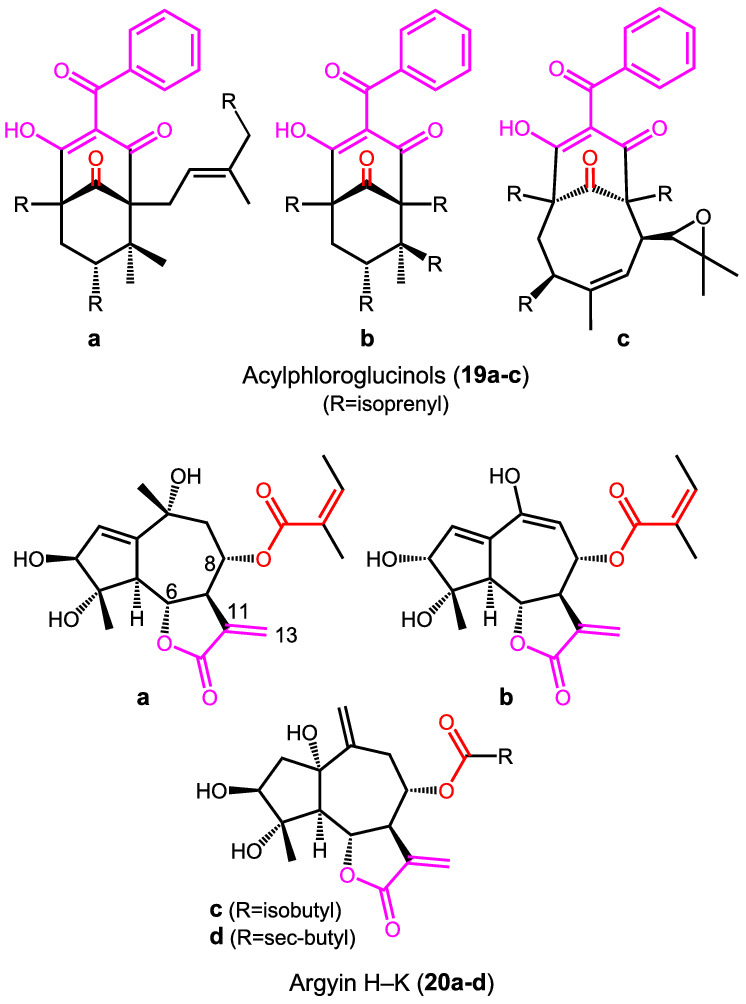
Diagrams of compounds 19–20 surveyed in this section. In all cases, the absolute stereostructures reported in the original publications are shown. Drawn in colors are the distinguishable chromophores
The benzofuran derivative 12, isolated from tobacco leaves, was reported to have an ECD spectrum with a positive band at 195 nm and a negative one at 208 nm. 105 The AC was “determined by CD exciton chirality method” apparently based on such spectrum. The trivial error is self‐evident; 12 contains a single chromophore, and it is not amenable to ECM treatment unless the OH groups are derivatized.
Picrasidine Y (13) is a β‐carboline alkaloid whose AC was determined by ECM analysis. 106 The ECD spectrum is rather complicated and consists of several bands in the region between 200 and 400 nm. The authors interpreted a pair of bands at 290 and 270 nm as an exciton couplet due to the coupling between the two chromophores “β‐carboline backbone and carbonyl group.” However, the carboxyl chromophore has no transitions in that wavelength range; thus, both bands are allied with the β‐carboline ring. This is confirmed by our TD‐DFT calculations (Supporting Information).
Baishouwubenzophenone (14) contains a single distorted and intrinsically chiral conjugated chromophore. 107 Its AC was assigned by TD‐DFT calculations that correctly reproduced the ECD spectrum; however, this latter was also interpreted in terms of exciton coupling between the two supposedly “independent” aromatic moieties, which looks incorrect. Both the appearance of the ECD spectrum, where no clear‐cut couplet occurs, and the analysis of available MOs should have warned against the ECM analysis. The LUMO is in fact obviously delocalized on the whole conjugated system. 107
Daphnicyclidin I (15) is a polycyclic Daphniphyllum alkaloid containing a complex unsaturated ring system that involves Rings A, D, E and F. 108 Its ECD spectrum contains several bands in the region between 200 and 400 nm, including two bands of opposite sign at 292 and 311 nm. These latter were interpreted as a couplet due to the transitions of the “conjugated enone and lactone chromophores.” 108 Inspection of the molecular diagram suggests the existence of a single extended conjugated chromophore. Our TD‐DFT/DFT calculation results reveal that the whole chromophore is twisted and therefore responsible for the observed ECD spectrum (Supporting Information).
The skeleton of the indoloditerpene 6,7‐dehydropaxilline (16) contains two easily recognizable chromophores, namely, an indole ring and a dienone. ECM analysis might look feasible in this case, although it concentrated on a very small portion and a weak band of the otherwise intense and complex ECD spectrum. 49 It is very likely that the contribution of other mechanisms of optical activity is at least as important, if not overwhelming.
Schinchinenin B (17) contains an α,β‐unsaturated lactone and a second lactone group, which were thought to produce an exciton couplet with maxima at 220 and 290 nm in the ECD spectrum. 109 Apart from the uncertain attribution of the ECD bands, the two chromophores lie so far apart in the structure of 17 (around 13.2 Å in our DFT models; Supporting Information) that the strength of NDEC mechanism is expected to be negligible. On the other hand, the α,β‐unsaturated lactone is not planar, and its intrinsic chirality is expected to dominate the ECD response.
Hyperforcinol A (18) is a polycyclic compound containing a benzoyl chromophore and two nonconjugated carbonyl chromophores. 110 The ECD spectrum contains several bands in the range 200–350 nm, but, similar to other cases discussed above, the authors focused their analysis only on two bands at 229 and 258 nm, recognizing a negative couplet that they assigned to the exciton coupling between the two isolated ketone carbonyl groups. However, the carbonyl π–π* transition (the only one that can contribute to exciton coupling) lies at 185–195 nm, whereas in the considered region a major contribution from the benzoyl group is expected.
A similar misunderstanding about the nature of transitions suitable for ECM treatment concerns a family of polyprenylated acylphloroglucinols (19a‐c). 111 , 112 They contain an extended conjugated chromophore and an isolated ketone carbonyl group. In the ECD spectra, the authors recognized a couplet in the region between 220 and 260 nm that was justified by the exciton coupling between a π–π* transition of the enolized trione chromophore and the n–π* transition of the isolated ketone. This latter transition is magnetic‐dipole allowed and electric‐dipole forbidden and cannot be involved in the standard exciton coupling between electric TDMs; electric/magnetic coupling does exist as a distinct optical activity mechanism, which responds to different rules. 64 Moreover, the contribution from the conjugated phenyl ring was unnoticed, and the direction of the TDM of the extended chromophore was drawn in absence of any evidence supporting it. 111 , 112
In the case of the guaiane‐type sesquiterpenes argyin H‐K (20a‐d), the exciton coupling between the α‐methylene γ‐lactone moiety (3‐methylidenefuran‐2(3H)‐one) and the non‐conjugated (20c,d) or α,β‐unsaturated ester moiety (20a,b) was considered to interpret exciton‐split ECD spectra. 113 The problem here lies in the supposed direction of the TDMs, which were depicted parallel to the C6‐O and C8‐O bonds. Although the partially allowed rotation around the C8‐O bond might in part justify the assumption that the effective average dipole moment is oriented along this direction, this is surely not the case for the rigid α‐methylene γ‐lactone chromophore. Here, the TDM for the π–π* transition is oriented roughly parallel to the C11–C13 direction, that is, almost perpendicular to the assumed one. This is confirmed by our TD‐DFT/DFT calculations on the chromophoric moiety (Supporting Information).
The 7,8‐seco‐abietane compound 21 (Figure 10) contains a p‐benzoquinone and a carbonyl chromophore that were thought to generate an ECD couplet with maxima at 270 and 220 nm, respectively. 114 Apart from the only partial analysis of the ECD spectrum, this case too suffers from the problem related to requisite (b), namely, an insufficient description of TDMs. In the plot used to highlight the exciton chirality (Figure 10), the authors depicted the angle between C‐9/C‐10 and C‐5/C‐6 bonds. This latter does not coincide with the polarization of carbonyl π–π* transition, which is oriented along the C=O bond. The substituted p‐benzoquinone chromophore has no effective elements of axial symmetry, and its TDM directions should be explicitly assessed before applying the ECM; TD‐DFT calculations (see Supporting Information) demonstrate that the 270 nm transition is almost aligned with the O=C···C=O direction. As a result, the positive dihedral angle between C‐9/C‐10 and C‐5/C‐6 bonds actually corresponds to a negative chirality between TDMs.
FIGURE 10.
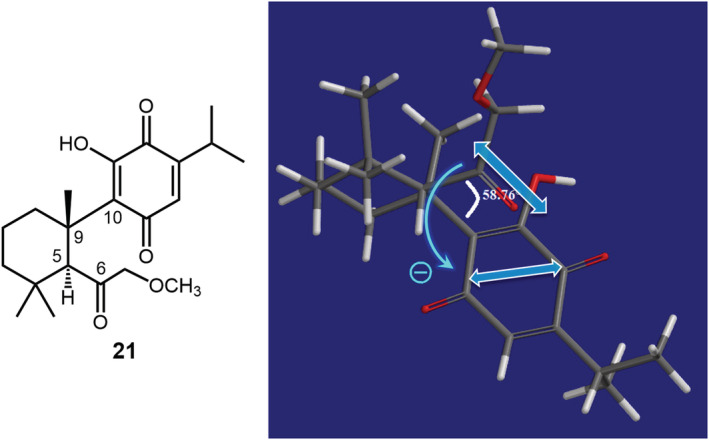
Reported application of ECM to 7,8‐seco‐abietane compound 21. The positive dihedral angle ~60° indicated in the original publication does not correspond to the actual relative orientation between the TDMs of the carbonyl and p‐quinone chromophores, which define a negative chirality. Right panel adapted with permission from ref. 114 Copyright 2016 American Chemical Society
4. QUANTITATIVE PREDICTIONS OF EXCITON‐COUPLED ECD SPECTRA
With the term “quantitative” we mean here any approach for analyzing exciton‐coupled ECD spectra going beyond the merely visual inspection that constitutes the essence of the exciton chirality rule. This section groups subsections spanning very diverse approaches, from the numerical estimation of exciton coupling quantities through geometrical parameters, to spectra summations, to QM calculations within the excitonic framework. For completeness, we also discuss full QM calculations of exciton‐coupled ECD spectra, where the exciton mechanism is however no longer invoked, that is, the system is not fragmented into subsystems (chromophores) interacting through space, but it is treated as a whole. Then, we will present an MO description of the exciton coupling phenomenon in both DEC and NDEC forms. In the end of this section, we also briefly recall modern methods available for running efficient conformational analyses, which can be regarded as a preliminary step for all other approaches discussed.
4.1. Numerical estimation of exciton coupling
One of the main advantages of the exciton coupling treatment of optical activity is that very simple formulas exist, which connect the geometrical arrangement between exciton‐coupled chromophores and ECD spectra. As a matter of fact, from the viewpoint of exciton coupling, a chromophore transition is nothing more than a dipole put somewhere in the space, oscillating at its resonance frequency and coupling with other oscillating dipoles in the nearby. It is therefore not surprising that all spectral attributes of an exciton‐coupled ECD spectrum, namely, the couplet position (wavelength or frequency), amplitude (A, vertical peak‐to‐trough distance), and width (wavelength separation between the peak and trough), depend ultimately on a few parameters. These latter are (1) the relative position of the chromophores, defined by the distance vector R ij connecting the dipole centers; (2) the relative orientation between the directions of the TDMs, these latter being defined by the vectors μ i (i = 1,2); (3) the excitation wavelength λ i (or frequency ν i ) of the chromophore(s) transition(s); (4) the intensity of the chromophore absorption bands (with ε i ∝|μ i |2); and (5) a band‐shape Γ i , which can be associated with a Gaussian or Lorentzian function, except when it is heavily altered by vibronic progression. With reference to Figure 11, the geometric terms (1) and (2) can be quantified through the angles α and β, which define the relative orientation of R 12 and μ 1 and of R 12 and μ 2 , respectively, plus the twist angle γ between μ 1 and μ 2 . The concept of “centers of the TDMs” (connected by R 12 ) is intuitive when dictated by symmetry, for example, the TDMs of π–π* transitions of a naphthalene or porphyrin chromophore lie in the middle of the rings. In other cases, it is more elusive, although it can be evaluated by QM‐calculated transition densities. Nevertheless, when applying the exciton chirality rule, it is crucial that the two TDMs are looked through the line connecting their centers. Moreover, the three angles must be estimated using the same criterion and in a consistent way: A useful strategy is to pick the “tips” of the TDMs that define acute angles with R 12 , that is, α and β < 90°, and measure the twist angle γ consequently; this way, the sign of γ will correlate with the exciton chirality. The sign and intensity of an exciton couplet due to DEC may be estimated through 22
| (1) |
where the dot · indicates the scalar product between two vectors and × indicates the vector product; V 12 is the coupling potential, which is normally simplified as the Coulomb dipole–dipole term:
| (2) |
The quadruple product in Equation 1 can be factorized into a modulus and a geometric term Ω(α,β,γ):
| (3) |
| (4) |
FIGURE 11.
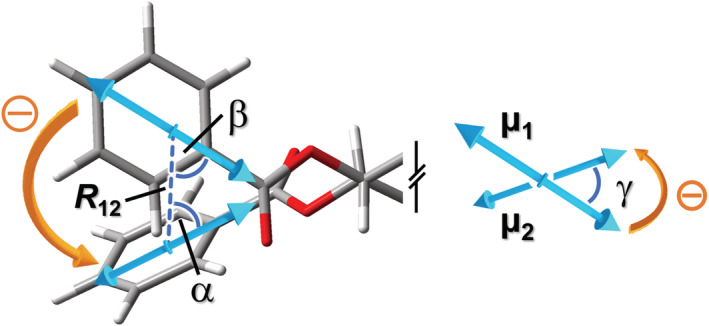
Definition of key geometrical parameters for predicting an exciton couplet sign and intensity through Equation 4 shown for a generic 1,2‐diol bis(benzoate) with gauche(−) orientation. Angle γ is estimated looking at the “tips” by which α and β < 90°
Equation 4 ultimately determines the sign of an ECD couplet, with Ω ranging from −0.577 to +0.577, whereas Equation 3 allows one to calculate the full ECD spectrum and hence the couplet amplitude. For NDEC, the geometrical factor is the same, but the overall expression will also depend on the energy separation, 22 which may severely reduce the overall strength. 115 , 116
Inspection of Equation 4 reveals that the sign of an ECD couplet does not depend exclusively on the twist angle γ, as too often believed, but also on angles α and β. This aspect will be better clarified in the next section. What we wish to point out here is that, in case of uncertain attribution of the positive or negative chirality between the two TDMs, one only needs to “measure” the three angles α, β, and γ on a proper structural model and assess the couplet sign through Equation 4 in a safe and easy way. More quantitatively, that is, to apply Equation 3, one needs to evaluate the TDM intensity (or dipolar strengths) from the chromophore absorption spectra and the interchromophoric distance R 12 from the same model. 22 , 57 To provide an illustrative example of the first statement, let us discuss the case of the natural product schilancitrilactone H (22) (Figure 12). 47 This compound contains two conjugated moieties, namely, an α,β‐unsaturated lactone (Ring B) and a 5‐methylenefuran‐2(5H)‐one (Ring G). The ECD spectrum of 22 shows a weak negative couplet (nm [Δε], methanol: 219 [+3.5], 242 [−3]), due to π–π* transitions, plus a negative shoulder (approximately 270 nm) due to a n–π* transition. If one looks at the lowest energy conformer of 22, determining the chirality defined by the π–π* TDMs is not immediate at all: Should one adopt the viewpoint in Figure 12B or C? The definition given in Figure 11 provides the correct answer, namely, a negative chirality, which is definitely confirmed by measuring the relevant angles (Figure 12) to obtain Ω = −0.26 from Equation 4.
FIGURE 12.
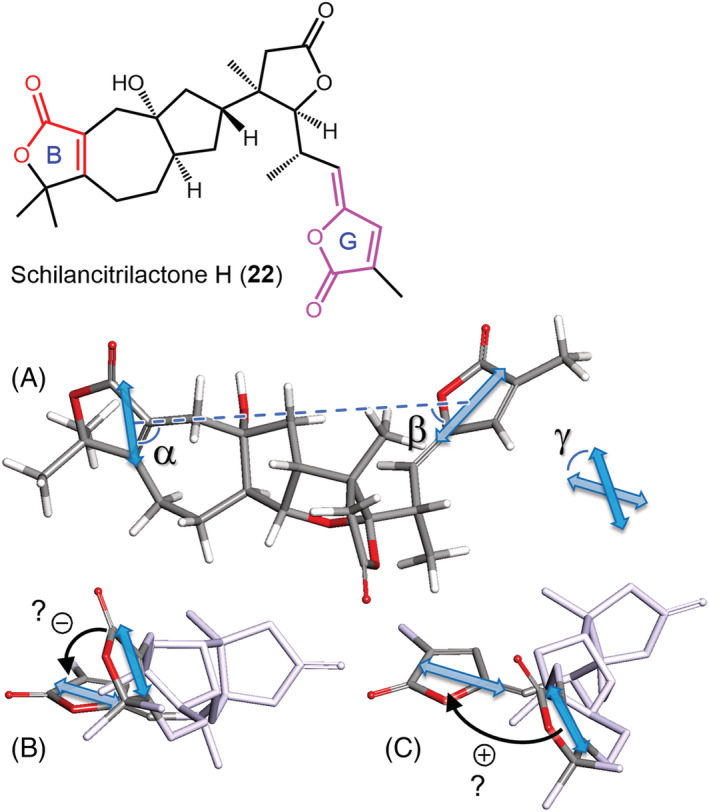
(A) Lowest energy DFT conformer of schilancitrilactone H (22) (optimized at B3LYP/6‐31+G(d,p) level with PCM for methanol, population 43% at 300 K), 47 on which the angles relevant for applying the ECM were measured: α = 88°, β = 44°, γ = −44°. (B,C) Two viewpoints with apparent opposite chirality defined by the two TDMs
Concerning the fulfillment of prerequisites (a)–(c) from our lettered list for 22, a conformational investigation (requisite (a)) was run preliminarily to ECM numerical estimations. Transition density calculations were run on the model chromophores to ascertain the TDM “position” and direction (requisite (b)). As for requisite (c), an analogous compound devoid of unsaturation in Ring B was considered, which displayed a monosignate ECD curve, thus supporting the hypothesis that the split ECD curve seen for 22 is due to NDEC between the two conjugated chromophores. Finally, the ECD spectrum of 22 was reproduced by TD‐DFT calculations. 47
In the case of ferulic acid derivative (4) discussed previously, the angles measured for the lowest energy DFT conformer of (7'R,8'R)‐4a (α = 26°, β = 19°, γ = −68°) led to Ω = −0.30, in keeping with a negative exciton chirality (see Figure 5).
Another example of ambiguous chirality defined by TDMs is offered by chisosiamen A (23) (Figure 13), a limonoid extracted from the fruit of Chisocheton siamensis. 117 The ECD spectrum of 23 in methanol showed a positive band at 230 nm (∆ε + 18.8) and negative one at 206 nm (∆ε − 6.4), which was interpreted as the result of exciton coupling between the α,β‐unsaturated ketone and the C14–C15 double bond. The drawing used to establish the sign of exciton chirality is shown in Figure 13A; the supposedly positive chirality was apparently in keeping with the experimental positive ECD couplet. 117 The adopted viewpoint is, however, equivocal, because it diverges a lot from the ideal viewpoint along the line connecting the TDMs. In Figure 13B, we use a truncated model of 23 that preserves the limonoid skeleton (with the γ‐lactone ring replaced by a methyl group at C17, 23a). By drawing the lowest energy DFT minimum of 23a (Supporting Information) in the correct perspective, one can appreciate that the two TDMs lie almost parallel to each other and define a faint negative chirality. Thus, the exciton chirality is negative but almost negligible. After measuring the relevant angles, Ω = −0.04 is obtained from Equation (4), which, associated with a distance of 6.8 Å, makes the NDEC very weak. We must conclude that the apparent positive couplet seen in the ECD spectrum of 23 is due to a different source of chirality, most likely associated with the α,β‐unsaturated ketone being embedded into a chiral cycle (second‐sphere chirality). 83 Thus, in the case of 23, requisite (c) of our lettered list seems to be unfulfilled.
FIGURE 13.
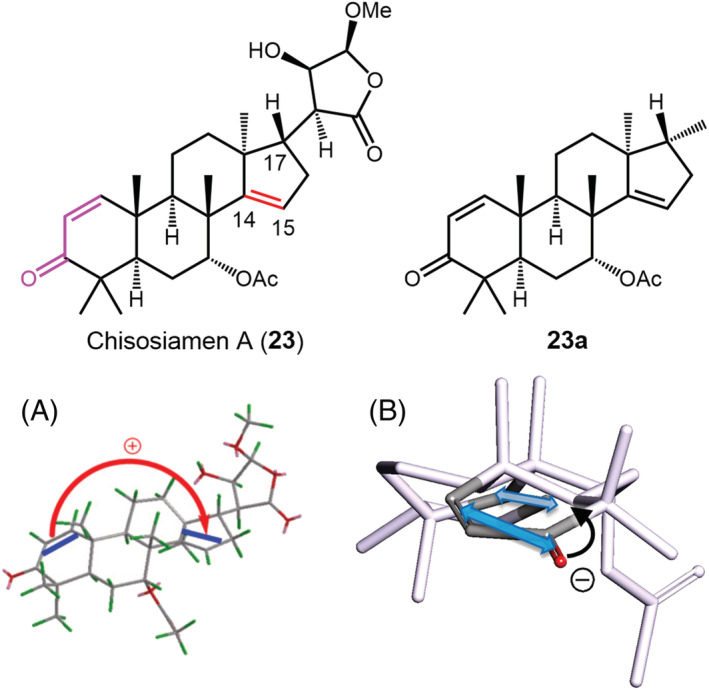
ECM application to chisosiamen A (23) and its truncated model 23a. (A) Drawing used to establish exciton chirality reported in the original publication. Adapted from ref. 117 , copyright 2021, with permission from Elsevier. (B) Lowest energy DFT conformer of 23a, displaying faint negative exciton chirality; the angles relevant for applying the ECM are measured as: α = 30°, β = 42°, γ = −4.4°
4.2. Geometrical factor plots
As explained in the previous section, the geometrical factor Ω(α,β,γ) uniquely determines through Equation 4 the sign of an exciton couplet and also affects its amplitude. A 3D contour plot of the function Ω(α,β,γ) is given in Figure 14. The space defined by 0 < α,β < 90°, 0 < γ < 180° is divided into two regions, a wider one with yellow‐reddish hues where Ω > 0 (as one would expect for positive values of γ), and a second region with blueish hues, which occupies ~1/8 of the whole space, where Ω < 0. This means that there are cases where the sign of the couplet does not have the same sign as the twist angle γ, even if this latter is evaluated correctly (see Figure 11 and related discussion).
FIGURE 14.
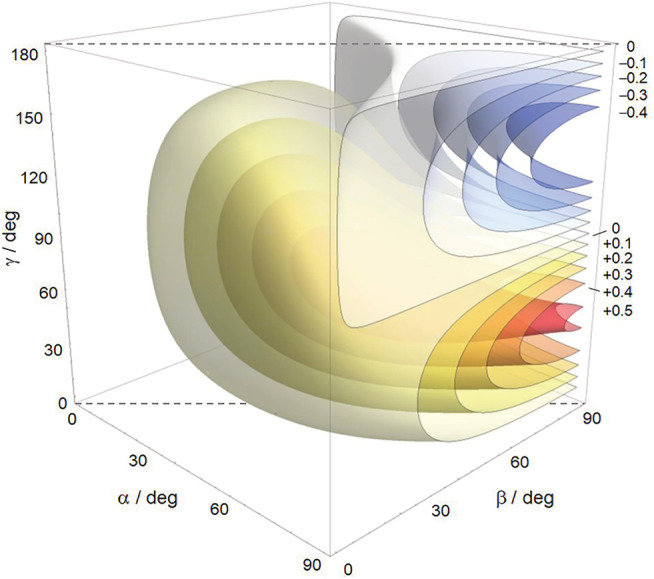
Contour plot of the function Ω(α,β,γ). The labels on the right indicate the value of Ω on the corresponding surface
3D plots, though very informative, are not of immediate comprehension. However, a very relevant case of exciton coupling occurs for C 2‐symmetric molecules, or for molecules where the TDMs are related by (quasi‐)C 2 symmetry: They include noteworthy examples such as 1,2‐diol bis‐benzoates and 1,1′‐binaphthyls. In these cases, α = β, and Equation 4 simplifies to
| (5) |
which can be plotted as a two‐dimensional (2D) contour plot (Figure 15). Using the extended range 0 < α < 180°, −180° < γ < 180°, one may appreciate the symmetry of the function Ω(α,γ): It is symmetric with respect to α = 90° and antisymmetric with respect to γ = 0°, as expected. The lower right quadrant of the 2D plot in Figure 15 corresponds to the surface cutting the 3D plot in Figure 14 for α = β (i.e., lying parallel to the sheet plane; see dashed lines). Again, it can be appreciated that ~1/8 of the region with γ > 0° has negative sign for Ω(α,γ). It corresponds to values of γ > 90° and of 60° < α < 120°. This is the most critical situation for the “visual” application of the exciton chirality rule, namely, when the TDMs are roughly perpendicular to the line connecting their centers (direction R 12 ; see Figure 11). How often such situation occurs? To answer this question, we plotted on the graphic two lines depicting how Ω(α,γ) varies for 1,2‐diol bis‐benzoates and 1,1′‐binaphthyls as a function of the most relevant conformational parameter, namely, the angle θ defined, respectively, by the O–C–C–O torsion and the aryl–aryl dihedral (Figure 15, bottom).
FIGURE 15.
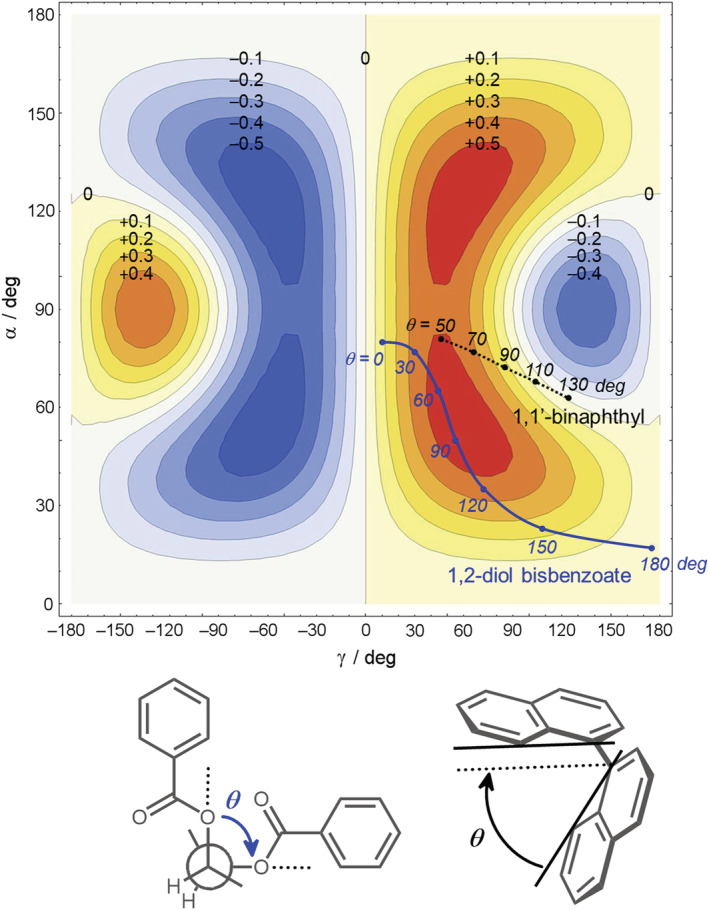
Contour plot of the function Ω(α,γ). The labels on the contours indicate the value of Ω on the corresponding contour. The two lines (solid blue and dotted black) follow the evolution of Ω(α,γ) for 1,2‐diol bis‐benzoates and 1,1′‐binaphthyls, respectively, as a function of the two torsional angles θ defined in the bottom
It is apparent that for the most classic example of 1,2‐diol bis‐benzoates, a positive torsional angle θ (or positive chirality) always corresponds to a positive value of the geometrical factor and hence a positive exciton couplet: The exciton chirality rule is fully fulfilled for these systems. The same occurs for any other bis‐chromophoric derivative of 1,2‐diols, such as p‐substituted benzoates, 2‐naphthoates, 2‐anthroates, and so on. The situation for 1,1′‐binaphthyls is apparently more complicated: A positive dihedral angle θ yields a positive couplet only for θ < 110°, but a sign inversion occurs around θ ≈ 110° (due to a change in sign of the coupling potential; Equation 2). This has been known for long time, 60 though never confirmed experimentally because of the difficulty of obtaining 1,1‐binaphthyl derivatives with dihedral angles θ > 110°. 61 , 62 Graphics like that reported in Figure 15 may be easily obtained for non‐C 2‐symmetric molecules by plotting Equation 4 at specific values of α or β; this way, one can verify how robust is the sign predicted for the exciton chirality upon varying the other two angles. 37 If the angles measured on a proper molecular model fall in a boundary region between positive and negative values of Ω, one should avoid relying only on the “visual” application of the rule and use instead the formula (Equation 4).
4.3. ECM for multichromophoric systems: Pairwise additivity relations
ECD spectra of compounds containing three or more exciton‐coupled chromophores may be treated, at first approximation, as the result of the combination of one‐to‐one (pairwise) interactions. In the presence of n transition dipoles, the number of distinct pairwise couplings amounts to n!/[2(n − 2)!]. The pairwise additivity principle holds for both DEC and NDEC. On a quantitative ground, the ECD of a compound containing, for example, three chromophores (I, II, and III) amounts approximately to the summation of the ECD of the three compounds containing the three chromophoric pairs (I + II, I + III, and II + III). This expectation has been verified experimentally for sugar derivatives with up to four chromophores (p‐bromobenzoate and p‐bromobenzoate/p‐methoxycinnamate) and six distinct pairwise interactions, 25 , 30 and theoretically for ouabagenin tris‐2‐naphthoate using a semiempirical calculation method. 118
4.4. Calculations of excitonic ECD spectra
In addition to the possibility of running simple numerical estimations “by hand,” several methods exist to calculate full ECD spectra in the exciton approximation. The oldest methods such as DeVoe coupled oscillator approach and the matrix method are based on a classical description of exciton‐coupled chromophores as oscillating dipoles. 119 , 120 Matrix‐like QM excitonic treatments are available nowadays with several advantages, first of all a full description of transition densities. The EXAT tool developed by Mennucci and coworkers is able to display on a graphical user interface (GUI) the spectra, excitonic states, energy levels, and much more (Figure 16). 121 A recent model developed by Santoro, Improta, and coworkers (FrDEx) includes charge‐transfer states in the excitonic Hamiltonian. 122 A unique feature of these quantitative methods is the possibility of simulating ECD spectra arising from the exciton coupling of multiple chromophores and/or transitions. Although this is not a standard application when AC assignment is concerned, it offers a practical and useful way of predicting ECD spectra of multichromophoric systems such as biopolymers or aggregates of conjugated oligo/polymers, which are not easily amenable to full QM calculations. This way, moreover, the validity of additivity relations within the pairwise approximation (Section 4.3) may be proven at a higher level of calculation.
FIGURE 16.
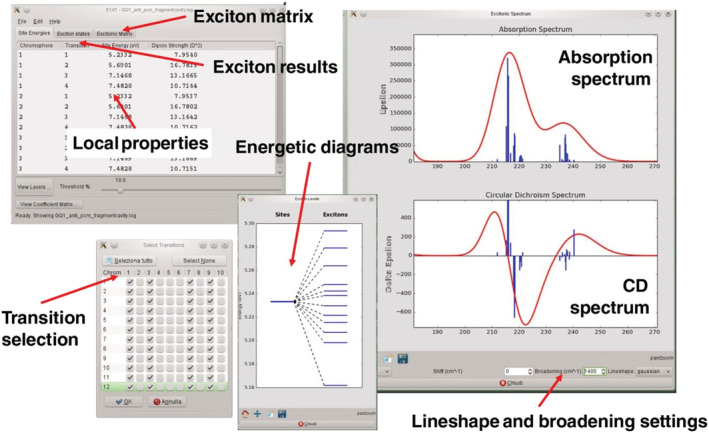
A representation of the EXAT graphical user interface. Notice that for multiple interacting chromophores and/or transitions, one may decompose excitonic spectra by selecting only some specific transitions to build up the excitonic Hamiltonian. Reproduced from ref. 121 Copyright 2017, with permission from Wiley
4.5. Full QM calculations of ECD spectra
In EXAT and similar fragmentation approaches, QM calculations are run on the “isolated” chromophores, and then their transition densities and energies are coupled in the exciton Hamiltonian matrix. Obviously, QM calculations may be directly run on whole systems containing two or more exciton‐coupled chromophores. This way, however, any simplification allied with the fragmentation of the system into subunits (chromophores) is lost, as the system is treated as a whole. Thus, the approach is no longer “excitonic” in the way discussed in all previous sections.
As stated in Section 1, the computational approach is nowadays the most popular means of assigning ACs, 9 , 10 , 11 , 12 and it is also generally very robust provided that an accurate conformational analysis is run, and a “good” level of calculation is chosen. 14 , 15 The first caution is obvious for any structural analysis based on spectroscopic data: It corresponds again to requisite (a) in our lettered list. As for the second caution, it depends a lot on the nature of the system under investigation. If the ECD spectrum is dominated by exciton coupling between π–π* transitions of aromatic chromophores, semiempirical QM methods based on the neglect of differential overlap (NDO) approximation may suffice for obtaining good results. It is noteworthy that the first full QM calculation of exciton‐coupled systems dates back to 1978, when Harada and coworkers developed the so called SCF‐CI‐DV MO method (self‐consistent field/configuration interaction/dipole velocity MO), 22 , 123 , 124 based on the Pariser–Parr–Pople (PPP) NDO approximation. Another method based on NDO, the so‐called ZINDO/S method (Zerner's intermediate NDO for singlets), is still included in modern computational packages and has been frequently used for ECD calculations of exciton‐coupled systems. 125 Nowadays, however, TD‐DFT is by far the most employed method for ECD calculations of organic and organometallic compounds, because of its very favorable cost/accuracy compromise. 8 , 126 As for the choice of DFT functionals, it has been argued that for multichromophoric systems, potentially undergoing charge‐transfer transitions, hybrid functionals with range‐separated exchange term should be employed. 74 These latter include the popular Coulomb‐attenuated CAM‐B3LYP functional. 127 In our experience, several hybrid functionals, including B3LYP, CAM‐B3LYP, PBE0, and BH&HLYP, perform generally well for predicting exciton‐coupled ECD spectra of systems containing multiple aromatic chromophores. In some cases, however, specific functionals may fail to reproduce exciton‐coupled ECD spectra. 38 , 128 , 129 Thus, the notion that several different combinations of functionals and basis sets should be always tested for ECD calculations on specific molecules 14 remains valid in the context of exciton‐coupled ECD spectra.
4.6. MO description of exciton‐coupled ECD systems
Apart from reproducing ECD spectra and allowing for direct stereochemical assignments, QM calculations are the key tool for transition and orbital analysis and for confirming the exciton origin of ECD spectra, which attains to requisite (c) of our lettered list. In QM terms, a compound undergoing exciton coupling is described as a closed‐shell three‐state system partitioned into two chromophores i and j with ground‐state wavefunctions ψ i 0 and ψ j 0 and excited‐state wavefunctions ψ i a and ψ j a, respectively. The ground‐ and excited‐state wavefunctions for the coupled system are, respectively, 22
| (6) |
| (7) |
where Ψ1,2 indicates the two excited states, coupled through the potential V 12, and c i,j are the mixing coefficients. For DEC, states a and b are degenerate and the two coefficients equal ±1/√2:
| (8) |
Generally speaking, each electronic transition of an isolated chromophore results from the combination of various one‐electron excitations from an occupied MO ϕo to an unoccupied (virtual) MO ϕv. In the simplest case, a single excitation is dominant for the observed transition, when its CI (configuration interaction) coefficient is much larger than the others. In this situation, a degenerate exciton‐coupled system can be depicted through a four‐orbital picture, where the two occupied and two unoccupied MOs are combinations of the localized MOs. Therefore, each transition ψ i,j 0 → ψ i,j a will arise from the combination of two single excitations. What said is exemplified in Figure 17 for cyclohexane‐1,2‐diol bis(p‐dimethylaminobenzoate) (24). The four relevant MOs localized on each benzoate chromophore, namely, two degenerate π (occupied) orbitals and two degenerate π* (unoccupied) orbitals, combine in‐phase and out‐of‐phase to yield four MOs delocalized on both rings. Then, the four possible single excitations combine to yield the two split electronic transitions (see Supporting Information for calculation details).
FIGURE 17.
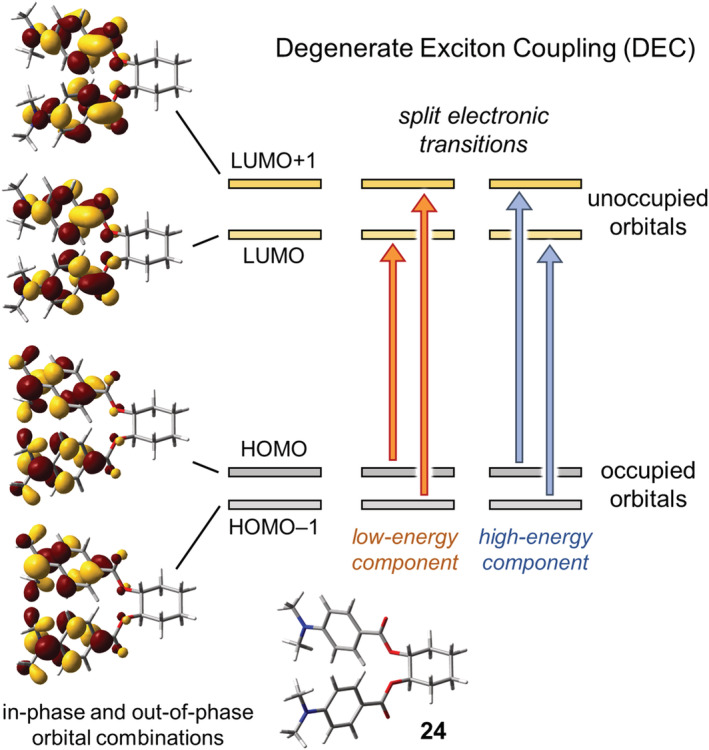
MOs and π–π* electronic transitions involved in the DEC of (R,R)‐cyclohexane‐1,2‐diol bis(p‐dimethylaminobenzoate) (24). The experimental ECD spectrum shows a negative exciton couplet (nm [Δε], acetonitrile): 320 (−79), 293 (+39) 34
In the case of NDEC, the mixing between the two chromophoric excited states is less efficient, and each coupled state resembles the excited state of the isolated chromophore closer in energy. 22 , 116 This can be appreciated looking at compound 25 (Figure 18), where the main π–π* transitions of the two chromophores (p‐bromobenzoate and p‐dimethylaminobenzoate) are separated by ~60 nm. Thus, the two overall transitions Ψ0 → Ψ1 and Ψ0 → Ψ2 are clearly assignable to two one‐electron excitations ψ i 0 → ψ i a and ψ j 0 → ψ j b, respectively, each localized on a single chromophore (see Supporting Information for calculation details).
FIGURE 18.
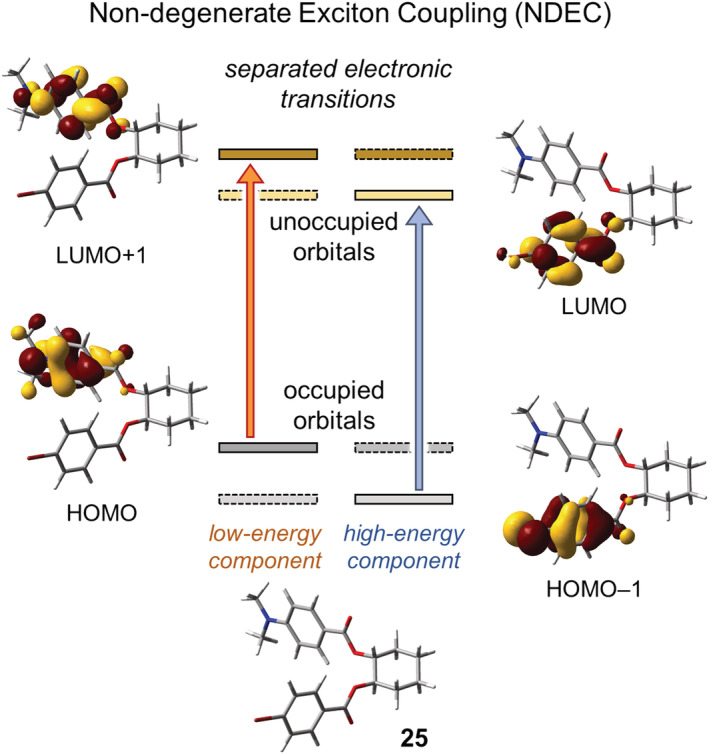
MOs and π–π* electronic transitions involved in the NDEC of (1R,2R)‐cyclohexane‐1,2‐diol 1‐(p‐bromobenzoate) 2‐(p‐dimethylaminobenzoate) (25). The experimental ECD spectrum shows a negative exciton couplet (nm [Δε], acetonitrile): 309 (−11), 249 (+7) 34
It must be stressed that the above pictures are idealized because, in practice, several one‐electron excitations often contribute to each exciton‐coupled state, so examination of canonical MOs does not immediately clarify the character of electronic transitions. In these situations, one may resort to natural transition orbital (NTO) calculations, 130 which provide a more intuitive representation of the orbitals involved in an electronic transition. 131
In addition to providing a modern theoretical framework to the coupled oscillator theory, MO analysis based on QM calculations has a practical application concerning requisite (c) in our lettered list. Examination of MOs, NTOs, and transition densities is in fact helpful to distinguish between truly exciton‐coupled chromophores and cases where the two putative chromophores are in fact conjugated, so ECM cannot be applied (see Examples 14 and 15 above and other literature reports). 132 , 133
4.7. Modern methods for conformational analysis
We have recalled several times in this review that a necessary requirement for applying the ECM, both in its “qualitative” version (i.e., through the exciton chirality rule) and by means of quantitative approaches, is the knowledge of molecular conformation. This coincides in fact with the first prerequisite (a) of our lettered list. This last section briefly summarizes the modern techniques most often used for the conformational analysis of organic molecules, both of experimental and computational nature, as well as their combination.
Several spectroscopic techniques have been employed for the conformational analysis of organic molecules. Apart from very small molecules, for which methods like electron diffraction and microwave spectroscopy may be employed, the lion's share of conformational analysis of medium‐size molecules is for NMR. NMR offers a wide family of methods for 3D structure determination, 15 from the most popular ones such as the measurement of scalar couplings (mostly 3 J HH, 3 J HC, and 2 J HC) 134 and NOEs, 135 to less common but very powerful ones such as the measurement of residual dipolar couplings (RDCs) 136 and dynamic NMR by variable temperature (VT) experiments. 137 Although this review concerns the use of exciton‐coupled ECD for assigning ACs, it is worth mentioning that chiroptical spectroscopies, principally ECD, VCD, and ROA, also lend themselves for conformational studies. 15 , 91 , 138 , 139
Nowadays, molecular conformational analysis cannot avoid the use of computational tools. An efficient conformational analysis of flexible medium‐size molecules is most often based on molecular mechanics. Several force fields (FF) exist, some of which perform particularly well for organic molecules; 140 our favorite one is Merck molecular force field (MMFFs or MMFF94). 141 , 142 For a thorough conformational search, one should sample all possible degrees of freedom, including rotatable bonds and puckering of rings. This may be accomplished by the Monte Carlo algorithm or molecular dynamics (MD), followed by simulated annealing (SA). 143 , 144 This latter method (MD‐SA) has the advantage that solvent may be explicitly included. 145 Once MM has yielded an ensemble of conformers, its robustness may be increased at a very low computational cost by semiempirical single‐point (SP) calculations, 146 using contemporary semiempirical schemes such as RM1 (Recife Model 1, a reparameterization of AM1, Austin Model 1). 147 However, a further step will always be necessary which consists in re‐optimizing all low‐energy structures at a higher computational level. Nowadays, DFT offers the best cost/accuracy compromise for medium‐size molecules, both for geometry optimization and for energy prediction. Although dozens of different DFT functionals exist, several benchmarks have been published helping in the choice of the “best” one for each specific purpose. 148 , 149 , 150 Hybrid functionals with dispersion correction such as ωB97X‐D 151 or B3LYP‐D3, 152 , 153 , 154 perform relatively well for both structure and energetics of organic molecules. Concerning the basis sets, which theoreticians regard as the “elephant in the room” of DFT, 155 relatively small basis sets remain useful for several purposes. 156 In our experience, double‐ζ or triple‐ζ basis sets with wide polarization functions, such as Ahlrichs' def2‐SVP or def2‐TZVP, 157 or balanced People‐type basis sets with diffuse functions, such as 6‐31+G(d) and 6‐311+G(d,p), are sufficiently robust for predicting geometries and conformational energies of medium‐size organic molecules. Almost imperative is the inclusion of a good implicit solvent model, 158 , 159 either directly in the geometry optimization step or at least in a successive SP calculation. Finally, frequency calculations might be run to verify the nature of true energy minima and to obtain free energies or zero‐point‐corrected (ZPC) energies. 14
The steps above are summarized in the flowchart in Figure 19. They serve as starting point in a wide family of computations. From the viewpoint of the present review, at the end of the procedure, one obtains a set of energy minima on which all aforementioned exciton approaches may be applied. If the set is relatively small, and the few minima are relatively consistent as for the reciprocal arrangement between the chromophores, the ECM may be directly applied through the exciton chirality rule. In the presence of a more heterogeneous conformational situation, and especially when the various conformers differ substantially in the interchromophoric arrangement, one should employ one of the quantitative approaches discussed in Section 4, such as numerical or graphical evaluations of the exciton coupling (Sections 4.1 and 4.2), or the calculation of exciton ECD spectra through a matrix‐based method (Section 4.4). Outside of excitonic methods, full QM calculations can be run on the whole system (Section 4.5). In the presence of multiple conformers, any spectral simulation would require Boltzmann averaging of the ECD spectrum estimated for each geometry.
FIGURE 19.
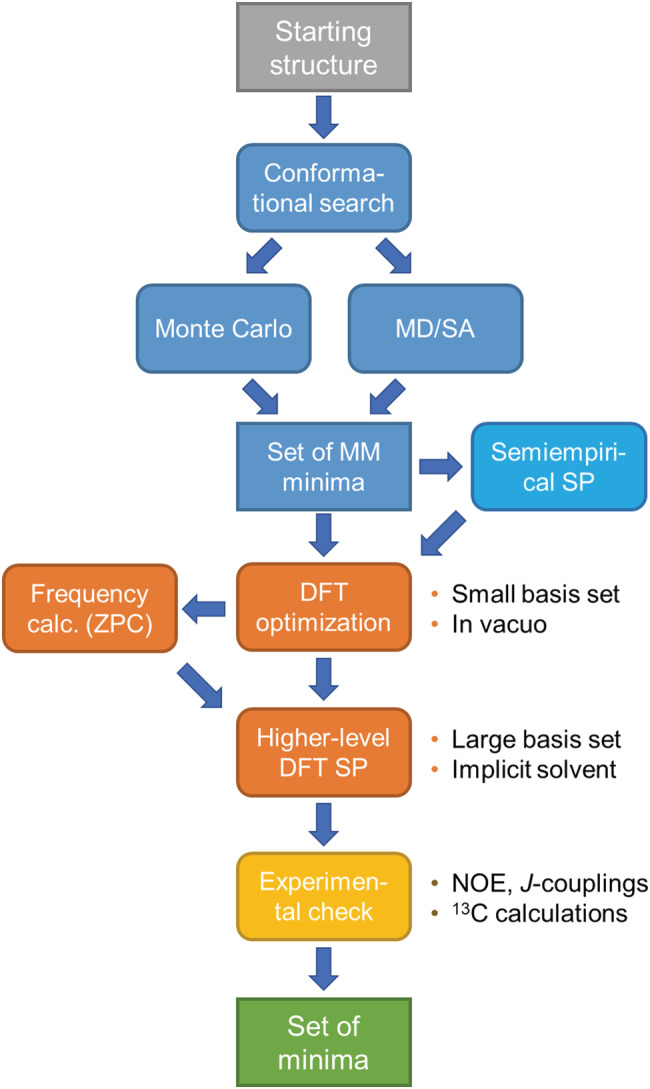
Flowchart for the typical steps in a conformational search/geometry optimization procedure. Abbreviations are defined in the text
Although this last section has treated separately experimental and computational methods for conformational analysis, it is our 14 and others' 15 strong belief that only a combination of experimental and computational techniques may provide a reliable and accurate set of geometries. The synergy between the two families of techniques (represented by the yellow block in Figure 19) may be realized in different ways. One is to check the set of calculated low‐energy conformers against all available NMR data sensitive to 3D structure (J‐couplings and NOEs). This is not necessarily trivial in the presence of multiple conformations in fast exchange, as one would observe only averaged experimental data, which for NOE also have a nonlinear dependence on distances. Another possibility is running NMR calculations to compare experimental and calculated 13C and 1H chemical shifts, for which efficient protocols exist for flexible compounds. 160
5. CONCLUSION
The ECM has been for a long time the most accurate method for assigning the AC of natural products, and other compounds, for which x‐ray diffraction analysis was not possible. Nowadays, the method is surpassed by QM calculations of various chiroptical quantities (OR, ECD, VCD, ROA) that offer great accuracy, wider scope, large applicability, and the possibility of concomitant use of different techniques. Yet, ECM is still a highly valued approach for assigning ACs, especially among natural product chemists. How can ECM carve out its own space in the present computational era? The main reason is the unique combination of robustness and ease of application. There are indeed situations where a mere inspection of an exciton‐split ECD spectrum reveals the compound absolute stereochemistry. This is a double‐edged sword, though: In most situations, even a direct method such as ECM cannot exclude (a) a thorough conformational analysis, (b) a precise knowledge of the chromophore electronic structure, and (c) an overall assessment of the origin of the observed ECD spectrum. It happens that these cautions are overlooked by nonspecialists, leading to incorrect, or fortuitously correct, AC assignments. On the other hand, once the requirements described by the requisites (a)–(c) are carefully met, ECM retains its full accuracy and robustness in almost all situations. With respect to the first historical applications of the ECM, which date back to the 1960s, all the necessary pieces of information may be gained nowadays by accurate and relatively fast QM calculation methods. Thus, with ECM still offering a convenient window on stereochemistry, QM calculations give a valued support for ECM by providing tools for conformational analysis, electronic structure calculations, and spectral interpretations. We believe that, thanks to the aid of modern computational tools, ECM will continue having its space in stereochemical studies in the next years.
Supporting information
Figure S1. Lowest‐energy minima of compound 4a (truncated model of ligusticumaldehyde A, 4) calculated at ωB97X‐D/6‐31+G(d) level with SMD for methanol, with internal energies in kcal/mol and population at 300 K.
Figure S2. (a) Transition‐dipole direction for the major transition of 7‐methoxy‐3‐methyl‐2,3‐dihydrobenzofuran‐5‐carbaldehydethe, the chromophoric unit of compound 4, calculated at CAM‐B3LYP/def2‐TZVP//ωB97X‐D/6‐31+G(d) level in vacuo. The transition is predicted at 273.88 nm, oscillator strength f = 0.18, major excitation contribution 51 → 52 (coefficient 0.60). (b) Frontier orbitals involved in the major π‐π* transition (isovalue 0.02).
Table S1. Parameters of low‐lying transitions of compound 13 calculated at B3LYP/def2‐TZVP//ωB97X‐D/6‐31+G(d) level in vacuo.
Figure S3. Frontiers molecular orbitals of compound 13 calculated at B3LYP/def2‐TZVP//ωB97X‐D/6‐31+G(d) level in vacuo. Isovalue 0.02.
Table S2. Parameters of low‐lying transitions of compound 15 calculated at CAM‐B3LYP/def2‐TZVP//ωB97X‐D/6‐31+G(d) level with PCM for methanol.
Figure S4. Frontiers molecular orbitals of compound 15 calculated at CAM‐B3LYP/def2‐TZVP//ωB97X‐D/6‐31+G(d) level with PCM for methanol. Isovalue 0.03.
Figure S5. Lowest‐energy structure of compound 17 calculated at ωB97X‐D/6‐31+G(d) level in vacuo. (a) Distance measurement between the α,β‐unsaturated lactone and the lactone group. (b) Close‐up view of the α,β‐unsaturated lactone moiety, highlighting its deviation from planarity. The angle between the planes defined by the C=C double bond (C1,C2,C3) and COO group is 23°.
Figure S6. (a) Transition‐dipole direction for the major transition of the chromophoric α‐methylene γ‐lactone unit of compound 20a calculated at CAM‐B3LYP/def2‐TZVP//ωB97X‐D/6‐311+G(d,p) level in vacuo. The transition is predicted at 196.74 nm, oscillator strength f = 0.28, largest excitation contributions 33 → 35 (coefficient 0.59) and 34 → 35 (−0.37). (b) Frontier orbitals involved in the major π‐π* transition (isovalue 0.04).
Figure S7. (a) Transition‐dipole direction for the major transition of the chromophoric p‐quinone unit of compound 21 calculated at CAM‐B3LYP/def2‐TZVP//ωB97X‐D/6‐31+G(d) level in vacuo. The transition is predicted at 245.87 nm, oscillator strength f = 0.28, largest excitation contribution 38 → 41 (coefficient 0.66). (b) Frontier orbitals involved in the major π‐π* transition (isovalue 0.02).
Figure S8. Lowest‐energy minimum of compound 23a (truncated model of chisosiamen A, 23) calculated at ωB97X‐D/6–31 + G(d) level in vacuo.
Figure S9. (a) Transition‐dipole direction for the major transition of the bicyclic α,β‐unsaturated ketone chromophoric unit of compound 23a calculated at CAM‐B3LYP/def2‐TZVP//ωB97X‐D/6‐31+G(d) level in vacuo. The transition is predicted at 210.69 nm, oscillator strength f = 0.29, largest excitation contributions 52 → 54 (coefficient 0.69). (b) Frontier orbitals involved in the major π‐π* transition (isovalue 0.04).
ACKNOWLEDGMENTS
The author is indebted with Nina Berova, Koji Nakanishi, Nobuyuki Harada, and Lorenzo Di Bari for many enlightening discussions on exciton chirality had in years. Nina Berova is also warmly thanked for reading the manuscript before submission and suggesting several improvements. University of Pisa is gratefully acknowledged for the availability of high‐performance computing resources and support through the service computing@unipi. Open Access Funding provided by Universita degli Studi di Pisa within the CRUI‐CARE Agreement. [Correction added on 26 May 2022, after first online publication: CRUI funding statement has been added.]
Pescitelli G. ECD exciton chirality method today: a modern tool for determining absolute configurations. Chirality. 2022;34(2):333-363. doi: 10.1002/chir.23393
This review is dedicated to the memory of Prof. Koji Nakanishi.
REFERENCES
- 1. Krastel P, Petersen F, Roggo S, Schmitt E, Schuffenhauer A. Aspects of chirality in natural products drug discovery. In: Francotte E, Lindner W, eds. Chirality in Drug Research. Wiley‐VCH; 2006:67‐94. [Google Scholar]
- 2. Lin G‐Q, You Q‐D, Cheng J‐F (Eds). Chiral Drugs: Chemistry and Biological Action. Wiley; 2011. [Google Scholar]
- 3. Albright AL, White JM. Determination of absolute configuration using single crystal x‐ray diffraction. In: Roessner U, Dias AD, eds. Metabolomics Tools for Natural Product Discovery: Methods and Protocols. Humana Press; 2013:149‐162. [DOI] [PubMed] [Google Scholar]
- 4. Harada N. Chiral molecular science: how were the absolute configurations of chiral molecules determined? “Experimental results and theories”. Chirality. 2017;29(12):774‐797. [DOI] [PubMed] [Google Scholar]
- 5. Valentín‐Pérez Á, Rosa P, Hillard EA, Giorgi M. Chirality determination in crystals. Chirality. 2021; in press [DOI] [PubMed] [Google Scholar]
- 6. Berova N, Polavarapu PL, Nakanishi K, Woody RW (Eds). Comprehensive Chiroptical Spectroscopy. John Wiley & Sons, Inc.; 2012. [Google Scholar]
- 7. Polavarapu PL. Chiroptical Spectroscopy: Fundamentals and Applications. CRC Press; 2016. [Google Scholar]
- 8. Srebro‐Hooper M, Autschbach J. Calculating natural optical activity of molecules from first principles. Annu Rev Phys Chem. 2017;68(1):399‐420. [DOI] [PubMed] [Google Scholar]
- 9. Superchi S, Scafato P, Górecki M, Pescitelli G. Absolute configuration determination by quantum mechanical calculation of chiroptical spectra: basics and applications to fungal metabolites. Curr Med Chem. 2018;25(2):287‐320. [DOI] [PubMed] [Google Scholar]
- 10. Burgueño‐Tapia E, Joseph‐Nathan P. Vibrational circular dichroism: recent advances for the assignment of the absolute configuration of natural products. Nat Prod Commun. 2017;12(5):641‐651. [PubMed] [Google Scholar]
- 11. Grauso L, Teta R, Esposito G, Menna M, Mangoni A. Computational prediction of chiroptical properties in structure elucidation of natural products. Nat Prod Rep. 2019;36(7):1005‐1030. [DOI] [PubMed] [Google Scholar]
- 12. Mándi A, Kurtán T. Applications of OR/ECD/VCD to the structure elucidation of natural products. Nat Prod Rep. 2019;36(6):889‐918. [DOI] [PubMed] [Google Scholar]
- 13. Polavarapu PL. Why is it important to simultaneously use more than one chiroptical spectroscopic method for determining the structures of chiral molecules? Chirality. 2008;20(5):664‐672. [DOI] [PubMed] [Google Scholar]
- 14. Pescitelli G, Bruhn T. Good computational practice in the assignment of absolute configurations by TDDFT calculations of ECD spectra. Chirality. 2016;28(6):466‐474. [DOI] [PubMed] [Google Scholar]
- 15. Mazzanti A, Casarini D. Recent trends in conformational analysis. WIREs Comput Mol Sci. 2012;2(4):613‐641. [Google Scholar]
- 16. Berova N, Di Bari L, Pescitelli G. Application of electronic circular dichroism in configurational and conformational analysis of organic compounds. Chem Soc Rev. 2007;36(6):914‐931. [DOI] [PubMed] [Google Scholar]
- 17. Davydov AS. Theory of Molecular Excitons. Kasha M, Oppenheimer Jr. M, trans. McGraw‐Hill; 1962. [Google Scholar]
- 18. Kirkwood JG. On the theory of optical rotatory power. J Chem Phys. 1937;5(6):479‐491. [Google Scholar]
- 19. Kuhn W. The physical significance of optical rotatory power. Trans Faraday Soc. 1930;26:293‐308. [Google Scholar]
- 20. Mason SF, Vane GW. The circular dichroism and absorption spectra of alkaloids containing the aniline chromophore. The absolute configuration of calycanthine. J Chem Soc B. 1966;370‐374. [Google Scholar]
- 21. Harada N, Nakanishi K. Exciton chirality method and its application to configurational and conformational studies of natural products. Acc Chem Res. 1972;5(8):257‐263. [Google Scholar]
- 22. Harada N, Nakanishi K. Circular Dichroic Spectroscopy ‐ Exciton Coupling in Organic Stereochemistry. University Science Books; 1983. [Google Scholar]
- 23. Harada N. The enduring legacy of Koji Nakanishi's research on natural products and bioorganic chemistry. Part 2. Inception and establishment of the ECD exciton chirality method in 1960s to 1970s: a marvel of Nakanishi's Japanese team. Chirality. 2020;32(5):535‐546. [DOI] [PubMed] [Google Scholar]
- 24. Berova N, Nakanishi K. Exciton chirality method: principles and applications. In: Berova N, Nakanishi K, Woody RW, eds. Circular Dichroism: Principles and Applications. 2nd ed. Wiley‐VCH; 2000:337‐382. [Google Scholar]
- 25. Berova N, Harada N, Nakanishi K. Exciton coupling. In: Lindon JC, Tranter GE, Holmes J, eds. Encyclopedia of Spectroscopy and Spectrometry. Elsevier; 2000:470‐488. [Google Scholar]
- 26. Berova N, Ellestad GA, Harada N. Characterization by circular dichroism spectroscopy. In: Mander L, Liu H‐W, eds. Comprehensive Natural Products II. Vol 9. Elsevier; 2010:91‐146. [Google Scholar]
- 27. Berova N, Ellestad G, Nakanishi K, Harada N. Recent advances in the application of electronic circular dichroism for studies of bioactive natural products. In: Tringali C, ed. Bioactive Compounds from Natural Sources. 2nd ed. CRC Press; 2012:133‐166. [Google Scholar]
- 28. Harada N, Berova N. Spectroscopic analysis: exciton circular dichroism for chiral analysis. In: Carreira E, Yamamoto H, eds. Comprehensive Chirality. Vol 8. Elsevier; 2012:449‐477. [Google Scholar]
- 29. Harada N, Nakanishi K, Berova N. Electronic CD exciton chirality method: principles and applications. In: Berova N, Polavarapu PL, Nakanishi K, Woody RW, eds. Comprehensive Chiroptical Spectroscopy. Vol 2. John Wiley & Sons, Inc.; 2012:115‐166. [Google Scholar]
- 30. Berova N, Harada N, Nakanishi K. Exciton coupling. In: Lindon JC, Tranter GE, Koppenaal DW, eds. Encyclopedia of Spectroscopy and Spectrometry. 3rd ed. Academic Press; 2017:539‐557. [Google Scholar]
- 31. Vazquez JT. Features of electronic circular dichroism and tips for its use in determining absolute configuration. Tetrahedron Asymm. 2017;28(10):1199‐1211. [Google Scholar]
- 32. Telfer SG, McLean TM, Waterland MR. Exciton coupling in coordination compounds. Dalton Trans. 2011;40(13):3097‐3108. [DOI] [PubMed] [Google Scholar]
- 33. Ziegler M, von Zelewsky A. Charge‐transfer excited state properties of chiral transition metal coordination compounds studied by chiroptical spectroscopy. Coord Chem Rev. 1998;177(1):257‐300. [Google Scholar]
- 34. Nehira T, Parish CA, Jockusch S, Turro NJ, Nakanishi K, Berova N. Fluorescence‐detected exciton‐coupled circular dichroism: scope and limitation in structural studies of organic molecules. J am Chem Soc. 1999;121(38):8681‐8691. [Google Scholar]
- 35. Tanaka K, Pescitelli G, Nakanishi K, Berova N. Fluorescence detected exciton coupled circular dichroism: development of new fluorescent reporter groups for structural studies. Monatsh Chem. 2005;136(3):367‐395. [Google Scholar]
- 36. Shi X‐W, Lu Q‐Q, Pescitelli G, Ivšić T, Zhou J‐H, Gao J‐M. Three sesquiterpenoid dimers from Chloranthus japonicus: absolute configuration of chlorahololide A and related compounds. Chirality. 2016;28(2):158‐163. [DOI] [PubMed] [Google Scholar]
- 37. Pescitelli G, Di Bari L. Revision of the absolute configuration of preussilides A‐F established by the exciton chirality method. J Nat Prod. 2017;80(10):2855‐2859. [DOI] [PubMed] [Google Scholar]
- 38. Pescitelli G, Di Bari L. Exciton coupling between enones: quassinoids revisited. Chirality. 2017;29(9):476‐485. [DOI] [PubMed] [Google Scholar]
- 39. Meng J, Cheng W, Heydari H, et al. Sorbicillinoid‐based metabolites from a sponge‐derived fungus Trichoderma saturnisporum . Mar Drugs. 2018;16(7):226 [DOI] [PMC free article] [PubMed] [Google Scholar]
- 40. Szymkowiak J, Kwit M. Electronic and vibrational exciton coupling in oxidized trianglimines. Chirality. 2018;30(2):117‐130. [DOI] [PubMed] [Google Scholar]
- 41. Zhu G, Kong F, Wang Y, Fu P, Zhu W. Cladodionen, a cytotoxic hybrid polyketide from the marine‐derived Cladosporium sp. OUCMDZ‐1635. Mar Drugs. 2018;16(2):71 [DOI] [PMC free article] [PubMed] [Google Scholar]
- 42. Ye F, Zhu Z‐D, Chen J‐S, et al. Xishacorenes A–C, diterpenes with bicyclo[3.3.1]nonane nucleus from the Xisha soft coral Sinularia polydactyla . Org Lett. 2017;19(16):4183‐4186. [DOI] [PubMed] [Google Scholar]
- 43. Molinski TF, Salib MN, Pearce AN, Copp BR. The configuration of distaminolyne A is S: quantitative evaluation of exciton coupling circular dichroism of N,O‐bis‐arenoyl‐1‐amino‐2‐alkanols. J Nat Prod. 2019;82(5):1183‐1189. [DOI] [PubMed] [Google Scholar]
- 44. Wu L, Xie X, Wang X‐B, Yang M‐H, Luo J, Kong L‐Y. Diverse benzyl phloroglucinol‐based meroterpenoids from the fruits of Melaleuca leucadendron . Tetrahedron. 2020;76(28‐29):131326 [Google Scholar]
- 45. Song X‐Q, Sun J, Yu J‐H, Zhang J‐S, Bao J, Zhang H. Prenylated indole alkaloids and lignans from the flower buds of Tussilago farfara . Fitoterapia. 2020;146:104729 [DOI] [PubMed] [Google Scholar]
- 46. Dong S, Lin B, Xue X, Bai M, Huang X, Song S. Discovery of β‐dihydroagarofuran‐type sesquiterpenoids from the leaves of Tripterygium wilfordii with neuroprotective activities. Chin J Chem. 2021;39(2):337‐344. [Google Scholar]
- 47. Shi YM, Hu K, Pescitelli G, et al. Schinortriterpenoids with identical configuration but distinct ECD spectra generated by nondegenerate exciton coupling. Org Lett. 2018;20(6):1500‐1504. [DOI] [PubMed] [Google Scholar]
- 48. Cheng Z, Liu D, Cheng W, Proksch P, Lin W. Versiquinazolines L–Q, new polycyclic alkaloids from the marine‐derived fungus Aspergillus versicolor . RSC Adv. 2018;8(55):31427‐31439. [DOI] [PMC free article] [PubMed] [Google Scholar]
- 49. Gao N, Shang Z‐C, Yu P, et al. Alkaloids from the endophytic fungus Penicillium brefeldianum and their cytotoxic activities. Chin Chem Lett. 2017;28(6):1194‐1199. [Google Scholar]
- 50. Endo Y, Kasahara T, Harada K, et al. Sucupiranins A–L, furanocassane diterpenoids from the seeds of Bowdichia virgilioides . J Nat Prod. 2017;80(12):3120‐3127. [DOI] [PubMed] [Google Scholar]
- 51. Long H, Cheng Z, Huang W, et al. Diasteltoxins A–C, asteltoxin‐based dimers from a mutant of the sponge‐associated Emericella variecolor fungus. Org Lett. 2016;18(18):4678‐4681. [DOI] [PubMed] [Google Scholar]
- 52. Wang P‐F, Ma S‐G, Li L, Li Y‐H, Qu J, Yu S‐S. Humulane‐type and germacrane‐type sesquiterpenoids from the fruits of Xanthium spinosum Linn. Phytochemistry. 2021;189:112818 [DOI] [PubMed] [Google Scholar]
- 53. Pescitelli G, Di Bari L, Berova N. Application of electronic circular dichroism in the study of supramolecular systems. Chem Soc Rev. 2014;43(15):5211‐5233. [DOI] [PubMed] [Google Scholar]
- 54. Shunsuke K, Mari I, Yoichi H. Chiroptical probes for determination of absolute stereochemistry by circular dichroism exciton chirality method. In: Polavarapu PL, ed. Chiral Analysis. 2nd ed. Elsevier; 2018:345‐366. [Google Scholar]
- 55. Pescitelli G. For a correct application of the CD exciton chirality method: the case of laucysteinamide A. Mar Drugs. 2018;16(10):388 [DOI] [PMC free article] [PubMed] [Google Scholar]
- 56. Pescitelli G, Gabriel S, Wang Y, Fleischhauer J, Woody RW, Berova N. Theoretical analysis of the porphyrin‐porphyrin exciton interaction in circular dichroism spectra of dimeric tetraarylporphyrins. J am Chem Soc. 2003;125(25):7613‐7628. [DOI] [PubMed] [Google Scholar]
- 57. Chen S‐ML, Harada N, Nakanishi K. Long range effect in the exciton chirality method. J am Chem Soc. 1974;96(23):7352‐7354. [Google Scholar]
- 58. Cai G, Bozhkova N, Odingo J, Berova N, Nakanishi K. Circular dichroism exciton chirality method. New red‐shifted chromophores for hydroxyl groups. J am Chem Soc. 1993;115(16):7192‐7198. [Google Scholar]
- 59. Gargiulo D, Ikemoto N, Odingo J, et al. CD exciton chirality method: Schiff base and cyanine dye‐type chromophores for primary amino groups. J am Chem Soc. 1994;116(9):3760‐3767. [Google Scholar]
- 60. Mason SF, Seal RH, Roberts DR. Optical activity in the biaryl series. Tetrahedron. 1974;30(12):1671‐1682. [Google Scholar]
- 61. Di Bari L, Pescitelli G, Salvadori P. Conformational study of 2,2′‐homosubstituted 1,1′‐binaphthyls by means of UV and CD spectroscopy. J am Chem Soc. 1999;121(35):7998‐8004. [Google Scholar]
- 62. Di Bari L, Pescitelli G, Marchetti F, Salvadori P. Anomalous CD/UV exciton splitting of a binaphthyl derivative: the case of 2,2'‐diiodo‐1,1'‐binaphthalene. J am Chem Soc. 2000;122(27):6395‐6398. [Google Scholar]
- 63. Chen J, Ferreira AJ, Beaudry CM. Synthesis of bis(indole) alkaloids from Arundo donax: the ynindole Diels–Alder reaction, conformational chirality, and absolute stereochemistry. Angew Chem Int Ed. 2014;53(44):11931‐11934. [DOI] [PubMed] [Google Scholar]
- 64. Bruhn T, Pescitelli G, Jurinovich S, et al. Axially chiral BODIPY DYEmers: an apparent exception to the exciton chirality rule. Angew Chem Int Ed. 2014;53(52):14592‐14595. [DOI] [PubMed] [Google Scholar]
- 65. Bruhn T, Pescitelli G, Witterauf F, et al. Cryptochirality in 2,2'‐coupled BODIPY DYEmers. Eur J Org Chem. 2016;2016(24):4236‐4243. [Google Scholar]
- 66. Collet A, Gottarelli G. Exciton optical activity of molecules containing three and six coupled oscillators belonging to C3 and D3 point groups: applications to cyclotriveratrylenes and cryptophanes. Croat Chem Acta. 1989;62:279‐292. [Google Scholar]
- 67. Baydoun O, Buffeteau T, Brotin T. Enantiopure cryptophane derivatives: synthesis and chiroptical properties. Chirality. 2021;33(10):562‐596. [DOI] [PubMed] [Google Scholar]
- 68. Concilio G, Talotta C, Gaeta C, et al. Absolute configuration assignment of chiral resorcin[4]arenes from ECD spectra. J Org Chem. 2017;82(1):202‐210. [DOI] [PubMed] [Google Scholar]
- 69. Zhang X, Han B, Feng Z‐M, Yang Y‐N, Jiang J‐S, Zhang P‐C. Ferulic acid derivatives from Ligusticum chuanxiong . Fitoterapia. 2018;125:147‐154. [DOI] [PubMed] [Google Scholar]
- 70. Morinaka BI, Molinski TF. Exciton coupling circular dichroism of an allylic N‐imidazolyl group in amaranzole A, a marine natural product from Phorbas amaranthus . Chirality. 2008;20(9):1066‐1070. [DOI] [PMC free article] [PubMed] [Google Scholar]
- 71. Ozcelik A, Pereira‐Cameselle R, Mosquera RA, Peña‐Gallego Á, Alonso‐Gómez JL. Chiroptical symmetry analysis of trianglimines: a case study. Symmetry. 2019;11(10):1245 [Google Scholar]
- 72. Matile S, Berova N, Nakanishi K, Novkova S, Philipova I, Blagoev B. Porphyrins: powerful chromophores for structural studies by exciton‐coupled circular dichroism. J am Chem Soc. 1995;117(26):7021‐7022. [Google Scholar]
- 73. Matile S, Berova N, Nakanishi K, Fleischhauer J, Woody RW. Structural studies by exciton coupled circular dichroism over a large distance: porphyrin derivatives of steroids, dimeric steroids, and brevetoxin B. J am Chem Soc. 1996;118(22):5198‐5206. [Google Scholar]
- 74. Moore B II, Autschbach J. Density functional study of tetraphenylporphyrin long‐range exciton coupling. ChemistryOpen. 2012;1(4):184‐194. [DOI] [PMC free article] [PubMed] [Google Scholar]
- 75. Tanaka K, Itagaki Y, Satake M, et al. Three challenges toward the assignment of absolute configuration of gymnocin‐B. J am Chem Soc. 2005;127(26):9561‐9570. [DOI] [PMC free article] [PubMed] [Google Scholar]
- 76. Berova N, Pescitelli G, Petrovic AG, Proni G. Probing molecular chirality by CD‐sensitive dimeric metalloporphyrin hosts. Chem Commun. 2009;(40):5958‐5980. [DOI] [PubMed] [Google Scholar]
- 77. Gholami H, Chakraborty D, Zhang J, Borhan B. Absolute stereochemical determination of organic molecules through induction of helicity in host–guest complexes. Acc Chem Res. 2021;54(3):654‐667. [DOI] [PubMed] [Google Scholar]
- 78. Dhamija A, Mondal P, Saha B, Rath SP. Induction, control, and rationalization of supramolecular chirogenesis using metalloporphyrin tweezers: a structure‐function correlation. Dalton Trans. 2020;49(31):10679‐10700. [DOI] [PubMed] [Google Scholar]
- 79. Valderrey V, Aragay G, Ballester P. Porphyrin tweezer receptors: binding studies, conformational properties and applications. Coord Chem Rev. 2014;258–259:137‐156. [Google Scholar]
- 80. Karnaukhova E, Vasileiou C, Wang A, Berova N, Nakanishi K, Borhan B. Circular dichroism of heterochromophoric and partially regenerated purple membrane: search for exciton coupling. Chirality. 2006;18(2):72‐83. [DOI] [PubMed] [Google Scholar]
- 81. Pescitelli G, Woody RW. The exciton origin of the visible circular dichroism spectrum of bacteriorhodopsin. J Phys Chem B. 2012;116(23):6751‐6763. [DOI] [PubMed] [Google Scholar]
- 82. Pescitelli G, Kato HE, Oishi S, et al. Exciton circular dichroism in channelrhodopsin. J Phys Chem B. 2014;118(41):11873‐11885. [DOI] [PubMed] [Google Scholar]
- 83. Snatzke G. Circular dichroism and absolute conformation: application of qualitative MO theory to chiroptical phenomena. Angew Chem Int Ed Eng. 1979;18(5):363‐377. [Google Scholar]
- 84. Koreeda M, Harada N, Nakanishi K. Exciton chirality methods as applied to conjugated enones, esters, and lactones. J am Chem Soc. 1974;96(1):266‐268. [Google Scholar]
- 85. Fang X, Di YT, Zhang Y, et al. Unprecedented quassinoids with promising biological activity from Harrisonia perforata . Angew Chem Int Ed. 2015;54(19):5592‐5595. [DOI] [PubMed] [Google Scholar]
- 86. Harada N, Iwabuchi J, Yokota Y, Uda H, Nakanishi K. A chiroptical method for determining the absolute configuration of allylic alcohols. J am Chem Soc. 1981;103(18):5590‐5591. [Google Scholar]
- 87. Humpf H‐U, Berova N, Nakanishi K, Jarstfer MB, Poulter CD. Allylic and homoallylic CD exciton chirality: a sensitive method for determining the absolute stereochemistry of natural products. J Org Chem. 1995;60(11):3539‐3542. [Google Scholar]
- 88. Zhang C, Naman C, Engene N, Gerwick W. Laucysteinamide A, a hybrid PKS/NRPS metabolite from a Saipan cyanobacterium, cf. Caldora penicillata . Mar Drugs. 2017;15(4):121 [DOI] [PMC free article] [PubMed] [Google Scholar]
- 89. Harada N, Saito A, Ono H, et al. A CD method for determination of the absolute stereochemistry of acyclic glycols. 2. Application of the CD exciton chirality method to acyclic 1,2‐dibenzoates systems. Enantiomer. 1996;1:119‐138. [Google Scholar]
- 90. Akritopoulou‐Zanze I, Nakanishi K, Stepowska H, Grzeszczyk B, Zamojski A, Berova N. Configuration of heptopyranoside and heptofuranoside side chains: 2‐anthroate, a powerful chromophore for exciton coupled CD. Chirality. 1997;9(7):699‐712. [DOI] [PubMed] [Google Scholar]
- 91. Pescitelli G, Di Bari L, Berova N. Conformational aspects in the studies of organic compounds by electronic circular dichroism. Chem Soc Rev. 2011;40(9):4603‐4625. [DOI] [PubMed] [Google Scholar]
- 92. Rosini C, Scamuzzi S, Uccello‐Barretta G, Salvadori P. Synthesis and stereochemical characterization of some optically active 1,2‐dinaphthylethane‐1,2‐diols. J Org Chem. 1994;59(24):7395‐7400. [Google Scholar]
- 93. Rosini C, Scamuzzi S, Focati MP, Salvadori P. A general, multitechnique approach to the stereochemical characterization of 1,2‐diarylethane‐1,2‐diols. J Org Chem. 1995;60(25):8289‐8293. [Google Scholar]
- 94. Donnoli MI, Scafato P, Superchi S, Rosini C. Synthesis and stereochemical characterization of optically active 1,2‐diarylethane‐1,2‐diols: useful chiral controllers in the Ti‐mediated enantioselective sulfoxidation. Chirality. 2001;13(5):258‐265. [DOI] [PubMed] [Google Scholar]
- 95. Superchi S, Donnoli MI, Rosini C. Determination of the absolute configuration of 1‐arylethane‐1,2‐diols by a nonempirical analysis of the CD spectra of their 4‐biphenylboronates. Org Lett. 1999;1(13):2093‐2096. [Google Scholar]
- 96. Superchi S, Casarini D, Summa C, Rosini C. A general and nonempirical approach to the determination of the absolute configuration of 1‐aryl‐1,2‐diols. J Org Chem. 2004;69(5):1685‐1694. [DOI] [PubMed] [Google Scholar]
- 97. Superchi S, Rosini C, Mazzeo G, Giorgio E. Determination of molecular absolute configuration: guidelines for selecting a suitable chiroptical approach. In: Berova N, Polavarapu PL, Nakanishi K, Woody RW, eds. Comprehensive Chiroptical Spectroscopy. Vol 2. John Wiley & Sons, Inc.; 2012:421‐447. [Google Scholar]
- 98. Kosaka M, Kuwahara S, Watanabe M, Harada N, Job GE, Pirkle WH. Comparison of CD spectra of (2‐methylphenyl)‐ and (2,6‐dimethylphenyl)‐phenylmethanols leads to erroneous absolute configurations. Enantiomer. 2002;7(4‐5):213‐217. [DOI] [PubMed] [Google Scholar]
- 99. Padula D, Pescitelli G. How and how much molecular conformation affects electronic circular dichroism: the case of 1,1‐diarylcarbinols. Molecules. 2018;23(1): [DOI] [PMC free article] [PubMed] [Google Scholar]
- 100. Byun YS, Lightner DA. Exciton coupling from dipyrrinone chromophores. J Org Chem. 1991;56(21):6027‐6033. [Google Scholar]
- 101. Boiadjiev SE, Lightner DA. Exciton chirality. (A) Origins of and (B) applications from strongly fluorescent dipyrrinone chromophores. Monatsh Chem. 2005;136(3):489‐508. [Google Scholar]
- 102. Tejera S, Dorta RL, Vázquez JT. Study of aryl triazoles for absolute configuration determination. Tetrahedron Asymm. 2016;27(17‐18):896‐909. [Google Scholar]
- 103. Chisholm JD, Golik J, Krishnan B, Matson JA, Van Vranken DL. A caveat in the application of the exciton chirality method to N,N‐dialkyl amides. Synthesis and structural revision of AT2433‐B1. J am Chem Soc. 1999;121(15):3801‐3802. [Google Scholar]
- 104. Gargiulo D, Derguini F, Berova N, Nakanishi K, Harada N. Unique ultraviolet‐visible and circular dichroism behavior due to exciton coupling in a biscyanine dye. J am Chem Soc. 1991;113(18):7046‐7047. [Google Scholar]
- 105. Liu C, Shen Q, Zhang F, et al. A new benzofuran derivatives from flue‐cured tobacco and its anti‐tobacco mosaic virus activity. Asian J Chem. 2015;27(8):2753‐2755. [Google Scholar]
- 106. Koike K, Yoshino H, Li H‐Y, Sasaki T, Li W. Determination of the absolute configuration of picrasidine Y, a naturally occurring β‐carboline alkaloid. Tetrahedron Lett. 2015;56(38):5306‐5308. [Google Scholar]
- 107. Zhou Z, Wang Z, Li L, et al. The stereochemistry of baishouwubenzophenone, a unique atropisomer from C. wilfordii . J Mol Struct. 2016;1125:370‐373. [Google Scholar]
- 108. Wang F, Mao M‐F, Wei G‐Z, Gao Y, Ren F‐C, Liu J‐K. Hybridaphniphyllines A and B, Daphniphyllum alkaloid and iridoid hybrids suggestive of Diels–Alder cycloaddition in Daphniphyllum longeracemosum . Phytochemistry. 2013;95:428‐435. [DOI] [PubMed] [Google Scholar]
- 109. Song Q‐Y, Jiang K, Zhao Q‐Q, Gao K, Jin X‐J, Yao X‐J. Eleven new highly oxygenated triterpenoids from the leaves and stems of Schisandra chinensis . Org Biomol Chem. 2013;11(7):1251‐1258. [DOI] [PubMed] [Google Scholar]
- 110. Lu W‐J, Xu W‐J, Zhang M‐H, et al. Diverse polycyclic polyprenylated acylphloroglucinol congeners with anti‐nonalcoholic steatohepatitis activity from Hypericum forrestii . J Nat Prod. 2021;84(4):1135‐1148. [DOI] [PubMed] [Google Scholar]
- 111. Li W‐X, Xu W‐J, Luo J, Yang L, Kong L‐Y. Type B polycyclic polyprenylated acylphloroglucinols from the roots of Hypericum beanii . Chin J Nat Med. 2021;19(5):385‐390. [DOI] [PubMed] [Google Scholar]
- 112. Xu W‐J, Tang P‐F, Lu W‐J, et al. Hyperberins A and B, type B polycyclic polyprenylated acylphloroglucinols with bicyclo[5.3.1]hendecane core from Hypericum beanii . Org Lett. 2019;21(21):8558‐8562. [DOI] [PubMed] [Google Scholar]
- 113. Ming W, Zhang Y, Sun Y, et al. Guaianolide sesquiterpenes with significant antiproliferative activities from the leaves of Artemisia argyi . Front Chem. 2021;9:698700. [DOI] [PMC free article] [PubMed] [Google Scholar]
- 114. Naman CB, Gromovsky AD, Vela CM, et al. Antileishmanial and cytotoxic activity of some highly oxidized abietane diterpenoids from the bald cypress, Taxodium distichum . J Nat Prod. 2016;79(3):598‐606. [DOI] [PMC free article] [PubMed] [Google Scholar]
- 115. Pescitelli G, Di Bari L. Comment on “breakdown of exciton splitting through electron donor‐acceptor interaction: a caveat for the application of exciton chirality method in macromolecules”. J Phys Chem C. 2014;118(41):24197‐24198. [Google Scholar]
- 116. Covington CL, Nicu VP, Polavarapu PL. Determination of the absolute configurations using exciton chirality method for vibrational circular dichroism: right answers for the wrong reasons? J Phys Chem a. 2015;119(42):10589‐10601. [DOI] [PubMed] [Google Scholar]
- 117. Wang Z, Zhang P, Cui L, Li Q, Kong L, Luo J. Chisosiamens A–E, five new ring‐intact limonoids with isomerized furan ring from the fruit of Chisocheton siamensis . Fitoterapia. 2021;151:104873 [DOI] [PubMed] [Google Scholar]
- 118. Dong J, Akritopoulou‐Zanze I, Guo J, Berova N, Nakanishi K, Harada N. Theoretical calculation of circular dichroic exciton‐split spectra in presence of three interacting 2‐naphthoate chromophores. Enantiomer. 1997;2(5):397‐409. [PubMed] [Google Scholar]
- 119. Raabe G, Fleischhauer J, Woody RW. Independent systems theory for predicting electronic circular dichroism. In: Berova N, Polavarapu PL, Nakanishi K, Woody RW, eds. Comprehensive Chiroptical Spectroscopy. Vol 1. John Wiley & Sons, Inc.; 2012:541‐591. [Google Scholar]
- 120. Superchi S, Giorgio E, Rosini C. Structural determinations by circular dichroism spectra analysis using coupled oscillator methods: an update of the applications of the DeVoe polarizability model. Chirality. 2004;16(7):422‐451. [DOI] [PubMed] [Google Scholar]
- 121. Jurinovich S, Cupellini L, Guido CA, Mennucci B. EXAT: EXcitonic analysis tool. J Comput Chem. 2018;39(5):279‐286. [DOI] [PubMed] [Google Scholar]
- 122. Green JA, Asha H, Santoro F, Improta R. Excitonic model for strongly coupled multichromophoric systems: the electronic circular dichroism spectra of guanine quadruplexes as test cases. J Chem Theory Comput. 2021;17(1):405‐415. [DOI] [PubMed] [Google Scholar]
- 123. Harada N, Takuma Y, Uda H. Circular dichroic power due to chiral exciton coupling between two polyacene chromophores. J am Chem Soc. 1978;100(13):4029‐4036. [Google Scholar]
- 124. Harada N, Tamai Y, Uda H. Circular dichroic power of chiral triptycenes. J am Chem Soc. 1980;102(2):506‐511. [Google Scholar]
- 125. Telfer SG, Tajima N, Kuroda R. CD spectra of polynuclear complexes of diimine ligands: theoretical and experimental evidence for the importance of internuclear exciton coupling. J am Chem Soc. 2004;126(5):1408‐1418. [DOI] [PubMed] [Google Scholar]
- 126. Autschbach J, Nitsch‐Velasquez L, Rudolph M. Time‐dependent density functional response theory for electronic chiroptical properties of chiral molecules. Top Curr Chem. 2011;298:1‐98. [DOI] [PubMed] [Google Scholar]
- 127. Yanai T, Tew DP, Handy NC. A new hybrid exchange–correlation functional using the Coulomb‐attenuating method (CAM‐B3LYP). Chem Phys Lett. 2004;393(1‐3):51‐57. [Google Scholar]
- 128. Padula D, Di Pietro S, Capozzi MAM, Cardellicchio C, Pescitelli G. Strong intermolecular exciton couplings in solid‐state circular dichroism of aryl benzyl sulfoxides. Chirality. 2014;26(9):462‐470. [DOI] [PubMed] [Google Scholar]
- 129. Stončius S, Butkus E. Chiral cleft‐like methanocyclooctadiindoles: synthesis, circular dichroism and TDDFT study. Tetrahedron Lett. 2020;61(37):152302 [Google Scholar]
- 130. Martin RL. Natural transition orbitals. J Chem Phys. 2003;118(11):4775‐4777. [Google Scholar]
- 131. Spata VA, Matsika S. Role of excitonic coupling and charge‐transfer states in the absorption and CD spectra of adenine‐based oligonucleotides investigated through QM/MM simulations. J Phys Chem a. 2014;118(51):12021‐12030. [DOI] [PubMed] [Google Scholar]
- 132. Di Bari L, Guillarme S, Hermitage S, Jay DA, Pescitelli G, Whiting A. Absolute stereochemistry assignment of N‐phosphorylimine‐derived aza‐Diels‐Alder adducts with TDDFF CD calculations. Chirality. 2005;17(6):323‐331. [DOI] [PubMed] [Google Scholar]
- 133. Bagdžiūnas G, Butkus E, Stončius S. Homoconjugation vs. exciton coupling in chiral α,β‐unsaturated bicyclo[3.3.1]nonane dinitrile and carboxylic acids. Molecules. 2014;19(7):9893‐9906. [DOI] [PMC free article] [PubMed] [Google Scholar]
- 134. Bifulco G, Dambruoso P, Gomez‐Paloma L, Riccio R. Determination of relative configuration in organic compounds by NMR spectroscopy and computational methods. Chem Rev. 2007;107(9):3744‐3779. [DOI] [PubMed] [Google Scholar]
- 135. Gil RR, Navarro‐Vázquez A. Application of the nuclear Overhauser effect to the structural elucidation of natural products. In: Williams A, Martin G, Rovnyak D, eds. Modern NMR Approaches to the Structure Elucidation of Natural Products: Volume 2: Data Acquisition and Applications to Compound Classes. Vol 2. The Royal Society of Chemistry; 2017:1‐38. [Google Scholar]
- 136. Gil RR. Constitutional, configurational, and conformational analysis of small organic molecules on the basis of NMR residual dipolar couplings. Angew Chem Int Ed. 2011;50(32):7222‐7224. [DOI] [PubMed] [Google Scholar]
- 137. Casarini D, Lunazzi L, Mazzanti A. Recent advances in stereodynamics and conformational analysis by dynamic NMR and theoretical calculations. Eur J Org Chem. 2010;2010(11):2035‐2056. [Google Scholar]
- 138. Petrovic AG, Berova N, Alonso‐Gómez JL. Absolute configuration and conformational analysis of chiral compounds via experimental and theoretical prediction of chiroptical properties: ORD, ECD, and VCD. In: Cid M‐M, Bravo J, eds. Structure Elucidation in Organic Chemistry. Wiley‐VCH; 2015:65‐104. [Google Scholar]
- 139. Polavarapu PL, Santoro E. Vibrational optical activity for structural characterization of natural products. Nat Prod Rep. 2020;37(12):1661‐1699. [DOI] [PubMed] [Google Scholar]
- 140. Lewis‐Atwell T, Townsend PA, Grayson MN. Comparisons of different force fields in conformational analysis and searching of organic molecules: a review. Tetrahedron. 2021;79:131865 [Google Scholar]
- 141. Halgren TA, Nachbar RB. Merck molecular force field. IV. Conformational energies and geometries for MMFF94. J Comput Chem. 1996;17(5‐6):587‐615. [Google Scholar]
- 142. Halgren TA. Merck molecular force field. I. Basis, form, scope, parameterization, and performance of MMFF94. J Comput Chem. 1996;17(5‐6):490‐519. [Google Scholar]
- 143. Hinchliffe A. Molecular Modelling for Beginners. Wiley; 2008. [Google Scholar]
- 144. Hehre WJ. A Guide to Molecular Mechanics and Quantum Chemical Calculations. Wavefunction, Inc; 2003. [Google Scholar]
- 145. Cappelli C. Integrated QM/polarizable MM/continuum approaches to model chiroptical properties of strongly interacting solute–solvent systems. Int J Quantum Chem. 2016;116(21):1532‐1542. [Google Scholar]
- 146. Sharapa DI, Genaev A, Cavallo L, Minenkov Y. A robust and cost‐efficient scheme for accurate conformational energies of organic molecules. ChemPhysChem. 2019;20(1):92‐102. [DOI] [PubMed] [Google Scholar]
- 147. Rocha GB, Freire RO, Simas AM, Stewart JJP. RM1: a reparameterization of AM1 for H, C, N, O, P, S, F, Cl, Br, and I. J Comput Chem. 2006;27(10):1101‐1111. [DOI] [PubMed] [Google Scholar]
- 148. Goerigk L, Grimme S. A thorough benchmark of density functional methods for general main group thermochemistry, kinetics, and noncovalent interactions. Phys Chem Chem Phys. 2011;13(14):6670‐6688. [DOI] [PubMed] [Google Scholar]
- 149. Brémond É, Savarese M, Su NQ, et al. Benchmarking density functionals on structural parameters of small‐/medium‐sized organic molecules. J Chem Theory Comput. 2016;12(2):459‐465. [DOI] [PubMed] [Google Scholar]
- 150. Karton A, Spackman PR. Evaluation of density functional theory for a large and diverse set of organic and inorganic equilibrium structures. J Comput Chem. 2021;42(22):1590‐1601. [DOI] [PubMed] [Google Scholar]
- 151. Chai J‐D, Head‐Gordon M. Long‐range corrected hybrid density functionals with damped atom–atom dispersion corrections. Phys Chem Chem Phys. 2008;10(44):6615‐6620. [DOI] [PubMed] [Google Scholar]
- 152. Becke AD. Density‐functional thermochemistry. III. The role of exact exchange. J Chem Phys. 1993;98(7):5648‐5652. [Google Scholar]
- 153. Lee C, Yang W, Parr RG. Development of the Colle‐Salvetti correlation‐energy formula into a functional of the electron density. Phys Rev B. 1988;37(2):785‐789. [DOI] [PubMed] [Google Scholar]
- 154. Grimme S, Antony J, Ehrlich S, Krieg H. A consistent and accurate ab initio parametrization of density functional dispersion correction (DFT‐D) for the 94 elements H‐Pu. J Chem Phys. 2010;132(15):154104 [DOI] [PubMed] [Google Scholar]
- 155. Jensen SR, Saha S, Flores‐Livas JA, et al. The elephant in the room of density functional theory calculations. J Phys Chem Lett. 2017;8(7):1449‐1457. [DOI] [PubMed] [Google Scholar]
- 156. Habgood M, James T, Heifetz A. Conformational searching with quantum mechanics. In: Heifetz A, ed. Quantum Mechanics in Drug Discovery. Springer US; 2020:207‐229. [DOI] [PubMed] [Google Scholar]
- 157. Weigend F, Ahlrichs R. Balanced basis sets of split valence, triple zeta valence and quadruple zeta valence quality for H to Rn: design and assessment of accuracy. Phys Chem Chem Phys. 2005;7(18):3297‐3305. [DOI] [PubMed] [Google Scholar]
- 158. Tomasi J, Mennucci B, Cammi R (Eds). Continuum Solvation Models in Chemical Physics: From Theory to Applications. Wiley; 2007. [Google Scholar]
- 159. Marenich AV, Cramer CJ, Truhlar DG. Universal solvation model based on solute electron density and on a continuum model of the solvent defined by the bulk dielectric constant and atomic surface tensions. J Phys Chem B. 2009;113(18):6378‐6396. [DOI] [PubMed] [Google Scholar]
- 160. Hehre W, Klunzinger P, Deppmeier B, et al. Efficient protocol for accurately calculating 13C chemical shifts of conformationally flexible natural products: scope, assessment, and limitations. J Nat Prod. 2019;82(8):2299‐2306. [DOI] [PubMed] [Google Scholar]
Associated Data
This section collects any data citations, data availability statements, or supplementary materials included in this article.
Supplementary Materials
Figure S1. Lowest‐energy minima of compound 4a (truncated model of ligusticumaldehyde A, 4) calculated at ωB97X‐D/6‐31+G(d) level with SMD for methanol, with internal energies in kcal/mol and population at 300 K.
Figure S2. (a) Transition‐dipole direction for the major transition of 7‐methoxy‐3‐methyl‐2,3‐dihydrobenzofuran‐5‐carbaldehydethe, the chromophoric unit of compound 4, calculated at CAM‐B3LYP/def2‐TZVP//ωB97X‐D/6‐31+G(d) level in vacuo. The transition is predicted at 273.88 nm, oscillator strength f = 0.18, major excitation contribution 51 → 52 (coefficient 0.60). (b) Frontier orbitals involved in the major π‐π* transition (isovalue 0.02).
Table S1. Parameters of low‐lying transitions of compound 13 calculated at B3LYP/def2‐TZVP//ωB97X‐D/6‐31+G(d) level in vacuo.
Figure S3. Frontiers molecular orbitals of compound 13 calculated at B3LYP/def2‐TZVP//ωB97X‐D/6‐31+G(d) level in vacuo. Isovalue 0.02.
Table S2. Parameters of low‐lying transitions of compound 15 calculated at CAM‐B3LYP/def2‐TZVP//ωB97X‐D/6‐31+G(d) level with PCM for methanol.
Figure S4. Frontiers molecular orbitals of compound 15 calculated at CAM‐B3LYP/def2‐TZVP//ωB97X‐D/6‐31+G(d) level with PCM for methanol. Isovalue 0.03.
Figure S5. Lowest‐energy structure of compound 17 calculated at ωB97X‐D/6‐31+G(d) level in vacuo. (a) Distance measurement between the α,β‐unsaturated lactone and the lactone group. (b) Close‐up view of the α,β‐unsaturated lactone moiety, highlighting its deviation from planarity. The angle between the planes defined by the C=C double bond (C1,C2,C3) and COO group is 23°.
Figure S6. (a) Transition‐dipole direction for the major transition of the chromophoric α‐methylene γ‐lactone unit of compound 20a calculated at CAM‐B3LYP/def2‐TZVP//ωB97X‐D/6‐311+G(d,p) level in vacuo. The transition is predicted at 196.74 nm, oscillator strength f = 0.28, largest excitation contributions 33 → 35 (coefficient 0.59) and 34 → 35 (−0.37). (b) Frontier orbitals involved in the major π‐π* transition (isovalue 0.04).
Figure S7. (a) Transition‐dipole direction for the major transition of the chromophoric p‐quinone unit of compound 21 calculated at CAM‐B3LYP/def2‐TZVP//ωB97X‐D/6‐31+G(d) level in vacuo. The transition is predicted at 245.87 nm, oscillator strength f = 0.28, largest excitation contribution 38 → 41 (coefficient 0.66). (b) Frontier orbitals involved in the major π‐π* transition (isovalue 0.02).
Figure S8. Lowest‐energy minimum of compound 23a (truncated model of chisosiamen A, 23) calculated at ωB97X‐D/6–31 + G(d) level in vacuo.
Figure S9. (a) Transition‐dipole direction for the major transition of the bicyclic α,β‐unsaturated ketone chromophoric unit of compound 23a calculated at CAM‐B3LYP/def2‐TZVP//ωB97X‐D/6‐31+G(d) level in vacuo. The transition is predicted at 210.69 nm, oscillator strength f = 0.29, largest excitation contributions 52 → 54 (coefficient 0.69). (b) Frontier orbitals involved in the major π‐π* transition (isovalue 0.04).


