



Abstract
Introduction
For the maintenance treatment of patients with hereditary hemochromatosis (HH), it is advised to keep the transferrin saturation (TSAT) <70% to prevent formation of non‐transferrin‐bound iron and labile plasma iron. The period of the initial iron depletion may last up to 1 year or longer and during this period, the patient is exposed to elevated TSAT levels. Therapeutic erythrocytapheresis (TE) is a modality which has proven to reduce treatment duration of patients with iron overload from HH. In this study, we investigated the time to reach TSAT <70% for both treatment modalities.
Methods
From a previous randomized controlled trial comparing erythrocytaphereses with phlebotomies (PBMs), we performed an analysis in a subgroup of patients who presented with TSAT >70%. Mann‐Whitney U tests were performed to compare the number of treatments and the number of weeks to reach the interim goal of a persistent level of <70% for TSAT between TE and PBM.
Results
The period to reach TSAT levels of <70% was statistically significant shorter for the TE group compared to the PBM treatment group (median treatment procedures [IQR] 2.0 (5) vs 16.0 (23), P‐value: <.001, and median treatment duration [IQR]: 5.5 (11) vs 19.0 (29) weeks, P‐value: .007).
Conclusion
Patients with HH reach a safe TSAT <70% significantly sooner and with less treatment procedures with TE compared to PBM.
Keywords: hereditary hemochromatosis, phlebotomy, therapeutic erythrocytapheresis, transferrin saturation
1. INTRODUCTION
Hereditary hemochromatosis (HH) patients who are homozygous for the p.C282Y mutation may develop iron overload. This can result in organ damage. 1 , 2 The excess of body iron should be removed according to the HH guidelines 3 , 4 , 5 by bloodletting either with phlebotomies (PBMs) or therapeutic erythrocytaphereses (TEs). Treatment is monitored by determining the serum ferritin level. For the depletion phase, the aim is to reach a ferritin level between 50 and 100 μg/L. Thereafter, in the maintenance phase of the treatment, the ferritin level should remain within the reference values of the laboratory in combination with a transferrin saturation (TSAT) of less than 70%. 3 The rationale of TSAT <70% is based on a study by Le Lan et al. showing that in patients with a TSAT >75%, labile plasma iron (LPI) is increased significantly. 6 LPI represents the redox active component of non‐transferrin‐bound iron (NTBI), this is confirmed by other studies. 7 , 8 , 9 , 10 NTBI is taken up efficiently by hepatocytes, the exocrine pancreatic cells, cardiomyocytes, erythroid cells, and brain cells with the potential generation of reactive oxygen radicals which may eventually result in liver fibrosis and cirrhosis, diabetes, cardiomyopathy, and hypogonadotropic hypogonadism. 6 , 9 , 11 , 12 , 13 , 14 , 15 , 16 , 17
The treatment with PBM, with removal of 500 mL of blood every 1 to 2 weeks, may take a long period of time (up to 1‐1.5 or 2 years), depending on the total amount of iron that has to be mobilized. As a result, the time that a patient has a TSAT above 70% might continue for a long period after the diagnosis is made. Earlier studies showed that TE can mobilize more iron in less procedures and in a shorter duration of the treatment period. Therefore, the use of this modality may be more favorable for HH patients compared to PBM. 18 , 19 , 20
The hypothesis is that TE is more effective in reaching a safe TSAT in a shorter period of time; therefore, the aim of the study was to compare the number of procedures and the treatment duration to reach a persistent TSAT below 70% between TE and PBM in HH treatment.
2. PATIENTS AND METHODS
We performed a post hoc analysis within a patient population derived from a randomized controlled trial published earlier, 18 in which TE and PBM were compared in the initial treatment phase of patients with HH and iron overload, all homozygous for the p.C282Y mutation in the HFE gene. In this initial study, 19 HH patients were treated with TE once every 2 weeks and another 19 patients with PBM weekly until the ferritin level reached the target level of 50 μg/L. The results of that study showed a significantly lower mean number of treatment procedures in the TE group (9 vs 27) compared with the PBM group (ClinicalTrials.gov Identifier NCT00202436).
From the original database of the study, we selected the participants with a TSAT of ≥70% for this present study. We calculated the number of weeks as well as the number of procedures to reach TSAT persistently <70% since start of treatment. The treatment procedure is described in the study of Rombout‐Sestrienkova et al. 18
3. STATISTICS
Baseline characteristics of the treatment groups were described using median values (IQR) for continuous variables and using percentages for categorical variables. Given the small sample size per treatment, chi‐square test (where applicable), and nonparametric tests, including Fisher's exact test and Mann‐Whitney U test were used to assess potential baseline differences between both treatments. To compare the number of treatment procedures that the patient must undergo to reach a TSAT of <70% as well as the treatment duration (in weeks) between TE and PBM a Mann‐Whitney U test was performed. During the baseline comparison, we observed that the ferritin levels at baseline were significantly higher in the PBM group compared to the TE group, which might have led to an overestimation of our results. Therefore, we performed an additional sensitivity analysis among patients with a ferritin level at start of ≥1000 μg/L only.
4. RESULTS
From the original cohort, 15 patients from the PBM treatment group and 18 patients from the TE group were included for the current analyses. From these, 12 patients in the PBM treatment group and 9 patients in the TE treatment group had ferritin levels ≥1000 μg/L at the start of the treatment (Figure 1, flow diagram).
FIGURE 1.
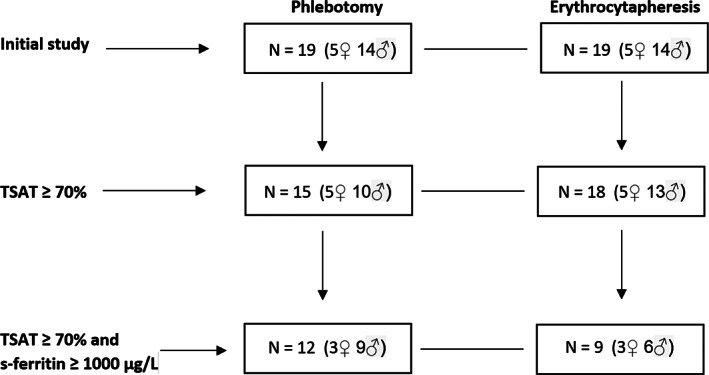
Flow diagram showing the breakdown of the patient numbers from the initial study to the present study
Baseline characteristics were similar between both treatment groups, except for ALT (median [IQR] 98.5 [69], and 60.0 [53], P‐value = .036), and ferritin level at start (median [IQR] 1936 [1508], and 1017 [739], P‐value = .043) for the PBM and TE treatment group, respectively (Table 1).
TABLE 1.
Baseline characteristics of the patients in the phlebotomy group and in the erythrocytapheresis group
| Patient characteristics | Phlebotomy n = 15 | Erythrocytapheresis n = 18 | P‐value |
|---|---|---|---|
| All participants | |||
| Sex, % male | 66.7 | 72.2 | 1.000 a |
| Weight (kg), median (IQR) | 80.0 (30) | 80.5 (16) | 0.901 b |
| Height (cm), median (IQR) | 174.5 (10) | 177 (16) | 0.722 b |
| BMI (kg/m2), median (IQR) | 24.8 (10.9) | 25.2 (6.7) | 0.464 b |
| Blood volume (L), median (IQR) | 5319 (1870) | 5079 (799) | 0.873 b |
| Serum iron (μmol/), median (IQR) (ref. ♀ 11‐25; ♂ 14‐27) | 38 (12) | 36 (13) | 0.556 b |
| Hct (%), median (IQR) (ref. ♀ 36‐48; ♂ 41‐52) | 44 (5) | 43 (6) | 0.901 b |
| Hb (mmol/L), median (IQR) (ref. ♀ 7.3‐9.7; ♂ 8.2‐11) | 9.0 (2) | 9.5 (1) | 0.630 b |
| MCV (fL), median (IQR) (ref. ♀♂ 87‐98) | 95 (5) | 96 (5) | 0.708 b |
| AST (U/L), median (IQR) (ref. ♀ < 30; ♂ < 35) | 41.0 (32) | 33.5 (24) | 0.086 b |
| ALT (U/L), median (IQR) (ref. ♀ < 35; ♂ < 45) | 86 (70) | 51 (44) | 0.036 b |
| Ferritin level at start (μg/L), median (IQR) (ref. ♀ 6‐125; ♂ 16‐250) | 1936 (1508) | 1017 (739) | 0.043 b |
| Transferrin saturation at start, median (IQR) (ref. ♀♂ 16‐45) | 100.0 (7) | 99.5 (21) | 0.532 b |
| Transferrin saturation at end point, median (IQR) | 53.0 (22) | 52.5 (23) | 0.492 b |
| Ferritin level ≥ 1000 μg/L, n (%) | n = 12 (80.0) | n = 9 (50.0) | |
| Sex, % male | 75.0 | 66.7 | 1.000 a |
| Weight (kg), median (IQR) | 82.5 (23) | 76.0 (18) | 0.213 b |
| Height (cm), median (IQR) | 174.0 (11) | 175.0 (13) | 0.849 b |
| BMI (kg/m2), median (IQR) | 27.1 (10.9) | 25.0 (3.7) | 0.342 b |
| Blood volume (L), median (IQR) | 5399 (1287) | 4853 (1142) | 0.136 b |
| Serum iron (μmol/L), median (IQR) (ref. ♀ 11‐25; ♂ 14‐27) | 39.5 (9) | 37.0 (15) | 0.373 b |
| Hct (%), median (IQR) (ref. ♀ 36‐48; ♂ 41‐52) | 42.5 (6) | 42.0 (7) | 0.914 b |
| Hb (mmol/L), median (IQR) (ref. ♀ 7.3‐9.7; ♂ 8.2‐11) | 9 (2) | 9 (2) | 0.626 b |
| MCV (fL), median (IQR) (ref. ♀♂ 87‐98) | 95 (8) | 97 (5) | 0.915 b |
| AST (U/L), median (IQR) (ref. ♀ < 30; ♂ < 35) | 51.5 (39) | 37.0 (30) | 0.145 b |
| ALT (U/L), median (IQR) (ref. ♀ < 35; ♂ < 45) | 98.5 (69) | 60.0 (53) | 0.043 b |
| Ferritin level at start (μg/L), median (IQR) (ref. ♀ 6‐125; ♂ 16‐250) | 2179 (1176) | 1455 (1475) | 0.286 b |
| Transferrin saturation at start, median (IQR) (ref. ♀♂ 16‐45) | 100 (7) | 100 (12) | 0.522 b |
| Transferrin saturation at end point, median (IQR) | 56 (21) | 53 (24) | 0.382 b |
Abbreviations: ALT, alanine‐aminotransferase; AST, aspartate‐aminotransferase; Hb, hemoglobin; Hct, hematocrit; MCV, mean corpuscular volume.
Fisher's exact test.
Mann‐Whitney U test.
The number of weeks to reach a persistent TSAT level of <70% (Table 2) was significantly higher in the PBM group, compared to the TE group (median 19.0 vs 5.5, P‐value: .007). A similar result was observed when the patients with a serum ferritin level of <1000 μg/L were excluded from the analysis (median 21.5 vs 8.0: P‐value: .014). The number of treatments needed to reach a persistent TSAT level of <70% was significantly higher in the PBM group, compared to the TE group (median 16.0 vs 2.0, P‐value: <.001) in the total population, as well as in the group with a serum ferritin level of ≥1000 μg/L (median: 19.0 vs 4.0: P‐value: .001).
TABLE 2.
The number of weeks and the number of treatments for the group treated with phlebotomies vs the group treated with erythrocytapheresis, for the total population and for the participants with serum ferritin ≥1000 μg/L
| Total population | Phlebotomy n = 15 | Erythrocytapheresis n = 18 | P‐value (Mann‐Whitney) |
|---|---|---|---|
| Number of weeks, median (IQR) | 19.0 (29) | 5.5 (11) | .007 |
| Number of treatments, median (IQR) | 16.0 (23) | 2.0 (5) | <.001 |
| Ferritin level ≥1000 μg/L | n = 12 (80.0) | n = 9 (50.0) | |
| Number of weeks, median (IQR) | 21.5 (28) | 8.0 (15) | .014 |
| Number of treatments, median (IQR) | 19.0 (27) | 4.0 (5) | .001 |
Abbreviation: IQR, interquartile range.
5. DISCUSSION
This study in a subgroup of patients from a previous trial investigated the duration of treatment and the number of procedures needed to reach a persistent level of TSAT of <70%. The results of the current analyses show a clear advantage of TE in treatment duration and the number of treatments compared to PBM. This is of clinical importance because in patients with HH increased percentages of TSAT are correlated with increased risk of cancer 21 and subgingival microbiota dysbiosis and severe periodontitis. 22 Bardou‐Jacquet et al. investigated the relation between duration of exposure to increased TSAT percentages and complaints. 23 These authors demonstrated that patients with HH who were exposed to TSAT of more than 50% for more than 6 years have more joint and general complaints, suggesting that high TSAT would contribute to more severe clinical HH. When the TSAT was more than 75%, during at least 8 months, the relation with hand arthropathy was even stronger (personal communication Bardou‐Jacquet 2021). In our patient group, the number of subjects with a confirmed TSAT <50% was too small for analysis.
In a post hoc analysis of results of a comparative study between TE and PBM in the depletion phase of the treatment of HH, a more gradual and less pronounced decrease of serum hepcidin was observed during erythrocytapheresis. 19 This may be clinically relevant since significant reduction in serum hepcidin increases the release of iron into the circulation, ensuing in a vicious circle of more frequent treatment procedures. Gehrke et al. showed that increasing levels of NTBI induce a downregulation of hepcidin. 24 The opposite might also be true. Whether this mechanism is involved in the earlier reduction of TSAT with TE, compared to PBM needs to be further investigated in prospective studies.
The strengths of this study are that the original study is prospective and randomized, and that the population selected therefrom for the present study is well characterized. Limitations are that this concerns a post hoc analysis of a subgroup of a previous trial with inevitably small numbers.
6. CONCLUSION
Our post hoc study of patients with HH treated with PBM and TE shows that the period to reach a safe TSAT of <70% is significantly shorter with TE compared to PBM. Our present study can be seen as evidence of concept and used for generating hypotheses for further investigations.
CONFLICT OF INTEREST
The authors declare no potential conflict of interest.
ETHIC STATEMENT
The ethics committee of each participating hospital approved of the study.
Rombout‐Sestrienkova E, Brandts L, Koek GH, van Deursen CTBM. Patients with hereditary hemochromatosis reach safe range of transferrin saturation sooner with erythrocytaphereses than with phlebotomies. J Clin Apher. 2022;37(1):100‐105. doi: 10.1002/jca.21956
DATA AVAILABILITY STATEMENT
Data are available.
REFERENCES
- 1. Van Bokhoven MA, Van Deursen CThBM, Swinkels DW. Diagnosis and management of hereditary hemochromatosis. BMJ. 2011;342:218‐223. [DOI] [PubMed] [Google Scholar]
- 2. Anderson GJ, Bardou‐Jacquet E. Revisiting hemochromatosis: genetic versus phenotypic manifestations. Ann Transl Med. 2021;9:731‐746. [DOI] [PMC free article] [PubMed] [Google Scholar]
- 3. Pietrangelo A, Deugnier Y, Dooley J, et al. EASL clinical practice guidelines for HFE hemochromatosis. J Hepatol. 2010;53:3‐22. [DOI] [PubMed] [Google Scholar]
- 4. Bacon BR, Adams PC, Kowdley KV, et al. Diagnosis and management of hemochromatosis: 2011 practice guideline by the American Association for the Study of Liver Diseases. Hepatology. 2011;54:328‐343. [DOI] [PMC free article] [PubMed] [Google Scholar]
- 5. Guideline Hemochromatosis of the NIV (Dutch Society of Internists). https://richtlijnendatabase.nl/richtlijn/hereditaire_hemochromatose_hh/startpagina.html
- 6. Le Lan C, Loréal O, Cohen T, et al. Redox active plasma iron in C282Y/C282Y hemochromatosis. Blood. 2005;105:4527‐4531. [DOI] [PubMed] [Google Scholar]
- 7. Gutteridge JMC, Rowley DA, Griffiths E, et al. Low‐molecular‐weight iron complexes and oxygen radical reactions in idiopathic haemochromatosis. Clin Sci. 1985;68:463‐467. [DOI] [PubMed] [Google Scholar]
- 8. Pootrakul P, Breuer W, Sametband M, et al. Labile plasma iron (LPI) as an indicator of chelatable plasma redox activity in iron overloaded beta‐thalassaemia/HbE patients treated with an oral chelator. Blood. 2004;104:1504‐1510. [DOI] [PubMed] [Google Scholar]
- 9. Danjou F, Cabantchik ZI, Origa R, et al. A decisional algorithm to start iron chelation in patients with beta thalassemia. Haematologica. 2014;99:e38‐e40. [DOI] [PMC free article] [PubMed] [Google Scholar]
- 10. De Swart L, Hendriks JC, Van der Vorm LN, et al. Second international round robin for the quantification of serum non‐transferrin‐bound iron and labile plasma iron in patients with iron‐overload disorders. Haematologica. 2016;101:38‐45. [DOI] [PMC free article] [PubMed] [Google Scholar]
- 11. Pietrangelo A. Metals, oxidative stress, and hepatic fibrosis. Semin Liver Dis. 1996;16:13‐30. [DOI] [PubMed] [Google Scholar]
- 12. De Valk B, Addicks MA, Gosriwatana I, et al. Non‐transferrin‐bound iron is present in serum of hereditary haemochromatosis heterozygotes. Eur J Clin Invest. 2000;30:248‐251. [DOI] [PubMed] [Google Scholar]
- 13. Jacobs EMG, Hendriks JC, Marx JJ, et al. Morbidity and mortality in first‐degree relatives of C282Y homozygous probands with clinically detected haemochromatosis compared with the general population: the HEmochromatosis FAmily Study (HEFAS). Neth J Med. 2007;65:424‐433. [PubMed] [Google Scholar]
- 14. Olynyk JK, Trinder D, Ramm GA, et al. Hereditary hemochromatosis in the post‐HFE era. Hepatology. 2008;48:991‐1001. [DOI] [PMC free article] [PubMed] [Google Scholar]
- 15. Brissot P, Ropert M, Le Lan C, et al. Non‐transferrin bound iron: a key role in iron overload and iron toxicity. Biochim Biophys Acta. 2012;1820:403‐410. [DOI] [PubMed] [Google Scholar]
- 16. Itkonen O, Vaahtera L, Parkkinen J. Comparison of bleomycin‐detectable iron and labile plasma iron assays. Clin Chem. 2013;59:127‐1273. [DOI] [PubMed] [Google Scholar]
- 17. De Swart L, Reiniers C, Bagguley T, et al. On behalf of the EUMDS Steering Committee. Labile plasma iron levels predict survival in patients with lower‐risk myelodysplastic syndromes. Haematologica. 2018;103:69‐79. [DOI] [PMC free article] [PubMed] [Google Scholar]
- 18. Rombout‐Sestrienkova E, Nieman FHM, Essers BAB, et al. Erythrocytapheresis versus phlebotomy in the initial treatment of HFE hemochromatosis patients: results from a randomized trial. Transfusion. 2012;52:470‐477. [DOI] [PubMed] [Google Scholar]
- 19. Rombout‐Sestrienkova E, Koek GH, Neslo R, et al. Course of iron parameters in HFE‐hemochromatosis patients during initial treatment with erythrocytapheresis compared to phlebotomy. J Clin Apher. 2016;31:564‐570. [DOI] [PubMed] [Google Scholar]
- 20. Sundic T, Hervig T, Hannisdal S, et al. Erythrocytapheresis compared with whole blood phlebotomy for the treatment of hereditary haemochromatosis. Blood Transfus. 2014;12(suppl 1):s84‐s89. [DOI] [PMC free article] [PubMed] [Google Scholar]
- 21. Ellervik C, Tybjaerg‐Hansen A, Nordestgaard BG, et al. Risk of cancer by transferrin saturation levels and haemochromatosis genotype: population‐based study and meta‐analysis. J Intern Med. 2012;271:51‐63. [DOI] [PubMed] [Google Scholar]
- 22. Boyer E, Le Gall‐David S, Martin B, et al. Increased transferrin saturation is associated with subgingival microbiota dysbiosis and severe periodontitis in genetic haemochromatosis. Sci Rep. 2018;8:15532. [DOI] [PMC free article] [PubMed] [Google Scholar]
- 23. Bardou‐Jacquet E, Lainé F, Guggenbuhl P, et al. Worse outcomes of patients with HFE hemochromatosis with persistent increases in transferrin saturation during maintenance therapy. Clin Gastroenterol Hepatol. 2017;15:1620‐1627. [DOI] [PubMed] [Google Scholar]
- 24. Gehrke SG, Kulaksiz H, Herrmann T, et al. Expression of hepcidin in hereditary hemochromatosis: evidence for a regulation in response to the serum transferrin saturation and to non‐transferrin‐bound iron. Blood. 2003;102:371‐376. [DOI] [PubMed] [Google Scholar]
Associated Data
This section collects any data citations, data availability statements, or supplementary materials included in this article.
Data Availability Statement
Data are available.