

Abstract
Objective
To investigate the effect of therapeutic plasma exchange (TPE) on lowering triglyceride (TG) levels in patients with hypertriglyceridemic pancreatitis (HLAP).
Methods
The TG‐lowering in patients with HLAP was compared between the TPE group and conservative treatment group (non‐TPE). The primary outcome was TG reduction to less than 500 mg/dL within 48 hours.
Results
The primary outcome was significantly correlated with TPE (univariate analysis odds ratio [OR] 2.74; 95% confidence interval [CI] 1.30‐5.79, P = .008; multivariate analysis OR 3.03; 95% CI 1.28‐7.19, P = .012). At 24 and 48 hours, conservative treatment resulted in a 48.24% and 70.44% reduction in TG, while TPE resulted in a 70.91% and 76.39% reduction in TG, respectively. A more rapid decrease of in TGs in a short period was clearly associated with TPE (P < .001 for interaction). After 72 hours, the TGs decreased by approximately 77% in both groups, with no significant difference (P = .563). There was no difference between groups in clinical outcomes over the acute time period or over the longer term.
Conclusions
In patients with HLAP, TPE resulted in a short‐term and rapid reduction in plasma TG concentrations, with no significant advantage over non‐TPE after 72 hours.
Keywords: acute pancreatitis, effectiveness, hypertriglyceridemia, prognosis, therapeutic plasma exchange, triglycerides
Abbreviations
- AP
acute pancreatitis
- BMI
body mass index
- Ca
calcium
- CI
confidence interval
- HDL‐C
high‐density lipoprotein cholesterol
- HLAP
hypertriglyceridemic acute pancreatitis
- HTG
hypertriglyceridemia
- LDL‐C
low‐density lipoprotein cholesterol
- OR
odd ratios
- TC
total cholesterol
- TG
triglyceride
- TPE
therapeutic plasma exchange
1. INTRODUCTION
Acute pancreatitis (AP) is a common clinical disease worldwide. 1 On the basis of the existence of local complications, the occurrence of organ failure, and the duration of organ failure whether it occurs within 48 hours, AP can be divided into three levels: mild, moderate, and severe. 2 Patients with mild or moderate AP often recover in a short time and have a good prognosis, while patients with severe AP often suffer from multiple organ failure, abdominal hemorrhage, and abdominal infection, with a mortality rate of up to 30%. 3 AP is a risk factor for diabetes as well as pancreatic cancer. 4 , 5 , 6 In Western countries, hypertriglyceridemia (HTG) is the third leading cause of pancreatitis after cholelithiasis and alcohol, while in China, it ranks second only to cholelithiasis. 7 On the other hand, the incidence of AP increases gradually with the increase in the prevalence of hyperlipidemia, which is a potential health threat to the population. 8 Studies have found that hyperlipidemia has become the main pathogenic factor in young patients with pancreatitis. 9 However, the pathophysiological mechanism of hyperlipidemia leading to AP is not fully understood, and there is no internationally recognized unified standard for the treatment of HLAP. 10 The higher the blood triglyceride (TG) concentration is, the higher of the incidence of AP; thus, reducing the TG concentration has become a common treatment strategy in HLAP and the earlier, the better. 11 In addition to fasting and insulin/heparin‐assisted TG reduction, therapeutic plasma exchange (TPE) is recommended as a treatment. At present, the guidelines recommend TPE treatment HLAP is still class III but grade 1C. 12 However, previous studies on the clinical efficacy of TPE in the treatment of HTG pancreatitis have reached different conclusions. 13 , 14 At the same time, there are also some practical problems, such as additional operation and consumable costs, needs for special equipment, trained staff, invasive vein placement, and a large amount of blood products. In clinical practice, whether TPE can effectively reduce the level of TG in patients with HLAP and its effect on the prognosis of patients are still controversial. 15 The benefit of more rapid reduction of TG levels acutely is also questionable. The aim of this retrospective study was to explore the efficacy of TPE on TG‐lowering and the clinical effect of TPE on patients with HLAP.
2. MATERIALS AND METHODS
2.1. Patients
This retrospective case‐control study was conducted in the First Affiliated Hospital of Xiamen University (China) from December 2013 to December 2018 and approved by the Audit Committee of hospital institutions. Since the study was designed to be non‐interventional retrospectively, there was no need to informed consent. After screening, a total of 1772 patients were diagnosed with pancreatitis, and 181 patients met the inclusion criteria, including 46 TPE patients and 135 non‐TPE patients. The inclusion criteria were as follows: (a) TGs >1000 mg/dL; (b) age over 18 years; (c) patient met the Atlanta classification criteria for pancreatitis, 2 including two of the following three factors: typical abdominal pain, pancreatic enzymes exceeding the normal upper limit by more than three times, and radiological findings of AP. We excluded pregnant women with HLAP and patients with AP due to other factors, such as cholelithiasis, alcohol, trauma, or neoplasm.
2.2. Treatments
Conservative treatment for HLAP includes fasting for at least 72 hours, lactated Ringer solution fluid supplementation as a preferred option, continuous pumps of growth statin to inhibit digestive secretion, and intraperitoneal dolantin for pain relief when necessary. In patients with acute hyperglycemia, continuous pumps of short‐acting insulin began at 0.1 U/kg/h. In order to reduce the incidence of hypoglycemia in patients, the blood glucose target was set at 7 to 10 mmol/L, and the insulin dosage was adjusted according to the monitoring of blood glucose every 2 to 4 hours. If there is still hyperglycemia after eating, subcutaneous intermittent injection of insulin should be replaced. Patients without anticoagulant contraindications and with elevated D‐dimer were given routine subcutaneous injection of low molecular weight heparin. Low‐flow oxygen through nasal catheters is preferred for patients with hypoxia, and nasal high‐flow oxygen delivery or endotracheal intubation ventilator assistance can be selected when necessary. When TG levels were measured above 1000 mg/dL for the first time, the physician will discuss the benefits and risks of TPE with the HLAP patient or family member and decide whether to undergo TPE. Patients who sign the consent form will be scheduled for TPE as soon as possible within 24 hours of admission. TPE was performed in double‐needle procedure using Aquarius system (Nikkiso Europe GmbH, Tokyo, Japan) with a Plasmaflo TPE op‐08w filter (Asahi KASEI Medical Co., Ltd, Yurakucho, Chiyoda‐ku, Tokyo). During TPE treatment, blood was pumped into a plasma filter. The blood flow velocity was about 120 mL/min. The red blood cell component of the blood was reinfused into the body. Waste plasma was collected into empty bags placed on a filter scale. Fresh frozen plasma (FFP) was delivered to the patient through a post‐dilution pump. The displacement rate was about 1000 mL/h. During this treatment, the pre‐dilution pump was not working. As a rule, TPE was performed daily until TG levels were below 1000 mg/dL. Normally, about 40 mL/kg of plasma was replaced with normal plasma (FFP or thawed plasma) for about 3 hours. Vascular access was obtained with a double‐lumen catheter usually placed in the femoral vein. During TPE, heparin (500 U/h) was continuously pumped before the filter, and calcium gluconate (1 g/h) was added after the filter (Table 1).
TABLE 1.
Treatment procedures
| Device | Version | Manufacturer | Anticoagulant (AC) | AC ratio | Plasma volume treated | Replacement fluid | Number and frequency of procedures |
|---|---|---|---|---|---|---|---|
| Aquarius system/Plasmaflo TPE op‐08w filter | V4.0 | Nikkiso Europe GmbH (Japan)/Asahi KASEI Medical Co., Ltd, Tokyo | Heparin | 500 U/h | 40 mL/kg | FFP and thawed plasma | 1–2 procedures, daily |
2.3. Outcomes
The primary efficacy outcome was TGs <500 mg/dL within 48 hours of admission. 16 A total of 150 patients with HLAP were assessed for their primary outcomes. Secondary outcomes included changes in serum TG concentrations within 72 hours of admission.
2.4. Data collection
Baseline characteristics and clinical and laboratory data were collected on the first day of admission. Baseline characteristics included age, sex, and body mass index (BMI). Clinical data included hypertension, diabetes mellitus, diabetic ketosis, hyperuricemia, and medical history of pancreatitis. Baseline levels of total cholesterol (TC), high‐density lipoprotein cholesterol (HDL‐C), low‐density lipoprotein cholesterol (LDL‐C), prealbumin, albumin, serum calcium, C‐reactive protein (CRP), amylase, and lipase were collected within 24 hours of admission. Analysis of the results included the time of serum TG concentration (baseline, 24 hour, 48 hour, and 72 hour). The severity of HLAP was assessed by the Balthazar CT grade, organ function, the Ranson score, and the APACHE II score. We also collected data on adjuvant therapy for HTG (insulin and heparin), complications or comorbidities of HLAP, length of hospitalization, cost of hospitalization, and mortality rates at 28 and 90 days.
2.5. Statistical analysis
Statistical analyses were performed using R for Windows (version 3.4.2, http://www.r-project.org/). The data are presented as the median (interquartile range) or number (%). Categorical variables were compared by the Chi‐square/Fisher's exact tests. Because of a skewed distribution, continuous variables were compared by the Mann‐Whitney U test. A logistic regression model was used in univariate and multivariate analyses for the primary outcome. We included predictors with a P value <.1 from univariate analysis into the backward stepwise multivariate regression with the Akaike Information Criterion (AIC). For the sensitivity analysis, treatment group (PE group and non‐TPE group)‐time interactions were assessed using the linear mixed‐effect model according to repeated measures of TGs.
Within 24, 48 and 72 hours of admission, the difference between the non‐TPE group and the TPE group in the rates of TG <500 mg/dL or the percentage of TG decrease were compared. A two‐sided P value less than .05 was considered to indicate statistical significance.
3. RESULTS
3.1. Patient characteristics
In this study, 46 patients receiving TPE and 135 patients undergoing conservative treatments were included. In the TPE group, 17 patients had TPE twice and the others only once. The baseline clinical features are shown in Table 2. The median age was 39 years. Males accounted for the majority of participants (76.8%) and had a high BMI (median 26.20; IQR 24.20‐28.10). Diabetes was associated with 33.15% of the patients. Nearly half (41.44%) of the patients had a history of pancreatitis. The median plasma levels of TGs were 1826.5 mg/dL. In terms of the severity of diseases, 48.7% of hospitalized patients showed severe abdominal imaging (Balthazar CT grade: D/E), organ dysfunction occurred in 18.78% of all patients, and 13.81% of the patients had an acute Ranson score greater than three points. Moreover, the average APACHE II score was seven points (IQR 5.00‐10.00). Amylase increased slightly, and lipase increased significantly compared with amylase.
TABLE 2.
Baseline clinical characteristics of patients
| All (n = 181) | Plasma exchange group (n = 46) | Non‐plasma exchange groups (n = 135) | P | |
|---|---|---|---|---|
| Baseline characteristics | ||||
| Age (years) | 39.00 (32.00‐44.00) | 40.50 (32.25‐49.00) | 38.00 (32.50‐44.00) | .225 |
| Male | 139 (76.80%) | 34 (73.91%) | 105 (77.78%) | .738 |
| BMI (kg/m2) | 26.20 (24.20–28.10) | 24.90 (23.02‐26.68) | 26.60 (24.75‐28.40) | .002 |
| Hypertension | 29 (16.02%) | 9 (19.57%) | 20 (14.81%) | .599 |
| Diabetes | 60 (33.15%) | 8 (17.39%) | 52 (38.52%) | .014 |
| Diabetic ketosis | 17 (9.39%) | 3 (6.52%) | 14 (10.37%) | .631 |
| Hyperuricemia | 20 (11.05%) | 6 (13.04%) | 14 (10.37%) | .820 |
| History of pancreatitis | 75 (41.44%) | 16 (34.78%) | 59 (43.70%) | .375 |
| Triglyceride (mg/dL) | 1826.50 (1189.40‐2554.00) | 1845.10 (1308.60‐3005.30) | 1769.90 (1165.90‐2402.70) | .230 |
| TC (mmol/L) | 12.27 (8.66‐15.98) | 15.25 (10.11‐17.87) | 11.57 (8.29‐15.00) | .004 |
| Prealbumin (mg/L) | 72.50 (66.80‐78.00) | 68.10 (62.20‐74.50) | 73.20 (68.25‐78.85) | .003 |
| Albumin (g/L) | 41.50 (38.70‐45.50) | 39.60 (34.75‐42.17) | 43.10 (39.40‐45.95) | <.001 |
| Ca (mmol/L) | 2.17 (2.00‐2.48) | 2.04 (1.83‐2.52) | 2.21 (2.06‐2.47) | .014 |
| CRP (mg/L) | 36.50 (15.10‐90.00) | 37.90 (11.75‐90.00) | 36.00 (15.62‐90.00) | .743 |
| Amylase (U/L) | 197.00 (110.00‐378.00) | 219.50 (112.20‐480.80) | 190.00 (110.50‐356.00) | .436 |
| Lipase (U/L) | 642.00 (297.00‐1533.00) | 637.00 (329.20‐1798.20) | 665.50 (282.20‐1523.00) | .585 |
| Severity of hypertriglyceridemic pancreatitis | ||||
| Balthazar CT grade | <.001 | |||
| <D | 94 (51.93%) | 11 (23.91%) | 83 (61.48%) | |
| ≥D | 87 (48.07%) | 35 (76.09%) | 52 (38.52%) | |
| Organ function | <.001 | |||
| No | 147 (81.22%) | 25 (54.35%) | 122 (90.37%) | |
| Yes | 34 (18.78%) | 21 (45.65%) | 13 (9.63%) | |
| Ranson score | .002 | |||
| <3 | 156 (86.19%) | 33 (71.74%) | 123 (91.11%) | |
| ≥3 | 25 (13.81%) | 13 (28.26%) | 12 (8.89%) | |
| APACHE II | 7.00 (5.00–10.00) | 8.00 (6.25‐11.00) | 7.00 (5.00‐9.00) | .010 |
| Treatment | ||||
| Insulin | 121 (66.85%) | 29 (63.04%) | 92 (68.15%) | .650 |
| Heparin | 100 (55.25%) | 29 (63.04%) | 72 (53.33%) | .330 |
3.2. Baseline characteristics of the TPE and non‐TPE groups
As shown in Table 2, patients in the TPE group had a higher baseline plasma TC concentration (P = .004), as well as lower plasma prealbumin (P = .003), albumin (P < .001), and calcium (P = .014). The non‐TPE group had higher baseline BMIs (P = .002) and a higher prevalence of diabetes(P = .014). Compared with the non‐TPE group, patients in the TPE group showed more severe imaging findings (Balthazar CT grade ≥ D, P < .001), higher rates of concomitant organ failure (P < .001), and higher Ranson scores (P = .002) and APACHE II scores (P = .010) in terms of disease severity. However, there was no difference in age, sex, TC concentration, amylase/lipase levels, or insulin/heparin use between the two groups.
3.3. Clinical outcomes of patients
As shown in Table 3, ARDS (13.26%) was the most common complication in patients with HLAP, followed by acute liver injury (7.73%). The 28‐day and 90‐day mortality rates were 1.66% and 3.31%, respectively. In comparison, the TPE group had a higher rate of ARDS than the control group (30.43% vs 7.41%, P < .001), and a similar trend was observed in the incidence of acute kidney injury (19.57% vs 2.22%, P < .001), but there was no difference in the incidence of acute liver injury (6.52% vs 8.15%, P = .97). In addition, the corresponding hospital stay was longer (12.50 [IQR 9.00‐19.75] days and 8.00 [IQR 6.00‐11.00] days, respectively, P < .001) and more expensive (41.04 [IQR 32.61‐60.14] Yuan in thousand and 12.16 [IQR 9.12‐16.80] Yuan in thousand, respectively, P < .001) compared TPE to conventional group. However, there was no difference in 28‐day and 90‐day mortality between the two groups. In the non‐TPE group, the proportion of patients whose TG decreased below 500 mg/dL within 48 hours was 48.08%, while in the TPE group, the proportion was even higher, reaching 71.74%. There was a difference between the two groups (P = .012). However, within 72 hours, 65.38% and 78.26% of patients in the non‐TPE group and TPE group, respectively, had TGs under 500 mg/dL, with no significant difference between the two groups (P = .166).
TABLE 3.
Clinical outcomes of patients
| All (n = 181) | Plasma exchange group (n = 46) | Non‐plasma exchange groups (n = 135) | P | |
|---|---|---|---|---|
| Complication | ||||
| Pancreatic cyst | 11 (6.08%) | 2 (4.35%) | 9 (6.67%) | .833 |
| ARDS | 24 (13.26%) | 14 (30.43%) | 10 (7.41%) | <.001 |
| Acute kidney injury | 12 (6.63) | 9 (19.57%) | 3 (2.22%) | <.001 |
| Acute liver injury | 14 (7.73%) | 3 (6.52%) | 11 (8.15%) | .970 |
| Sepsis | 2 (1.10%) | 1 (2.17%) | 1 (0.74%) | 1 |
| Hospital stay, days | 9.00 (7.00‐12.00) | 12.50 (9.00–19.75) | 8.00 (6.00‐11.00) | <.001 |
| Hospital costs, Yuan in thousand | 15.72 (10.33‐29.27) | 41.04 (32.61‐60.14) | 12.16 (9.12‐16.80) | <.001 |
| 28‐day mortality | 3 (1.66%) | 1 (2.17%) | 2 (1.48%) | .99 |
| 90‐day mortality | 6 (3.31%) | 3 (6.52%) | 3 (2.22%) | .352 |
| TG ≤500 mg/dL within | 83 (55.33%) | 33 (71.74%) | 50 (48.08%) | .012 |
| 48 hours | (n = 150) | (n = 46) | (n = 104) |
3.4. Factor analysis of primary outcome
Although TGs in the TPE group decreased faster, there were many factors affecting their metabolism. Univariate and multivariate factor logistic regression was used to clarify the specific clinical characteristics associated with the decline in TGs. As shown in Table 4, in the univariate analysis, BMI (P = .012), diabetes (P = .001), and calcium (P = .024) were identified as risk factors that prevent TGs from falling below 500 mg/dL within 48 hours. PE promoted a decrease in serum TG concentration (OR 2.74; 95% CI 1.30‐5.79, P = .008). After adjustment for confounding factors (diabetes, baseline TG level, and serum Ca concentration), the association between TPE therapy and the primary outcome remained (OR 3.03; 95% CI 1.28‐7.19, P = .012).
TABLE 4.
Analyses of the association between clinical characteristics with primary outcome in patients with hypertriglyceridemic pancreatitis
| Univariate analysis | Multivariate analysis | |||||
|---|---|---|---|---|---|---|
| OR | 95% CI | P | OR | 95% CI | P | |
| Baseline characteristics | ||||||
| Age (years) | 1.00 | 0.97‐1.04 | .821 | |||
| Male | 1.12 | 0.51‐2.45 | .777 | |||
| BMI (kg/m2) | 0.89 | 0.81‐0.97 | .012 | |||
| Hypertension | 0.86 | 0.35‐2.10 | .741 | |||
| Diabetes | 0.30 | 0.14‐0.61 | .001 | 0.29 | 0.13‐0.63 | .002 |
| History of pancreatitis | 0.74 | 0.38‐1.43 | .37 | |||
| Triglyceride, 100 mg/dL | 0.97 | 0.95‐1.00 | .097 | 0.95 | 0.92‐0.99 | .009 |
| Prealbumin (mg/L) | 0.68 | 0.25‐1.89 | .468 | |||
| Albumin (g/L) | 0.99 | 0.95‐1.03 | .739 | |||
| Ca (mmol/L) | 0.52 | 0.30‐0.92 | .024 | 0.42 | 0.21‐0.79 | .007 |
| CRP (mg/L) | 1.00 | 0.99‐1.00 | .644 | |||
| Amylase (10 U/L) | 1.18 | 1.02‐1.37 | .029 | |||
| Lipase (10 U/L) | 1.00 | 0.99–1.00 | .235 | |||
| Severity of hypertriglyceridemic pancreatitis | ||||||
| Balthazar CT grade | ||||||
| <D | Ref | |||||
| ≥D | 1.61 | 0.84‐3.08 | .150 | |||
| Organ function | ||||||
| No | Ref | |||||
| Yes | 2.18 | 0.92‐5.15 | .075 | |||
| Ranson score | ||||||
| <3 | Ref | |||||
| ≥3 | 2.74 | 0.94‐7.97 | .065 | |||
| APACHE II | 1.04 | 0.94‐1.15 | .431 | |||
| Treatment group | ||||||
| Conventional | Ref | Ref | ||||
| Plasma exchange | 2.74 | 1.30–5.79 | .008 | 3.03 | 1.28–7.19 | .012 |
3.5. Comparison of triglyceride decline with time
As depicted in Figure 1, overall, the TG concentrations in both groups decreased over time. The TPE group was slightly higher than the non‐TPE group at the basal TG level. However, the concentrations of TGs after 24 hours were significantly lower in the TPE group than in the non‐TPE group. By 72 hours, the concentrations were very close. In terms of percent reduction, the percent decrease in triglyceride concentration at 24 and 48 hours after conservative treatment was 48.24% and 70.44%, while the percent decrease in the TPE group was 70.91% and 76.39%, respectively (P < .001 and P = .023, respectively; Figure 2). After 72 hours, the proportion of the two groups decreased by approximately 77%, showing no significant difference (P = .563). The linear mixed‐effect model revealed a significant association between the time course of the reduction in TG concentration and TPE therapy (P < .001 for interaction).
FIGURE 1.
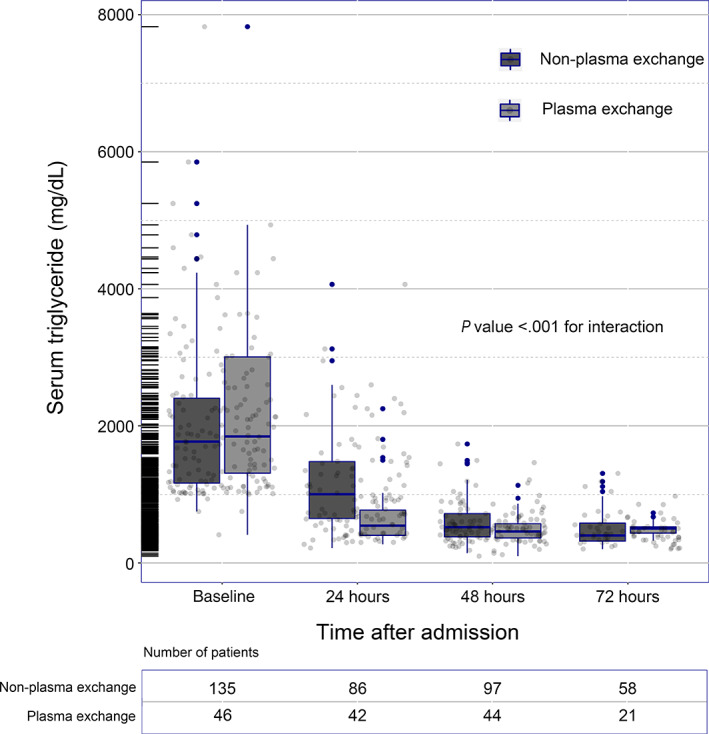
Time course of the serum triglyceride concentration changes within 72 hours after admission
FIGURE 2.
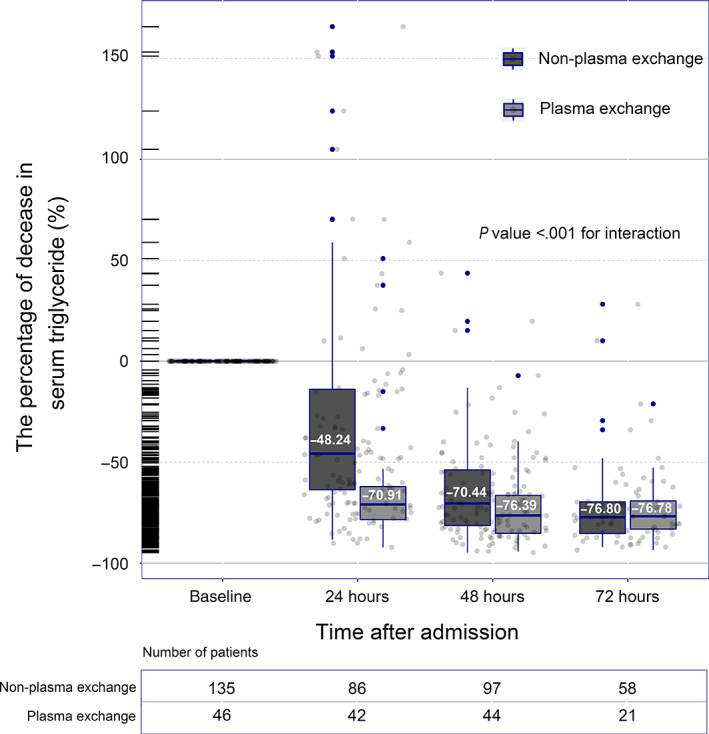
Time course of the percent decrease in serum triglyceride concentration decreased within 72 hours after admission. The P value for the interaction between time and triglyceride‐lowering therapies was calculated by the linear mixed‐effect model
4. DISCUSSION
Through the study, we found that TPE therapy had an advantage in reducing TG concentration within 48 hours compared with conservative treatment, with the most obvious advantage within 24 hours but no advantage after 72 hours.
The exact process by which TPE lowers blood triglycerides is not well understood. The direct replacement of TG‐rich chylomicrons may be the main reason for the short‐term reduction of TG concentration in blood by TPE. 17 , 18 , 19 In addition, further evidence is needed to determine whether TPE partially eliminates the inhibitory factors on the lipid metabolism pathway, such as GPIHBP1 autoantibodies, and promotes the recovery of lipid metabolism. 20 TPE may also play a role in reducing cholesterol, phospholipids, and other substances, promoting the transfer of lipid metabolism balance to the direction of synthesis, and accelerating the consumption of TGs. 21
The causes of elevated TGs are complex. The causes of elevated triglycerides are generally classified as primary and secondary. Primary elevation is related to genes, such as familial hyperlipidemia, which may be accompanied by single‐gene or multigene mutation. 22 , 23 In such patients, dyslipidemia often requires long‐term metabolic control, and the blood lipids that decrease in a short period of time can quickly rebound, resulting in poor effectiveness of TPE. 22 Moreover, studies on the gene‐related factors of lipid metabolism are still in progress, and there are economic and operational obstacles in the comprehensive screening of patients' gene functions. Secondary HTG is associated with overeating, uncontrolled diabetes, lack of exercise, obesity, and endocrine disorders, and the mechanisms are not fully understood. 24 , 25 According to the study, conservative treatment (fasting, rehydration, etc.) can reduce TGs by 48% within 24 hours and 70% within 48 hours, which is consistent with literature reports. 26 Although TPE can decrease TGs more quickly within 48 hours, there is no significant difference between TPE and conventional treatment after 72 hours.
Studies have found that the higher the plasma TG level is, the higher the incidence of pancreatitis and the more serious the disease. 27 , 28 , 29 Rapid reduction of plasma triglyceride concentration may be beneficial to disease control. 11 Conservative treatment alone can lead to a rapid decline in TGs, and TPE is more efficient at reducing TGs, but it remains unclear whether when patients benefit from to reduce TGs faster. 13 And, the threshold of TG concentration for inducing pancreatitis is still unclear. A slight increase in TGs can induce pancreatitis, and some patients do not have pancreatitis in the case of a very severe increase in triglycerides. 30 The incidence of pancreatitis varies with TG concentrations, and finding a single standard for determining the timing of TPE is difficult. 31 Further considering the drawbacks of TPE, more criteria, including triglyceride levels, may be needed to determine the timing of TPE in patients with HLAP in order to improve its clinical value.
Globally, the incidence of acute pancreatitis is on the rise, while the mortality rate is on the decline. 32 , 33 Our study showed that the overall mortality of patients at 28 and 90 days was 1.66% and 3.31%, respectively, lower than in previous studies. 34 And there was no significant difference in mortality between the TPE group and the non‐TPE group; however, it should not be ignored that the TPE group had a higher proportion of patients with organ failure, and their overall conditions were more serious. In addition, deaths in pancreatitis patients were also significantly associated with early organ failure. 35 The incidence of complications in severe patients during hospitalization was higher, and the corresponding monitoring and treatment were more intensive, which would naturally lead to longer hospitalization time and higher hospitalization costs. Due to the lack of prospective design and complex clinical treatment process, it is still difficult to determine the clinical cost‐performance ratio of TPE. Therefore, further prospective randomized controlled studies (RCTs) are needed to confirm the effect of TPE on patient outcomes.
Our study has several limitations. First, this was a retrospective cohort study and the characteristics of the two groups of patients were not completely balanced. Second, severe patients with organ function impairment were more likely to be admitted to ICU, resulting in patients in the TPE group being sicker and more likely to be treated aggressively and rigorously. Third, patients with mild disease from early feeding or rapid lipid decline without continuous test data were excluded, which could lead to selective bias. Fourth, although we included patients over a long time span and conducted univariate and multivariate analyses to correct for confounders as much as possible for the effects of clinical characteristics and treatment groups on the primary endpoint, the effect of selection bias could not be completely eliminated. Fifth, the relationship between cytokines and organ dysfunction and TPE could not be clarified without the detection of cytokines. Finally, patients with pancreatitis whose triglycerides were less than 1000 mg/dL were excluded, which may affect the conclusions.
5. CONCLUSIONS
In patients with HLAP, TPE reduced plasma triglyceride concentrations faster in the short term (ie, 48 hours) than conservative treatment, but there was no significant advantage after 72 hours. Proper RCT studies are needed to determine the timing and value of the clinical application of TPE in the situation of HLAP.
CONFLICT OF INTEREST
The authors declare that they have no conflict of interest.
ETHICS APPROVAL STATEMENT
The protocol of this retrospective study was approved by the Ethics Committee of the First Affiliated Hospital of Xiamen University. The retrospective study was based on existing data, which can be difficult to obtain formal consent for. No personal details are involved, and informed consent is not required after approval by the ethics committee.
Chen Z, Huang X, Zhang M, Han N, Ning Y. Rapid reduction in triglyceride levels by therapeutic plasma exchange in patients with hypertriglyceridemic pancreatitis. J Clin Apher. 2022;37(1):82‐90. doi: 10.1002/jca.21954
Zhu Chen, Xiaolong Huang, and Minwei Zhang contributed equally to this study.
DATA AVAILABILITY STATEMENT
The data that support the findings of this study are available on request from the corresponding author. The data are not publicly available due to privacy or ethical restrictions.
REFERENCES
- 1. Peery AF, Crockett SD, Murphy CC, et al. Burden and cost of gastrointestinal, liver, and pancreatic diseases in the United States: update 2018. Gastroenterology. 2019;156(1):254‐272. [DOI] [PMC free article] [PubMed] [Google Scholar]
- 2. Banks PA, Bollen TL, Dervenis C, et al. Classification of acute pancreatitis‐‐2012: revision of the Atlanta classification and definitions by international consensus. Gut. 2013;62(1):102‐111. [DOI] [PubMed] [Google Scholar]
- 3. Boxhoorn L, Voermans RP, Bouwense SA, et al. Acute pancreatitis. Lancet. 2020;396(10252):726‐734. [DOI] [PubMed] [Google Scholar]
- 4. Hart PA, Bellin MD, Andersen DK, et al. Type 3c (pancreatogenic) diabetes mellitus secondary to chronic pancreatitis and pancreatic cancer. Lancet Gastroenterol Hepatol. 2016;1(3):226‐237. [DOI] [PMC free article] [PubMed] [Google Scholar]
- 5. Saluja A, Maitra A. Pancreatitis and pancreatic cancer. Gastroenterology. 2019;156(7):1937‐1940. [DOI] [PubMed] [Google Scholar]
- 6. Pang Y, Kartsonaki C, Turnbull I, et al. Metabolic and lifestyle risk factors for acute pancreatitis in Chinese adults: a prospective cohort study of 0.5 million people. PLoS Med. 2018;15(8):e1002618. [DOI] [PMC free article] [PubMed] [Google Scholar]
- 7. Zhu Y, Pan X, Zeng H, et al. A study on the etiology, severity, and mortality of 3260 patients with acute pancreatitis according to the revised Atlanta classification in Jiangxi, China over an 8‐year period. Pancreas. 2017;46(4):504‐509. [DOI] [PubMed] [Google Scholar]
- 8. Petrov MS, Yadav D. Global epidemiology and holistic prevention of pancreatitis. Nat Rev Gastroenterol Hepatol. 2019;16(3):175‐184. [DOI] [PMC free article] [PubMed] [Google Scholar]
- 9. Zheng Y, Zhou Z, Li H, et al. A multicenter study on etiology of acute pancreatitis in Beijing during 5 years. Pancreas. 2015;44(3):409‐414. [DOI] [PubMed] [Google Scholar]
- 10. Lee PJ, Papachristou GI. New insights into acute pancreatitis. Nat Rev Gastroenterol Hepatol. 2019;16(8):479‐496. [DOI] [PubMed] [Google Scholar]
- 11. Sandhu S, Al‐Sarraf A, Taraboanta C, Frohlich J, Francis GA. Incidence of pancreatitis, secondary causes, and treatment of patients referred to a specialty lipid clinic with severe hypertriglyceridemia: a retrospective cohort study. Lipids Health Dis. 2011;10:157. [DOI] [PMC free article] [PubMed] [Google Scholar]
- 12. Padmanabhan A, Connelly‐Smith L, Aqui N, et al. Guidelines on the use of therapeutic apheresis in clinical practice—evidence‐based approach from the writing Committee of the American Society for apheresis: the eighth special issue. J Clin Apher. 2019;34(3):171‐354. [DOI] [PubMed] [Google Scholar]
- 13. Click B, Ketchum AM, Turner R, Whitcomb DC, Papachristou GI, Yadav D. The role of apheresis in hypertriglyceridemia‐induced acute pancreatitis: a systematic review. Pancreatology. 2015;15(4):313‐320. [DOI] [PMC free article] [PubMed] [Google Scholar]
- 14. Miyamoto K, Horibe M, Sanui M, et al. Plasmapheresis therapy has no triglyceride‐lowering effect in patients with hypertriglyceridemic pancreatitis. Intensive Care Med. 2017;43(6):949‐951. [DOI] [PubMed] [Google Scholar]
- 15. Ramirez‐Bueno A, Salazar‐Ramirez C, Cota‐Delgado F, de la Torre‐Prados MV, Valdivielso P. Plasmapheresis as treatment for hyperlipidemic pancreatitis. Eur J Intern Med. 2014;25(2):160‐163. [DOI] [PubMed] [Google Scholar]
- 16. Valdivielso P, Ramirez‐Bueno A, Ewald N. Current knowledge of hypertriglyceridemic pancreatitis. Eur J Intern Med. 2014;25(8):689‐694. [DOI] [PubMed] [Google Scholar]
- 17. Wolska A, Dunbar RL, Freeman LA, et al. Apolipoprotein C‐II: new findings related to genetics, biochemistry, and role in triglyceride metabolism. Atherosclerosis. 2017;267:49‐60. [DOI] [PMC free article] [PubMed] [Google Scholar]
- 18. Alves‐Bezerra M, Cohen DE. Triglyceride metabolism in the liver. Compr Physiol. 2017;8(1):1‐8. [DOI] [PMC free article] [PubMed] [Google Scholar]
- 19. Coca‐Prieto I, Valdivielso P, Olivecrona G, et al. Lipoprotein lipase activity and mass, apolipoprotein C‐II mass and polymorphisms of apolipoproteins E and A5 in subjects with prior acute hypertriglyceridaemic pancreatitis. BMC Gastroenterol. 2009;9:46. [DOI] [PMC free article] [PubMed] [Google Scholar]
- 20. Young SG, Fong LG, Beigneux AP, et al. GPIHBP1 and lipoprotein lipase, partners in plasma triglyceride metabolism. Cell Metab. 2019;30(1):51‐65. [DOI] [PMC free article] [PubMed] [Google Scholar]
- 21. Kalaany NY, Mangelsdorf DJ. LXRS and FXR: the yin and yang of cholesterol and fat metabolism. Annu Rev Physiol. 2006;68:159‐191. [DOI] [PubMed] [Google Scholar]
- 22. Baass A, Paquette M, Bernard S, Hegele RA. Familial chylomicronemia syndrome: an under‐recognized cause of severe hypertriglyceridaemia. J Intern Med. 2019;287:340‐348. [DOI] [PubMed] [Google Scholar]
- 23. Laufs U, Parhofer KG, Ginsberg HN, Hegele RA. Clinical review on triglycerides. Eur Heart J. 2020;41(1):99‐109. [DOI] [PMC free article] [PubMed] [Google Scholar]
- 24. Jin JL, Sun D, Cao YX, et al. Intensive genetic analysis for Chinese patients with very high triglyceride levels: relations of mutations to triglyceride levels and acute pancreatitis. EBioMedicine. 2018;38:171‐177. [DOI] [PMC free article] [PubMed] [Google Scholar]
- 25. Hansen S, Madsen CM, Varbo A, Nordestgaard BG. Body mass index, triglycerides, and risk of acute pancreatitis: a population‐based study of 118 000 individuals. J Clin Endocrinol Metab. 2020;105(1):163‐174. [DOI] [PubMed] [Google Scholar]
- 26. Berberich AJ, Ziada A, Zou GY, Hegele RA. Conservative management in hypertriglyceridemia‐associated pancreatitis. J Intern Med. 2019;286(6):644‐650. [DOI] [PubMed] [Google Scholar]
- 27. Wang SH, Chou YC, Shangkuan WC, Wei KY, Pan YH, Lin HC. Relationship between plasma triglyceride level and severity of Hypertriglyceridemic pancreatitis. PLoS One. 2016;11(10):e163984. [DOI] [PMC free article] [PubMed] [Google Scholar]
- 28. Vipperla K, Somerville C, Furlan A, et al. Clinical profile and natural course in a large cohort of patients with hypertriglyceridemia and pancreatitis. J Clin Gastroenterol. 2017;51(1):77‐85. [DOI] [PubMed] [Google Scholar]
- 29. Murphy MJ, Sheng X, MacDonald TM, Wei L. Hypertriglyceridemia and acute pancreatitis. JAMA Intern Med. 2013;173(2):162‐164. [DOI] [PubMed] [Google Scholar]
- 30. Pedersen SB, Langsted A, Nordestgaard BG. Nonfasting mild‐to‐moderate hypertriglyceridemia and risk of acute pancreatitis. JAMA Intern Med. 2016;176(12):1834‐1842. [DOI] [PubMed] [Google Scholar]
- 31. Pedragosa A, Merino J, Aranda JL, et al. Clinical profile of patients with very high hypertriglyceridemia from the registry of hypertriglyceridemia of the Spanish atherosclerosis society. Clin Investig Arterioscler. 2013;25(1):8‐15. [DOI] [PubMed] [Google Scholar]
- 32. Xiao AY, Tan ML, Wu LM, et al. Global incidence and mortality of pancreatic diseases: a systematic review, meta‐analysis, and meta‐regression of population‐based cohort studies. Lancet Gastroenterol Hepatol. 2016;1(1):45‐55. [DOI] [PubMed] [Google Scholar]
- 33. Krishna SG, Kamboj AK, Hart PA, Hinton A, Conwell DL. The changing epidemiology of acute pancreatitis hospitalizations: a decade of trends and the impact of chronic pancreatitis. Pancreas. 2017;46(4):482‐488. [DOI] [PMC free article] [PubMed] [Google Scholar]
- 34. Gubensek J, Buturovic‐Ponikvar J, Romozi K, Ponikvar R. Factors affecting outcome in acute hypertriglyceridemic pancreatitis treated with plasma exchange: an observational cohort study. PLoS One. 2014;9(7):e102748. [DOI] [PMC free article] [PubMed] [Google Scholar]
- 35. Petrov MS, Shanbhag S, Chakraborty M, Phillips AR, Windsor JA. Organ failure and infection of pancreatic necrosis as determinants of mortality in patients with acute pancreatitis. Gastroenterology. 2010;139(3):813‐820. [DOI] [PubMed] [Google Scholar]
Associated Data
This section collects any data citations, data availability statements, or supplementary materials included in this article.
Data Availability Statement
The data that support the findings of this study are available on request from the corresponding author. The data are not publicly available due to privacy or ethical restrictions.