

Abstract
To complement real‐world evidence (RWE) guidelines, the 2019 Structured Preapproval and Postapproval Comparative study design framework to generate valid and transparent real‐world Evidence (SPACE) framework elucidated a process for designing valid and transparent real‐world studies. As an extension to SPACE, here, we provide a structured framework for conducting feasibility assessments—a step‐by‐step guide to identify decision grade, fit‐for‐purpose data, which complements the United States Food and Drug Administration (FDA)’s framework for a RWE program. The process was informed by our collective experience conducting systematic feasibility assessments of existing data sources for pharmacoepidemiology studies to support regulatory decisions. Used with the SPACE framework, the Structured Process to Identify Fit‐For‐Purpose Data (SPIFD) provides a systematic process for conducting feasibility assessments to determine if a data source is fit for decision making, helping ensure justification and transparency throughout study development, from articulation of a specific and meaningful research question to identification of fit‐for‐purpose data and study design.
BACKGROUND
Access to extensive and diverse real‐world data (RWD) sources has grown exponentially over the past decade. 1 , 2 , 3 Receptivity to using RWD in real‐world evidence (RWE) to complement clinical trial evidence has simultaneously increased, 4 , 5 , 6 , 7 leading to more frequent inclusion of RWD studies in regulatory and payer submission packages, 8 , 9 but with mixed success. Whereas particular therapeutic areas, such as oncology and rare diseases, have historically utilized RWE, advances are being made to understand the optimal settings for producing RWE fit for decision making by regulators, payers, and health technology assessment agencies. 10 Standards—such as guidance documents, step‐by‐step processes, and templates, developed to guide researchers on the design and conduct of RWD studies—support validity and transparency, and ultimately bolster confidence in RWE. These good practices cover the continuum 11 from articulating a clear research question 12 to transparency in study conduct and reporting of results, 13 , 14 , 15 , 16 and include consideration of the hypothetical target trial, 12 , 17 identifying confounders by constructing causal diagrams, 12 , 18 , 19 identifying a fit‐for‐purpose design, 12 , 20 protocol development, 21 , 22 , 23 , 24 , 25 , 26 , 27 and visualizing the study design. 20 A Structured Preapproval and Postapproval Comparative study design framework to generate valid and transparent RWE (SPACE) framework elucidated a step‐by‐step process for designing valid and transparent real‐world studies and provides templates to capture decision making and justification at each step. 12 The structured template for planning and reporting on the implementation of RWE studies (STaRT‐RWE) picks up where SPACE leaves off, providing detailed templates to capture the final design and implementation details (e.g., specific algorithms for each study variable). Taken together, these peer‐reviewed published good practices provide structured processes and templates for fit‐for‐purpose and justified study design, and transparent implementation. However, they exclude systematic processes for identifying fit‐for‐purpose data. As an extension to SPACE, we developed a step‐by‐step decision tool with templates to facilitate the identification, selection, and rationalization of fit‐for‐purpose RWD sources. The Structured Process to Identify Fit‐For‐Purpose Data (SPIFD) tool was developed based on our experience conducting systematic feasibility assessments to identify data fit to address regulatory‐related research questions using epidemiologic data and methods in more than 100 studies (spanning all major therapeutic areas and both pre‐ and postapproval studies), and reflect the processes the authors (N.M.G., U.B.C., E.R., J.M., and R.F.R.) use in practice. To further illustrate the application of the SPIFD framework, we included two examples drawing from our research experience in examining the effectiveness of inpatient treatments for coronavirus disease 2019 (COVID‐19) and postapproval pregnancy safety studies. We hope that sharing these tools will lead to further improvement as they are applied more broadly.
WHY DO WE NEED SPIFD?
Although the published literature has expounded on the importance of data selection and provided foundational “building blocks” for fit‐for‐purpose data sources, recommendations are often broadly worded and lack comprehensive operational processes or decision aids to support systematic data selection. 28 SPIFD fills this gap by operationalizing the principle of data relevancy articulated within frameworks from the FDA and the Duke Margolis Center for Health Policy. The Framework for the FDA’s Real‐World Evidence Program—and the recently released draft FDA guidance document on “Assessing Electronic Health Records and Medical Claims Data To Support Regulatory Decision‐Making for Drug and Biological Products”—emphasize two “fitness for use” characteristics for data: reliability and relevancy. 5 , 29 Generally, data are considered “reliable” if they represent the intended underlying medical concepts and thus are considered trustworthy and credible; data are “relevant” if they represent the population of interest and can answer the research question in the clinical context of interest (Figure 1 ). 29 , 30 , 31
Figure 1.
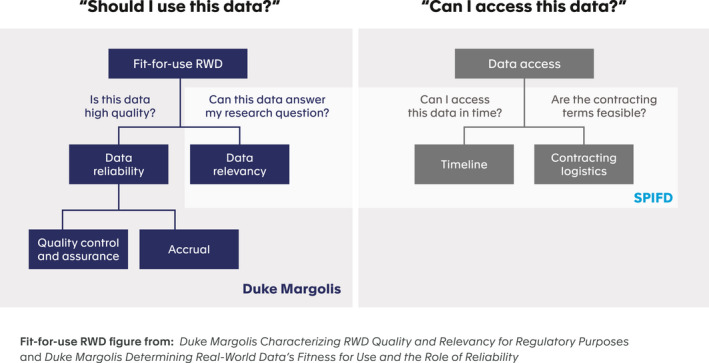
RWE decision support: data questions. RWD, real‐world data; RWE, real‐world evidence; SPIFD, Structured Process to Identify Fit‐For‐Purpose Data.
The assessment of data source reliability and relevance is an important activity underlying study‐level feasibility assessment. The Duke Margolis Center for Health Policy provides a high‐level framework for evaluating these aspects (Figure 1 ), and proposes a minimum set of verification checks to ensure RWD reliability. 30 Data reliability is demonstrated through quality control and assurance checks of its validity, plausibility, consistency, conformance, and completeness and through an evaluation of how the data was collected. 30 For example, patient weight data is considered plausible if it contains a believable range of values and is consistent if these values do not show abnormal variability over time. Data collection must also conform with predefined rules of the database (e.g., weight is entered in kilograms). When using SPIFD, we recommend researchers document the purpose and origin of data; have access to data dictionaries and counts and proportions of completeness for key variables in the raw data; understand the chronological record of data flows, including adjudication procedures; and confirm data extracted for analytic purposes is archived and accessible for additional analyses and replication. This information will be available through peer‐reviewed publications or from data owners as standard operating procedures for data and quality management. For studies of the effectiveness or safety of medical products intended to support a regulatory decision in the United States, researchers should also consult the new FDA draft guidance. 29
We anticipate that most commonly used commercially available real‐world datasets, established national registers, and disease or condition registries meet data reliability standards. However, there may be cases—as during the COVID‐19 pandemic—where data sources with unknown or imperfect reliability might need to be considered for use; the reliability of such new or novel data sources should be scrutinized based on existing recommendations. 29 , 30 Establishing data reliability is a necessary first step to identify candidate data sources that are then vetted within SPIFD.
Data relevancy is demonstrated if the data captures key data elements of the research question (e.g., exposure, outcome, and covariates), and has sufficient patients and follow‐up time to demonstrate the impact of the intervention under investigation. 31 Unlike data reliability, which focuses on the trustworthiness and credibility of the data, data relevancy is more research question specific and requires in‐depth, systematic assessment of data sources against the needs of the study. A previously published review of RWE recommendations and guidance documents noted the need for a step‐by‐step process that operationalizes assessment of data fitness‐for‐purpose. 28 Whereas a more recent article, 32 reflects a similar approach (e.g., provides a step‐by‐step process), it focuses on oncology data assessments (and can be used in parallel to SPIFD for oncology‐related assessments), and does not provide templates or a decision process. Furthermore, the existing literature on data feasibility assessment often omits logistical data access issues confronting researchers and decision makers. 32 , 33 , 34 , 35 For questions about medicine effectiveness and/or safety intended to inform regulatory or payer decisions, researchers must often work within timeline constraints; thus, assessing contracting logistics, time to data access, and time to complete the analysis are important considerations when selecting a data source to provide RWE to decision makers. The SPIFD framework to identify fit‐for‐purpose data builds on the Duke‐Margolis Framework by providing a step‐by‐step process to assess both data relevancy and operational data issues (Figure 1 ), complementing the SPACE framework and transparently completing the full process of study design and documentation (Figure 2 ). SPIFD fills an identified gap by articulating a step‐by‐step process and providing a decision tool for researchers to justify data selection to decision makers. 28 SPIFD allows consideration of all types of (structured and unstructured) secondary data collected for insurance claims, electronic health records, population or disease registries, as well as hybrid data sources that merge secondary data with primary data collection. By specifying key variables and their operational definitions prior to initiating research, SPIFD also enables sensitivity analyses for treatment, confounder, and outcome definitions to be prespecified and rationalized. Data access is included to ensure that the answer to the research question can be achieved in a timely manner that meets clinical, public health, or decision maker needs.
Figure 2.
Overview of combined SPACE and SPIFD frameworks with templates and tools for documentation. Note: SPACE tables 1 and 2, and figure 6 are from Gatto et al. 12 SPACE, Structured Preapproval and Postapproval Comparative study design framework to generate valid and transparent real‐world Evidence; SPIFD, Structured Process to Identify Fit‐For‐Purpose Data.
HOW SHOULD SPIFD BE USED?
The SPIFD framework is intended to be used between steps 3 and 4 of the SPACE study design framework (Figure 2 ). Prior to the development of a study protocol or analytic plan, we recommend researchers use the SPACE framework to (i) articulate the research question and design elements considering a hypothetical target trial, 17 and operationalize the design elements for pragmatic, real‐world capture; (ii) draw a causal diagram for each treatment (vs. comparator)‐outcome dyad to identify potential confounding variables; and (iii) specify the required minimal criteria needed to validly capture the key design elements (e.g., variables need to capture the study population, treatment and comparison groups, outcomes and confounding variables, the required sample size, etc.; Table 1 ). The compiled list of minimum criteria needed to validly capture each study design element from SPACE step 3 serves as a launching point for the SPIFD data feasibility assessment, as described below. Note that the SPIFD framework can be used as a standalone tool with other study design frameworks if the minimal validity criteria for each study design element are specified.
Table 1.
SPIFD step 1 (extension to SPACE step 3): Further operationalize and rank minimal criteria for valid capture
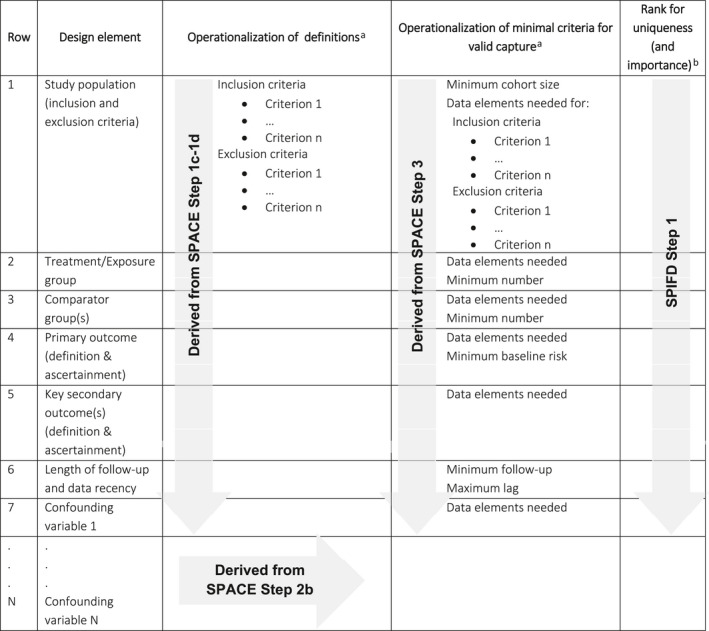
SPACE, Structured Preapproval and Postapproval Comparative study design framework to generate valid and transparent real‐world Evidence; SPIFD, Structured Process to Identify Fit‐For‐Purpose Data.
Refine and/or add detail as needed to fully operationalize definitions.
Where relevant and known to the researchers.
Step 1: Operationalize and rank minimal criteria required to answer the research question
In SPIFD step 1, the user ranks the minimal criteria identified in SPACE step 3 by importance (and if known to the researcher, by how difficult that criterion is to achieve). Table 1 provides an extension of the SPACE tool to document the operationalization of each study element and its minimal requirement(s), and the requirement rankings. At a minimum, clear definitions or algorithms for each study element (Table 1 , SPACE steps 1c and 1d) and each potential confounding variable (Table 1 , SPACE step 2b), should be documented, along with the minimal requirements needed to capture these (Table 1 , SPACE step 3). For example, the eligibility criteria in an oncology study often require the Eastern Cooperative Oncology Group (ECOG) 36 , 37 scale of performance status to define the study population (e.g., for inclusion, patients must have an ECOG score less than or equal to 2). To evaluate each patient against this criterion, ECOG is needed for each patient under consideration. Thus, in this example, complete capture of ECOG at treatment initiation is a minimal requirement.
Typically, the minimal criteria include:
Key data elements (i.e., variables required at the dataset level) needed to apply the inclusion/exclusion criteria and define treatment(s), outcomes, and key potential confounders
Geographic region(s) of interest
Minimum cohort sample size
Minimum baseline risk (i.e., within the comparator group) of the outcome of interest
Minimum length of follow‐up
Additional considerations when operationalizing the minimal criteria include maximum thresholds for missingness within the data (i.e., at the patient level), data recency considerations, and minimum size of any key subgroups (e.g., those needed for primary or secondary objectives). For example, if a primary outcome definition relies on laboratory confirmation of a diagnosis, the researcher should consider the extent of missing laboratory results allowable (within the population of interest) to still consider the study results interpretable.
Once the minimal requirements are fully operationalized and documented, we recommend ranking the list for importance. Experienced researchers should also consider the “uniqueness” of the requirements in the ranking, prioritizing key requirements that are “atypical” (i.e., not commonly found in existing secondary datasets) but critical to meet the objectives of the study (Table 1 , SPIFD step 1). We find that assigning a high rank to critical, but atypical elements (where relevant) allow us to most efficiently narrow the field of data sources for more detailed assessment (see step 2 below). ECOG score, 36 for example, is not readily available in secondary data sources. Thus, complete ECOG score capture would be ranked high since it is both critical and difficult to find. The same oncology study may also require the Response Evaluation Criteria in Solid Tumors (RECIST) 38 as a primary outcome to evaluate a patient's tumor response to treatment, requiring a RECIST variable in the dataset (or x‐rays, computed tomography scans, or magnetic resonance imaging scans results to calculate the score); this attribute would likewise be ranked high. Such ranking allows us to identify “must‐have” characteristics and variables, and immediately rule out (in SPIFD step 2) data sources without these key clinical characteristics.
Step 2: Identify and narrow down data source options
The overall aim in SPIFD step 2, is to narrow the universe of potential data sources to a manageable number for full feasibility assessment. The flow chart in Figure 3 provides a decision aid to support the researcher’s thinking in identifying candidate data sources. In step 2a, the researcher answers the question “Is there at least one data source in the target population (of sufficient reliability) that meets SPIFD step 1 highest ranking criteria?” If the answer is “no,” the researcher needs to consider whether any of the definitions of the minimum criteria can be loosened or adapted without unacceptable sacrifices to validity. Revisiting the ECOG oncology example, perhaps (hypothetically) ECOG score is available for 85% of relevant patients in a particular data source, and the researchers can argue that the 15% of patients with missing ECOG score are not notably different (in terms of baseline characteristics, on average) from the patients with an ECOG score. In this case, missing ECOG scores could potentially be added as an exclusion criterion and prespecified sensitivity analyses testing the potential impact of this exclusion could be considered (e.g., adding those patients back into the cohort, making the assumption that all those with missing EGOC scores would have met the study inclusion/exclusion criteria). If the operational definitions cannot be altered, the researcher should consider whether any of the secondary data sources can be supplemented with targeted data collection as part of a hybrid study design (e.g., chart review to collect ECOG score for patients missing this measure in their electronic health record) to meet the highest ranking criteria. If the answer is still “no,” the researcher should return to SPACE 12 step 4 to consider whether there is an analytic approach that might address the validity concern.
Figure 3.
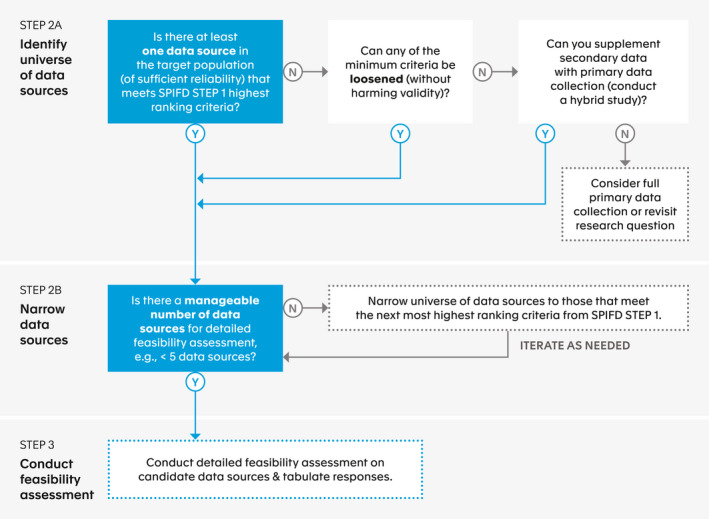
SPIFD step 2: Identify and narrow data source options. SPIFD, Structured Process to Identify Fit‐For‐Purpose Data.
Analytic approaches, such as imputation (e.g., extrapolation based on prediction), can occasionally be used to meet a critical requirement. For example, imagine the design of a breast cancer study needed for regulatory decision making in which hormone receptor status was a must‐have variable needed to define the population of interest. The researcher may identify a data source in which most criteria are met except hormone receptor status is available in only a subset of patients. Using predictive modeling, it may be possible to impute the hormone receptor status for the remaining patients. This approach has been successfully used previously. 39 In our experience, use of these analytic methods requires agreement with the decision makers prior to implementation. In cases in which no analytic approach can be used to address a key validity concern, the SPACE framework advises the researcher to consider a primary data collection‐based study or revisit the research question. 12
If the user answers “yes” to any question in SPIFD step 2a, they can move to step 2b, considering the question “Is there a manageable number of data sources for detailed feasibility assessment?” Because detailed feasibility assessment can be time‐consuming and may have associated costs, we generally suggest narrowing the list of data sources to no more than 4–5 before moving on to step 3. Thus, SPIFD step 2b is intended to be an iterative process, allowing the user to consider the next lower ranked criterion(a) as needed to further narrow the list of potential data sources. We typically find that focusing on the top 1–3 ranked criteria is sufficient to narrow the data sources for further consideration. Once the user has a manageable number of candidate data sources (e.g., ≤ 5 data sources), the user can begin conducting the detailed data feasibility assessment in SPIFD step 3.
Step 3: Conduct detailed data feasibility assessment
The goal in SPIFD step 3 is to gather the necessary details for each candidate data source in order to make an informed and justifiable decision for database selection. The template (Table 2 ) can be used to document the candidate data sources (column headers), the specific data needed to assess each component of minimal criteria from Table 1 (rows), and the details about each data source (cells). In addition to the requirements listed in Table 1 , the researcher should add rows to Table 2 to capture other important logistical information, such as time to contract execution, time to data availability, and frequency of data refreshes, and at times, cost to acquire or access the data. In some cases, these considerations will be critical (e.g., to meet an imposed regulatory deadline for submission of final results) and, in other cases, the information may be used as additional considerations when selecting among equally ranked data sources that meet the needs of the study. The SPIFD process is not intended to weigh the benefits of each data set in relation to its cost (i.e., it is not a cost‐benefit analysis). Instead, SPIFD focuses on a process to outline how well the dataset meets the needs of the study question and logistical considerations where cost (which does not need to be considered if there are no budget constraints) is only one component.
Table 2.
SPIFD step 3: Conduct detailed feasibility assessment of candidate data sources
| Row | Design element | Requested information | Data source 1 | Data source 2 | Data source 3 | Data source 4 |
|---|---|---|---|---|---|---|
| 1 | Study population (inclusion and exclusion criteria) |
|
||||
| 2 | Treatment/exposure group |
|
||||
| 3 | Comparator group(s) |
|
||||
| 4 | Primary outcome (definition and ascertainment) |
|
||||
| 5 | Key secondary outcome(s) (definition and ascertainment) |
|
||||
| 6 | Length of follow‐up and data recency |
|
||||
| 7 | Confounding variable 1 |
|
||||
|
. . . N |
. . . Confounding variable N |
|||||
| Data access considerations | ||||||
| Timeline |
|
|||||
| Contracting logistics |
|
|||||

SPIFD, Structured Process to Identify Fit‐For‐Purpose Data.
Data source information can be collected in a variety of ways. Users may be able to complete some information based on existing data dictionaries, previous experience, using previously published studies and other online information, or by soliciting information from colleagues familiar with the data source. In our experience, identifying fit‐for‐purpose data often requires specific estimates and queries of the data. Note that data dictionaries typically indicate whether the data elements are available in the data, but rarely include the completeness of that data element or information on data transformations. For proprietary and unlicensed data sources, the user will need to request information directly from the data owner or institution (e.g., university, government body, or non‐governmental organization), which often requires a contract and payment. Thus, for key data elements, we suggest conducting queries or requesting specific counts, estimates of risk, and/or percent of missingness from data owners; asking about data transformations or masking of information; and, for linked data sources (e.g., medical claims linked with laboratory results), asking detailed questions about the extent of overlap. For sources held “in‐house,” researchers can conduct their own data queries, allowing for greater efficiency.
When starting step 3, some of the key information (i.e., the information ranked highest and used in the narrowing process), will already be known and all sources under consideration will meet these requirements. However, we recommend including this information in Table 2 to keep all feasibility information in one place and to allow capture of more nuanced information, such as completeness of a data type (e.g., a particular laboratory result). When needed, template Table 2 can be used to facilitate data requests by providing the data vendor with a truncated version of Table 2 that includes the rows only; other data sources and any other sensitive information can be removed. The researcher can combine responses for each data source for a side‐by‐side evaluation.
The completed Table 2 can be used to evaluate and compare the data sources, identifying any data source(s) that meets the needs of the study. For communication with internal and external stakeholders about this decision‐making process, we find a heat map to be a useful illustration tool. Template Figure S3 converts Table 2 into a heat map to visually identify the fit‐for‐purpose data source. To do this, the user ranks each cell of Table 2 from 0 (i.e., does not meet study requirements) to 5 (i.e., many/nearly all data requirements met). To aid communication, we also recommend the user provide a Consolidated Standards of Reporting Trials (CONSORT)‐like diagram showing the total number of data sources considered, how many were included/excluded based on each ranked criterion from Table 1 , and the final list of data sources included in the detailed feasibility assessment (see Figure 4 ).
Figure 4.
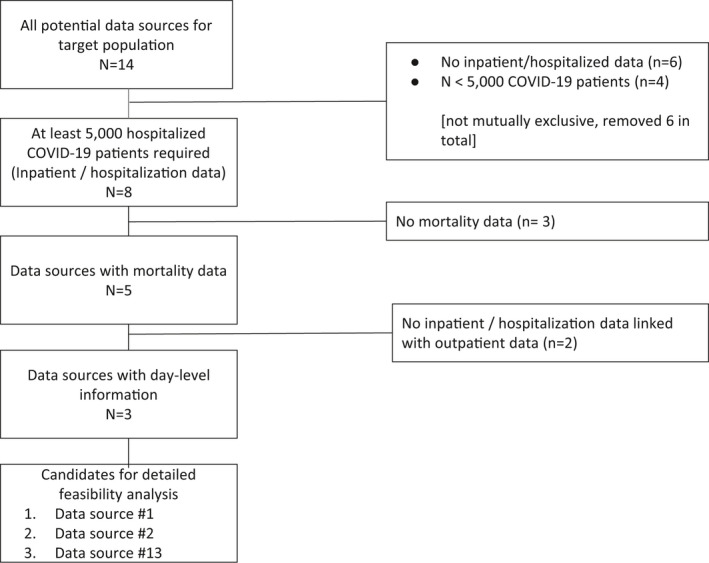
Case Example 1: SPIFD step 2 prospectively applied to COVID‐19 treatment study. COVID‐19, coronavirus disease 2019; SPIFD, Structured Process to Identify Fit‐For‐Purpose Data.
ILLUSTRATIVE EXAMPLE 1. COVID‐19 TREATMENT STUDY
The SPIFD framework was (prospectively) applied to identify fit‐for‐purpose data for a recently initiated COVID‐19 treatment study (NCT04926571) 40 developed under a research collaboration between Aetion and the FDA. In June 2020, the RECOVERY Collaborative Group published preliminary findings based on a randomized clinical trial conducted in the United Kingdom that demonstrated a significant reduction in 28‐day mortality among hospitalized patients with COVID‐19 treated with dexamethasone 41 ; however, these results have not yet been confirmed in routine care in the United States.
ILLUSTRATIVE EXAMPLE 1. SPACE STEPS 1–3: RESEARCH QUESTION AND MINIMUM CRITERIA
The specific research question of interest (SPACE step 1a) is whether treatment with dexamethasone among US patients hospitalized with COVID‐19 diagnosis or severe acute respiratory syndrome‐coronavirus 2 (SARS‐CoV‐2) infection reduces the risk of inpatient mortality within 28 days, overall and stratified by COVID‐19 severity subgroups. 40 This study seeks to emulate a hypothetical target trial (SPACE step 1b) of US hospitalized patients with COVID‐19, with randomization to dexamethasone (+ routine care) or non‐corticosteroid routine care, to compare the risk of 28‐day inpatient mortality. Initial definitions were developed and documented for all study design elements (SPACE steps 1c + 2b; Table 3). The minimal criteria (SPACE step 3; Table 3) included inpatient data (inclusion criterion to identify the cohort of interest), with at least N = 5,000 hospitalized patients (to ensure adequate sample size to meet the study objectives after applying all inclusion/exclusion criteria), laboratory results (to identify patients missing a diagnostic code but tested positive or presumed positive for COVID‐19), inpatient hospitalization data linked with outpatient data (to apply a look back period for applying exclusions and defining confounding variables), near complete age, sex, and region (needed for risk‐set sample matching comparator with treated patients), day‐level (i.e., the associated date includes the day, month, and year), inpatient prescription data (to define the treatment and comparison groups), inpatient mortality data (to define the outcome variable), day‐level outpatient and inpatient diagnosis codes (to define confounding variables), and day‐level inpatient procedure codes (to define the key subgroup).
Table 3.
Case example 1: SPIFD step 1 applied to COVID‐19 treatment study
| Row | Design element | Operational definition | Minimal criteria for valid capture | Rank for importance (uniqueness) |
|---|---|---|---|---|
| 1 | Study population (inclusion/exclusion criteria) |
Inclusion criteria:
|
At least 5,000 hospitalized patients with COVID‐19 required (inpatient/hospitalization data) Lab results to identify additional COVID‐19 positive patients |
1 |
|
Exclusion criteria:
|
Inpatient data linked with outpatient data Near complete age, sex, region data |
3 4 |
||
| 2 | Treatment group | New use of systemic dexamethasone (DEX+), defined with procedural codes (CPT, HCPCS, hospital charge codes for corresponding text strings, and NDC codes) | Day level inpatient prescription data | 5 |
| 3 | Comparator group | Non‐users of CSIs (risk‐set sample matched to treated at treatment initiation) | Day level inpatient prescription data | 5 |
| 4 | Primary outcome(s) | Inpatient mortality over a 28‐day period sourced from discharge status field (“expired”) | Inpatient mortality | 2 |
| 5 | Key secondary outcome(s) | Not applicable | Not applicable | |
| 6 | Length of follow‐up and data recency | 28 days | 28 days minimum | |
| 7 | Confounding variables | For example: Baseline and pre‐treatment comorbidities | Day level outpatient (for baseline period) + inpatient (for pretreatment period) diagnosis data | 6 |
| 8 | Key subgroups | COVID‐19 related severity per modified version of WHO ordinal scale (mWHO), defined as no oxygen, any O2/NIV, IMV, composite of any O2/NIV or IMV | mWHO COVID‐19 severity (procedures on the day level) | 7 |
COVID‐19, coronavirus disease 2019; CPT, current procedural terminology; CSI, corticosteroid of interest DEX+, dexamethasone; HCPCS, healthcare common procedure coding system; ICD‐10, International Classification of Disease‐10th edition; IMV, invasive mechanical ventilation; MPRED+, methylprednisolone; mWHO, modified version of WHO ordinal scale; NDC, national drug code; NIV, non‐invasive ventilation; O2 = oxygen; SARS‐CoV‐2, severe acute respiratory syndrome‐coronavirus 2; SPIFD, Structured Process to Identify Fit‐For‐Purpose Data.
ILLUSTRATIVE EXAMPLE 1. SPIFD STEP 1: OPERATIONALIZE AND RANK REQUIREMENTS
After refining the study design elements (to ensure each element was operational) and the minimal criteria from SPACE step 3 (Table 3), we identified criteria that were critical and/or not readily available in RWD. We then ranked these criteria from 1–7 (Table 3 ). We ranked the criterion needed to identify the study population highest to ensure we could capture a sufficient number of hospitalized patients to meet the study objectives. Inpatient mortality data was ranked second because these data are needed to define the primary outcome. We ranked linked inpatient‐outpatient data third because the outpatient data were needed to apply exclusion criteria and for confounding control. Although the exact order of these rankings is subjective, consideration of these three criteria allowed us to sufficiently narrow the data sources for detailed feasibility assessment.
ILLUSTRATIVE EXAMPLE 1. SPIFD STEP 2: IDENTIFY AND NARROW DATA SOURCES
In step 2a, we started with identifying 14 data sources that included our US‐based confirmed COVID‐19 target study population and could be accessed in a timely fashion (Figure 4 ). Then, to narrow this list, we sequentially applied the highest ranking minimal criteria (e.g., study cohort of at least 5,000 hospitalized patients with COVID‐19, mortality data, and inpatient data linked with outpatient data) (Figure 4 ). This left us with three candidate data sources that appeared to contain the highest‐ranking criteria.
ILLUSTRATIVE EXAMPLE 1. SPIFD STEP 3: CONDUCT DETAILED FEASIBILITY ASSESSMENT OF CANDIDATE DATA SOURCES
For the remaining three data sources, we then conducted a detailed feasibility assessment (completing the Table 2 template) by consulting with the data vendors and reviewing detailed data dictionaries. Gathering detailed information, such as the counts of hospitalized patients with COVID‐19 and baseline risk of mortality, for each data source was an iterative process. Due to the rapidly evolving clinical and epidemiologic landscape of COVID‐19 at the time, this process was challenging. In order to proceed in a timely manner, we captured the available information at the time, but with the understanding that key estimates (e.g., baseline risk of mortality) would likely change over the course of study design, requiring updating prior to implementation. High‐level summary of the data feasibility assessment across all three data sources is presented in Table S1 , along with our heat map (Figure 5 ). Table S1 allowed us to critically weigh both study design and logistical considerations and narrow our final choice to a single fit‐for‐purpose data source (data set #1). The heatmap version (Figure 5 ) was used to communicate our final data source selection to internal and external stakeholders. One limitation of our chosen data source was the lack of day‐level inpatient diagnosis information; however, we determined this trade‐off was acceptable given the availability of day‐level diagnoses in the outpatient setting, at hospital admission and discharge, as well as the high ranking of other database attributes, such as day‐level prescription data, near‐complete demographic data, and low barriers to timeline and contracting logistics (Figure 5 ).
Figure 5.
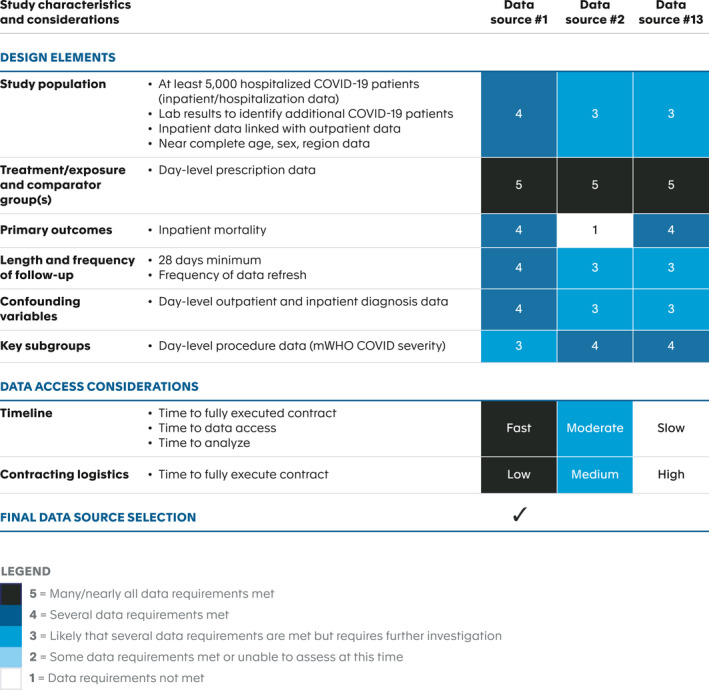
Case Example 1: SPIFD step 3 heatmap prospectively applied to COVID‐19 treatment study. COVID‐19, coronavirus disease 2019; mWHO, modified version of WHO ordinal scale; SPIFD, Structured Process to Identify Fit‐For‐Purpose Data.
ILLUSTRATIVE EXAMPLE 2: VARENICLINE PREGNANCY STUDY
To further illustrate using the SPIFD framework to identify fit‐for‐purpose data, we describe the feasibility approach for a safety study of varenicline exposure during pregnancy. Varenicline is a prescription aid for smoking cessation treatment. This study was initiated as a commitment to the FDA shortly after product approval in 2006 to evaluate adverse pregnancy and birth outcomes in women exposed to varenicline during pregnancy. 42 Although this study followed an earlier version of the SPIFD data source feasibility assessment approach, this study (among many others) informed the subsequent development of the SPIFD templates. To illustrate the application of the SPIFD framework, we have retroactively completed SPIFD steps 1–3 (refer to Tables S2 , S3 , Figures S1 , S2).
ILLUSTRATIVE EXAMPLE 2. SPACE STEPS 1‐3: RESEARCH QUESTION AND MINIMUM CRITERIA
The research question for this study (SPACE step 1a) was whether infants exposed to varenicline in utero were at increased risk of major congenital malformations, stillbirth, small for gestational age, preterm delivery (< 37 gestational weeks), preterm premature rupture of membranes, and sudden infant death syndrome. Study design elements were conceptualized following SPACE steps 1c + 2b; Table S2 . The minimal criteria for candidate data sources (SPACE step 3; Table S2 ) included data on in utero exposure to maternal smoking status (to identify an appropriate unexposed comparator cohort; i.e., exposed to smoking but not varenicline in utero), source population of at least 5 million people (to ensure capture of a target of 371 infants with in utero exposure to varenicline per sample size estimates), maternal prescription data linked with birth data and birth data linked to infant inpatient/outpatient diagnosis data generated during the first year of life (to ensure capture of study endpoints), and pregnancy data linked to maternal prescription data and maternal inpatient/outpatient diagnosis data (to ensure capture of potential confounders).
ILLUSTRATIVE EXAMPLE 2. SPIFD STEP 1: OPERATIONALIZE AND RANK REQUIREMENTS
After operationalizing each study design element and the minimal criteria from SPACE step 3 (Table S2 ), we ranked these criteria from 1–8 in importance for data source selection. The most important criterion was access to data on in utero exposure to maternal smoking status to ensure comparability between the exposed (to varenicline) and unexposed cohorts. Size of the underlying population was ranked second to help ensure the sample size requirement was met, followed by criteria to ensure valid capture of the study end points.
ILLUSTRATIVE EXAMPLE 2. SPIFD STEP 2: IDENTIFY AND NARROW DATA SOURCES
Consideration of the criteria regarding availability of maternal smoking data and size of source population narrowed our assessment of 12 candidate data sources to 3 (Figure S1 ).
ILLUSTRATIVE EXAMPLE 2. SPIFD STEP 3: CONDUCT DETAILED FEASIBILITY ASSESSMENT OF CANDIDATE DATA SOURCES
The relevant characteristics of the three candidate data sources are summarized in Table S3 . Based on these findings, the candidates were ranked to indicate capability of meeting the study design elements (Figure S2 ). Although data sources #6 and #7 had incomplete outpatient primary care diagnosis data, the availability of other diagnostic data needed for end point capture was good and thus ranked as “nearly complete.” As shown in Figure S2 , data sources #6 and #7 (registry data from 2 different countries) were selected as fit‐for‐purpose for this pregnancy safety study.
CONCLUSION
We developed a structured process, called SPIFD, for identifying secondary data sources and conducting feasibility data assessments to ensure data are fit‐for‐purpose and relevant to the study’s research question. As an extension of the SPACE framework, SPIFD completes the process from articulation of a specific and meaningful research question to the identification of fit‐for‐purpose data and study design; it may also be used as a standalone tool with other study design frameworks if the minimal validity criteria for each study design element are specified. SPIFD expands upon the “relevancy” evaluation criteria described in the Duke Margolis Center for Health Policy framework 31 (adding consideration of logistics, such as costs and time to data access), and providing a systematic process and decision support for data selection. Documenting the evidence and justification for data selection decisions allows decision makers to better understand how a particular source was chosen, and to determine whether the rationale underlying the decision was sound.
SPIFD was developed based on our experience designing studies across many disease/therapeutic areas for regulatory purposes (to support clinical development, regulatory submissions and for postapproval commitments) as well as payer and health technology assessment purposes. The approach and specific processes have been refined over time and—we find—are widely applicable. By providing two illustrative examples, we hope to reinforce the broad application of this framework.
The process serves as a guide but is iterative in practice, and can be adapted to the needs of the particular research question and study. The provided table templates can be downloaded and edited as needed (Tables S4 , S5 , Figure S3 contain fully editable versions). We hope that broadened use by others will lead to further refinements or specific versions developed for particular types of use cases.
The selection of fit‐for‐purpose data requires due diligence on the part of the researcher. It is important to allow sufficient time to scrutinize documentation, ask data owners clarifying questions, query the data, and/or receive counts and estimates specific to the cohort of interest. Although the efforts can be time‐consuming and costly, we find this diligence necessary to ensure the selected data are truly fit‐for‐purpose. The operationalization of some critical data elements may be subjective. For instance, experts may not agree on the most clinically relevant and accurate definition of an inclusion criterion, exposure, end point, or covariate. When available, we recommend using validated definitions/algorithms, and, when needed, performing pilot or validation studies. At a minimum, the impact of varied definitions can be assessed in prespecified sensitivity analyses.
SPIFD fills a gap in the published literature on best practices for using RWD for decision making, providing concrete tools to facilitate this due diligence and rationalize data source selection prior to study conduct. We anticipate use of this tool, when implemented with real‐world study design and best practice frameworks, will increase confidence in the appropriateness of RWE for decisions, ensuring RWD is justified and the data source(s) selected is fit‐for‐purpose.
FUNDING
No funding was received for this work.
CONFLICT OF INTEREST
The following personal or financial relationships relevant to this manuscript existed during the conduct of the study: N.G., E.R., A.J., and P.M. are employees of and hold stock options or equity in Aetion Inc. R.R. is an employee of GlaxoSmithKline. U.C. and J.M. are employees of Pfizer Inc. N.G., E.R., U.C., J.M., and R.R. hold stock options in Pfizer Inc. The views expressed herein are the authors and not necessarily those of GlaxoSmithKline or Pfizer.
Supporting information
Fig S1
Fig S2
Table S1
Table S2
Table S3
Table S4
Table S5
Supplementary Material
Acknowledgments
The authors thank Elizabeth Garry for her thoughtful review of this manuscript.
An earlier version of this work was presented at the 36th International Conference on Pharmacoepidemiology & Therapeutic Risk Management in, ICPE All Access Virtual Event, September 16–17, 2020 and the 37th International Conference on Pharmacoepidemiology & Therapeutic Risk Management in, ICPE All Access Virtual Event, August 23–25, 2021.
- 1. HMA/EMA Joint Task Force on Big Data . Observational data (Real World Data) Subgroup report <www.ema.europa.eu/en/documents/report/observational‐data‐real‐world‐data‐subgroup‐reporten.pdf> (2019). Accessed June 16, 2021.
- 2. CanREValue . Mapping Canadian Provincial Data Assets to Conduct Real‐World Studies on Cancer Drugs CanREValue Collaboration Data Working Group Interim Report 2020 <https://cc‐arcc.ca/wp‐content/uploads/2020/04/The‐CanREValue‐Data‐WG‐Interim‐Report‐Revision_Final_v1.pdf>. Accessed June 15, 2021.
- 3. Milea, D. , Azmi, S. , Reginald, P. , Verpillat, P. & Francois, C. A review of accessibility of administrative healthcare databases in the Asia‐Pacific region. J. Mark. Access Health Policy 3, 28076 (2015). [DOI] [PMC free article] [PubMed] [Google Scholar]
- 4. Sherman, R.E. et al. Real‐world evidence — what is it and what can it tell us? N. Engl. J. Med. 375, 2293–2297 (2016). [DOI] [PubMed] [Google Scholar]
- 5. U.S. Food & Drug Administration . Framework for FDA’s Real‐world Evidence Program <https://www.fda.gov/media/120060/download> (December 2018). Accessed June 15, 2021.
- 6. European Medicine Agency (EMA) . EMA Regulatory Science Strategy to 2025 <https://www.ema.europa.eu/en/documents/regulatory‐procedural‐guideline/ema‐regulatory‐science‐2025‐strategic‐reflection_en.pdf> March 31, 2020. Accessed October 3, 2021.
- 7. National Institute for Health and Care Excellence . Increasing use of health and social care data in guidance development 2020 <https://www.nice.org.uk/about/what‐we‐do/our‐programmes/nice‐guidance/nice‐guidelines/how‐we‐develop‐nice‐guidelines/data‐and‐analytics‐statement‐of‐intent>. Accessed October 3, 2021.
- 8. U.S. Food & Drug Administration . Center for Devices and Radiological Health . Examples of real‐world evidence (RWE) used in medical device regulatory decisions 2021 <www.fda.gov/media/146258/download>. Accessed October 3, 2021.
- 9. Griffiths, E.A. , Macaulay, R. , Vadlamudi, N.K. , Uddin, J. & Samuels, E.R. The role of noncomparative evidence in health technology assessment decisions. Value Health 20, 1245–1251 (2017). [DOI] [PubMed] [Google Scholar]
- 10. Franklin, J.M. & Schneeweiss, S. When and how can real world data analyses substitute for randomized controlled trials? Clin. Pharmacol. Ther. 102, 924–933 (2017). [DOI] [PubMed] [Google Scholar]
- 11. Garry, E. , Gatto, N. , Wang, S. & Campbell, U. RWE Blueprints: Decoding SPACE, SPIFD, StartRWE, and Other Tools Promoting Principled Pharmacoepidemiology. Pharmacoepidemiol. Drug Saf. 30(S1):3–400 (2021). Supplement: Abstracts of the 37th International Conference on Pharmacoepidemiology & Therapeutic Risk Management, Virtual, August 23, 2021. <https://onlinelibrary.wiley.com/doi/10.1002/pds.5305>. [DOI] [PubMed] [Google Scholar]
- 12. Gatto, N.M. , Reynolds, R.F. & Campbell, U.B. A structured preapproval and postapproval comparative study design framework to generate valid and transparent real‐world evidence for regulatory decisions. Clin. Pharmacol. Ther. 106, 103–115 (2019). [DOI] [PMC free article] [PubMed] [Google Scholar]
- 13. Wang, S.V. , Pinheiro, S. , Hua, W. , Arlett, P. , Uyama, Y. , Berlin, J.A. et al. STaRT‐RWE: structured template for planning and reporting on the implementation of real world evidence studies. BMJ 372, m4856 (2021). [DOI] [PMC free article] [PubMed] [Google Scholar]
- 14. Berger, M.L. et al. Good practices for real‐world data studies of treatment and/or comparative effectiveness: recommendations from the joint ISPOR‐ISPE Special Task Force on real‐world evidence in health care decision making. Pharmacoepidemiol. Drug Saf. 26, 1033–1039 (2017). [DOI] [PMC free article] [PubMed] [Google Scholar]
- 15. Orsini, L.S. et al. Improving transparency to build trust in real‐world secondary data studies for hypothesis testing‐why, what, and how: recommendations and a road map from the real‐world evidence transparency initiative. Value Health 23, 1128–1136 (2020). [DOI] [PubMed] [Google Scholar]
- 16. Langan, S.M. et al. The reporting of studies conducted using observational routinely collected health data statement for pharmacoepidemiology (RECORD‐PE). BMJ 363, k3532 (2018). [DOI] [PMC free article] [PubMed] [Google Scholar]
- 17. Hernán, M.A. & Robins, J.M. Using big data to emulate a target trial when a randomized trial is not available. Am. J. Epidemiol. 183, 758–764 (2016). [DOI] [PMC free article] [PubMed] [Google Scholar]
- 18. VanderWeele, T.J. , Hernán, M.A. & Robins, J.M. Causal directed acyclic graphs and the direction of unmeasured confounding bias. Epidemiology 19, 720–728 (2008). [DOI] [PMC free article] [PubMed] [Google Scholar]
- 19. Cox, E. , Martin, B.C. , Van Staa, T. , Garbe, E. , Siebert, U. & Johnson, M.L. Good research practices for comparative effectiveness research: approaches to mitigate bias and confounding in the design of nonrandomized studies of treatment effects using secondary data sources: the International Society for Pharmacoeconomics and Outcomes Research Good Research Practices for Retrospective Database Analysis Task Force Report‐Part II. Value Health 12, 1053–1061 (2009). [DOI] [PubMed] [Google Scholar]
- 20. Schneeweiss, S. et al. Graphical depiction of longitudinal study designs in health care databases. Ann. Intern. Med. 170, 398–406 (2019). [DOI] [PubMed] [Google Scholar]
- 21. European Medicine Agency (EMA) . Guidance for the format and content of the protocol of non‐interventional post‐authorisation safety studies. September 26, 2012 EMA/623947/2012 <https://www.ema.europa.eu/en/documents/other/guidance‐format‐content‐protocol‐non‐interventional‐post‐authorisation‐safety‐studies_en.pdf>. Accessed June 15, 2021.
- 22. European Network of Centre . ENCePP Guide on Methodological Standards in Pharmacoepidemiology. Chapter 3: Development of the study protocol. July 2020 <http://www.encepp.eu/standards_and_guidances/methodologicalGuide3.shtml>. Accessed June 15, 2021.
- 23. Velentgas, P. , Dreyer, N.A. , Nourjah, P. , Smith, S.R. & Torchia, M.M. eds. Developing a Protocol for Observational Comparative Effectiveness Research: A User’s Guide. AHRQ Publication No. 12(13)‐EHC099. Rockville, MD: Agency for Healthcare Research and Quality; January 2013 <https://effectivehealthcare.ahrq.gov/products/observational‐cer‐protocol/research>. [PubMed] [Google Scholar]
- 24. Public Policy Committee, International Society of Pharmacoepidemiology . Guidelines for good pharmacoepidemiology practice (GPP). Pharmacoepidemiol. Drug Saf. 25, 2–10 (2016). [DOI] [PubMed] [Google Scholar]
- 25. Patient‐Centered Outcomes Research Institute (PCORI) . PCORI Methodology Report. February 26, 2019 <https://www.pcori.org/research-results/about-our-research/research-methodology/pcori-methodology‐report>. Accessed June 15, 2021.
- 26. U.S. Food & Drug Administration . Guidance for Industry and FDA Staff: Best Practices for Conducting and Reporting Pharmacoepidemiologic Safety Studies Using Electronic Healthcare Data <http://www.fda.gov/downloads/Drugs/GuidanceComplianceRegulatoryInformation/Guidances/UCM243537.pdf>. Accessed June 21, 2021.
- 27. European Medicine Agency (EMA) . Draft Guideline on registry‐based studies. September 24, 2020 2 EMA/502388/2020 <https://www.ema.europa.eu/en/documents/scientific‐guideline/guideline‐registry‐based‐studies_en.pdf>. Accessed June 21, 2021.
- 28. Jaksa, A. , Wu, J. , Jónsson, P. , Eichler, H.G. , Vititoe, S. & Gatto, N.M. Organized structure of real‐world evidence best practices: moving from fragmented recommendations to comprehensive guidance. J. Comp. Eff. Res. 10, 711–731 (2021). [DOI] [PubMed] [Google Scholar]
- 29. U.S. Food & Drug Administration . Draft Guidance for Industry: Real‐World Data: Assessing Electronic Health Records and Medical Claims Data To Support Regulatory Decision‐Making for Drug and Biological Products. Docket Number FDA‐2020‐D‐2307. September 29, 2021 <https://www.fda.gov/regulatory‐information/search‐fda‐guidance‐documents/real‐world‐data‐assessing‐electronic‐health‐records‐and‐medical‐claims‐data‐support‐regulatory>. Accessed October 3, 2021.
- 30. Duke‐Margolis Center . Determining Real‐World Data’s Fitness for Use and the Role of Reliability September 26, 2019 <https://healthpolicy.duke.edu/publications/determining‐real‐world‐datas‐fitness‐use‐and‐role‐reliability>. Accessed June 15, 2021.
- 31. Duke‐Margolis Center . Characterizing RWD Quality and Relevancy for Regulatory Purposes October 1, 2018 <https://healthpolicy.duke.edu/sites/default/files/2020‐03/characterizing_rwd.pdf>. Accessed June 15, 2021.
- 32. Desai, K. , Chandwani, S. , Ru, B. , Reynolds, M. , Christian, J. & Estiri, H. Fit‐for‐Purpose Real‐World Data Assessments in Oncology: A Call for Cross‐Stakeholder Collaboration. Value Outcome Spotlight 2021 <https://www.ispor.org/publications/journals/value‐outcomes‐spotlight/vos‐archives/issue/view/expanding‐the‐value‐conversation/fit‐for‐purpose‐real‐world‐data‐assessments‐in‐oncology‐a‐call‐for‐cross‐stakeholder‐collaboration>. Accessed October 3, 2021.
- 33. Cocoros, N.M. et al. The certainty framework for assessing real‐world data in studies of medical product safety and effectiveness. Clin. Pharmacol. Ther. 109, 1189–1196 (2021). [DOI] [PubMed] [Google Scholar]
- 34. Miksad, R.A. & Abernethy, A.P. Harnessing the power of real‐world evidence (RWE): a checklist to ensure regulatory‐grade data quality. Clin. Pharmacol. Ther. 103, 202–205 (2018). [DOI] [PMC free article] [PubMed] [Google Scholar]
- 35. European Network for Health Technology Assessment (eunethta). Milestone 5.15 Final validated Standards Tool for Registries in HTA prepared <https://www.eunethta.eu/request‐tool‐and‐its‐vision‐paper/>. Accessed June 15, 2021.
- 36. ECOG‐ACRIN Cancer Research Group . ECOG Performance Status <https://ecog‐acrin.org/resources/ecog‐performance‐status>.
- 37. Oken, M.M. et al. Toxicity and response criteria of the Eastern Cooperative Oncology Group. Am. J. Clin. Oncol. 5(6), 649–655 (1982). [PubMed] [Google Scholar]
- 38. RECIST Working Group . RECIST guidelines (version 1.1) <https://recist.eortc.org/recist‐1‐1‐2/>. Accessed June 15, 2021.
- 39. Beachler, D.C. , de Luise, C. , Yin, R. , Gangemi, K. , Cochetti, P.T. & Lanes, S. Predictive model algorithms identifying early and advanced stage ER+/HER2‐ breast cancer in claims data. Pharmacoepidemiol. Drug Saf. 28, 171–178 (2019). [DOI] [PubMed] [Google Scholar]
- 40. Gatto, N. , Garry, E.M. & Chakravarty, A. Effect of Dexamethasone on Inpatient Mortality Among Hospitalized COVID‐19 Patients. April 1, 2020–August 31, 2021. NCT04926571 <https://clinicaltrials.gov/ct2/show/NCT04926571>.
- 41. RECOVERY Collaborative Group et al. Dexamethasone in hospitalized patients with Covid‐19. N. Engl. J. Med. 384, 693–704 (2021). [DOI] [PMC free article] [PubMed] [Google Scholar]
- 42. Pedersen, L. et al. Risk of adverse birth outcomes after maternal varenicline use: a population‐based observational study in Denmark and Sweden. Pharmacoepidemiol. Drug Saf. 29, 94–102 (2020). [DOI] [PubMed] [Google Scholar]
Associated Data
This section collects any data citations, data availability statements, or supplementary materials included in this article.
Supplementary Materials
Fig S1
Fig S2
Table S1
Table S2
Table S3
Table S4
Table S5
Supplementary Material