. 2022 Jul 7;11:e71437. doi: 10.7554/eLife.71437

Figure 1. An electrophysiology-based genetic screen identifies thin as a synaptic homeostasis gene.

(A) The number of putative E3 ubiquitin ligase-encoding genes (E3) and protein kinase-encoding genes (PK) as a function of total protein-coding gene number of C. cerevisiae, D. melanogaster, and H. sapiens. Note the similar relationship between E3 number or PK number and total protein-coding gene number across species. (B) Top: 157 E3 ligase-encoding genes and 11 associated genes (180 lines; presynaptic RNAi expression, elavc155-Gal4>UAS RNAi, or mutants, note that some genes were targeted by more than one line) were tested using two-electrode voltage clamp analysis at the Drosophila neuromuscular junction (NMJ) in the presence of the glutamate receptor (GluR) antagonist philanthotoxin-443 (‘PhTX’) to assess presynaptic homeostatic plasticity (PHP) (see Materials and methods). Bottom: Exemplary miniature excitatory postsynaptic potentials (mEPSPs) and action potential (AP)-evoked excitatory postsynaptic currents (EPSCs) recorded from wild-type (WT), WT in the presence of PhTX (‘WT + PhTX’), and a PHP mutant in the presence of PhTX (‘PHP mutant + PhTX’). Note the decrease in mEPSP amplitude after PhTX treatment, indicating GluR inhibition, and the similar EPSC amplitude between WT and WT + PhTX, suggesting PHP. Small EPSC amplitudes in the presence of PhTX (red arrow) imply a defect in PHP or baseline synaptic transmission. (C) Histogram of mean mEPSP amplitudes for each transgenic or mutant line (mean n = 4 NMJs per line, range 3–12; N = 180 lines) following PhTX treatment. WT averages under control conditions (‘WT’, n = 16) and in the presence of PhTX (‘WT + PhTX’, n = 16) are shown as gray and black arrows, respectively. (D) Histogram of mean EPSC amplitudes (as in C). The red bars indicate transgenic or mutant lines with EPSC amplitudes significantly different from WT in the presence of PhTX (black arrow). (E) Volcano plot of the ratio between the mean EPSC amplitude of a transgenic or mutant line and WT (‘EPSCx/EPSCWT’) in the presence of PhTX (p values from one-way analysis of variance [ANOVA] with Tukey’s multiple comparisons). Transgenic or mutant lines with mean EPSC amplitude changes with p ≤ 0.01 (dashed line) are shown in red. A deletion in the gene thin (CG15105; thinΔA; LaBeau-DiMenna et al., 2012) that was selected for further analysis is shown as a filled red circle. One-way ANOVA with Tukey’s multiple comparisons was performed for statistical testing (C–E).
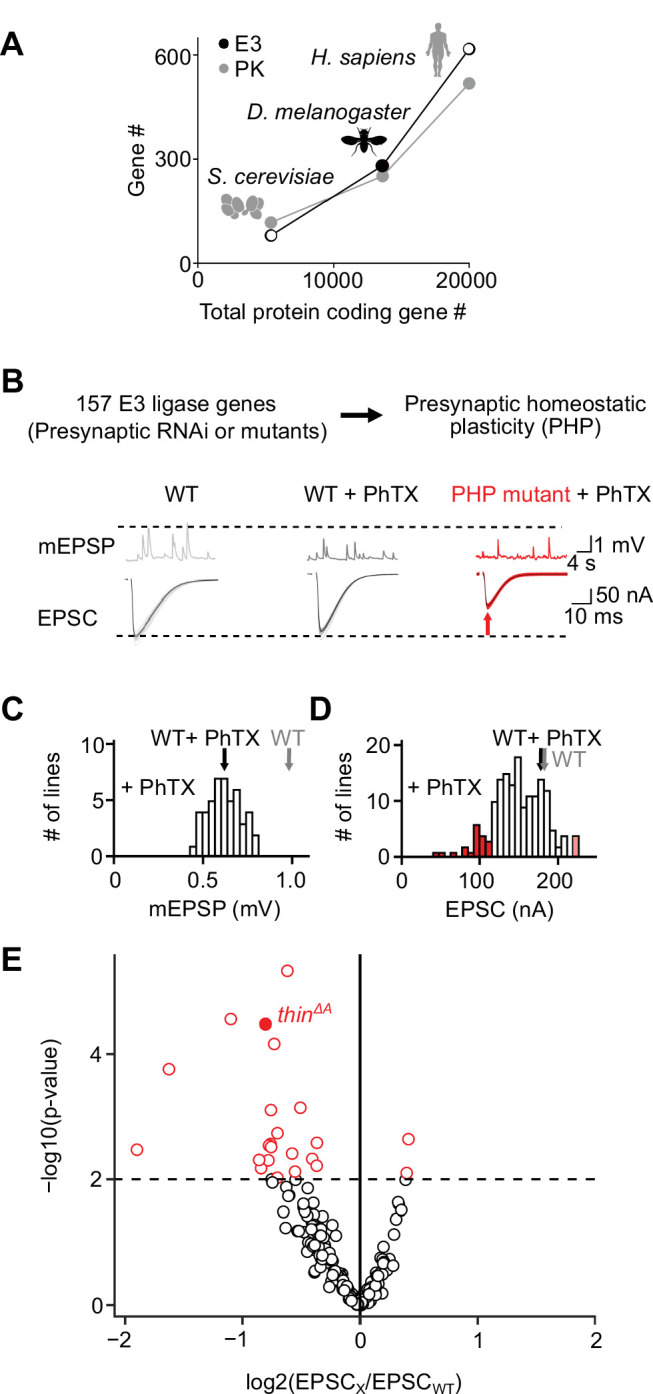
Figure 1.

Figure 1—figure supplement 1. Generation and prioritization of the E3 ligase-encoding gene list.

Figure 1—figure supplement 1.

(A) Flow chart describing the prioritization process of the E3 list. Generation: First, we used the Gene Ontology (GO) search of Flybase (Larkin et al., 2021) to identify genes annotated to encode for proteins with E3 ubiquitin ligase domains within the Drosophila melanogaster genome. This yielded an initial list of 221 genes, including confirmed and putative E3 ligase-encoding genes, similar to previous estimates (Du et al., 2011). Next, we added genes encoding domains contributing to the formation of the E3 complex, including the F-box domain, the Cullin domain, the N-recognin domain, the SKP1 domain, and the U-box domain. Subsequently, we searched human E3 ligase-encoding genes (Li et al., 2008) for D. melanogaster orthologs using the Drosophila RNAi Screening Center Integrative Ortholog Prediction Tool (DIOPT; version 8.0; http://www.flyrnai.org/diopt) (Hu et al., 2011). In total, this approach identified 281 putative E3 ligase-encoding genes in the D. melanogaster genome. Prioritization: We used a combination of four different criteria to create a score (normalized to max.) to prioritize the E3 list for screening the most relevant candidates. First, we prioritized for evolutionary conservation according to the overall DIOPT score of each putative E3 ligase-encoding gene with regard to its human ortholog (Hu et al., 2011) (score 1, ‘ω1’). Second, we prioritized for genes with predicted central nervous system expression based on transcriptomics data from modENCODE (modENCODE Consortium et al., 2009) and FlyAtlas (Chintapalli et al., 2007) (ω2). Third, we prioritized for genes encoding for proteins predicted to interact with synaptic proteins. In short, we created a literature-based list of known synaptic genes and calculated an interaction probability between each putative E3 ligase-encoding gene and all synaptic genes using STRING (von Mering et al., 2005) (ω3). Fourth, we considered the probability of synaptic function predicted by machine-learning based analysis of transcriptomics data (Pazos Obregón et al., 2015; Pazos Obregón et al., 2019) (ω4). The list of putative E3 ligase-encoding genes was sorted according to the sum of the four scores for each gene. (B) Distribution of the total score (summed weights) for all putative E3 ligase-encoding genes. The red bars indicate the lines selected for analysis (arbitrary threshold). In addition, genes encoding E3 ligases with known targets implicated in synaptic transmission or synaptic plasticity based on previously published data were added to our screen. Altogether, we tested 157 out of the 281 genes.
Figure 1—figure supplement 2. Homology between Thin and TRIM family proteins.

Figure 1—figure supplement 2.

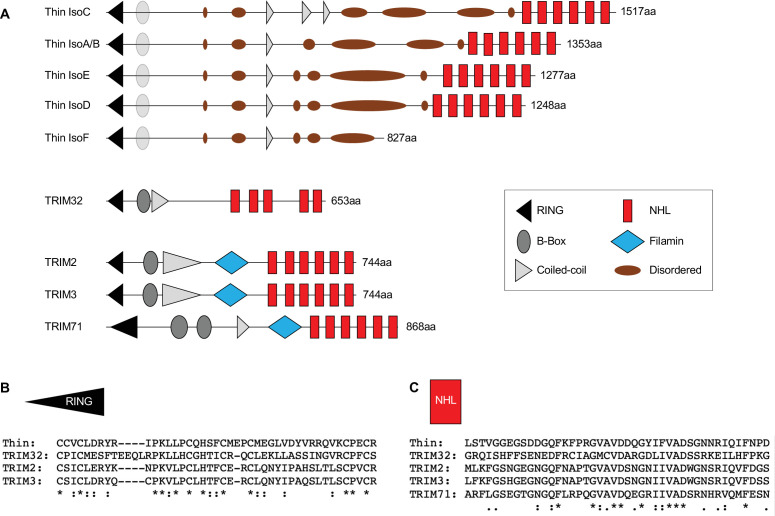
(A) Schematic representation of the domain organization of Drosophila Thin isoforms and its closest human TRIM family homologs. thin encodes an E3 ligase with a N-terminal tripartite motif (TRIM), containing one RING-finger domain (black triangle), a zinc-finger domain (B box, partially conserved, gray oval), and coiled-coil region (gray triangle), followed by disordered domains (brown ovals). Four out of five Thin isoforms harbor six C-terminal NHL repeats (red boxes). All TRIM proteins contain a N-terminal TRIM and are grouped into different families based on their C-terminal domain composition (Short and Cox, 2006). TRIM proteins with C-terminal NHL repeats form family C-VII. Hence, Thin’s domain composition is most similar to TRIM proteins of the C-VII family. Within the C-VII TRIM family, TRIM32 is the only member that harbors NHL repeats in addition to the TRIM motif. Other TRIM proteins of this family contain an additional Filamin domain (blue square), which is absent in Thin. Thus, Thin’s domain composition resembles the one of TRIM32, suggesting that TRIM32 is the closest human homolog of Thin. Alignment of RING domains (B) and NHL domains (C) of Thin and human TRIM family C-VII members implies evolutionary conservation of both domains between Thin and TRIM C-VII members (Ozato et al., 2008). The results of our analysis agree with LaBeau-DiMenna et al., 2012.