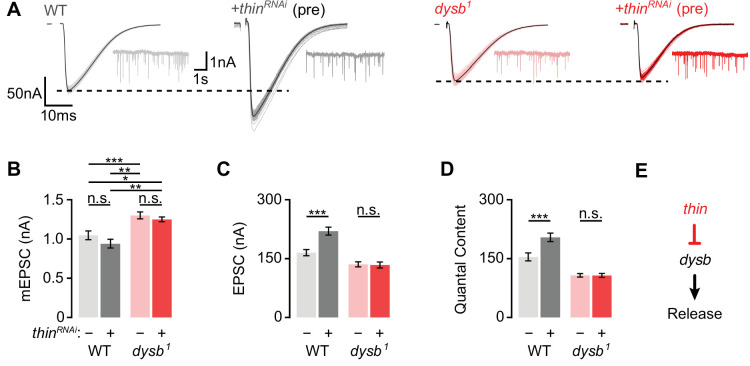
Figure 6. Thin represses release through dysbindin.
(A) Representative excitatory postsynaptic currents (EPSCs) (individual sweeps and averages are shown in light colors and black, respectively), and mEPSCs (insets) of wild-type (WT) (gray) and presynaptic thinRNAi (elavc155-Gal4>UAS-thinRNAi, ‘+thinRNAi (pre)’, dark gray), dysb1 mutants (light red), and presynaptic thinRNAi in the dysb1 mutant background (elavc155-Gal4/Y; UAS-thinRNAi/+; dysb1, ‘+thinRNAi (pre)’, dark red). Mean mEPSC amplitudes (B), EPSC amplitudes (C), and quantal content (D) of the indicated genotypes. Note that presynaptic thinRNAi expression increases EPSC amplitude and quantal content in WT, but not in dysb1 mutants. Mean ± standard error of the mean (SEM); WT: n = 17, elavc155-Gal4>UAS-thinRNAi: n = 17, dysb1: n = 12, elavc155-Gal4/Y; UAS-thinRNAi/+; dysb1: n = 12; *p < 0.05; **p < 0.01; ***p < 0.001; n.s.: not significant; two-way analysis of variance (ANOVA) followed by Tukey’s post hoc test. (E) Working model: Our genetic data support a model in which thin controls neurotransmitter release (‘Release’) through negative regulation of dysbindin (‘dysb’).

