

Abstract
MammaPrint® (MP) is a 70‐gene signature that stratifies early‐stage breast cancer patients into low‐ and high risk of distant relapse. Further stratification of MP risk results identifies four risk subgroups, ultra‐low (UL), low, high 1, and high 2, with specific prognostic and predictive outcomes. BluePrint® (BP) is an 80‐gene signature that classifies breast tumors as basal, luminal, or HER2 molecular subtype. To gain insight into their biological significance, we annotated the MP 70‐ and BP 80‐genes with respect to the 10 hallmarks of cancer (HoC). Furthermore, we related gene expression profiles of the extreme ends of the MP low‐ and high‐risk patients (here called, ultra‐low (UL) and ultra‐high (UH) or High2, respectively), to the 10 HoC per BP subtype by differential gene expression and pathway analysis. MP and BP gene functions reflected all 10 HoCs. Most MP and BP genes were associated with sustaining proliferative signaling, followed by genome instability and mutation categories. Based on the gene expression profiles, UL and UH subgroup pathways were down ‐or upregulated, respectively, reflecting proliferative and metastatic features, such as G2M checkpoint, DNA repair, oxidative phosphorylation, immune invasion, PI3K/AKT/mTOR signaling, and hypoxia pathways. Notably, the UH HER2‐type was enriched in several immune signaling pathways, such as IL2/STAT5 signaling and TNFα signaling via NFκB. Our results show that MP and BP gene signatures represent and capture all 10 HoCs and highlight underlying biological processes of MP extreme samples, which might guide treatment decisions as the signature captures the full spectrum of early breast cancers.
Keywords: BluePrint 80‐gene signature, early breast cancer, gene expression profiles, hallmarks of cancer, high/low risk, MammaPrint 70‐gene signature
1. INTRODUCTION
MammaPrint® (MP) is a 70‐gene signature that assesses the 10‐year risk of distant metastasis in early‐stage breast cancer patients (EBC). 1 , 2 , 3 , 4 This assay classifies tumors into low‐ and high‐risk of distant relapse and has been shown to identify patients who may safely avoid chemotherapy. The MINDACT trial showed that patients with genomically low‐risk MP tumors who did not receive adjuvant chemotherapy, had a 95.1% 5‐year rate of distant metastasis‐free survival (DMFS), despite all of these patients were clinically classified as high risk. 5 Such an excellent prognostic outcome indicates that MP low‐risk patients may safely forego chemotherapy.
The BluePrint® assay (BP) is an 80‐gene signature that identifies the intrinsic molecular subtypes of early‐stage breast cancers by assessing specific gene expression signatures of signaling pathways driving these subtypes (basal‐, luminal‐, and HER2‐type). 6 , 7 , 8 , 9 Several prospective studies have shown that BP subtyping more accurately identifies tumors likely to respond to neoadjuvant therapy (NAT) in comparison to conventional subtyping assays such as immunohistochemistry (IHC) and fluorescence in situ hybridization (FISH). Based on BP, basal, and HER2 subtypes are more sensitive to NAT than luminal subtype tumors, although patients with luminal subtype tumors have longer DMFS. 7 , 8 , 10 Combining the MP and BP assays allows further stratification of luminal BP subtypes into luminals A and B, corresponding to luminal MP low‐ and MP high‐risk tumors, respectively.
Both the MP and BP gene signatures were developed through a data‐driven approach by the use of genome‐wide expression data without any preselection of genes that are more likely to be involved in tumor metastasis or specific molecular subtypes. We previously demonstrated the association of MP 70 genes with the initial six hallmarks of cancer (HoCs), 11 , 12 which represent characteristics acquired during the multistep development of cancer cells to survive, proliferate, disseminate, and metastasize. These six hallmarks were extended to include additional two enabling characteristics (“Genome instability and mutation”, “Tumor‐promoting Inflammation”) and two emerging capabilities (“Deregulating cellular energetics”, “Avoiding immune destruction”). 13 In light of this, we aimed to update the annotation of the 70 MP and 80 BP genes with respect to the extended version of the 10 HoCs.
From its conception to its current diagnostic implementation, the utility of the MP signature has expanded, reflecting the evolving knowledge in the cancer biology field. Within the MP low‐ and high‐risk gene signatures, further stratification is possible into extreme MP low and high‐risk groups, respectively, which appear to be associated with specific clinical outcomes. 14 , 15 , 16 , 17 The MP ultra‐low‐risk group (UL), consists of hormone‐receptor positive, HER2‐negative EBCs with an excellent long‐term survival prognosis. Patients with UL tumors have a significantly lower risk of disease‐specific mortality in comparison to MP low risk, but not UL, patients. 15 UL patients without any endocrine treatment (ET) had a 20‐year disease‐specific survival rate of 97%, 14 which suggests that these patients may be able to safely forego ET. However, the biology of these MP UL tumors, categorized as malignant but yet indolent with respect to long‐term clinical outcomes, is not fully understood. The extremes of the MP high‐risk group, here called ultra high (UH) are classified by the most negative index range, which falls on the opposite end of the MP index spectrum compared to the UL group. Preliminary studies from the I‐SPY2 trials (https://www.ispytrials.org/i-spy-platform/i-spy2) show that the MP high 2 group, comparable to the MP UH group in this manuscript, is enriched for clinically triple‐negative‐like EBCs with higher pathologic response rates to specific treatment combinations such as PARP inhibition with platinum‐based chemotherapy 16 as well as pembrolizumab‐based immunotherapy combined with paclitaxel. 17 Therefore, here in addition to the updated association of the MP and BP signature genes with the 10 HoCs, we performed differential gene expression analysis (DGEA) on MP extreme groups to provide further insight into their biological significance, which could support and explain their clinical behavior.
2. MATERIALS AND METHODS
2.1. Annotation of MP and BP genes
The MP and BP corresponding microarray probes were aligned to the human genome version hg38 using BLAT, 18 and genes were annotated according to GENCODE Human release 32. 19 , 20 Next, the MP and BP genes were associated with the 10 HoCs using the Cancer Hallmarks Analytics Tool (CHAT), 21 which evaluates cancer‐related PubMed (https://pubmed.ncbi.nlm.nih.gov/) literature up to 2017 based on the 10 hallmarks of cancer. 13 Normalized pointwise mutual information (NPMI) values higher than 0 were considered an association. For the genes with no association found with CHAT, the LION (Literature‐Based Discovery tool) 22 was used. Although similar to CHAT, this tool relies on a more recently updated PubMed database than CHAT, and it also takes the synonyms of genes into account. Genes that were not related to any hallmark with CHAT or LION were annotated manually using PubMed, GeneCards (https://www.genecards.org/), and Gene Ontology (http://geneontology.org/) databases.
2.2. Differential gene expression and pathway analysis
To investigate distinguishing biological characteristics between MP extreme ends of the risk groups and non‐extreme ends groups, we performed the following comparisons using DGEA followed by gene set enrichment analysis (GSEA) based on cancer hallmark specific gene sets by Dhawan et al. 2018. 23
Low risk (LR) was compared to the UL group. Only BP luminal tumors were included; as expected, few nonluminal subtype tumors classify as MP LR or UL. The majority of BluePrint HER2 and basal‐type tumor are high risk by MammaPrint. 24
- UH was compared to the high‐risk (HR) group: This comparison was performed per BP subtype.
- Luminal UH versus luminal HR.
- Basal UH versus basal HR.
- HER2 UH versus HER2 HR.
To perform DGEA and GSEA, we selected a discovery set of full‐transcriptome microarray formaldehyde fixed‐paraffin embedded (FFPE) data generated at Agendia between January 2014 and June 2019 for which MP and BP results were available. These data were generated according to the standard diagnostic workflow as previously described 9 , 25 , 26 on tumors that met MP and BP eligibility criteria. All patient clinical and pathology data were blinded in accordance with national ethical guidelines. MP and BP‐FFPE indices were calculated as previously described. 6 , 9 , 25 , 26 Negative including 0 and positive MP indices correspond to high and low risk, respectively. Of the 5022 available FFPE samples, basal subtype had the lowest mean MP index, followed by HER2, luminal B, and luminal A subtypes (Table S1). The distribution of the MP indices per BP subtype is depicted in Figure S1A.
To be able to detect biological differences between the UL/LR and UH/HR groups, we selected subsets of UL/LR and high 1/high 2 samples from the extreme ends of the MammaPrint low and high indices, respectively. For the LR group, the 100 luminal A samples with the least positive MP index were selected. For the UL risk group, the 100 luminal A samples with the most positive MP index were selected.
For the HR risk group, luminal B, HER2, and basal subtypes with the least negative MP index were selected, resulting in 70, 60, and 70 samples, respectively. For the UH group, the most negative MP indices were selected, resulting in 70 luminal B, 60 HER2, and 35 basal subtypes. In addition, 35 basal samples were randomly selected from samples between the minimum and maximum MP index of the MP UH HER2 and luminal B samples. The distributions, mean, maximum, and minimum of the MP indices of the LR, UL, HR, and UH risk groups are depicted in Figure S1B and Table S1. All MP indices of the UL samples (≥0.55) fell within the range of UL samples as reported in the literature (UL MP index ≥0.355). 14 , 15 The threshold for the high 2 group reported in Reference [16] was based on Fresh Frozen samples and it is translated to FFPE samples. Therefore, the UH group analyzed in this manuscript refers to the high 2 group previously described, based on the threshold for FFPE data (−0.57).
To test whether we could confirm the DGEA and GSEA results of the discovery data set on an independent sample set, we selected a test data set and repeated the DGEA and GSEA. These data were selected from samples archived at Agendia from 2019 until 2020, for which FFPE microarray full‐transcriptome microarray data were available. For the LR and UL groups, 50 samples were randomly selected in the same MP index range as the LR and UL risk groups of the discovery dataset. For the UH and HR test dataset, 44 luminal B, 44 HER2, and 44 basal type samples were randomly selected within the same MP index ranges per BP type as the first dataset. These sample sizes are sufficient since the majority of the differentially expressed genes detected in the discovery dataset had a large effect size (Cohen's d > 0.5) and power (>0.9) in the test dataset (Figure S2). The mean, maximum, minimum, and distributions of the MP indices of the LR, UL, HR, and UH groups in the test set are depicted in Figure S1C and Table S1. Data are not shared.
Data were analyzed using R software version R 3.6.3. Random selection was performed by use of the function sample() in R. For differential gene expression analysis, Limma version 3.42.2 27 was used. P‐values were adjusted for multiple testing according to Benjamini‐Hochberg (FDR). 28 For hierarchical clustering, the rpackage pheatmap version 1.0.12 was used with settings: Euclidean distance and ward linkage method. For Gene Set Enrichment, GSEA version 3.0 29 was used with a pre‐ranked file as input, based on the outcome of the Limma analysis. The hallmark‐related gene sets were described by Dhawan et al. 23 Within the HER2 BP subtype abundance of immune cell populations were determined using xCell 30 in the rpackage immunedeconv. 31 In this rpackage enrichment, scores of 36 cell types were determined. These cell types are listed in Figure S3. To compare UH to HR samples, a t‐test was performed and p‐values were FDR corrected. As with the gene expression analysis, the sample size of the test data set was sufficient to validate the results since the majority of the celltype abundances detected as significant in the discovery dataset had a large effect size (Cohen's d > 0.5) and power (>0.8) in the test dataset (Figure S4).
3. RESULTS
3.1. MP and BP genes reflect all 10 Hallmarks of cancer
In this study, we related the MP and BP genes to the 10 HoCs using CHAT. All 10 hallmarks were reflected in the MP and BP genes. The majority of MP and BP genes represent hallmarks including “sustaining proliferative signaling”, “genome instability and mutation”, “inducing angiogenesis”, and “evading growth suppressors” (Figure 1, Table S2). Five MP genes did not correlate to any of the 10 HoCs using CHAT or LION literature‐based discovery tools, namely MIR210HG, RUNDC1, SMIM5, MSANTD3, and TMEM74B. Therefore, we manually annotated these genes using PubMed. The microRNA MIR210HG was described in cancer‐related publications in which its function was related to cell proliferation and invasion in different solid tumors, and its expression was associated with poor prognosis and chemoresistance. 32 , 33 , 34 , 35 , 36 , 37 , 38 , 39 , 40 , 41 , 42 RUNDC1 was identified as a p53 inhibitor by a large‐scale RNA interference‐based screen, which implies oncogenic activity such as resisting cell death and replicative immortility. 43 SMIM5 has a possible antitumor role and associated to invasion and metastasis. 44 , 45 MSANTD3 was reported as part of the HTN3‐MSANTD3 gene fusion, a recurrent somatic rearrangement in Acinic cell carcinoma with prominent serous differentiation and an indolent clinical course. 46 Deletion of the TMEM74B gene was associated with poor survival in breast cancer in the The Cancer Genome Atlas (TCGA) database. 47 , 48 Both MSANTD3 and TMEM74B were associated to genome instability.
FIGURE 1.
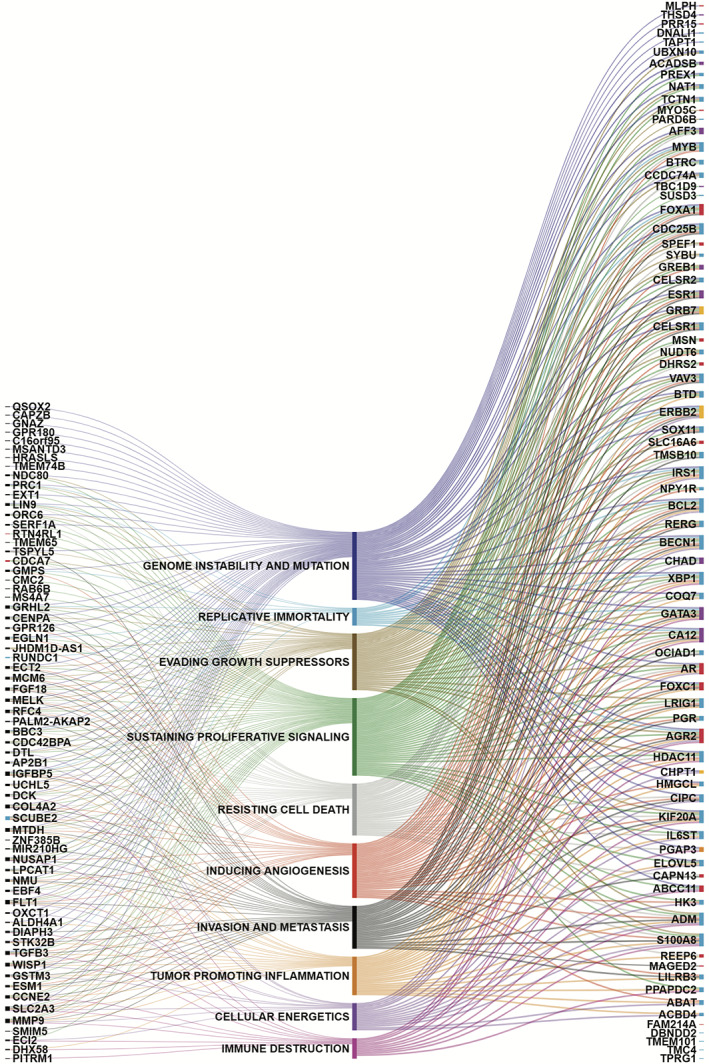
MammaPrint (MP) and BluePrint (BP) genes and their relation to the 10 hallmarks of cancer. Each line demonstrates a relation. On the left are the MP genes. Genes that are only in the MP signature are depicted in black, genes that are also in the BP signature are depicted in red and blue for basal and luminal type, respectively. On the right are the remaining BP genes that are not in the MP signature. Basal, luminal, and HER2 BP genes are depicted in red, blue, and yellow, respectively. Genes that occur in two BluePrint subtype gene sets are depicted in purple for luminal and basal and orange for basal and HER2
Three BP basal genes, SPEF1, FAM214A, and CAPN13, and 9 BP luminal genes, SYBU, DBNDD2, ACBD4, TMEM101, TMC4, UBXN10, RUNDC1, TPRG1, and CCDC74A, were not found to be associated using CHAT or LION literature‐based discovery tools. CAPN13 was reported to play a role in tumor progression and treatment response. 49 , 50 Furthermore, CAPN13 is involved in apoptosis and degradation of the extracellular matrix and therefore could be associated to resisting cell death and invasion and metastasis. DBNDD2 has a prognostic role in cervical cancer, 51 whereas TPRG1 is related to visceral metastasis. 52 For the remaining genes, no direct link to cancer was found in the literature. Based on the GeneCards and Gene Ontology databases, we found that three genes, SPEF1, SYBU, and CCDC74A, 53 , 54 , 55 , 56 , 57 code for proteins involved in the stabilization and binding of microtubules, which might play a role in chromosome alignment and cell division and therefore were associated to evading growth suppressors and resisting cell death. UBXN10 and CCDC74A are involved in ciliogenesis, inhibition of which has been described as an early event in breast cancer and promotes tumor progression and metastasis. 58 It is reported that ACBD4 promotes endoplasmic reticulum‐peroxisome associations and plays a possible role in lipid metabolism. 59 Moreover, a recent study showed that luminal A and TNBC cell lines have different lipid phenotypes, suggesting that different lipid metabolism might discriminate breast cancer subclasses. 60 This might explain the discriminative feature of ACBD4 as a luminal associated gene in the BP gene signature.
3.2. DGEA and GSEA reveal specific genes and pathways associated with the MP extreme subgroups
3.2.1. MP LR versus UL comparison identified 48 differentially expressed genes
To gain insight into the UL subgroup biology, we compared 100 UL to 100 LR samples in the discovery data set and validated the results in the test dataset containing 50 UL a 50 LR samples. From this analysis, 48 unique genes were identified as differentially expressed (Figure 2A,F, Table S3). Five of these genes overlap with the MP genes and five with the BP signature genes (of which four are luminal specific and 1 basal specific) (Table 1). Supervised hierarchical clustering of these 48 genes revealed two main clusters, one containing the majority of UL samples and the other cluster containing the LR samples (chi‐square p‐value <0.01) (Figure 3A). In the test dataset, 36 of these 48 genes had a p‐value <0.05 (Table S3).
FIGURE 2.
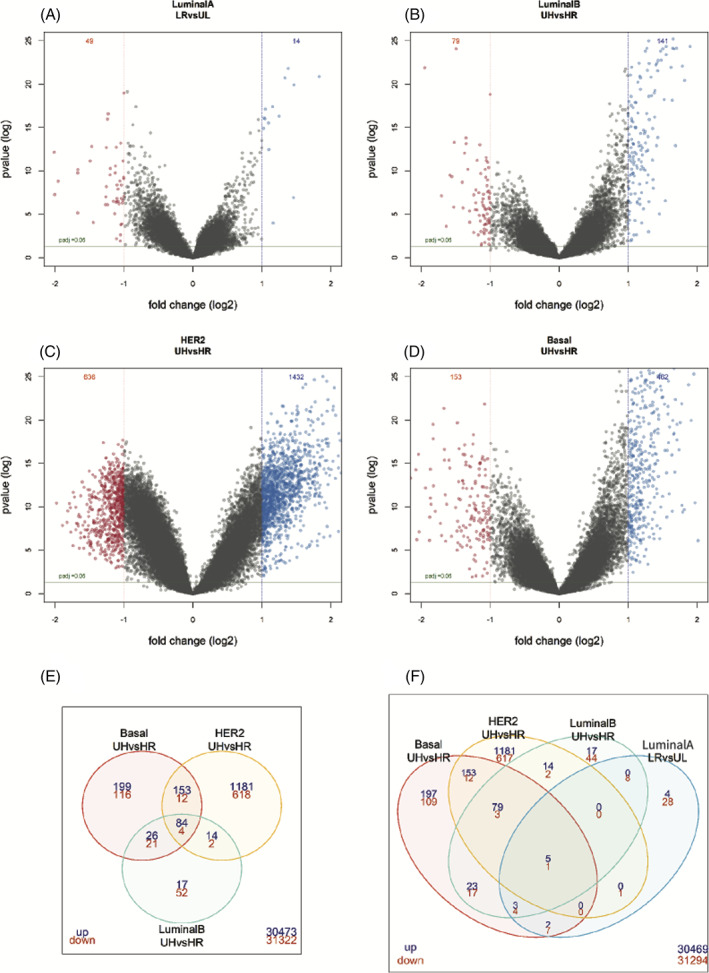
Differentially expressed genes in the MammaPrint and BluePrint extreme subgroups. Volcano plots of the LR versus UL group (A), the UH luminal B versus HR luminal B (B), UH HER2 versus HR HER2 (C) and UH basal versus HR basal (D). Venndiagrams report the intersect of the significantly upregulated (blue) and downregulated genes (red) (log2 fold change >2 and adjusted p‐value <0.05) of the UH subgroups (E) and UH/LR subgroups (F). HR, high risk; LR, low risk; UH, ultra high risk; UL, ultra low risk
TABLE 1.
Table of significantly expressed genes that overlap with the MammaPrint (MP) and BluePrint (BP) signature genes
| Ggenes signature | Overlapping gene | |||
|---|---|---|---|---|
| LuminalA type LR vs UL | LuminalB type UH vs HR | Basal type UH vs HR | HER2 type UH vs HR | |
| MP | MELK MMP9 SCUBE2 STK32B ZNF385B | CCNE2 CDCA7 CENPA MELK NDC80 ORC6 PRC1 SCUBE2 STK32B ZNF385B | CCNE2 CDCA7 CENPA DIAPH3 DTL ECT2 GMPS GPR180 GSTM3 HRASLS MELK NDC80 NUSAP1 ORC6 PRC1 SCUBE2 | AKAP2 CDCA7 CENPA DIAPH3 EGLN1 FLT1 GMPS GPR126 GPR180 GSTM3 GUSBP3 LPCAT1 MELK MTDH NDC80 ORC6 PRC1 RAB6B SCUBE2 |
| BP basal | AR | CDCA7 CHAD | ABCC1 AR CAPN13 CDCA7 DHRS2 FOXA1 FOXC1 MLPH REEP6 | CDCA7 SLC16A6 |
| BP HER2 | CHPT1 | CHPT1 | ||
| BP luminal | NAT1 PGR SCUBE2 VAV3 | KIF20A SCUBE2 CHAD NAT1 TPRG1 | KIF20A SCUBE2 | KIF20A SCUBE2 PPAPDC2 S100A8 SOX11 VAV3 |
FIGURE 3.
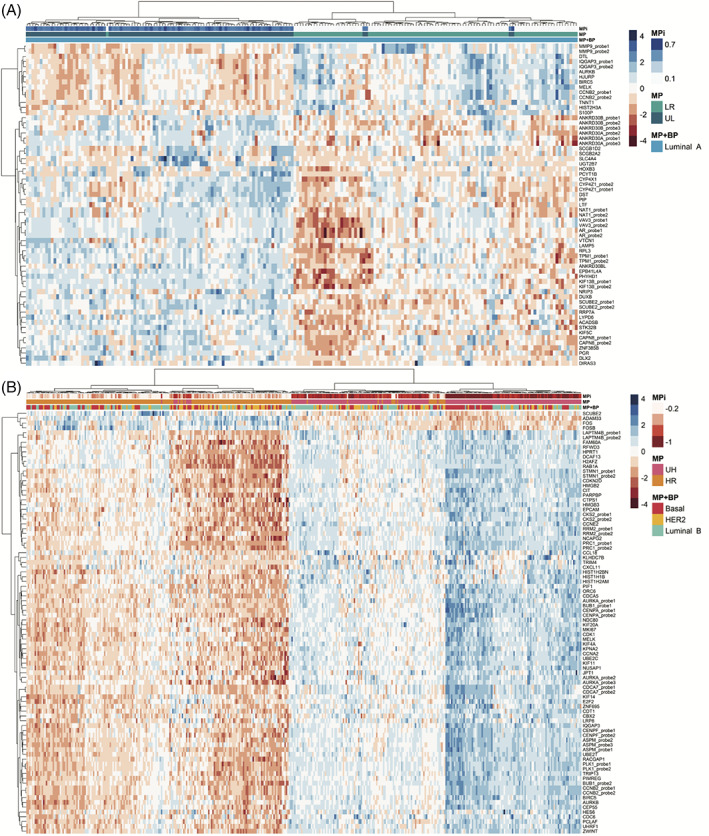
Heatmap of supervised hierarchical clustering of significantly expressed gene probes (log2 fold change >2 and adjusted p‐value <0.05) in the LR versus UL group (A) and the intersect probes of the UH versus HR BP subgroups (B). Samples are shown on the x‐axis and probes on the y‐axis. MammaPrint (MP) and BluePrint (BP) subtypes are defined by color coding as follows, red = basal‐type, yellow = HER2‐type, blue = luminal A‐type, green = luminal B‐type. MPi = MammaPrint index, UR = Ultra High risk (pink), HR = high risk (orange), LR = low risk (green), UL = ultra Low risk (blue). In the heatmap, high expression is depicted in blue, low expression is depicted in red
3.2.2. MP UH versus HR comparison identified 73 differentially expressed genes
To investigate the UH subgroup biology, we compared UH samples to HR samples per BP type in the discovery data set (Figure S1B) and validated these results in the test dataset (44 samples for each basal, luminal and HER2 MP HR, and MP UH samples). The number of significantly differentially expressed probes between UH and HR luminal B, basal and HER2 types are depicted in Figure 2B–D, and F. We detected 73 unique genes, that were differentially expressed among all BP subtype comparisons. Supervised hierarchical clustering of these 73 shared differentially expressed genes revealed two main clusters, one containing the majority of HR samples and the other containing the majority of UH samples (chi‐square test p‐value <0.01) (Figure 3B). There was no significant difference for BP subtype by comparing these two main clusters.
In the test dataset, 69 of these 73 genes were significant in at least one BP subtype in the test data set (Table S4).
Six probes mapping to five genes, CCNB2, AURKB, MELK, SCUBE2, and IQGAP3, were significantly differentially expressed in all the MP extreme group comparisons (Figure 2F and 4). Boxplots of these differentially expressed genes common among all comparisons are depicted in Figure 4. CCNB2 is a cell cycle gene and has been related to poor prognosis in breast cancer. 61 AURKB regulates the alignment and segregation of chromosomes during mitosis and meiosis by binding to microtubule and has been described to be related to poor overall survival. 62 MELK and SCUBE2 are among the MP 70‐gene list and related to 6 and 7 HoCs, respectively (Figure 1A). MELK is overexpressed in several cancer types, including lung, cervical, colorectal, and breast cancer and is described as a possible therapeutic target. 63 , 64 , 65 Recently, it was shown that MELK protein is higher expressed in p53‐mutant breast cancer cells in comparison to p53 wild‐type. 66 Moreover, several studies described MELK to be essential for cancer proliferation, but this role is controversial. 67 A recent study shows that inhibition of MELK delays but does not inhibit, mitotic entry, 68 which might explain this controversial role. The tumor suppressor gene SCUBE2 has been described to suppress invasiveness by promoting epithelial differentiation and playing a key role in mesenchymal‐epithelial transition (MET); hence SCUBE2 has been shown to be inactivated by DNA hypermethylation during TGF‐β‐induced epithelial‐mesenchymal transition (EMT). 69 Furthermore, SCUBE2 expression is significantly associated to prognosis in TNBC. 70 IQGAP3 is described as a key regulator of cell proliferation and metastasis during breast cancer progression 71 and promotes EMT and metastasis by activating TGF‐β signaling in hepatocellular carcinoma. 72
FIGURE 4.
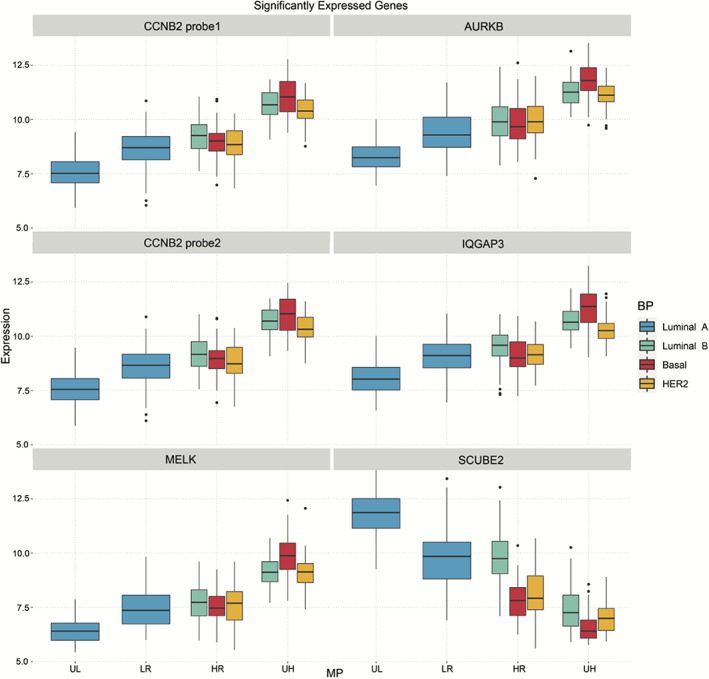
Boxplots of six intersect gene probes (five unique genes) of all four UL/HR/UL/LR comparisons. HR, high risk; LR, low risk; UH, ultra high risk; UL, ultra‐low risk, . MammaPrint (MP) and BluePrint (BP) subtypes are defined by color coding as follows, blue = luminal A‐type, green = luminal B‐type, red = basal‐type, yellow = HER2‐type
3.2.3. GSEA reveals specific dysregulated pathways in MP UH subgroups
To relate the UH and UL gene expression patterns to the 10 HoCs, we performed GSEA on the discovery dataset. The Normalized Enrichment Scores (NES) of the gene sets with FDR < 0.05 are depicted in Figure 5A. To validate these results, we selected a test dataset of 363 samples (44 samples for each basal, luminal and HER2 MP HR, and MP UH samples and 50 samples for each luminal A MP LR and MP UL samples) and repeated the analysis (Figure S1C). The NES scores of the gene sets with FDR < 0.05 for the test dataset are depicted in Figure 5B. Seven gene sets, corresponding to nine HoCs, were upregulated in the UH luminal B, basal, and HER2 subgroups, of which six HoCs could be confirmed in the test dataset, including G2/M checkpoint, proliferation, oxidative phosphorylation, immune invasion, hypoxia, and DNA repair. Upregulation of PI3K/AKT/mTOR signaling pathway could be confirmed in the UH luminal B and HER2 group. Four of the UH upregulated gene sets were downregulated in the UL group in the discovery dataset, and seven were downregulated in the UL group of the test dataset (Figure 5A, B). This is in line with the UH results, because gene sets upregulated in the more aggressive UH group are expected to be downregulated in the indolent UL group.
FIGURE 5.
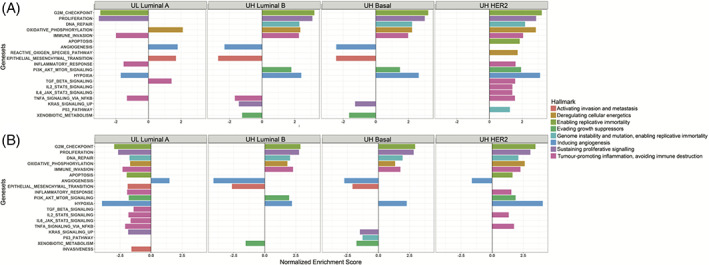
Up‐ and downregulated cancer hallmarks related pathways in MammaPrint UL and UH risk tumors. Normalized enrichment scores of pathways FDR < 0.05 in the discovery set are depicted in (A) the discovery dataset, in (B) the test dataset. Enrichments scores for pathways with FDR > 0.05 are not shown. Normalized enrichment scores are shown on the x‐axis and pathways on the y‐axis. UH, ultra high risk; UL, ultra‐low risk
Four gene sets were downregulated in the UH basal and luminal B subgroups, but not in the UH HER2 subgroup. Three of these four gene sets could be confirmed in the test dataset, namely angiogenesis, EMT, and xenobiotic metabolism. The angiogenesis gene set was also found to be upregulated in the UL group in comparison to the LR group in the discovery and test datasets, but the EMT gene set, which enables invasion and metastasis, was upregulated in the UL group in the discovery dataset and downregulated in the test dataset (Figure 5A, B). After literature‐based manual curation of the significantly DEGs (adjusted p‐value <0.01) in the EMT gene set in UL and UH subgroups, a large proportion of these genes were tumor suppressor genes and inhibitors of the EMT pathway, which may provide rationale for the up‐ and downregulation of this pathway in the UL and UH groups, respectively.
Notably, the UH HER2 subgroup was enriched in several immune signaling pathways, including TNFα signaling via NFκB, IL6/JAK/STAT3 signaling, IL2/STAT5 signaling, TGFβ signaling, and inflammatory response. In addition, UH HER2 was enriched for apoptosis and P53 pathways (Figure 5A). Of the immune‐related signaling pathways in UH HER2 IL2/STAT5 signaling, TNFα signaling via NFκB and inflammatory response could be confirmed in the dataset. To test whether these findings of immune related pathways in the UH HER2 subgroup were related to specific immune cell populations, we characterized immune cell enrichment scores of 36 cell types in this subgroup by use of the xCell tool in the discovery and test dataset (Figure S3). In the discovery dataset 16 and 5 types had significantly higher and lower abundances, respectively, in the HER2 UH subgroup compared to the HR HER2 subgroup (adjusted p‐value <0.05), 10 of which also had significantly higher abundances in the UH subgroup in the test dataset (Myeloid dendritic cell activated, B cell, T cell CD4+ memory, T cell CD4+ [non‐regulatory], common lymphoid progenitor, macrophage, macrophage M1, B‐cell plasma, T‐cell gamma delta and T‐cell CD4+ Th2) and four had also lower abundances in the HER2 UH subgroup in the test dataset (T‐cell CD4+ central memory, common myeloid progenitor, Eosinophil, T‐cell NK).
4. DISCUSSION
The two main objectives of this study were (1) to update the functional annotation of the 70 MP 1 , 3 and 80 BP genes 6 with respect to the most recent 10 HoCs, 13 and (2) to investigate the biology of the MP extreme subgroups through global differential expression analysis.
We showed that the 70 MP gene signature corresponds to all 10 HoCs, indicating that the MP signature comprehensively captures the 10 biological capabilities acquired during the multistep development of human tumors, as defined by Hanahan and Weinberg, 13 which extends beyond tumor proliferation genes, as already demonstrated. 11 Previously, we reported that 16 genes were not related to any of the six HoCs. However, based on the latest 10 HoC annotation, we found 14 of these 16 genes were associated with at least one HoC, underscoring their biological relevance in, and the comprehensive nature of, the MP signature. The majority of these 14 genes were related to sustaining proliferative signaling (N = 9) and genome instability and mutation (N = 7) hallmarks, one of the two enabling hallmarks in the updated 10 HoCs. 13
Similar to the MP genes, we found that the basal and luminal BP gene signature captured all the HoCs, whereas the HER2 signature genes were associated with nine of 10 hallmarks, although the three different BP subtypes capture different molecular pathways. The HER2 signature may not cover all 10 hallmarks because of the limited number of genes (n = 4) that make up this signature. Of the 12 genes that did not correspond to any of the HoCs (N = 9 luminal, N = 3 basal), four were associated with tumor progression, and five were either microtubule‐associated genes or involved in metabolism and ciliogenesis. 53 , 54 , 55 , 56 , 57 , 59 , 73
As previously shown, 14 , 15 , 16 , 17 MP can identify extreme low‐ and high‐risk subgroups with differential clinical outcomes. However, previous studies have not elucidated the biological features that may explain differences in the prognosis and therapy responses of these tumors. Here, we assessed the global gene expression profiles of MP UL and UH samples by comparative DGEA between UL and LR, and between UH and HR tumor samples. Overall, these comparisons show that UL and UH tumors are biologically different from the LR and HR tumors, respectively. Moreover, UH tumors are more heterogeneous in contrast to UL, as shown by the greater diversity within the UH cluster in comparison to the UL cluster.
The UH tumors were characterized by the expression of genes highly enriched in pathways related to tumor‐promoting inflammation, inducing angiogenesis, sustaining proliferative signaling, and genome instability and mutation, all hallmarks that correspond to many genes in the MP gene profile. The genes specifically expressed in the UH group were also involved in pathways of replicative immortality, to which only 8 MP genes were related. The MP UL tumors enriched to the same pathways as the MP UH tumors but in opposite directions of regulation, as expected.
Although none of the BP HER2 signature genes were directly associated with immune‐related pathways by CHAT, the UH BP HER2 group was the only UH group specifically enriched in several immune‐related signaling pathways such as TGFβ signaling, IL2/STAT5 signaling, and TNFα signaling via NFκB through GSEA pathway analysis. Of note, in the test dataset, we observed only IL2/STAT5 signaling and TNFα signaling via NFκB to be upregulated in UH HER2. In the UL discovery and test datasets, TNFα signaling via NFκB signaling pathway was downregulated. Inflammatory responses play a pivotal role during tumor development, invasion, and metastasis 74 , 75 and consistent with our results, it was reported that HER2 overexpression induces activation of the NFκB pathway and sequentially activates IL1α and IL6, activating the proinflammatory IL6/STAT3 pathway. 76 , 77 In addition, clinically ER‐negative/HER2‐negative and HER2‐positive breast cancers show greater frequency of tumor‐infiltrated lymphocytes (TILs) than ER‐positive/HER2‐negative breast cancers. 78 Moreover, TILs and immune signatures are correlated with response and outcome for clinically HER2‐positive early breast cancer patients treated with (neo)adjuvant chemotherapy and trastuzumab. 79 , 80 , 81 Consequently, we could hypothesize that the genomic UH HER2 group might be enriched for TILs, and this group of patients might benefit from immunotherapy. By determining immune cell infiltration for the UH/HR HER2 subgroups, we could confirm that the UH HER2 subgroup has indeed higher abundances of several immune cell types, however, we could not confirm that these are related to more TILs, thus further research is needed.
Unexpectedly, the EMT pathway was downregulated in the UH BP basal and luminal groups in the discovery and test sets and upregulated in UL group in the discovery dataset. However, after manual functional curation of the significantly differentially expressed genes enriching to this pathway, we discovered that the large majority play a role in tumor suppression and inhibition of the EMT pathway. In addition, many of the downregulated EMT genes are also involved in the extracellular matrix pathway (ECM). The EMT pathway was not enriched in UH HER2 discovery or test sets. This finding, together with the fact that the UH HER2 group showed significant upregulation of many immune signaling pathways, may suggest different high‐risk biology of UH HER2 tumors compared to the UH luminal and basal groups.
Surprisingly, the angiogenesis gene set was downregulated in the UH groups, although hypoxia and PI3K/AKT/MTOR signaling gene sets, which reflect pathways that induce angiogenesis, were upregulated. The angiogenesis gene set contains a core signature of 43 overexpressed genes that were consistently upregulated in several cancer types compared to normal tissue. 82 By visually inspecting the expression of these genes (data not shown), the majority were upregulated in the HR groups compared to the UH group, while downregulated in the LR group compared to the UL group. Further research is needed and ongoing, to gain understanding of this observation.
High 2 tumors have been shown to have higher pCR rates than High 1 tumors in response to the combination of carboplatin and veliparib in the ISPY2 trial. 16 In a preliminary pathway analysis, high 2 tumors displayed higher expression of cell cycle genes and DNA damage response genes other than homologous recombination repair, compared to high 1 tumors. 16 , 83 In line with these findings, the current analysis showed that the DNA repair gene set was upregulated in all UH BP groups with respect to the HR BP groups. By annotating the DEGs of the DNA repair gene set using KEGG pathways, we identified “Pyrimidine metabolism”, “Nucleotide excision”, “DNA replication”, “RNA polymerase”, “Mismatch repair”, “Metabolic pathways”, and “Base excision repair” as significantly enriched pathways in all BP UH groups. This supports data reported by the ISPY2 investigators that high 2 tumors have higher expression of DNA repair genes, which do not belong to the homologous recombination DNA damage response pathway and are likely to be upregulated because the homologous repair pathways is deficient. This upregulation of more error‐prone pathways was observed in BRCA‐mutated tumors 84 , 85 and might explain the higher pCR rates to the combination of carboplatin and veliparib in the UH group.
Taken together, this exploratory study shows that the MP and BP signatures capture the expression of genes of which function is involved in at least one of the 10 HoCs described by Hanahan and Weinberg. 13 In addition, we demonstrate that MP extreme risk tumor samples have unique underlying biology, also captured by MP, when compared with tumors classified at nonextreme ends, and which is supported by reports elsewhere of differential clinical outcomes. Although these findings will need to be validated in additional datasets, this study sheds light on the precise tumor stratification by MammaPrint, which will enable refined treatment decisions for patients with early‐stage breast cancer.
CONFLICT OF INTEREST
JCH, RB, AE, YB, LM and AMG are employed by Agendia NV., WA is employed by Agendia Inc. AMG is named inventor on BluePrint patent. EL is Medical Advisor and Medical Consultant for Agendia. FPL has received honoraria from Agendia.
AUTHOR CONTRIBUTIONS
JCH, RB designed the research study, analyzed and interpreted the data, and wrote the manuscript; AE, YB, CJG analyzed and interpreted the data; EL, FPL, and WMA interpreted the data; LM designed and supervised the research study, interpreted the data, and wrote the manuscript; AMG designed and supervised the research study and interpreted the data.
Supporting information
Figure S1. Histogram demonstrating the number of samples per BP subtype of (A) the whole dataset, (B) the discovery dataset, and (C) the test dataset. MammaPrint and BluePrint subtypes are defines by color coding as follows, red= Basal‐type, yellow= HER2‐type, green=Luminal A‐type, blue=Luminal B‐type
Figure S2. Plot demonstrating power and effect size in the test dataset of the differentially expressed genes found in the discovery dataset. BluePrint subtypes are defined by color coding as follows, red= Basal‐type, yellow= HER2‐type, green=Luminal A‐type, blue=Luminal B‐type
Figure S3. Boxplots of immune cell abundance of the BP HER2‐type UH/HR comparison in the discovery (left) and test (right) dataset. MammaPrint (MP) subtypes are defined by HR= High risk and UH= Ultra High risk, color coding as follows, orange=HR and pink=UH; On the right of the boxes: ns = adjusted p‐value > 0.05, ** = adjusted p‐value between 0.01 and 0.05, *** = adjusted p‐value between 0.001 and 0.01 and **** = adjusted p‐value < 0.001.
Figure S4. Plot demonstrating power and effect size in the HER2‐type test dataset of the significantly different cell type abundances of HER2 UH versus HER2 HR found in the discovery dataset. Each dot represents one cell type.
Table S1. Table of mean MP indices per MP and BP subgroup of the whole data set from which the discovery data set was selected, the discovery data set and the test data set. Between brackets are the minimum and maximum indices.
Table S2. Table of Hallmarks of Cancer and the relating MammaPrint and BluePrint signature genes.
Table S3. Table of 48 unique genes, adjusted p‐values and log2 fold changes in the discovery and test sets that were significantly differentially expressed between LR and UL in the discovery dataset.
Table S4. Table of 73 unique genes, adjusted p‐values and log2 fold changes in the discovery and test sets that were significantly differentially expressed between between UH and HR in the discovery set among Luminal B, HER2 and Basal BP subtype.
ACKNOWLEDGMENTS
We would like to thank Andrea Menicucci and Heather M. Kling for carefully reviewing the manuscript, Anou Geleijnse for her help with the immune cell infiltrating analysis, and Andrei Barcaru for the statistical input. This research did not receive any specific grant from funding agencies in the public, commercial, or not‐for‐profit sectors.
Haan JC, Bhaskaran R, Ellappalayam A, et al. MammaPrint and BluePrint comprehensively capture the cancer hallmarks in early‐stage breast cancer patients. Genes Chromosomes Cancer. 2022;61(3):148‐160. doi: 10.1002/gcc.23014
Contributor Information
Lorenza Mittempergher, Email: lorenza.mittempergher@agendia.com.
Annuska M. Glas, Email: annuska.glas@agendia.com.
DATA AVAILABILITY STATEMENT
Research data are not shared.
REFERENCES
- 1. van de Vijver MJ, He YD, van't Veer LJ, et al. A gene‐expression signature as a predictor of survival in breast cancer. N Engl J Med. 2002;347(25):1999‐2009. doi: 10.1056/nejmoa021967 [DOI] [PubMed] [Google Scholar]
- 2. Glas AM, Floore A, Delahaye LJMJ, et al. Converting a breast cancer microarray signature into a high‐throughput diagnostic test. BMC Genomics. 2006;7:1‐10. doi: 10.1186/1471-2164-7-278 [DOI] [PMC free article] [PubMed] [Google Scholar]
- 3. van't Veer LJ, Dai H, Van de Vijver MJ, et al. Gene expression profiling predicts clinical outcome of breast cancer. Nature. 2002;415(6871):530‐536. doi: 10.1038/415530a [DOI] [PubMed] [Google Scholar]
- 4. Cardoso F, van't Veer LJ, Bogaerts J, et al. 70‐gene signature as an aid to treatment decisions in early‐stage breast cancer. N Engl J Med. 2016;375(8):717‐729. doi: 10.1056/nejmoa1602253 [DOI] [PubMed] [Google Scholar]
- 5. Piccart M, van't Veer LJ, Poncet C, et al. 70‐gene signature as an aid for treatment decisions in early breast cancer: updated results of the phase 3 randomised MINDACT trial with an exploratory analysis by age. Lancet Oncol. 2021;22:476‐488. doi: 10.1016/S1470-2045(21)00007-3 [DOI] [PubMed] [Google Scholar]
- 6. Krijgsman O, Roepman P, Zwart W, et al. A diagnostic gene profile for molecular subtyping of breast cancer associated with treatment response. Breast Cancer Res Treat. 2012;133(1):37‐47. doi: 10.1007/s10549-011-1683-z [DOI] [PubMed] [Google Scholar]
- 7. Whitworth P, Stork‐Sloots L, de Snoo FA, et al. Chemosensitivity predicted by BluePrint 80‐gene functional subtype and MammaPrint in the prospective Neoadjuvant breast registry symphony trial (NBRST). Ann Surg Oncol. 2014;21(10):3261‐3267. doi: 10.1245/s10434-014-3908-y [DOI] [PMC free article] [PubMed] [Google Scholar]
- 8. Whitworth P, Beitsch P, Mislowsky A, et al. Chemosensitivity and endocrine sensitivity in clinical luminal breast cancer patients in the prospective Neoadjuvant breast registry symphony trial (NBRST) predicted by molecular subtyping. Ann Surg Oncol. 2017;24(3):669‐675. doi: 10.1245/s10434-016-5600-x [DOI] [PMC free article] [PubMed] [Google Scholar]
- 9. Mittempergher L, Delahaye LJ, Witteveen AT, et al. Performance characteristics of the BluePrint® breast cancer diagnostic test. Transl Oncol. 2020;13(4):100756. doi: 10.1016/j.tranon.2020.100756 [DOI] [PMC free article] [PubMed] [Google Scholar]
- 10. Beitsch P, Whitworth P, Baron P, et al. Pertuzumab/trastuzumab/CT versus trastuzumab/CT therapy for HER2+ breast cancer: results from the prospective neoadjuvant breast registry symphony trial (NBRST). Ann Surg Oncol. 2017;24(9):2539‐2546. doi: 10.1245/s10434-017-5863-x [DOI] [PubMed] [Google Scholar]
- 11. Tian S, Roepman P, van't Veer LJ, Bernards R, de Snoo F, Glas AM. Biological functions of the genes in the mammaprint breast cancer profile reflect the hallmarks of cancer. Biomark Insights. 2010;5:129‐138. doi: 10.4137/BMI.S6184 [DOI] [PMC free article] [PubMed] [Google Scholar]
- 12. Hanahan D, Weinberg RA. The hallmarks of cancer. Cell. 2000;100:57‐70. doi: 10.1016/S0092-8674(00)81683-9 [DOI] [PubMed] [Google Scholar]
- 13. Hanahan D, Weinberg RA. Hallmarks of cancer: the next generation. Cell. 2011;144:646‐674. doi: 10.1016/j.cell.2011.02.013 [DOI] [PubMed] [Google Scholar]
- 14. Esserman LJ, Yau C, Thompson CK, et al. Use of molecular tools to identify patients with indolent breast cancers with ultralow risk over 2 decades. JAMA Oncol. 2017;3(11):1503‐1510. doi: 10.1001/jamaoncol.2017.1261 [DOI] [PMC free article] [PubMed] [Google Scholar]
- 15. Delahaye LJMJ, Drukker CA, Dreezen C, et al. A breast cancer gene signature for indolent disease. Breast Cancer Res Treat. 2017;164:461‐466. doi: 10.1007/s10549-017-4262-0 [DOI] [PMC free article] [PubMed] [Google Scholar]
- 16. Wolf DM, Yau C, Sanil A, et al. DNA repair deficiency biomarkers and the 70‐gene ultra‐high risk signature as predictors of veliparib/carboplatin response in the I‐SPY 2 breast cancer trial. Npj Breast Cancer. 2017;3(1):1‐8. doi: 10.1038/s41523-017-0025-7 [DOI] [PMC free article] [PubMed] [Google Scholar]
- 17. Yau C, Wolf D, Brown‐Swigart L et al. Abstract PD6‐14: analysis of DNA repair deficiency biomarkers as predictors of response to the PD1 inhibitor pembrolizumab: results from the neoadjuvant I‐SPY 2 trial for stage II‐III high‐risk breast cancer. Cancer Res. 2018;78(4 Supplement):PD6‐14. doi: 10.1158/1538‐7445.SABCS17‐PD6‐14
- 18. Kent WJ. BLAT ‐ the BLAST‐like alignment tool. Genome Res. 2002;12:656‐664. doi: 10.1101/gr.229202 [DOI] [PMC free article] [PubMed] [Google Scholar]
- 19. Kent WJ, Sugnet CW, Furey TS, et al. The human genome browser at UCSC. Genome Res. 2002;12:996‐1006. doi: 10.1101/gr.229102 [DOI] [PMC free article] [PubMed] [Google Scholar]
- 20. Frankish A, Diekhans M, Ferreira AM, et al. GENCODE reference annotation for the human and mouse genomes. Nucleic Acids Res. 2019;47:D766‐D773. doi: 10.1093/nar/gky955 [DOI] [PMC free article] [PubMed] [Google Scholar]
- 21. Baker S, Ali I, Silins I, et al. Cancer hallmarks analytics tool (CHAT): a text mining approach to organize and evaluate scientific literature on cancer. Bioinformatics. 2017;33:3973‐3981. doi: 10.1093/bioinformatics/btx454 [DOI] [PMC free article] [PubMed] [Google Scholar]
- 22. Pyysalo S, Baker S, Ali I, et al. LION LBD: a literature‐based discovery system for cancer biology. Bioinformatics. 2019;35:1553‐1561. doi: 10.1093/bioinformatics/bty845 [DOI] [PMC free article] [PubMed] [Google Scholar]
- 23. Dhawan A, Scott JG, Harris AL, Buffa FM. Pan‐cancer characterisation of microRNA across cancer hallmarks reveals microRNA‐mediated downregulation of tumour suppressors. Nat Commun. 2018;9:5228. doi: 10.1038/s41467-018-07657-1 [DOI] [PMC free article] [PubMed] [Google Scholar]
- 24. Groenendijk FH, Treece T, Yoder E, et al. Estrogen receptor variants in ER‐positive basal‐type breast cancers responding to therapy like ER‐negative breast cancers. Npj Breast Cancer. 2019;5(1):1‐8. doi: 10.1038/s41523-019-0109-7 [DOI] [PMC free article] [PubMed] [Google Scholar]
- 25. Sapino A, Roepman P, Linn SC, et al. MammaPrint molecular diagnostics on formalin‐fixed, paraffin‐embedded tissue. J Mol Diagnostics. 2014;16(2):190‐197. doi: 10.1016/j.jmoldx.2013.10.008 [DOI] [PubMed] [Google Scholar]
- 26. Beumer I, Witteveen A, Delahaye L, et al. Equivalence of MammaPrint array types in clinical trials and diagnostics. Breast Cancer Res Treat. 2016;156(2):279‐287. doi: 10.1007/s10549-016-3764-5 [DOI] [PMC free article] [PubMed] [Google Scholar]
- 27. Smith GK. Limma: linear models for microarray data. In: Gentleman R, Carey V, Dudoit S, Irizarry R, Huber W, eds. Bioinforma Comput Biol Solut using R Bioconductor. New York, NY: Springer; 2005:397‐420. [Google Scholar]
- 28. Benjamini Y, Hochberg Y. Controlling the false discovery rate: a practical and powerful approach to multiple testing. J R Stat Soc Ser B. 1995;57:289‐300. doi: 10.1111/j.2517-6161.1995.tb02031.x [DOI] [Google Scholar]
- 29. Subramanian A, Tamayo P, Mootha VK, et al. Gene set enrichment analysis: a knowledge‐based approach for interpreting genome‐wide expression profiles. Proc Natl Acad Sci U S A. 2005;102:15545‐15550. doi: 10.1073/pnas.0506580102 [DOI] [PMC free article] [PubMed] [Google Scholar]
- 30. Aran D, Hu Z, Butte AJ. xCell: digitally portraying the tissue cellular heterogeneity landscape. Genome Biol. 2017;18:220. doi: 10.1186/s13059-017-1349-1. [DOI] [PMC free article] [PubMed] [Google Scholar]
- 31. Sturm G, Finotello F, Petitprez F, et al. Comprehensive evaluation of transcriptome‐based cell‐type quantification methods for immuno‐oncology. Bioinformatics. 2019;35:i436‐i445. doi: 10.1093/bioinformatics/btz363 [DOI] [PMC free article] [PubMed] [Google Scholar]
- 32. Wang AH, Jin CH, Cui GY, et al. MIR210HG promotes cell proliferation and invasion by regulating miR‐503‐5p/TRAF4 axis in cervical cancer. Aging (Albany NY). 2020;12:3205‐3217. doi: 10.18632/aging.102799 [DOI] [PMC free article] [PubMed] [Google Scholar]
- 33. Ruan Z, Xu Z, Li Z, Lv Y. Integral analyses of survival‐related long non‐coding RNA MIR210HG and its prognostic role in colon cancer. Oncol Lett. 2019;18:1107‐1116. doi: 10.3892/ol.2019.10435 [DOI] [PMC free article] [PubMed] [Google Scholar]
- 34. Lin J, Zhang X, Xue C, et al. The long noncoding RNA landscape in hypoxic and inflammatory renal epithelial injury. Am J Physiol ‐ Ren Physiol. 2015;309:F901‐F913. doi: 10.1152/ajprenal.00290.2015 [DOI] [PMC free article] [PubMed] [Google Scholar]
- 35. Li XY, Zhou LY, Luo H, et al. The long noncoding RNA MIR210HG promotes tumor metastasis by acting as a ceRNA of miR‐1226‐3p to regulate mucin‐1c expression in invasive breast cancer. Aging (Albany NY). 2019;11:5646‐5665. doi: 10.18632/aging.102149 [DOI] [PMC free article] [PubMed] [Google Scholar]
- 36. Kang X, Kong F, Huang K, et al. LncRNA MIR210HG promotes proliferation and invasion of non‐small cell lung cancer by upregulating methylation of CACNA2D2 promoter via binding to DNMT1. Onco Targets Ther. 2019;12:3779‐3790. doi: 10.2147/OTT.S189468 [DOI] [PMC free article] [PubMed] [Google Scholar]
- 37. Wang Y, Li W, Chen X, Li Y, Wen P, Xu F. MIR210HG predicts poor prognosis and functions as an oncogenic lncRNA in hepatocellular carcinoma. Biomed Pharmacother. 2019;111:1297‐1301. doi: 10.1016/j.biopha.2018.12.134 [DOI] [PubMed] [Google Scholar]
- 38. He Z, Dang J, Song A, Cui X, Ma Z, Zhang Z. Identification of LINC01234 and MIR210HG as novel prognostic signature for colorectal adenocarcinoma. J Cell Physiol. 2019;234:6769‐6777. doi: 10.1002/jcp.27424 [DOI] [PubMed] [Google Scholar]
- 39. Li D, Qian X, Xu P, et al. Identification of lncRNAs and their functional network associated with Chemoresistance in SW1990/GZ pancreatic cancer cells by RNA sequencing. DNA Cell Biol. 2018;37:839‐849. doi: 10.1089/dna.2018.4312 [DOI] [PubMed] [Google Scholar]
- 40. Li J, Wu QM, Wang XQ, Zhang CQ. Long noncoding RNA miR210HG sponges miR‐503 to facilitate osteosarcoma cell invasion and metastasis. DNA Cell Biol. 2017;36:1117‐1125. doi: 10.1089/dna.2017.3888 [DOI] [PubMed] [Google Scholar]
- 41. Min W, Dai D, Wang J, et al. Long noncoding RNA miR210HG as a potential biomarker for the diagnosis of glioma. PLoS One. 2016;11:e0160451. doi: 10.1371/journal.pone.0160451 [DOI] [PMC free article] [PubMed] [Google Scholar]
- 42. Voellenkle C, Garcia‐Manteiga JM, Pedrotti S, et al. Implication of long noncoding RNAs in the endothelial cell response to hypoxia revealed by RNA‐sequencing. Sci Rep. 2016;6:24141. doi: 10.1038/srep24141. [DOI] [PMC free article] [PubMed] [Google Scholar]
- 43. Llanos S, Efeyan A, Monsech J, Dominguez O, Serrano M. A high‐throughput loss‐of‐function screening identifies novel p53 regulators. Cell Cycle. 2006;5:1880‐1885. doi: 10.4161/cc.5.16.3140 [DOI] [PubMed] [Google Scholar]
- 44. Zhang X, Feng H, Li Z, et al. Application of weighted gene co‐expression network analysis to identify key modules and hub genes in oral squamous cell carcinoma tumorigenesis. Onco Targets Ther. 2018;11:6001‐6021. doi: 10.2147/OTT.S171791 [DOI] [PMC free article] [PubMed] [Google Scholar]
- 45. Zodro E, Jaroszewski M, Ida A, et al. FUT11 as a potential biomarker of clear cell renal cell carcinoma progression based on meta‐analysis of gene expression data. Tumor Biol. 2014;35:2607‐2617. doi: 10.1007/s13277-013-1344-4 [DOI] [PMC free article] [PubMed] [Google Scholar]
- 46. Andreasen S, Varma S, Barasch N, et al. The HTN3‐MSANTD3 fusion gene defines a subset of acinic cell carcinoma of the salivary gland. Am J Surg Pathol. 2019;43:489‐496. doi: 10.1097/PAS.0000000000001200 [DOI] [PMC free article] [PubMed] [Google Scholar]
- 47. Koboldt D, Fulton RS, McLellan MD, et al. Comprehensive molecular portraits of human breast tumours. Nature. 2012;490(7418):61‐70. doi: 10.1038/nature11412 [DOI] [PMC free article] [PubMed] [Google Scholar]
- 48. Fatima A, Tariq F, Malik MFA, Qasim M, Haq F. Copy number profiling of MammaPrint™ genes reveals association with the prognosis of breast cancer patients. J Breast Cancer. 2017;20:246‐253. doi: 10.4048/jbc.2017.20.3.246 [DOI] [PMC free article] [PubMed] [Google Scholar]
- 49. Storr SJ, Zhang S, Perren T, et al. The calpain system is associated with survival of breast cancer patients with large but operable inflammatory and noninflammatory tumours treated with neoadjuvant chemotherapy. Oncotarget. 2016;7:47927‐47937. doi: 10.18632/oncotarget.10066 [DOI] [PMC free article] [PubMed] [Google Scholar]
- 50. Storr SJ, Thompson N, Pu X, Zhang Y, Martin SG. Calpain in breast cancer: role in disease progression and treatment response. Pathobiology. 2015;82:133‐141. doi: 10.1159/000430464 [DOI] [PubMed] [Google Scholar]
- 51. Wu WJ, Shen Y, Sui J, et al. Integrated analysis of long non‐coding RNA competing interactions revealed potential biomarkers in cervical cancer: based on a public database. Mol Med Rep. 2018;17:7845‐7858. doi: 10.3892/mmr.2018.8846 [DOI] [PubMed] [Google Scholar]
- 52. Savci‐Heijink CD, Halfwerk H, Koster J, Horlings HM, Van De Vijver MJ. A specific gene expression signature for visceral organ metastasis in breast cancer. BMC Cancer. 2019;19:333. doi: 10.1186/s12885-019-5554-z [DOI] [PMC free article] [PubMed] [Google Scholar]
- 53. Zheng J, Liu H, Zhu L, et al. Microtubule‐bundling protein Spef1 enables mammalian ciliary central apparatus formation. J Mol Cell Biol. 2019;11:67‐77. doi: 10.1093/jmcb/mjy014 [DOI] [PubMed] [Google Scholar]
- 54. Kim SK, Zhang S, Werner ME, et al. CLA MP/Spef1 regulates planar cell polarity signaling and asymmetric microtubule accumulation in the Xenopus ciliated epithelia. J Cell Biol. 2018;217:1633‐1641. doi: 10.1083/jcb.201706058 [DOI] [PMC free article] [PubMed] [Google Scholar]
- 55. Xu J, Wang N, Luo JH, Xia J. Syntabulin regulates the trafficking of PICK1‐containing vesicles in neurons. Sci Rep. 2016;6:20924. doi: 10.1038/srep20924. [DOI] [PMC free article] [PubMed] [Google Scholar]
- 56. Ying Y, Li L, Cao W, et al. The microtubule associated protein syntabulin is required for glucose‐stimulated and cAMP‐potentiated insulin secretion. FEBS Lett. 2012;586:3674‐3680. doi: 10.1016/j.febslet.2012.08.025 [DOI] [PubMed] [Google Scholar]
- 57. Zhou H, Zheng T, Wang T, et al. CCDC74A/B are K‐fiber crosslinkers required for chromosomal alignment. BMC Biol. 2019;17:73. doi: 10.1186/s12915-019-0694-9 [DOI] [PMC free article] [PubMed] [Google Scholar]
- 58. Hassounah NB, Nunez M, Fordyce C, et al. Inhibition of ciliogenesis promotes hedgehog signaling, tumorigenesis, and metastasis in breast cancer. Mol Cancer Res. 2017;15:1421‐1430. doi: 10.1158/1541-7786.MCR-17-0034 [DOI] [PMC free article] [PubMed] [Google Scholar]
- 59. Costello JL, Castro IG, Schrader TA, Islinger M, Schrader M. Peroxisomal ACBD4 interacts with VAPB and promotes ER‐peroxisome associations. Cell Cycle. 2017;16:1039‐1045. doi: 10.1080/15384101.2017.1314422 [DOI] [PMC free article] [PubMed] [Google Scholar]
- 60. Rizzo AM, Colombo I, Montorfano G, Zava S, Corsetto PA. Exogenous fatty acids modulate ER lipid composition and metabolism in breast cancer cells. Cell. 2021;10(1):175. doi: 10.3390/cells10010175. [DOI] [PMC free article] [PubMed] [Google Scholar]
- 61. Hong Z, Wang Q, Hong C, et al. Identification of seven cell cycle‐related genes with unfavorable prognosis and construction of their TF‐miRNA‐mRNA regulatory network in breast cancer. J Cancer. 2021;12:740‐753. doi: 10.7150/jca.48245 [DOI] [PMC free article] [PubMed] [Google Scholar]
- 62. Huang D, Huang Y, Huang Z, Weng J, Zhang S, Gu W. Relation of AURKB over‐expression to low survival rate in BCRA and reversine‐modulated aurora B kinase in breast cancer cell lines. Cancer Cell Int. 2019;19:166. doi: 10.1186/s12935-019-0885-z [DOI] [PMC free article] [PubMed] [Google Scholar]
- 63. Zhang Y, Zhou X, Li Y, et al. Inhibition of maternal embryonic leucine zipper kinase with OTSSP167 displays potent anti‐leukemic effects in chronic lymphocytic leukemia. Oncogene. 2018;37:5520‐5533. doi: 10.1038/s41388-018-0333-x [DOI] [PubMed] [Google Scholar]
- 64. Pitner MK, Taliaferro JM, Dalby KN, Bartholomeusz C. MELK: a potential novel therapeutic target for TNBC and other aggressive malignancies. Expert Opin Ther Targets. 2017;21:849‐859. doi: 10.1080/14728222.2017.1363183 [DOI] [PubMed] [Google Scholar]
- 65. Thangaraj K, Ponnusamy L, Natarajan SR, Manoharan R. MELK/MPK38 in cancer: from mechanistic aspects to therapeutic strategies. Drug Discov Today. 2020;25:2161‐2173. doi: 10.1016/j.drudis.2020.09.029 [DOI] [PubMed] [Google Scholar]
- 66. Bollu LR, Shepherd J, Zhao D, et al. Mutant P53 induces MELK expression by release of wild‐type P53‐dependent suppression of FOXM1. Npj Breast Cancer. 2020;6:2. doi: 10.1038/s41523-019-0143-5 [DOI] [PMC free article] [PubMed] [Google Scholar]
- 67. McDonald IM, Graves LM. Enigmatic MELK: the controversy surrounding its complex role in cancer. J Biol Chem. 2020;295:8195‐8203. doi: 10.1074/jbc.REV120.013433 [DOI] [PMC free article] [PubMed] [Google Scholar]
- 68. McDonald IM, Grant GD, East MP, et al. Mass spectrometry– based selectivity profiling identifies a highly selective inhibitor of the kinase MELK that delays mitotic entry in cancer cells. J Biol Chem. 2020;295:2359‐2374. doi: 10.1074/jbc.RA119.011083 [DOI] [PMC free article] [PubMed] [Google Scholar]
- 69. Lin YC, Lee YC, Li LH, Cheng CJ, Yang RB. Tumor suppressor SCUBE2 inhibits breast‐cancer cell migration and invasion through the reversal of epithelial‐mesenchymal transition. J Cell Sci. 2014;127:85‐100. doi: 10.1242/jcs.132779 [DOI] [PubMed] [Google Scholar]
- 70. Fei H, Chen S, Xu C. RNA‐sequencing and microarray data mining revealing: the aberrantly expressed mRNAs were related with a poor outcome in the triple negative breast cancer patients. Ann Transl Med. 2020;8:363. doi: 10.21037/atm.2020.02.51 [DOI] [PMC free article] [PubMed] [Google Scholar]
- 71. Hu G, Xu Y, Chen W, Wang J, Zhao C, Wang M. RNA interference of IQ motif containing gtpase‐activating protein 3 (IQGAP3) inhibits cell proliferation and invasion in breast carcinoma cells. Oncol Res. 2016;24:455‐461. doi: 10.3727/096504016X14685034103635 [DOI] [PMC free article] [PubMed] [Google Scholar]
- 72. Shi Y, Qin N, Zhou Q, et al. Role of IQGAP3 in metastasis and epithelial‐mesenchymal transition in human hepatocellular carcinoma. J Transl Med. 2017;15:176. doi: 10.1186/s12967-017-1275-8 [DOI] [PMC free article] [PubMed] [Google Scholar]
- 73. Raman M, Sergeev M, Garnaas M, et al. Systematic proteomics of the VCP‐UBXD adaptor network identifies a role for UBXN10 in regulating ciliogenesis. Nat Cell Biol. 2015;17:1356‐1369. doi: 10.1038/ncb3238 [DOI] [PMC free article] [PubMed] [Google Scholar]
- 74. Grivennikov SI, Greten FR, Karin M. Immunity, inflammation, and cancer. Cell. 2010;140:883‐899. doi: 10.1016/j.cell.2010.01.025 [DOI] [PMC free article] [PubMed] [Google Scholar]
- 75. Mantovani A, Allavena P, Sica A, Balkwill F. Cancer‐related inflammation. Nature. 2008;454:436‐444. doi: 10.1038/nature07205 [DOI] [PubMed] [Google Scholar]
- 76. Hartman ZC, Yang XY, Glass O, et al. HER2 overexpression elicits a proinflammatory IL‐6 autocrine signaling loop that is critical for tumorigenesis. Cancer Res. 2011;71:4380‐4391. doi: 10.1158/0008-5472.CAN-11-0308 [DOI] [PMC free article] [PubMed] [Google Scholar]
- 77. Liu S, Lee JS, Jie C, et al. HER2 overexpression triggers an IL1a proinflammatory circuit to drive tumorigenesis and promote chemotherapy resistance. Cancer Res. 2018;78:2040‐2051. doi: 10.1158/0008-5472.CAN-17-2761 [DOI] [PMC free article] [PubMed] [Google Scholar]
- 78. Loi S, Sirtaine N, Piette F, et al. Prognostic and predictive value of tumor‐infiltrating lymphocytes in a phase III randomized adjuvant breast cancer trial in node‐positive breast cancer comparing the addition of docetaxel to doxorubicin with doxorubicin‐based chemotherapy: BIG 02‐98. J Clin Oncol. 2013;31:860‐867. doi: 10.1200/JCO.2011.41.0902 [DOI] [PubMed] [Google Scholar]
- 79. Dieci MV, Conte P, Bisagni G, et al. Association of tumor‐infiltrating lymphocytes with distant disease‐free survival in the ShortHER randomized adjuvant trial for patients with early HER2+ breast cancer. Ann Oncol. 2019;30:418‐423. doi: 10.1093/annonc/mdz007 [DOI] [PMC free article] [PubMed] [Google Scholar]
- 80. Carbognin L, Pilotto S, Nortilli R, et al. Predictive and prognostic role of tumor‐infiltrating lymphocytes for early breast cancer according to disease subtypes: sensitivity analysis of randomized trials in adjuvant and Neoadjuvant setting. Oncologist. 2016;21:283‐291. doi: 10.1634/theoncologist.2015-0307 [DOI] [PMC free article] [PubMed] [Google Scholar]
- 81. Dieci MV, Prat A, Tagliafico E, et al. Integrated evaluation of PAM50 subtypes and immune modulation of pCR in HER2‐positive breast cancer patients treated with chemotherapy and HER2‐targeted agents in the CherLOB trial. Ann Oncol. 2016;27:1867‐1873. doi: 10.1093/annonc/mdw262 [DOI] [PubMed] [Google Scholar]
- 82. Han HD, Snell C, Peterkin T, et al. A Core human primary tumor angiogenesis signature identifies the endothelial orphan receptor ELTD1 as a key regulator of angiogenesis. 2013;24:229‐241. doi: 10.1016/j.ccr.2013.06.004 [DOI] [PMC free article] [PubMed] [Google Scholar]
- 83. Wolf DM, Yau C, Brown‐Swigart L et al. Abstract 859: gene and pathway differences between MammaPrint High1/High2 risk classes: results from the I‐SPY 2 TRIAL in breast cancer. 2016;76(14 Supplement):859. doi:10.1158/1538‐7445.am2016‐859
- 84. Bodily WR, Shirts BH, Walsh T, et al. Effects of germline and somatic events in candidate BRCA‐like genes on breast‐tumor signatures. PLoS One. 2020;15:e0239197. doi: 10.1371/journal.pone.0239197 [DOI] [PMC free article] [PubMed] [Google Scholar]
- 85. Annunziata CM, Bates SE. PARP inhibitors in BRCA1/BRCA2 germline mutation carriers with ovarian and breast cancer. F1000 Biol Rep. 2010;2:10. doi: 10.3410/B2-10. [DOI] [PMC free article] [PubMed] [Google Scholar]
Associated Data
This section collects any data citations, data availability statements, or supplementary materials included in this article.
Supplementary Materials
Figure S1. Histogram demonstrating the number of samples per BP subtype of (A) the whole dataset, (B) the discovery dataset, and (C) the test dataset. MammaPrint and BluePrint subtypes are defines by color coding as follows, red= Basal‐type, yellow= HER2‐type, green=Luminal A‐type, blue=Luminal B‐type
Figure S2. Plot demonstrating power and effect size in the test dataset of the differentially expressed genes found in the discovery dataset. BluePrint subtypes are defined by color coding as follows, red= Basal‐type, yellow= HER2‐type, green=Luminal A‐type, blue=Luminal B‐type
Figure S3. Boxplots of immune cell abundance of the BP HER2‐type UH/HR comparison in the discovery (left) and test (right) dataset. MammaPrint (MP) subtypes are defined by HR= High risk and UH= Ultra High risk, color coding as follows, orange=HR and pink=UH; On the right of the boxes: ns = adjusted p‐value > 0.05, ** = adjusted p‐value between 0.01 and 0.05, *** = adjusted p‐value between 0.001 and 0.01 and **** = adjusted p‐value < 0.001.
Figure S4. Plot demonstrating power and effect size in the HER2‐type test dataset of the significantly different cell type abundances of HER2 UH versus HER2 HR found in the discovery dataset. Each dot represents one cell type.
Table S1. Table of mean MP indices per MP and BP subgroup of the whole data set from which the discovery data set was selected, the discovery data set and the test data set. Between brackets are the minimum and maximum indices.
Table S2. Table of Hallmarks of Cancer and the relating MammaPrint and BluePrint signature genes.
Table S3. Table of 48 unique genes, adjusted p‐values and log2 fold changes in the discovery and test sets that were significantly differentially expressed between LR and UL in the discovery dataset.
Table S4. Table of 73 unique genes, adjusted p‐values and log2 fold changes in the discovery and test sets that were significantly differentially expressed between between UH and HR in the discovery set among Luminal B, HER2 and Basal BP subtype.
Data Availability Statement
Research data are not shared.