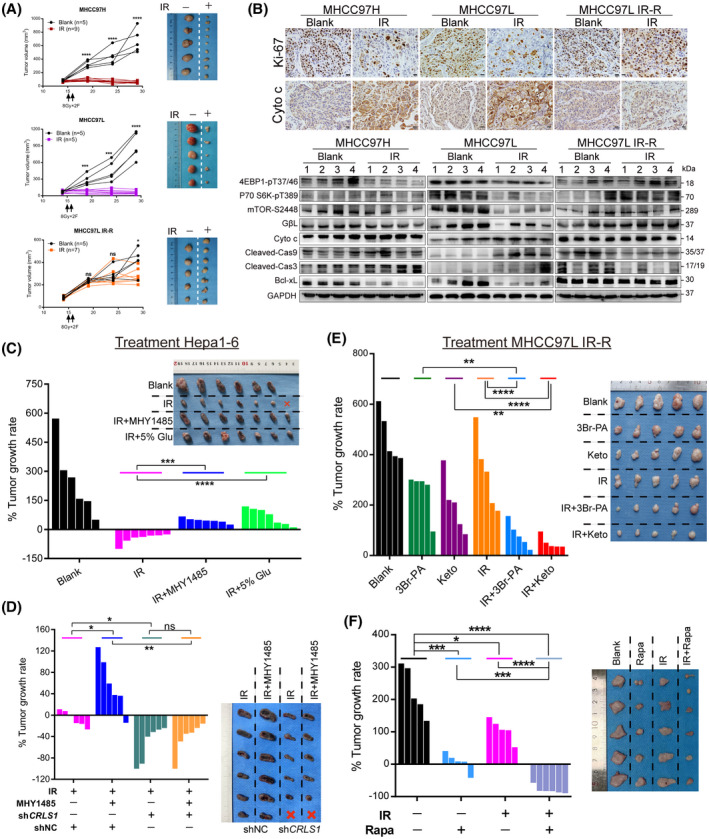
FIGURE 6.

mTORC1 activation–mediated glucose to CL anabolism determines radiation sensitivity in vivo. (A,B) Tumor growth curves, tumor images, representative immunohistochemical staining, and western blots of s.c. xenograft models in nude mice with indicated cells and treatments. (C) Response of Hepa1‐6 xenografts in C57 mice treated with control, IR (8 Gy × 3 F), IR with MHY1485 (5 mg/kg), or IR with high‐glucose drinking (5%). (D) Response of Hepa1‐6 short hairpin RNA control (shNC) and shCRLS1 xenografts in C57 mice treated with IR (8 Gy × 2 F) or IR with MHY1485 (5 mg/kg). (E) Effect of cutting off glucose flux on radiation responsiveness in s.c. implanted MHCC97L IR‐R nude mice subjected to treatments with control, 3Br‐PA (5 mg/kg), ketoconazole (20 mg/kg), IR (8 Gy × 2 F), IR with 3Br‐PA, or IR with ketoconazole. (F) Response of MHCC97L IR‐R xenografts to treatment with control, rapamycin (4 mg/kg), IR (8 Gy × 2 F), or combination. Waterfall plot showing the percentage of tumor growth rate per individual mouse and tumor images upon necropsy presented in (C–F). Data are represented as mean ± SEM. Scale bars, 20 μm. *p < 0.05, **p < 0.01, ***p < 0.001, ****p < 0.0001. Abbreviations: Cas3/9, caspase 3/9; GAPDH, glyceraldehyde 3‐phosphate dehydrogenase; Glu, glucose; Keto, ketoconazole; ns, not significant; Rapa, rapamycin [Color figure can be viewed at wileyonlinelibrary.com]
