

Abstract
Objective
Omega‐6 and omega‐3 oxylipins are known to play a role in inflammation and cardiometabolic diseases in preclinical models. The associations between plasma levels of omega‐6 and omega‐3 polyunsaturated fatty acid–derived oxylipins and body composition and cardiometabolic risk factors in young adults were assessed.
Methods
Body composition, brown adipose tissue, traditional serum cardiometabolic risk factors, inflammatory markers, and a panel of 83 oxylipins were analyzed in 133 young adults (age 22.1[SD 2.2] years, 67% women).
Results
Plasma levels of four omega‐6 oxylipins (15‐HeTrE, 5‐HETE, 14,15‐EpETrE, and the oxidative stress–derived 8,12‐iso‐iPF2α‐VI) correlated positively with adiposity, prevalence of metabolic syndrome, fatty liver index, and homeostatic model assessment of insulin resistance index and lipid parameters. By contrast, the plasma levels of three omega‐3 oxylipins (14,15‐DiHETE, 17,18‐DiHETE, and 19,20‐DiHDPA) were negatively correlated with adiposity, prevalence of metabolic syndrome, fatty liver index, homeostatic model assessment of insulin resistance index, and lipid parameters. The panel of seven oxylipins predicted adiposity better than traditional inflammatory markers such as interferon gamma or tumor necrosis factor‐alpha. Pathway analyses revealed that individuals with obesity had higher plasma levels of omega‐6 and lower plasma levels of omega‐3 oxylipins than normal‐weight individuals.
Conclusion
Plasma levels of seven omega‐6 and omega‐3 oxylipins may have utility as early markers of cardiometabolic risk in young adults.
Study Importance.
What is already known?
-
►
Omega‐6 and omega‐3 oxylipins are breakdown products of polyunsaturated fatty acids, which play a role in inflammation and cardiometabolic diseases. The fat‐1 transgenic mouse, which transforms omega‐6 into omega‐3 polyunsaturated fatty acids, is protected against cardiometabolic diseases and shows lower levels of omega‐6 oxylipins, including 15‐HeTrE, 5‐HETE, and 14,15‐EpETrE, and higher levels of omega‐3 oxylipins, including 14,15‐DiHETE, 17,18‐DiHETE, and 19,20‐DiHDPA.
What does this study add?
-
►
We show four omega‐6 oxylipins and three omega‐3 oxylipins strongly related to body composition and cardiometabolic risk factors in young adults. These seven oxylipins are better predictors of adiposity than traditional pro‐ and anti‐inflammatory markers and are identical to those previously described in the fat‐1 mice, suggesting a causal relationship. This set of oxylipins may be considered to diagnose cardiometabolic risk in young adults.
How might these results change the direction of research or the focus of clinical practice?
-
►
Plasma levels of seven omega‐6 and omega‐3 oxylipins may have utility as early markers of cardiometabolic risk in young adults.
INTRODUCTION
The global prevalence of obesity and cardiometabolic diseases has increased progressively in the past decades to reach pandemic proportions (1). A major risk factor for cardiometabolic diseases is the so‐called metabolic syndrome, which is defined as a constellation of metabolic disorders, including insulin resistance and impaired glucose tolerance, atherogenic dyslipidemia (high triglycerides [TG], total cholesterol [TC], and low‐density lipoprotein cholesterol [LDL‐C], and low high‐density lipoprotein cholesterol [HDL‐C]), and a proinflammatory state accompanied by excess visceral adipose tissue (VAT) mass (2).
Omega‐6– and omega‐3–derived lipid mediators have a prominent role in inflammation and cardiometabolic diseases as they possess pro‐ and anti‐inflammatory properties (3, 4). Omega‐6 and omega‐3 polyunsaturated fatty acids (PUFAs) are essential fatty acids (i.e., they should be obtained from the diet) because they cannot be synthesized endogenously in humans (5). Upon dietary ingestion, circulating omega‐6 and omega‐3 PUFAs are used by almost all tissues and are oxidized by several enzymatic steps involving cyclooxygenase, lipoxygenase, or cytochrome P450 enzymes (6). These enzymatic reactions facilitate the conversion of PUFAs to oxylipins and other bioactive lipids, which are major mediators of the pro‐ and anti‐inflammatory effects of PUFAs on human metabolism (6).
Curiously, circulating oxylipin levels might not necessarily mimic dietary PUFA intake, because oxylipin production depends on enzyme preference for specific PUFAs (6). Oxylipins are reported to be produced by various tissues, including white adipose tissue, liver, kidney, and ileum (6). Additionally, brown adipose tissue (BAT), a metabolically active thermogenic tissue present in adult humans (7, 8, 9), has been suggested to secrete omega‐6 (e.g., 5‐HETE, 5,6‐EpETrE, 12,13‐DiHOME) and omega‐3 (e.g., 12‐HEPE) oxylipins (10, 11, 12, 13).
Although omega‐6 oxylipins have proinflammatory, vasoconstrictor, and proliferative functions, all of which are involved in the progression of obesity and cardiometabolic diseases (6, 14), omega‐3 oxylipins have the opposite effects (6, 14). Notably, plasma levels of the omega‐6 oxylipins 9,10‐EpODE and 9,10‐EpOME are higher in women with type 2 diabetes than in nondiabetic peers (15). Likewise, plasma levels of omega‐6 (8,9‐DiHETrE) and omega‐3 (5‐HEPE and 10,11‐DiHDPE) oxylipins are higher in men with hyperlipidemia than in normolipidemic men (16). These studies support a relationship between omega‐6 oxylipins and cardiometabolic disorders; however, the relationship between both omega‐6 and ‐3 oxylipins and cardiometabolic risk factors in young, relatively healthy individuals has not yet been established.
Here we investigated the associations of plasma levels of omega‐6 and ‐3 PUFA–derived oxylipins with body composition and cardiometabolic risk factors in a well‐phenotyped cohort of young adults.
METHODS
See online Supporting Information for an extensive description of all methods.
Study design and participants
A total of 136 participants, including 91 women and 45 men (age 22.1 [SD 2.2] years), were included in the present study (ACTIBATE; ClinicalTrials.gov ID: NCT02365129) (17). The ACTIBATE study encompassed multiple evaluation waves involving groups of 16 to 24 individuals every 2 to 3 weeks in October, November, and December of 2015 and 2016. The study was approved by the Ethics Committee on Human Research of the University of Granada (n° 924) and the Servicio Andaluz de Salud and was in accordance with the principles of the latest version of the Declaration of Helsinki. Written informed consent was provided from all participants before their enrollment. Inclusion criteria were the following: (1) nonsmoking, (2) sedentary (i.e., <20 minutes of moderate‐to‐vigorous physical activity on <3 days per week), (3) no acute or chronic illness, (4) no medication that might interfere with the assessments, and (5) not pregnant. Participants were requested to be rested, to abstain from moderate‐to‐vigorous physical activity, to use bus or car transportation, to refrain from stimulants and/or alcohol on the days of the measurements, and to have not performed any moderate exercise in the previous 24 hours or vigorous exercise in the previous 48 hours. A total of 133 participants were included in the main analyses; 3 participants were excluded because of blood collection issues.
Anthropometric and body composition measurements
Body weight was measured to the nearest 0.1 kg and height to the nearest 0.1 cm, using a model 799 scale and a stadiometer, respectively (both from Seca), without shoes and with light clothing. BMI was calculated from weight and height (kilograms/meters squared). Waist circumference was measured at the minimum perimeter, at the end of a normal expiration, with the arms relaxed on both sides of the body. When the minimum perimeter could not be detected, measurements were taken just above the umbilicus, in a horizontal plane. Waist circumference was measured twice with a plastic tape measure; the two measures were averaged for further analyses.
Lean, fat, and VAT masses were measured by dual‐energy x‐ray absorptiometry using a Discovery Wi device (Hologic Inc.) equipped with analysis software (APEX version 4.0.2). Lean and fat mass indices were expressed as kilograms/meters squared; fat mass was also expressed as a percentage of body weight. Individuals were categorized according to their BMI as having normal weight (BMI <25.0 kg/m2), overweight (BMI ≥25.0 kg/m2 and <30.0 kg/m2), or obesity (BMI ≥30.0 kg/m2) (18).
Assessment of 18F‐fluorodeoxyglucose uptake by BAT
Briefly, the shivering threshold of each participant was determined following a personalized cooling protocol (19). Then 48 to 72 hours after the shivering threshold determination, participants were exposed to a 2‐hour personalized cooling procedure at 3.8°C above their individual shivering threshold. After 1 hour of cold exposure, a bolus of ~185 MBq of 18F‐fluorodeoxyglucose (18F‐FDG) was intravenously injected, and the water temperature was increased by 1°C. If participants reported shivering, the water temperature was further increased by 1°C. After 2 hours of cold exposure, a static positron emission tomography/computed tomography (PET/CT; Siemens Biograph 16 PET‐CT) scan was performed. CT acquisition was performed using a peak of 120 kV and PET acquisition with a scan time of 6 minutes per bed position. PET/CT images were obtained from the atlas (i.e., cervical vertebra 1) to approximately the midchest. BAT‐related outcomes were calculated as described (20, 21, 22).
Blood sample collection and determination of cardiometabolic risk factors
Blood was collected after an overnight (10 hours) fast, between 8:00 and 9:00 am, and at room temperature (20°C to 24°C). Blood was drawn from the antecubital vein and was immediately centrifuged to obtain serum (obtained with Vacutainer SST II Advance tubes, VWR International, LLC) and plasma (obtained with Vacutainer Hemogard tubes, containing the K2 potassium salt of ETDA as anticoagulant). Samples were aliquoted and stored at −80°C.
Traditional cardiometabolic risk factors and inflammatory markers were measured in serum (glucose, insulin, cortisol, TC, HDL‐C, TG, apolipoproteins A and B, glutamic pyruvic transaminase [GTP], gamma‐glutamyl transferase [GGT], alkaline phosphatase [ALP], C‐reactive protein, complement C3, complement C4, leptin, adiponectin, interleukin [IL]‐2, IL‐4, IL‐6, IL‐7, IL‐8, IL‐10, IL‐17a, interferon gamma [IFNɣ], and tumor necrosis factor‐alpha [TNFα]).
Metabolic syndrome prevalence was calculated following the National Cholesterol Education Program Adult Treatment Panel III (ATP III) (23) and International Diabetes Federation (IDF) classifications (24). Insulin sensitivity was estimated via the homeostatic model assessment of insulin resistance index (HOMA‐IR) (25), and the fatty liver index was determined as a proxy of hepatic steatosis (26).
Determination of plasma oxylipins
Oxylipins were determined by liquid chromatography‐tandem mass spectrometry (LC‐MS/MS) (27). The LC‐MS/MS protocol enabled the relative quantitation of 83 oxylipins from the conversion of the omega‐6 PUFAs linoleic acid (LA), dihomo‐γ‐linolenic acid (DGLA), and arachidonic acid (AA), as well as the omega‐3 PUFAs α‐linolenic acid (ALA), eicosapentaenoic acid (EPA), and docosahexaenoic acid (DHA). The oxylipins that can be detected by this method are listed in Supporting Information Table S1. Of the 50 oxylipins detected, 40 showed a low analytical variability with relative standard in quality control (QCRSD) ≤ 15%, and 10 showed a moderate variability between 15% < QCRSD ≤ 40% (Supporting Information Table S1).
Statistical analyses
The baseline characteristics and outcomes of the study participants were expressed as mean (SD). The normal distribution assumption was tested using the Shapiro–Wilk test, visual histograms, and Q–Q plots. Non‐normally distributed variables (traditional cardiometabolic and inflammatory markers and oxylipins) were log10‐transformed before further analysis. We performed all the analyses divided by men and women, and similar patterns were observed. Moreover, we studied whether significant interactions were presented between the plasma oxylipin levels and body composition and cardiometabolic risk parameters using linear regression models, and no sex interactions were observed (all p ≥ 0.05). Thus, data of men and women were analyzed together.
We conducted Pearson correlation analyses to examine the relationship between plasma levels of oxylipins and body composition and cardiometabolic risk parameters. All p values were corrected by the two‐stage step‐up procedure of Benjamini, Krieger, and Yekutieli for multiple comparisons by controlling the false discovery rate (FDR) (28). Plasma omega‐6 and omega‐3 oxylipins were both weakly correlated with PUFA, fish, and shellfish intake (data not shown). We therefore performed partial correlations of plasma levels of oxylipins with body composition and cardiometabolic risk parameters adjusting for dietary energy, PUFA, fish, and shellfish intake. Pearson correlation analyses were also carried out between plasma levels of oxylipins and traditional inflammatory parameters. As secondary analyses, we examined the relationship between body composition and cardiometabolic risk factors. All correlation analyses and plots were designed using the “corrplot” package in R software version 3.6.0 (R Foundation for Statistical Computing). Forward stepwise regression was performed using fat mass percentage and VAT mass as dependent outcomes in separate models. The measured oxylipins persisting after FDR correction (i.e., 15‐HETrE, 5‐HETE, 14,15‐EpETrE, 8,12‐iso‐iPF2α‐VI, 14,15‐DiHETE, 17,18‐DiHETE, and 19,20‐DiHDPA), together with the traditional cardiometabolic risk factors HOMA‐IR, GTP, GGT, ALP, TC, HDL‐C, TG, cortisol, adiponectin, and leptin, were introduced as predictors using a forward stepwise procedure, which introduces the predicting components step‐by‐step into the model (if p < 0.05) according to the strength of their association with the dependent outcome. We repeated the same analyses including plasma levels of oxylipins and traditional pro‐ and anti‐inflammatory markers as predictors of fat mass percentage and VAT mass. The forward stepwise regression was performed using the SPSS Statistics version 25.0 (IBM Corp.).
Differences in plasma levels of oxylipins across BMI categories (normal weight, overweight, and obesity) were assessed with metabolic pathway analyses using Cytoscape software version 3.7.0 (Cytoscape Consortium) (29). We calculated a fold change for each oxylipin as the ratio between the oxylipin level in individuals with obesity divided by the oxylipin level in normal‐weight individuals, as well as between obesity and overweight and between overweight and normal weight. Independent t test analyses were performed for between‐group comparisons. The level of significance was set at p < 0.05, using SPSS version 25.0.
RESULTS
The descriptive characteristics of the participants are presented in Table 1. A total of 50 of the 83 detectable PUFA‐derived omega‐6 (n = 30) and omega‐3 (n = 20) oxylipins, including their precursors, were detected in fasting plasma samples (Supporting Information Table S1). Baseline plasma levels of each oxylipin measured in the participants are listed in Supporting Information Table S2.
TABLE 1.
Characteristics of the participants
| n | Total | n | Men | n | Women | |
|---|---|---|---|---|---|---|
| Age (y) | 136 | 22.1 (2.2) | 45 | 22.3 (2.3) | 91 | 21.9 (2.2) |
| Body composition | ||||||
| BMI (kg/m2) | 136 | 24.9 (4.6) | 45 | 26.8 (5.5) | 91 | 23.9 (3.7) |
| Lean body mass (kg) | 136 | 41.8 (9.7) | 45 | 52.8 (7.2) | 91 | 36.3 (5.0) |
| Lean mass index (kg/m2) | 136 | 14.7 (2.4) | 45 | 17.2 (2.1) | 91 | 13.5 (1.4) |
| Fat body mass (kg) | 136 | 24.7 (8.8) | 45 | 24.8 (11.0) | 91 | 24.6 (7.5) |
| Fat mass (%) | 136 | 35.5 (7.6) | 45 | 29.7 (7.6) | 91 | 38.3 (5.9) |
| Fat mass index (kg/m2) | 136 | 8.8 (3.0) | 45 | 8.1 (3.6) | 91 | 9.1 (2.7) |
| Visceral adipose tissue mass (g) | 136 | 336.4 (174.1) | 45 | 417.9 (175.9) | 91 | 296.1 (159.2) |
| Waist circumference (cm) | 130 | 81.0 (4.6) | 43 | 89.9 (15.2) | 87 | 76.5 (10.5) |
| BAT | ||||||
| BAT volume (mL) | 131 | 68.5 (57.4) | 42 | 78.9 (66.0) | 89 | 63.6 (52.6) |
| BAT metabolic activity | 131 | 332.9 (328.7) | 42 | 326.8 (327.8) | 89 | 335.8 (331.0) |
| BAT SUVmean | 131 | 3.7 (1.9) | 42 | 3.2 (1.3) | 89 | 4.0 (2.1) |
| BAT SUVpeak | 131 | 11.1 (8.2) | 42 | 9.9 (7.3) | 89 | 11.6 (8.6) |
| BAT SUVmax | 131 | 12.2 (9.0) | 42 | 10.8 (8.1) | 89 | 12.8 (9.4) |
| Cardiometabolic risk factors | ||||||
| Metabolic syndrome ATP III | 128 | 0.5 (0.9) | 42 | 1.0 (1.3) | 86 | 0.2 (0.5) |
| Metabolic syndrome IDF | 128 | 0.7 (1.1) | 42 | 1.1 (1.5) | 86 | 0.5 (0.7) |
| Fatty liver index | 132 | 20.4 (25.0) | 43 | 36.9 (32.0) | 89 | 12.5 (15.7) |
| GTP (IU/L) | 131 | 19.0 (17.5) | 43 | 28.4 (26.8) | 88 | 14.4 (6.7) |
| GGT (IU/L) | 131 | 19.8 (20.0) | 43 | 29.9 (29.8) | 88 | 14.9 (9.9) |
| ALP (IU/L) | 132 | 71.3 (18.5) | 43 | 79.3 (19.4) | 89 | 67.5 (16.9) |
| C‐reactive protein (mg/L) | 132 | 2.4 (3.4) | 43 | 2.1 (2.3) | 89 | 2.5 (3.8) |
| C3 (mg/dL) | 132 | 137.4 (23.8) | 43 | 143.0 (26.2) | 89 | 134.7 (22.2) |
| C4 (mg/dL) | 132 | 28.7 (8.8) | 43 | 30.3 (9.9) | 89 | 27.9 (8.1) |
| Glucose (mg/dL) | 132 | 87.6 (6.6) | 43 | 88.9 (7.4) | 89 | 87.0 (6.1) |
| Insulin (µIU/mL) | 132 | 8.3 (4.9) | 43 | 9.1 (6.4) | 89 | 8.0 (4.0) |
| HOMA‐IR | 132 | 1.8 (1.2) | 43 | 2.1 (1.6) | 89 | 1.7 (1.0) |
| Insulin glucose ratio | 132 | 14.1 (7.0) | 43 | 14.8 (8.8) | 89 | 13.8 (6.0) |
| Total cholesterol (mg/dL) | 132 | 165.1 (32.2) | 43 | 160.1 (30.9) | 89 | 167.6 (32.7) |
| HDL‐C (mg/dL) | 132 | 52.8 (11.0) | 43 | 46.0 (7.4) | 89 | 56.0 (11.0) |
| LDL‐C (mg/dL) | 132 | 96.0 (25.3) | 43 | 96.5 (26.2) | 89 | 95.8 (25.0) |
| APOA1 (mg/dL) | 113 | 144.7 (27.5) | 37 | 130.0 (16.8) | 76 | 151.9 (28.9) |
| APOB (mg/dL) | 113 | 69.7 (19.9) | 37 | 72.7 (24.4) | 76 | 68.3 (17.3) |
| Triglycerides (mg/dL) | 132 | 82.5 (44.6) | 43 | 88.2 (47.2) | 89 | 79.7 (43.2) |
| Leptin (µg/L) | 129 | 6.2 (4.4) | 42 | 4.4 (4.0) | 87 | 7.1 (4.3) |
| Adiponectin (mg/L) | 127 | 11.4 (7.9) | 42 | 7.7 (5.2) | 85 | 13.3 (8.3) |
| Systolic blood pressure (mmHg) | 134 | 116.7 (11.6) | 44 | 125.3 (10.9) | 90 | 112.5 (9.5) |
| Diastolic blood pressure (mmHg) | 134 | 70.9 (7.6) | 44 | 72.2 (9.2) | 90 | 70.3 (6.7) |
| Inflammatory parameters | ||||||
| IL‐2 (pg/mL) | 109 | 2.4 (1.4) | 37 | 2.0 (1.3) | 72 | 2.6 (1.5) |
| IL‐4 (pg/mL) | 109 | 13.1 (9.7) | 37 | 11.7 (9.5) | 72 | 13.8 (9.7) |
| IL‐6 (pg/mL) | 109 | 1.6 (1.6) | 37 | 1.6 (1.8) | 72 | 1.6 (1.5) |
| IL‐7 (pg/mL) | 109 | 4.0 (2.8) | 37 | 3.3 (2.2) | 72 | 4.4 (3.0) |
| IL‐8 (pg/mL) | 109 | 1.6 (0.8) | 37 | 1.5 (0.9) | 72 | 1.6 (0.8) |
| IL‐10 (pg/mL) | 109 | 2.9 (3.6) | 37 | 2.3 (2.1) | 72 | 3.2 (4.1) |
| IFN‐γ (pg/mL) | 109 | 12.9 (5.4) | 37 | 11.5 (5.5) | 72 | 13.5 (5.3) |
| TNFα (pg/mL) | 109 | 1.8 (1.1) | 37 | 1.5 (0.7) | 72 | 1.9 (1.2) |
Data are presented as mean (SD).
Abbreviations: ALP, alkaline phosphatase; APOA1, apolipoprotein A1; APOB, apolipoprotein B; ATP III, Adult Treatment Panel III; BAT, brown adipose tissue; C3, complement C3; C4, complement C4; GGT, gamma‐glutamyl transferase; GTP, glutamic pyruvic transaminase; HDL‐C, high‐density lipoprotein cholesterol; HOMA‐IR, homeostatic model assessment of insulin resistance index; IDF, International Diabetes Federation; IFN‐γ, interferon gamma; IL, interleukin; LDL‐C, low‐density lipoprotein cholesterol; SUV, standardized uptake value; TNFα, tumor necrosis factor‐alpha.
Plasma levels of oxylipins are related to body composition parameters
At the first step, we investigated the relationship between the plasma levels of omega‐6 and omega‐3 oxylipins and body composition parameters. A total of 12 of the 30 detected omega‐6 oxylipins correlated positively with fat mass percentage (all r ≥ 0.18; p < 0.05; Figure 1A), whereas 3 of the 20 detected omega‐3 oxylipins correlated negatively with fat mass percentage (all r ≤ −0.29; p < 0.05; Figure 1B). Similar correlation coefficients were obtained between the aforementioned oxylipins and fat mass index or VAT mass (all r ≤ −0.23; p < 0.05; Figure 1A,B). After FDR correction, four omega‐6 oxylipins (15‐HeTrE, 5‐HETE, 14,15‐EpETrE, and 8,12‐iso‐iPF2α‐VI) and three omega‐3 oxylipins (14,15‐DIHETE, 17,18‐DIHETE, and 19,20‐DiHDPA) remained significantly correlated with adiposity parameters (fat mass percentage, fat mass index, and VAT mass; all p < 0.05; Figure 1A,B).
FIGURE 1.

Pearson correlation analyses between plasma levels of oxylipins (omega‐6 and omega‐3) with body composition and brown adipose tissue (BAT) parameters in young adults (n = 133). Every box represents a significant correlation coefficient (all p < 0.05), whereas empty spaces represent no significant correlations. Blue and red boxes indicate positive and negative correlations, respectively. All oxylipin outcomes were log10‐transformed prior to data analysis. *Significant after false discovery rate corrections. SUV, standardized uptake value. The abbreviations used for each oxylipin are detailed in Supporting Information Table S1
Given the clear link between plasma oxylipins and dietary PUFA intake (30), we next conducted partial correlation analysis adjusting for dietary energy, PUFA, fish, and shellfish intake as cofounders. We found that the significant correlations between the set of four omega‐6 and three omega‐3 oxylipins with adiposity parameters remained significant (Supporting Information Figure S1), suggesting that these correlations are not affected by dietary energy, PUFA, fish, and shellfish intake.
Because BAT can be a source of oxylipins (10, 11, 12, 13) and has been linked to a healthier cardiometabolic profile in humans (31), we explored whether plasma oxylipin levels correlated with BAT volume and activity. After FDR correction, plasma levels of the omega‐3 oxylipins 14,15‐DiHETE, 17,18‐DiHETE, 19,20‐EpDPE, and 19,20‐DiHDPA correlated negatively with BAT volume and activity (BAT metabolic activity, SUVmean, SUVpeak, and SUVmax; all r ≤ −0.23; p < 0.05; Figure 1B). By contrast, no significant correlations were found between plasma omega‐6 oxylipins and BAT volume or activity (Figure 1A). Of note, the associations remained unaltered when dietary intake (i.e., energy, PUFA, fish, and shellfish intake; Supporting Information Figure S1) and the seasonal variation were included as cofounders, the latter of which is known to affect the determination of BAT volume and activity in humans (31, 32) (data not shown).
Plasma levels of oxylipins are related to cardiometabolic risk factors
We next examined whether plasma oxylipin levels were related to traditional cardiometabolic risk factors assessed in serum. Notably, the set of four omega‐6 oxylipins that correlated positively with adiposity parameters (15‐HeTrE, 5‐HETE, 14,15‐EpETrE, and 8,12‐iso‐iPF2α‐VI) also correlated positively with an adverse cardiometabolic profile (i.e., higher prevalence of metabolic syndrome, higher fatty liver index, serum glucose, and serum lipid parameters [TC or TG]; r ≥ 0.18; p < 0.05; Figure 2A). By contrast, the set of three omega‐3 oxylipins that correlated negatively with adiposity parameters (14,15‐DIHETE, 17,18‐DIHETE, and 19,20‐DiHDPA) correlated with a favorable cardiometabolic profile, specifically lower prevalence of metabolic syndrome, fatty liver index, serum glucose, and serum lipid parameters (TC or TG) (p < 0.05; Figure 2B). The correlations remained significant after adjusting for dietary energy, PUFA, fish, and shellfish intake (Supporting Information Figure S2), although they were not significant after correcting for FDR.
FIGURE 2.

Pearson correlation analyses between plasma levels of oxylipins (omega‐6 and omega‐3) with cardiometabolic risk factors in young adults (n = 133). Every box represents a significant correlation coefficient (all p < 0.05), whereas empty spaces represent no significant correlations. Blue and red boxes indicate positive and negative correlations, respectively. All oxylipin outcomes were log10‐transformed prior to data analysis. *Significant after false discovery rate corrections. ALP, alkaline phosphatase; APOA1, apolipoprotein A1; APOB, apolipoprotein B; ATP III, National Cholesterol Education Program Adult Treatment Panel III; GGT, gamma‐glutamyl transferase; GTP, glutamic pyruvic transaminase; HDL‐C, high‐density lipoprotein cholesterol; HOMA‐IR, homeostatic model assessment of insulin resistance index; IDF, International Diabetes Federation; LDL‐C, low‐density lipoprotein cholesterol. The abbreviations used for each oxylipin are detailed in Supporting Information Table S1
Based on the pro‐ and anti‐inflammatory effects of the omega‐6 and omega‐3 oxylipins, respectively, we expected to observe significant correlations with traditional pro‐ and anti‐inflammatory markers (IL‐2, IL‐4, IL‐6, IL‐7, IL‐8, IL‐10, IL‐17a, IFNɣ, and TNFα). We found that plasma levels of three of the four omega‐6 oxylipins that correlated positively with adiposity parameters and an adverse cardiometabolic profile (15‐HeTrE, 5‐HETE, and 8,12‐iso‐iPF2α‐VI) also correlated positively with the proinflammatory markers IL‐17, IFNɣ, and TNFα and negatively with the anti‐inflammatory marker IL‐4. Surprisingly, we found that the plasma levels of the three omega‐3 oxylipins that correlated negatively with adiposity parameters (14,15‐DIHETE, 17,18‐DIHETE, and 19,20‐DiHDPA) did not correlate with traditional pro‐ and anti‐inflammatory makers (all r ≥ 0.19; p < 0.05; Supporting Information Figure S3B).
Given these findings, we used stepwise linear regression models to assess whether plasma levels of oxylipins were better predictors of adiposity than traditional cardiometabolic risk factors or established pro‐ and anti‐inflammatory markers. We selected the four omega‐6 and 3 omega‐3 oxylipins that were related to adiposity and cardiometabolic risk parameters (Figure 1, 2 and Figure 3). The panel of seven oxylipins was included together with classical cardiometabolic risk factors as independent outcomes, and fat mass percentage or VAT mass was included as dependent outcomes in separate models (Supporting Information Table S3). We repeated these analyses including the panel of oxylipins together with established pro‐ and anti‐inflammatory markers as independent outcomes (Table 2). Overall, the traditional cardiometabolic risk factors, principally leptin and HOMA‐IR, were found to be better predictors of adiposity (fat mass percentage and VAT mass) than the panel of seven oxylipins (Supporting Information Table S3). However, the plasma levels of the omega‐6 oxylipins 5‐HETE and 15‐HETrE and the plasma levels of 14,15‐DiHETE and 17,18‐DiHETE (omega‐3 oxylipins) were better predictors of adiposity than established pro‐ and anti‐inflammatory markers (e.g., IL‐6, TNFα) (Table 2), predicting up to 27.2% and 22.9% of the explained variance of the fat mass percentage and VAT mass, respectively (Table 2). The stepwise linear regression models were repeated with the inclusion of all oxylipins, resulting in similar results to those observed with the panel of seven oxylipins (data not shown).
FIGURE 3.

Scatterplots between plasma levels of selected oxylipins (15‐HETrE, 5‐HETE, 14,15‐EpETrE, 8,12‐iso‐iPF2α‐VI, 14,15‐DiHETE, 17,18‐DiHETE, and 19,20‐DiHDPA) and VAT, FLI, TG, and HOMA‐IR. Pearson correlations were performed. All oxylipins values and triglycerides were log10‐transformed. FLI, fatty liver index; HOMA‐IR, homeostatic model assessment of insulin resistance index; TG, triglycerides; VAT, visceral adipose tissue. The abbreviations used for each oxylipin are detailed in Supporting Information Table S1
TABLE 2.
Forward stepwise regression models assessing the independent association of the predictors (selected oxylipins and traditional pro‐ and anti‐inflammatory markers) with fat mass percentage and visceral adipose tissue mass as dependent outcomes in separate models in young adults
| β | B | 95% CI | p (coefficients) | R 2 | R 2 change | F change | p (model) | |||
|---|---|---|---|---|---|---|---|---|---|---|
| Fat mass percentage (%) | ||||||||||
| Step 1 | 0.167 | – | 22.457 | <0.001 | ||||||
| 14,15‐DiHETE | −0.409 | −16.588 | −23.523, −9.652 | <0.001 | ||||||
| Step 2 | 0.272 | 0.105 | 16.078 | <0.001 | ||||||
| 14,15‐DiHETE | −0.390 | −15.831 | −22.353, −9.309 | <0.001 | ||||||
| 5‐HETE | 0.325 | 11.815 | 5.976, 17.654 | <0.001 | ||||||
| Step 3 | 0.308 | 0.035 | 5.641 | <0.001 | ||||||
| 14,15‐DiHETE | −0.398 | −16.148 | −22.545, −9.752 | <0.001 | ||||||
| 5‐HETE | 0.311 | 11.284 | 5.545, 17.022 | <0.001 | ||||||
| IL‐8 | 0.189 | 6.048 | 1.001, 11.095 | 0.019 | ||||||
| Visceral adipose tissue mass (g) | ||||||||||
| Step 1 | 0.126 | – | 16.211 | <0.001 | ||||||
| 17,18‐DiHETE | −0.356 | −323.799 | −483.141, −164.456 | <0.001 | ||||||
| Step 2 | 0.229 | 0.103 | 14.846 | <0.001 | ||||||
| 17,18‐DiHETE | −0.333 | −303.105 | −453.818, −152.392 | <0.001 | ||||||
| 15‐HETrE | 0.322 | 336.505 | 163.444, 509.567 | <0.001 | ||||||
Selected oxylipins: 15‐HETrE, 5‐HETE, 14,15‐EpETrE, 8,12‐iso‐iPF2α‐VI, 14,15‐DiHETE, 17,18‐DiHETE, and 19,20‐DiHDPA; and traditional inflammatory markers: IL‐2, IL‐4, IL‐6, IL‐7, IL‐8, IL‐10, IL‐17a, IFNɣ, and TNFα.
Abbreviations: β, standardized regression coefficient; B, unstandardized regression coefficient; IL‐8, interleukin‐8; R 2, adjusted coefficient of determination, expressing the percent variability of the dependent variable explained by each model; R 2 change, additional percent variability explained by the model due to the inclusion of the new term.
Individuals with obesity have higher plasma levels of omega‐6 and lower plasma levels of omega‐3 oxylipins than normal‐weight individuals
To further investigate the relationship between plasma levels of oxylipins and adiposity and cardiometabolic risk factors, we performed pathway interaction network analyses comparing plasma levels of oxylipins between individuals with obesity and normal‐weight individuals (Figure 4). We found that the metabolic pathway related to omega‐6 oxylipins, which includes DGLA, 8‐HETrE, 15‐HETrE, 8,12‐iso‐iPF2α‐VI, 14,15‐EpETrE, and 15‐HETE, was higher in individuals with obesity (n = 20) than in normal‐weight (n = 82) individuals (fold change 1.26 to 1.47; p ≤ 0.005; Figure 4A). By contrast, the omega‐3 metabolic pathway tended to be lower in people with obesity, although only the plasma levels of 19,20‐DiHDPA reached the significance threshold (fold change 0.81; p = 0.014; Figure 4B).
FIGURE 4.
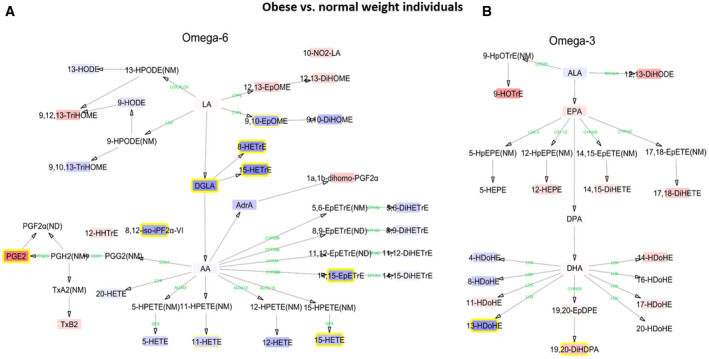
Interaction network pathway analyses of plasma levels of omega‐6 and omega‐3 polyunsaturated fatty acids in individuals with obesity versus normal‐weight individuals. The networks depict the differences of individual (A) omega‐6 and (B) omega‐3 lipid mediators in obesity compared with normal‐weight individuals. Blue boxes with yellow frame and red boxes with yellow frame indicate higher and lower levels, respectively, in both populations. Blue and red boxes without yellow frame are oxylipins without statistical significance. Enzymes involved in the metabolic pathway are represented in green. All oxylipin outcomes were log10‐transformed prior to data analysis. Oxylipins without boxes were not detected (ND) or not measured (NM). The abbreviations used for each oxylipin are detailed in Supporting Information Table S1
DISCUSSION
We identified seven oxylipins as potential subclinical markers of adverse cardiometabolic health in young adults. Using targeted metabolomics, we found that the plasma levels of 15‐HeTrE, 5‐HETE, 14,15‐EpETrE, and 8,12‐iso‐iPF2α‐VI omega‐6 oxylipins were positively correlated with adiposity, the prevalence of metabolic syndrome, fatty liver index, HOMA‐IR, and lipid parameters, whereas the plasma levels of 14,15‐DiHETE, 17,18‐DiHETE, and 19,20‐DiHDPA omega‐3 oxylipins were negatively correlated with adiposity, the prevalence of metabolic syndrome, fatty liver index, and HOMA‐IR and lipid parameters. The panel of seven oxylipins was a better predictor of adiposity than traditional pro‐ and anti‐inflammatory markers (e.g., IFNɣ, TNFα). We also found that obesity was linked to higher plasma levels of omega‐6 and lower plasma levels of omega‐3 oxylipins.
Role of oxylipins in the development of adiposity and cardiometabolic diseases
Our data show that the plasma levels of a panel of seven oxylipins may be used as an early marker of cardiometabolic risk in young adults. Evidence in support of this notion comes from preclinical studies using the fat‐1 transgenic mouse, which expresses an omega‐3 desaturase that transforms omega‐6 into omega‐3 PUFAs and overcomes the enzymatic competition between omega‐6 and omega‐3 (33). This mouse model is protected against obesity and cardiometabolic diseases such as insulin resistance, liver steatosis, metabolic syndrome, and chronic inflammation when exposed to high‐fat diet (34) and it shows lower plasma levels of omega‐6 oxylipins, including 15‐HeTrE, 5‐HETE, and 14,15‐EpETrE, and higher plasma levels of omega‐3 oxylipins, including 14,15‐DiHETE, 17,18‐DiHETE, and 19,20‐DiHDPA (35). Accordingly, the set of oxylipins described in fat‐1 mice is identical to the panel of oxylipins found in our human study, supporting their role as important players in metabolic homeostasis. The authors of the latter study suggested that this oxylipin panel might be used as a potential marker of the cardiometabolic risk status of mice (35), which is confirmed in the present human cohort. Indeed, the aforementioned preclinical study supports the notion that the balance between omega‐6 and omega‐3 oxylipins is the likely main mechanism that explains the protective phenotype, adding weight to the idea that the observational findings in the present study may be due to causal relationships. It is worth highlighting that 8,12‐iso‐iPF2α‐VI is a potential marker of cardiometabolic health in humans; this omega‐6 oxylipin 8,12‐iso‐iPF2α‐VI is produced by the nonenzymatic oxidation of membrane‐linked AA and is a marker of free radical attack/oxidative stress (36). Evidence for its role in metabolic disorders was recently supplied by the observation that people with type 2 diabetes have higher levels of 8,12‐iso‐iPF2α‐VI than those without (37), which is consistent with our findings. Accordingly, we found that 8,12‐iso‐iPF2α‐VI was associated with increased indices of adiposity and with cardiovascular markers, which are linked to permanent prooxidative stress, ultimately leading to systemic/local damage and clinical cardiovascular disease.
Role of oxylipins as potential markers of the overall inflammatory status
Our study establishes a panel of seven oxylipins as good markers of subclinical inflammation even before observed changes to proinflammatory cytokines, which are associated with increased adipose tissue accretion. This panel was related to adiposity and showed a coherent relationship with proinflammatory and anti‐inflammatory cytokines, before the traditional inflammatory markers, such as IFNɣ or TNFα, emerged as indicators of a chronic inflammatory environment. It is well known that lipoxins, which are formed from omega‐6 PUFA breakdown, include several proinflammatory lipid mediators such as prostaglandins, thromboxane, and leukotrienes. By contrast, breakdown of omega‐3 PUFAs produces specialized proresolving lipid mediators such as resolvins, maresins, and protectins, which regulate anti‐inflammatory processes and allow for reestablishment of tissue homeostasis. Indeed, oxylipins influence cytokine production and release, the coagulation cascade, and leukocyte chemotaxis (38, 39), supporting their role as early contributors to the low‐grade systemic inflammatory status in young adults.
Omega‐3 oxylipins are related to low 18F‐FDG uptake by BAT
We observed that plasma levels of the omega‐3 oxylipins 14,15‐DiHETE, 17,18‐DiHETE, 19,20‐EpDPE, and 19,20‐DiHDPA were negatively correlated with BAT volume and activity, whereas omega‐6 oxylipins showed no association with BAT‐related outcomes. BAT is a metabolic tissue with thermogenic and cardiometabolic protective functions (31). Therefore, our findings are of clinical interest because of the secretory function of BAT, which might contribute to the pool of circulating oxylipins (10, 11, 12, 13), although it cannot be confirmed in the current study. At first glance, these findings would appear at odds with earlier studies showing that BAT has a role in the regulation of the systemic pool of omega‐3 and ‐6 oxylipins after cold exposure, increasing the levels of the former and decreasing the levels of the latter (10, 11, 40). It should be noted, however, that previous studies measured oxylipin levels before and after either a cold exposure or a single bout of exercise in small cohorts (all n ≤ 40) (10, 11, 12, 13, 41), and none of them measured fasting levels of oxylipins, as was done here. Therefore, comparisons between the present findings and those of earlier studies must be made carefully. Regarding the biological significance of the set of negative correlations we observed, it is known that the heart consumes both glucose and fatty acids and that it can switch between glycolytic or lipolytic‐based pathways depending on the availability of substrates (42). BAT also consumes both glucose and fatty acids (43), but it is not yet known whether it has the ability to switch between oxidative and glycolytic metabolism contingent on substrate availability. On the basis of our observations, we are tempted to speculate that human BAT may have the ability to switch metabolism, as we observed that glucose levels did not correlate with BAT‐related outcomes (data not shown), whereas omega‐3 oxylipins, which were higher in abundance in plasma, negatively correlated with BAT‐related outcomes. Further studies are needed to investigate whether this hypothesis is plausible.
Curiously, 12,13‐DiHOME is an LA‐derived oxylipin secreted by BAT upon cold exposure and exercise (12, 13), although in our study, plasma levels of 12,13‐DiHOME did not correlate with BAT‐related outcomes. In addition, we found that plasma levels of this oxylipin were not related to adiposity and cardiometabolic risk factors of young individuals, whereas it was negatively correlated with lean mass. This finding does not concur with previous evidence showing a negative relationship between the plasma levels of 12,13‐DiHOME and BMI and fat mass (12, 13), suggesting that more research is needed to understand the use of 12,13‐DiHOME as marker of BAT activity and/or metabolic health in humans.
Limitations
As with all cross‐sectional studies, the present study does not allow the establishment of causality; however, there are preclinical studies (35, 44) supporting the causative role of oxylipins in the development of cardiometabolic diseases. The method for quantifying BAT volume and activity has several limitations, which are described elsewhere (43, 45), and the data should therefore be interpreted carefully. The study population included sedentary young adults, which does not allow extrapolation of the findings to older, younger, or unhealthy populations, but it is, as far as we are aware, the only study performed so far. Thus, future studies are needed to evaluate whether these seven oxylipins are markers of cardiometabolic health in aged populations or populations at risk of cardiometabolic diseases.
CONCLUSION
We describe for the first time, to our knowledge, that plasma levels of four omega‐6 oxylipins (15‐HeTrE, 5‐HETE, 14,15‐EpETrE, and 8,12‐iso‐iPF2α‐VI) positively correlate with adiposity and an adverse cardiometabolic profile, whereas the plasma levels of three omega‐3 oxylipins (14,15‐DiHETE, 17,18‐DiHETE, and 19,20‐DiHDPA) negatively correlate with adiposity and a better cardiometabolic profile, in young adults. The panel of seven oxylipins is a better predictor of adiposity than traditional pro‐ and anti‐inflammatory markers. Also, we observed that individuals with obesity have higher plasma levels of omega‐6 and lower plasma levels of omega‐3 oxylipins than normal‐weight peers. We would suggest that this panel of seven oxylipins may be used as an early diagnostic marker for cardiometabolic risk in young adults.O
CONFLICT OF INTEREST
The authors declared no conflict of interest.
AUTHOR CONTRIBUTIONS
LJF, FJOP, JVGL, JRR, and BMT conceived and designed the study; LJF, XD, IK, FJOP, WY, and BMT acquired data; LJF and BMT elaborated the statistical analyses section; LJF, TH, EK, ACH, SFV, PCNR, and BMT discussed and interpreted the data; LJF and BMT drafted the manuscript; and all authors critically revised the manuscript. All authors approved the submitted and final version.
Supporting information
Supplementary Material
ACKNOWLEDGMENTS
The authors would like to thank all the participants of this study for their time and effort. This study is part of a Ph.D. thesis conducted in the Biomedicine Doctoral Studies of the University of Granada, Spain.
Jurado‐Fasoli L, Di X, Kohler I, et al. Omega‐6 and omega‐3 oxylipins as potential markers of cardiometabolic risk in young adults. Obesity (Silver Spring). 2022;30:50–61. 10.1002/oby.23282
Lucas Jurado‐Fasoli, Xinyu Di, and Isabelle Kohler contributed equally to this work.
Funding information
This study was supported by the Spanish Ministry of Economy and Competitiveness via the Fondo de Investigación Sanitaria del Instituto de Salud Carlos III (PI13/01393) and PTA‐12264, Retos de la Sociedad (DEP2016‐79512‐R) and the European Regional Development Fund (ERDF), the Spanish Ministry of Education (FPU16/02828 and FPU19/01609), the Fundación Iberoamericana de Nutrición (FINUT), the Redes Temáticas de Investigación Cooperativa RETIC (Red SAMID RD16/0022), the AstraZeneca HealthCare Foundation, the University of Granada Plan Propio de Investigación 2016 Excellence actions: Unit of Excellence on Exercise and Health (UCEES), the Junta de Andalucía, Consejería de Conocimiento, Investigación y Universidades (ERDF; ref. SOMM17/6107/UGR and DOC 01151), the Fundación Alfonso Martin Escudero, the Netherlands CardioVascular Research Initiative: the Dutch Heart Foundation, Dutch Federation of University Medical Centers, the Netherlands Organisation for Health Research and Development and the Royal Netherlands Academy of Sciences (CVON2017‐20 GENIUS‐2) to PCNR, and the Chinese Scholarship Council (CSC, No. 201707060012).
Contributor Information
Jonatan R. Ruiz, Email: ruizj@ugr.es.
Borja Martinez‐Tellez, Email: ruizj@ugr.es, Email: b.martinez-tellez@lumc.nl.
REFERENCES
- 1. Afshin A, Reitsma MB, Murray CJL. Health effects of overweight and obesity in 195 countries. N Engl J Med. 2017;377:1496‐1497. [DOI] [PubMed] [Google Scholar]
- 2. Ortega FB, Lavie CJ, Blair SN. Obesity and cardiovascular disease. Circ Res. 2016;118:1752‐1770. [DOI] [PubMed] [Google Scholar]
- 3. Spite M, Clària J, Serhan CN. Resolvins, specialized proresolving lipid mediators, and their potential roles in metabolic diseases. Cell Metab. 2014;19:21‐36. [DOI] [PMC free article] [PubMed] [Google Scholar]
- 4. Serhan CN, Chiang N, Van Dyke TE. Resolving inflammation: dual anti‐inflammatory and pro‐resolution lipid mediators. Nat Rev Immunol. 2008;8:349‐361. [DOI] [PMC free article] [PubMed] [Google Scholar]
- 5. Simopoulos AP, Gene O. An increase in the omega‐6 / omega‐3 fatty acid ratio increases the risk for obesity. Nutrients. 2016;8:128. doi: 10.3390/nu8030128 [DOI] [PMC free article] [PubMed] [Google Scholar]
- 6. Gabbs M, Leng S, Devassy JG, Monirujjaman MD, Aukema HM. Advances in our understanding of oxylipins derived from dietary PUFAs. Adv Nutr. 2015;6:513‐540. [DOI] [PMC free article] [PubMed] [Google Scholar]
- 7. Cannon B, Nedergaard J. Brown adipose tissue: function and physiological significance. Physiol Rev. 2004;84:277‐359. [DOI] [PubMed] [Google Scholar]
- 8. Villarroya F, Cereijo R, Villarroya J, Giralt M. Brown adipose tissue as a secretory organ. Nat Rev Endocrinol. 2017;13:26‐35. [DOI] [PubMed] [Google Scholar]
- 9. Ruiz JR, Martinez‐Tellez B, Sanchez‐Delgado G, Osuna‐Prieto FJ, Rensen PCN, Boon MR. Role of human brown fat in obesity, metabolism and cardiovascular disease: strategies to turn up the heat. Prog Cardiovasc Dis. 2018;61:232‐245. [DOI] [PubMed] [Google Scholar]
- 10. Kulterer OC, Niederstaetter L, Herz CT, et al. The presence of active brown adipose tissue determines cold‐induced energy expenditure and oxylipin profiles in humans. J Clin Endocrinol Metab. 2020;105:dgaa183. doi: 10.1210/clinem/dgaa183 [DOI] [PubMed] [Google Scholar]
- 11. Leiria LO, Wang CH, Lynes MD, et al. 12‐lipoxygenase regulates cold adaptation and glucose metabolism by producing the omega‐3 lipid 12‐HEPE from brown fat. Cell Metab. 2019;30:768‐783.e7. doi: 10.1016/j.cmet.2019.07.001 [DOI] [PMC free article] [PubMed] [Google Scholar]
- 12. Stanford KI, Lynes MD, Takahashi H, et al. 12,13‐diHOME: an exercise‐induced lipokine that increases skeletal muscle fatty acid uptake. Cell Metab. 2018;27:1111‐1120.e3. [DOI] [PMC free article] [PubMed] [Google Scholar]
- 13. Lynes MD, Leiria LO, Lundh M, et al. The cold‐induced lipokine 12,13‐diHOME promotes fatty acid transport into brown adipose tissue. Nat Med. 2017;23:631‐637. [DOI] [PMC free article] [PubMed] [Google Scholar]
- 14. Caligiuri SPB, Parikh M, Stamenkovic A, Pierce GN, Aukema HM. Dietary modulation of oxylipins in cardiovascular disease and aging. Am J Physiol Heart Circ Physiol. 2017;313:H903‐H918. [DOI] [PubMed] [Google Scholar]
- 15. Grapov D, Adams SH, Pedersen TL, Garvey WT, Newman JW. Type 2 diabetes associated changes in the plasma non‐esterified fatty acids. Oxylipins and endocannabinoids. PLoS One. 2012;7:e48852. doi: 10.1371/journal.pone.0048852 [DOI] [PMC free article] [PubMed] [Google Scholar]
- 16. Schuchardt JP, Schmidt S, Kressel G, et al. Comparison of free serum oxylipin concentrations in hyper‐ vs. normolipidemic men. Prostaglandins Leukot Essent Fat Acids. 2013;89:19‐29. [DOI] [PMC free article] [PubMed] [Google Scholar]
- 17. Sanchez‐Delgado G, Martinez‐Tellez B, Olza J, et al. Activating brown adipose tissue through exercise (ACTIBATE) in young adults: rationale, design and methodology. Contemp Clin Trials. 2015;45:416‐425. [DOI] [PubMed] [Google Scholar]
- 18. World Health Organization . Body mass index‐BMI. https://www.euro.who.int/en/health‐topics/disease‐prevention/nutrition/a‐healthy‐lifestyle/body‐mass‐index‐bmi
- 19. Martinez‐Tellez B, Sanchez‐Delgado G, Garcia‐Rivero Y, et al. A new personalized cooling protocol to activate brown adipose tissue in young adults. Front Physiol. 2017;8:863. doi: 10.3389/fphys.2017.00863 [DOI] [PMC free article] [PubMed] [Google Scholar]
- 20. Martinez‐Tellez B, Sanchez‐Delgado G, Boon MR, Rensen PCN, Llamas‐Elvira JM, Ruiz JR. Distribution of brown adipose tissue radiodensity in young adults: implications for cold [18F]FDG‐PET/CT analyses. Mol Imaging Biol. 2020;22:425‐433. [DOI] [PubMed] [Google Scholar]
- 21. Martinez‐Tellez B, Nahon KJ, Sanchez‐Delgado G, et al. The impact of using BARCIST 1.0 criteria on quantification of BAT volume and activity in three independent cohorts of adults. Sci Rep. 2018;8:8567. doi: 10.1038/s41598-018-26878-4. [DOI] [PMC free article] [PubMed] [Google Scholar]
- 22. Martinez‐Tellez B, Sanchez‐Delgado G, Alcantara JMA, et al. Evidence of high 18 F‐fluorodeoxyglucose uptake in the subcutaneous adipose tissue of the dorsocervical area in young adults. Exp Physiol. 2019;104:168‐173. [DOI] [PubMed] [Google Scholar]
- 23. Lipsy RJ. The National Cholesterol Education Program Adult Treatment Panel III guidelines. J Manag Care Pharm. 2003;9(1 suppl):2‐5. [DOI] [PMC free article] [PubMed] [Google Scholar]
- 24. Carracher AM, Marathe PH, Close KL. International Diabetes Federation 2017. J Diabetes. 2018;10:353‐356. [DOI] [PubMed] [Google Scholar]
- 25. Matthews JC. Instability of brain synaptosomal membrane preparations to repeated ultracentrifugation in isoosmotic density gradients. Life Sci. 1985;37:2467‐2473. [DOI] [PubMed] [Google Scholar]
- 26. Bedogni G, Bellentani S, Miglioli L, et al. The Fatty Liver Index: a simple and accurate predictor of hepatic steatosis in the general population. BMC Gastroenterol. 2006;6:33. doi: 10.1186/1471-230X-6-33 [DOI] [PMC free article] [PubMed] [Google Scholar]
- 27. Di Zazzo A, Yang W, Coassin M, et al. Signaling lipids as diagnostic biomarkers for ocular surface cicatrizing conjunctivitis. J Mol Med. 2020;98:751‐760. [DOI] [PMC free article] [PubMed] [Google Scholar]
- 28. Benjamini Y, Krieger AM, Yekutieli D. Adaptive linear step‐up procedures that control the false discovery rate. Biometrika. 2006;93:491‐507. [Google Scholar]
- 29. Shannon P, Markiel A, Ozier O, et al. Cytoscape: a software environment for integrated models. Genome Res. 2003;13:2498‐2504. [DOI] [PMC free article] [PubMed] [Google Scholar]
- 30. Ostermann AI, West AL, Schoenfeld K, et al. Plasma oxylipins respond in a linear dose‐response manner with increased intake of EPA and DHA: results from a randomized controlled trial in healthy humans. Am J Clin Nutr. 2019;109:1251‐1263. [DOI] [PubMed] [Google Scholar]
- 31. Becher T, Palanisamy S, Kramer DJ, et al. Brown adipose tissue is associated with cardiometabolic health. Nat Med. 2021;27:58‐65. [DOI] [PMC free article] [PubMed] [Google Scholar]
- 32. Martinez‐Tellez B, Xu H, Sanchez‐Delgado G, et al. Association of wrist and ambient temperature with cold‐induced brown adipose tissue and skeletal muscle [18 F]FDG uptake in young adults. Am J Physiol Integr Comp Physiol. 2018;315:R1281‐R1288. [DOI] [PubMed] [Google Scholar]
- 33. Kang JX, Wang J, Wu L, Kang ZB. Fat‐1 mice convert n‐6 to n‐3 fatty acids. Nature. 2004;427:504. doi: 10.1038/427504a [DOI] [PubMed] [Google Scholar]
- 34. López‐Vicario C, González‐Périz A, Rius B, et al. Molecular interplay between Δ5/6 desaturases and long‐chain fatty acids in the pathogenesis of non‐alcoholic steatohepatitis. Gut. 2014;63:344‐355. [DOI] [PubMed] [Google Scholar]
- 35. Astarita G, McKenzie JH, Wang B, et al. A protective lipidomic biosignature associated with a balanced omega‐6/omega‐3 ratio in fat‐1 transgenic mice. PLoS One. 2014;9:e96221. doi: 10.1371/journal.pone.0096221 [DOI] [PMC free article] [PubMed] [Google Scholar]
- 36. Milatovic D, Montine TJ, Aschner M. Measurement of isoprostanes as markers of oxidative stress. Methods Mol Biol. 2011;758:195‐204. [DOI] [PMC free article] [PubMed] [Google Scholar]
- 37. Kaviarasan S, Muniandy S, Qvist R, Ismail IS. F2‐isoprostanes as novel biomarkers for type 2 diabetes: a review. J Clin Biochem Nutr. 2009;45:1‐8. [DOI] [PMC free article] [PubMed] [Google Scholar]
- 38. Serhan CN. Novel lipid mediators and resolution mechanisms in acute inflammation: to resolve or not? Am J Pathol. 2010;177:1576‐1591. [DOI] [PMC free article] [PubMed] [Google Scholar]
- 39. Serhan CN, Brain SD, Buckley CD, et al. Resolution of in flammation: state of the art, definitions and terms. FASEB J. 2007;21:325‐332. [DOI] [PMC free article] [PubMed] [Google Scholar]
- 40. Xiang AS, Giles C, Loh RKC, et al. Plasma docosahexaenoic acid and eicosapentaenoic acid concentrations are positively associated with brown adipose tissue activity in humans. Metabolites. 2020;10:388. doi: 10.3390/metabo10100388. [DOI] [PMC free article] [PubMed] [Google Scholar]
- 41. Dieckmann S, Maurer S, Fromme T, et al. Fatty acid metabolite profiling reveals oxylipins as markers of brown but not brite adipose tissue. Front Endocrinol (Lausanne). 2020;11:73. doi: 10.3389/fendo.2020.00073 [DOI] [PMC free article] [PubMed] [Google Scholar]
- 42. Glatz JFC, Nabben M, Young ME, Schulze PC, Taegtmeyer H, Luiken JJFP. Re‐balancing cellular energy substrate metabolism to mend the failing heart. Biochim Biophys Acta Mol Basis Dis. 2020;1866:165579. doi: 10.1016/j.bbadis.2019.165579 [DOI] [PMC free article] [PubMed] [Google Scholar]
- 43. Carpentier AC, Blondin DP, Virtanen KA, Richard D, Haman F, Turcotte ÉE. Brown adipose tissue energy metabolism in humans. Front Endocrinol (Lausanne). 2018;9:447. doi: 10.3389/fendo.2018.00447. [DOI] [PMC free article] [PubMed] [Google Scholar]
- 44. López‐Vicario C, Alcaraz‐quiles J, García‐alonso V, Rius B, Hwang SH, Titos E. Inhibition of soluble epoxide hydrolase modulates inflammation and autophagy in obese adipose tissue and liver: role for omega‐3 epoxides. Proc Natl Acad Sci U S A. 2015;112:536‐541. [DOI] [PMC free article] [PubMed] [Google Scholar]
- 45. Schilperoort M, Hoeke G, Kooijman S, Rensen PCN. Relevance of lipid metabolism for brown fat visualization and quantification. Curr Opin Lipidol. 2016;27:242‐248. [DOI] [PubMed] [Google Scholar]
Associated Data
This section collects any data citations, data availability statements, or supplementary materials included in this article.
Supplementary Materials
Supplementary Material