Abstract
Purpose
Long‐axial field‐of‐view (FOV) positron emission tomography (PET) scanners have gained a lot of interest in the recent years. Such scanners provide increased sensitivity and enable unique imaging opportunities that were not previously feasible. Benefiting from the high sensitivity of a long‐axial FOV PET scanner, we studied a computed tomography (CT)–less reconstruction algorithm for the Siemens Biograph Vision Quadra with an axial FOV of 106 cm.
Methods
In this work, the background radiation from radioisotope lutetium‐176 in the scintillators was used to create an initial estimate of the attenuation maps. Then, joint activity and attenuation reconstruction algorithms were used to create an improved attenuation map of the object. The final attenuation maps were then used to reconstruct quantitative PET images, which were compared against CT‐based PET images. The proposed method was evaluated on data from three patients who underwent a flurodeoxyglucouse PET scan.
Results
Segmentation of the PET images of the three studied patients showed an average quantitative error of 6.5%–8.3% across all studied organs when using attenuation maps from maximum likelihood estimation of attenuation and activity and 5.3%–6.6% when using attenuation maps from maximum likelihood estimation of activity and attenuation correction coefficients.
Conclusions
Benefiting from the background radiation of lutetium‐based scintillators, a quantitative CT‐less PET imaging technique was evaluated in this work.
Keywords: CT‐less PET, joint reconstruction algorithm, long‐axial FOV PET scanners, lutetium background radiation, MLAA, MLACF
1. INTRODUCTION
Attenuation correction is by far the most important compensation that needs to be considered when performing quantitative clinical positron emission tomography (PET) imaging as the attenuation correction factors (ACFs) can be as large as 100 or even more in a long‐axial field‐of‐view (FOV) scanner. 1 In a PET/computed tomography (CT) scanner, attenuation maps (μ‐maps) at 511 keV are generated through a transformation of Hounsfield units in CT images to linear attenuation coefficients (LACs) at 511 keV. 2 Benefiting from the existing co‐registered μ‐maps, the scatter contribution may also be estimated through Monte Carlo 3 , 4 , 5 or analytical approaches such as single scatter simulation (SSS). 6 , 7 , 8 While certain limitations, such as high radiation dose, metal artifacts, beam hardening artifacts, truncation of large patients, and patient motion between scans, exist in the μ‐map derivation from CT, this method is widely preferred when possible. Attenuation correction in PET/magnetic resonance (MR) is however more challenging as MR images, unlike CT, are not directly related to electron density. A number of approaches have been proposed to generate μ‐maps from MR images, including template‐based, 9 , 10 segmentation‐based, 11 , 12 and sequence‐based approaches. 13 , 14 Keereman et al. 15 showed that a tissue misclassification can cause quantification errors of up to 45% in PET images. It should also be mentioned that μ‐map generation in PET/MR requires dealing with unique challenges such as the truncation artifacts or the existence of MR coils in the PET FOV. 16 , 17
One can broadly identify three areas where attenuation correction in PET lacks robustness: (1) in PET/CT studies where artifacts are present in the μ‐maps from CT or in a mismatched PET/CT dataset, (2) in PET/MR studies where μ‐maps from MR may have inaccuracies, and (3) in standalone PET scanners (or in PET/CT where CT is only acquired for attenuation correction and is preferred to be avoided in an effort to reduce patient radiation dose). Joint reconstruction of attenuation and activity has been investigated as a potential solution for such studies. Maximum likelihood estimation of attenuation and activity (MLAA), as proposed by Nuyts et al., 18 sequentially reconstructs PET and attenuation images through successive execution of maximum likelihood expectation maximization 19 , 20 and maximum likelihood for transmission tomography (MLTR). 21 However, the crosstalk problem may limit the usefulness of the images obtained through MLAA. It was shown that the time‐of‐flight (TOF) information can remarkably reduce crosstalk by eliminating symmetries in the Fisher information matrix, which then led to the development of TOF‐MLAA. 22 , 23 As another advantage of TOF PET, it was also shown that reconstructed PET images are generally less sensitive to mismatched μ‐maps in the presence of TOF data. 24 Similar to TOF‐MLAA, TOF maximum likelihood estimation of activity and attenuation correction coefficients (MLACF) has been proposed, during which ACFs are directly estimated after each update of the activity image 25 , 26 or simultaneously with each activity update. 27
It has been established that MLAA and MLACF can estimate PET images up to a constant. Furthermore, in the absence of a reasonable initial condition, convergence to a local maximum of the likelihood is a potential issue of such algorithms. 28 Panin et al. 29 proposed to use an external rotating rod source to reconstruct initial μ‐maps, which are then used in TOF‐MLAA to sequentially update activity and attenuation. Rothfuss et al. 30 , 31 and Teimoorisichani et al. 32 then substituted the external source with the intrinsic background radiation of lutetium oxyorthosilicate (LSO) (Lu2SiO5:Ce) to generate initial μ‐maps. The radioisotope 176Lu, with a half‐life of 3.7 × 10¹⁰ years and an abundance of 2.6% in natural lutetium, is the source of the LSO background radiation. 33 It is estimated that LSO has an activity of about 240 Bq/cm3. 34 The decay scheme of 176Lu is shown in Figure 1.
FIGURE 1.
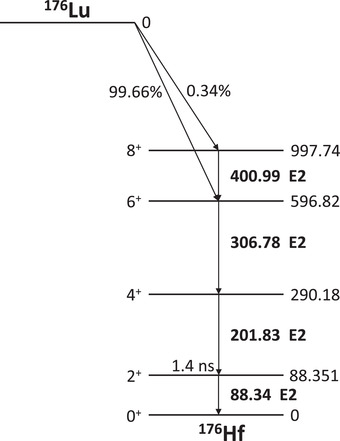
The 176Lu decay scheme
Lutetium‐based scintillators, such as LSO, are associated with some issues, such as the nonproportional light output. 35 Nevertheless, LSO and its derivatives have stayed popular in modern clinical and research PET scanners. This is because such scintillators are fast (decay time of about 30–40 ns) and dense (up to 7.4 g/cm3) with high light output (up to 40 000 photons/MeV). 36 , 37 In the Siemens Biograph Vision scanner, the LSO intrinsic activity generates a singles rate of about 10 kcps per detector (detector size: 32 × 64 × 20 mm3) in a wide energy window of 160–725 keV. For an eight‐ring scanner, a randoms rate of about 660 events per second is generated in the clinical energy (435–585 keV) and coincidence timing window (∼ 4.7 ns) due to the LSO intrinsic activity. In the Siemens Biograph Vision Quadra PET/CT scanner with 32 rings of detector and an axial FOV coverage of 106 cm, the randoms rate due to the LSO background radiation increases to about 8000 events per second within the clinical energy and coincidence timing windows. Benefiting from the high sensitivity and the consequent high count rate of the background radiation in long‐axial FOV scanners, a CT‐less solution to PET imaging is explored in the current work in which the LSO background events are used in lieu of a transmission source.
Because of the high sensitivity of a long‐axial FOV PET scanner, such scanners allow for low‐dose PET scans without any compromise on the image quality. Low‐dose PET scans are especially appealing in certain imaging studies where CT data are used for anatomical localization and PET attenuation and scatter correction; for example, in serial PET imaging for the development of novel radiopharmaceuticals where multiple CT data do not provide additional clinical information and are only used for attenuation and scatter correction of PET data. Another application is in pediatric imaging or longitudinal PET scans where diagnostic CT is separately acquired. Also, low‐dose organ‐specific brain or cardiac PET imaging is another clinical example in which the anatomical information from CT images may not provide diagnostic value and is mainly used for quantitative correction of PET images. 38 The addition of a separate CT scan (or multiple CT scans) for attenuation and scatter correction overshadows the benefits of a low‐dose PET scan in the mentioned examples. A quantitatively accurate CT‐less PET scan preserves the benefits of a low‐dose PET scan in its entirety. Therefore, the proposed CT‐less PET imaging methods in this manuscript are of particular interest for the PET studies where a separate CT is unfavorable and would have been done only for the purposes of PET attenuation and scatter correction.
2. MATERIAL AND METHODS
2.1. Data acquisition
Data presented in this work were acquired with the Siemens Biograph Vision Quadra PET/CT scanner. The PET component of a Siemens Biograph Vision Quadra scanner has 32 detector rings, each comprising 38 detector blocks. The axial FOV is 106 cm. Each detector block consists of 4 × 2 mini blocks and each mini block contains 5 × 5 LSO crystals with a dimension of 3.2 × 3.2 × 20 mm3. A mini block has approximately 12.3 kBq of 176Lu. List‐mode data were acquired in coincidence mode with widely open energy and coincidence timing windows to ensure LSO transmission events (LSO‐Tx) are captured. More specifically, an energy window of 160–725 keV and a coincidence timing window of 6.64 ns were used to record data. The events were then processed in an offline histogrammer to separate LSO‐Tx from 511 keV emission data.
2.2. Data processing
The Siemens Biograph Vision Quadra scanner has a coincidence timing resolution of about 225 ps. 39 As the walk time correction generally has been calibrated for 511 keV in PET scanners, the timing resolution at energies other than 511 keV can be different. To measure the timing resolution of the detectors at 202 and 307 keV, TOF information of the events along only a unique set of lines of response (LORs) connecting directly opposite crystals in each transaxial plane (cord length = 82 cm) was acquired. The measured timing resolution was then used in the separation of LSO‐Tx photons from emission gammas. Energy information of the events was also considered in the separation of LSO‐Tx from emission events. The acquired energy spectrum of LSO‐Tx events is shown in Figure 2.
FIGURE 2.
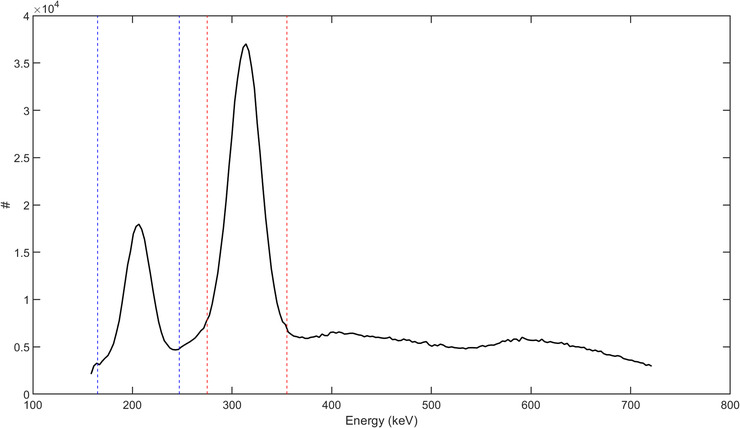
Energy spectrum of a blank scan; the dashed blue and red lines indicate the energy thresholds used in the separation of lutetium oxyorthosilicate (LSO) transmission events at 202 and 307 keV, respectively
Taking the 202 and 307 keV photons from LSO background radiation into account, three sets of sinograms were created from acquisition:
TOF emission sinogram: With reference to the blue event in Figure 3, list‐mode events with energy between 435 and 585 keV and TOF in a window of 4.72 ns were rebinned into a sinogram of size 520 × 50 × 5189 × 33 (radial bins × views × sinogram planes × TOF bins). The sinograms in this category are basically the same as what is normally generated in a typical clinical scan using a maximum ring difference of 85.
Non‐TOF LSO‐Tx sinogram at 307 keV: Following a 176Lu decay, the released β particle carries and deposits a maximum energy of 597 keV locally within the originating detector and triggers the constant fraction discriminator (CFD). Two cascade gammas with energies 202 and 307 keV are also released. In our developed histogrammer, the 307 keV LSO‐Tx gammas were separated from the list‐mode data using their unique energy and timing properties. While the triggering event (first event due to β) can deposit virtually any energy in the first detector, the latter event should fall within an energy window of 275–355 keV, as shown by the red lines in Figure 2. The LSO events along any given LOR have a large (compared to 511 keV emission events) and predictable TOF (e.g., see ΔT0 in Figure 3). Therefore, the TOF information of all energy‐qualified events was inspected to separate LSO‐Tx events. The qualified LSO‐Tx events were histogrammed into a 520 × 399 × 5189 (radial bins × views × sinogram planes) non‐TOF sinogram. The sinograms were created with no angular mashing to preserve the in‐plane spatial sampling of the recorded LORs.
Non‐TOF LSO TX sinogram at 202 keV: Similar to the LSO background events at 307 keV, the 202 keV LSO background events were also separated and histogrammed into a non‐TOF sinogram set. As shown by the blue lines in Figure 2, energy thresholds of 165–247 keV were used in the separation of the 202 keV events. It should be noted that a backscattered 511 keV emission photon can be mistakenly detected as an LSO‐Tx event with energy 202 keV. In this case, a 511 keV emission photon triggers the CFD and the backscattered photon creates an event when detected by another detector. An event due to a backscattered 511 keV photon (represented by the green dashed line in Figure 3) has the same TOF as an LSO‐Tx event and carries an energy greater than 170 keV, which can make the event indistinguishable from a 202 keV LSO‐Tx event. Though these photons were not originated from a 176Lu decay, the backscattered events can theoretically be used in the LSO‐Tx studies. However, in practice, the addition of backscattered 511 keV photons can introduce quantitative errors in the reconstructed image as the backscattered photons do not exist in the blank scan data used in the MLTR algorithm (Section 2.3). The contamination magnitude of the scattered emission photons to the LSO‐Tx sinograms has been previously studied. 30 , 31 In the current study, we excluded events that can potentially be due to a 511 keV photon backscatter. More explicitly, events that had timing properties of an LSO‐Tx one, and energy of 300–380 keV for the first event and 170–200 keV for the second event were deemed backscattered 511 keV events.
FIGURE 3.
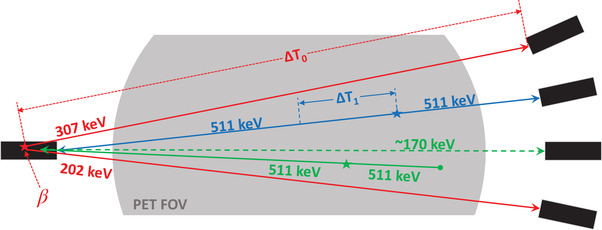
Various event types used in the study; the red solid lines represent lutetium oxyorthosilicate (LSO) transmission event photons at 202 and 307 keV with absolute time‐of‐flight (TOF) difference ΔT0. The blue line shows a sample pair of annihilation photons with absolute TOF difference ΔT1. The solid green line shows a pair of annihilation photons where one photon gets absorbed in the object and the other photon undergoes a Compton backscatter and reaches a detector on the other side with energy 170 keV, as shown with the dashed green line
2.3. Reconstruction of initial μ‐maps
Two initial sets of μ‐maps were generated from the LSO background radiation at photon energy 202 and 307 keV according to the MLTR update equation 21 :
| (1) |
where n is the iteration number, α is a relation parameter determining the step size of the gradient ascent algorithm (we used 1.5), D is the transaxial diameter of the reconstruction image, Lij is the path length of LOR i in voxel j, is the ACF of LOR i given μ‐map , B is the blank scan data, p is measured LSO‐Tx prompt data, is the mean randoms count (scatter from LSO background radiation and the contribution of object scattered emission photons to the LSO‐Tx sinograms were ignored), β is the regularization parameter modulating the influence of the prior (β was set to be 100), and U is a penalty term in the form of a first degree (the six closest neighbors) simple quadratic prior. Also, subsets were further used to accelerate the update equation. The two generated μ‐maps from background radiation were then individually mapped to 511 keV and averaged to reduce noise. The mapped μ‐maps were then smoothed through a 3D convolution with a Gaussian kernel of full width at half maximum (FWHM) 4 mm. A TOF‐MLAA and TOF‐MLACF reconstruction framework was then developed to reconstruct the attenuation and PET images as detailed in the following sections.
2.4. TOF‐MLAA reconstruction
The generated μ‐maps from LSO background radiation were used to create initial scatter sinograms using the TOF‐SSS algorithm. 8 Then, a TOF‐MLAA algorithm was employed in which activity (λ) and attenuation (μ) images were sequentially updated according to Equations (2) and (3).
| (2) |
| (3) |
In the updated equations, Cijt is the system matrix element for image voxel j and sinogram bin i at TOF index t, y is the emission prompt data (non‐TOF when writing yi and TOF when writing yit ), is the mean randoms and scatter contribution, is the forward projection of activity image at iteration n in sinogram bin i, α is the relaxation parameter (1.5), and U is the same potential function as in Equation (1). The activity image was initialized with a uniform image (λ(0) ) while the μ‐map generated from the LSO background radiation (according to Section 2.3) was used as the initial μ‐map, μ(0) .
2.5. TOF‐MLACF reconstruction
Since MLACF does not explicitly reconstruct attenuation images and instead calculates ACFs, which requires a lower number of instructions than MLAA, it is generally a faster approach than MLAA. Nonetheless, the two algorithms may show different convergence trends. 28 Also, MLACF lacks a regularization constraint in the ACF update step, which makes the generated ACFs prone to noise propagation. Using the same notations as in Equations (2) and (3), the ACF update in TOF‐MLACF was formulated as:
| (4) |
2.6. Overview of the reconstruction framework
The general reconstruction workflow was similar to the proposed algorithms in the works of Salvo and Defrise 28 and Mehranian and Zaidi. 40 An overview of the developed TOF‐MLAA and TOF‐MLACF reconstruction frameworks is shown in Algorithm 1 and Algorithm 2, respectively. Further acceleration through subsets was also implemented, which is not stated in the algorithms for simplicity.
To quantitatively evaluate the performance of the developed MLAA and MLACF algorithms, the final μ‐maps from these algorithms were then used in an ordered subset expectation maximization (OSEM) 20 algorithm to produce scaled and quantitative PET images. The images were compared against those obtained from an OSEM reconstruction using CT‐based μ‐maps. Using the segmented CT images, 41 , 42 , 43 , 44 standardized uptake values (SUVs) in the liver, lungs, kidneys, heart, spleen, brain, and bones of each subject were compared in all images. To better analyze the performance of the developed CT‐less reconstruction techniques in the quantification of cardiac and brain regions, the brain grey and white matter and the left ventricle of the heart were also manually segmented and quantitatively compared in different PET images.
To generate the initial set of μ‐maps from LSO‐Tx data, transmission sinograms were reconstructed using MLTR with eight iterations and three subsets. For the MLAA algorithm, we used a total of 25 global iterations; during each activity, images were updated with one iteration, two subsets and attenuation images were updated with one iteration, five subsets. For the MLACF algorithm, we used a total of 20 global iterations during each; activity images were updated with one iteration, two subsets and ACFs were updated using three iterations. From the final ACFs, an updated set of μ‐maps were reconstructed using eight iterations and five subsets. Final quantitative PET images were reconstructed using OSEM and the μ‐maps from MLAA or MLACF with four iterations and five subsets. The number of iterations and subsets for various reconstructions were empirically chosen based on a visual inspection of the images. Generally, a greater number of iterations was chosen for attenuation updates than activity updates in each global iteration as TOF OSEM reconstructions are expected to converge faster than the μ‐maps in MLAA or the ACFs in MLACF. 45
2.7. Patient studies
Data from three patients undergoing dynamic 18F‐flurodeoxyglucouse (18F‐FDG) PET/CT scans were used in this study. For each subject, before the injection of the radiotracer and while the patient was positioned on the bed, LSO‐Tx data were acquired (“before injection” [b.i.]) for 5 min. Following the injection of the radiotracer (∼3 MBq/kg), 511 keV emission data were acquired using regular energy and coincidence timing window settings for 65 min. We only used the data from minutes 55–65 in the current work to evaluate the performance of the developed CT‐less reconstruction algorithms. At the end of the scan, again a set of list‐mode data were acquired with wide‐open energy and coincidence timing windows for 5 min (“after injection” [a.i.]) to allow for a study of the effects of the 511 keV photons on LSO‐Tx images. Figure 4 shows a summary of the data acquisition protocol used in the patient studies. It should be noted that in clinical practice, the background data are expected to be acquired with the 511 keV emission data at the same time such that no extra patient scan time is required.
FIGURE 4.

Data acquisition protocol used in the patient studies
3. RESULTS
3.1. LSO‐Tx properties
In the Siemens Biograph Vision Quadra PET/CT scanner, an event rate of about 140 kilo‐counts per second (kcps) was measured for LSO‐Tx events at 202 keV and 280 kcps at 307 keV. The mentioned background rates were measured using a limited acceptable angle of 18°, which is what was used to acquire the data shown in this manuscript. The energy spectrum of the background radiation is shown in Figure 2. There is a limit of ∼160 keV as the minimum energy when acquiring data. As can be seen by the energy spectrum, the 202 and 307 keV peaks are slightly shifted and located at 206 and 314 keV, likely due to the nonproportional light output of LSO. 35 A histogram of the time stamps of the in‐plane LSO‐Tx events between two opposite crystals with a face‐to‐face distance of 82 cm is shown in Figure 5.
FIGURE 5.
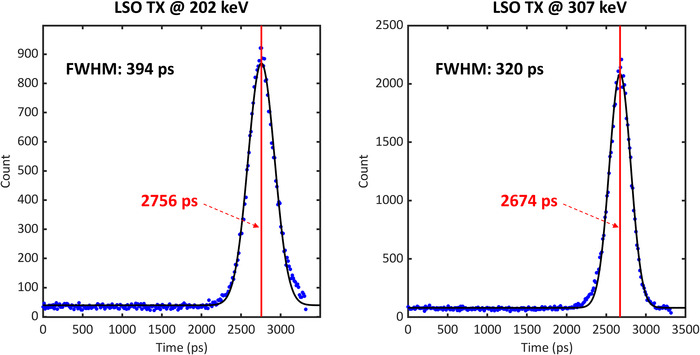
The timing spectrum of lutetium oxyorthosilicate (LSO) transmission events (Tx) at 202 (left) and 307 (right) keV between crystals located in the same axial coordinates with a radial distance of 82 cm; the blue dots show the measured data and the black lines show the Gaussian fit applied to the data. The red line also represents the peak position in each figure
After fitting a Gaussian function to the data, an FWHM of 394 and 320 ps was measured for the LSO‐Tx at 202 and 307 keV, respectively. We used the measured FWHM values as a time margin around the theoretical flight time of each cord to separate LSO‐Tx from emission photons in the scans involving 511 keV photons.
3.2. LSO‐Tx initial μ‐maps and properties
Initial μ‐maps from LSO‐Tx before and after the injection of the radiotracer for the three subjects are shown in Figure 6. These images are compared with the equivalent CT‐driven μ‐maps as a reference.
FIGURE 6.
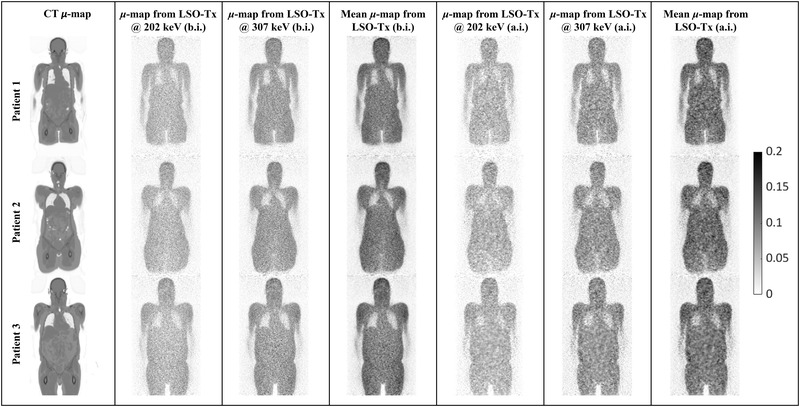
A sample coronal slice across the attenuation maps (μ‐maps) (in 1/cm) of the three studied patients obtained from the 202 and 307 keV photons from lutetium oxyorthosilicate (LSO) transmission events (Tx) before (b.i.) and after (a.i.) the injection of the radiotracer; note that the 202 and 307 keV μ‐maps generally underestimate linear attenuation coefficients due to the lack of a scatter correction. The mean μ‐maps are, however, scaled through a postreconstruction scaling step
As shown by the images in Figure 6, the LSO‐Tx μ‐maps are generally noisy and suffer from a low degree of signal‐to‐noise ratio and resolution. Also, bony structures are visually indistinguishable in these images. Nevertheless, the LSO‐Tx images provide a reasonable initial condition for a joint activity and attenuation reconstruction, which can also be used for scatter estimation. Table 1 compares the scatter fraction using the TOF‐SSS algorithm with the CT μ‐maps against LSO‐Tx μ‐maps.
TABLE 1.
Scatter fraction as calculated by the time‐of‐flight single scatter simulation algorithm using positron emission tomography attenuation maps (μ‐maps) from computed tomography (CT), lutetium oxyorthosilicate (LSO) transmission events (Tx) before injection (b.i.), and LSO‐Tx after injection (a.i.)
| CT μ‐maps (%) | LSO‐Tx b.i. (%) | LSO‐Tx a.i. (%) | |
|---|---|---|---|
| Patient 1 | 38.3 | 37.7 | 38.4 |
| Patient 2 | 40.3 | 35.1 | 35.1 |
| Patient 3 | 40.1 | 40.0 | 38.0 |
3.3. Joint reconstruction images
The final μ‐maps reconstructed from the MLAA and MLACF are shown in Figure 7 for all three subjects. Activity images from the joint reconstruction techniques are also shown in Figure 8. However, the activity images from MLAA and MLACF were not quantitatively compared with CT‐based OSEM images as these images were on a different scale. For presentation in this manuscript, PET images were normalized to 1 and the same window width for all images was used so that the images are visually comparable.
FIGURE 7.
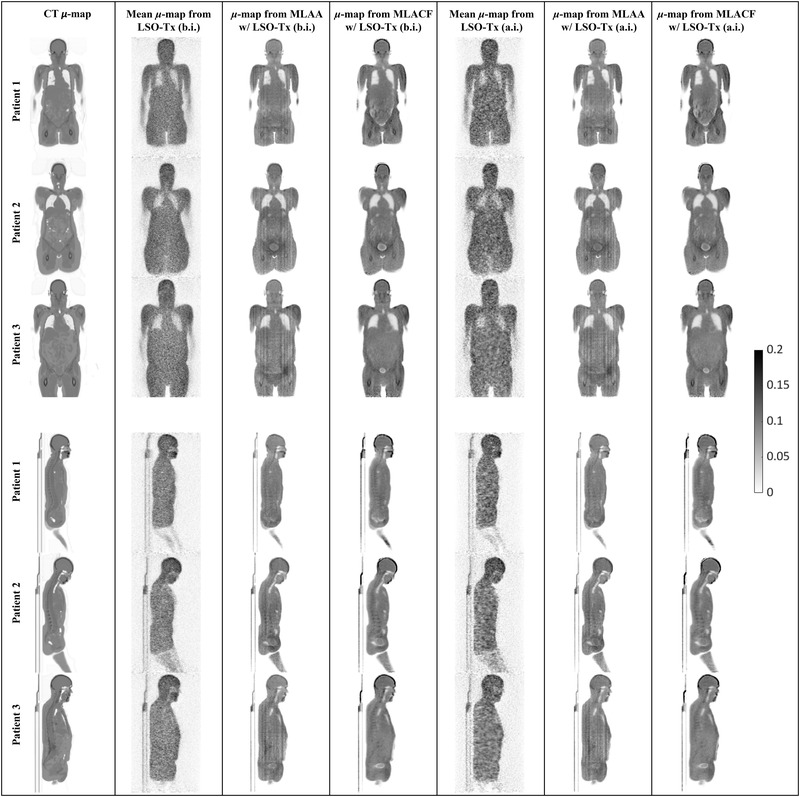
Sample coronal and sagittal slices of attenuation maps (μ‐maps) (in 1/cm) obtained from different techniques; from left to right, each column includes attenuation images from computed tomography (CT), lutetium oxyorthosilicate (LSO) transmission events (Tx) (before injection [b.i.]), maximum likelihood estimation of attenuation and activity (MLAA) initiated with LSO‐Tx μ‐maps (b.i.), maximum likelihood estimation of activity and attenuation correction coefficients (MLACF) initiated with LSO‐Tx μ‐maps (b.i.), LSO‐Tx (after injection [a.i.]), MLAA initiated with LSO‐Tx μ‐maps (a.i.), and MLACF initiated with LSO‐Tx μ‐maps (a.i.)
FIGURE 8.
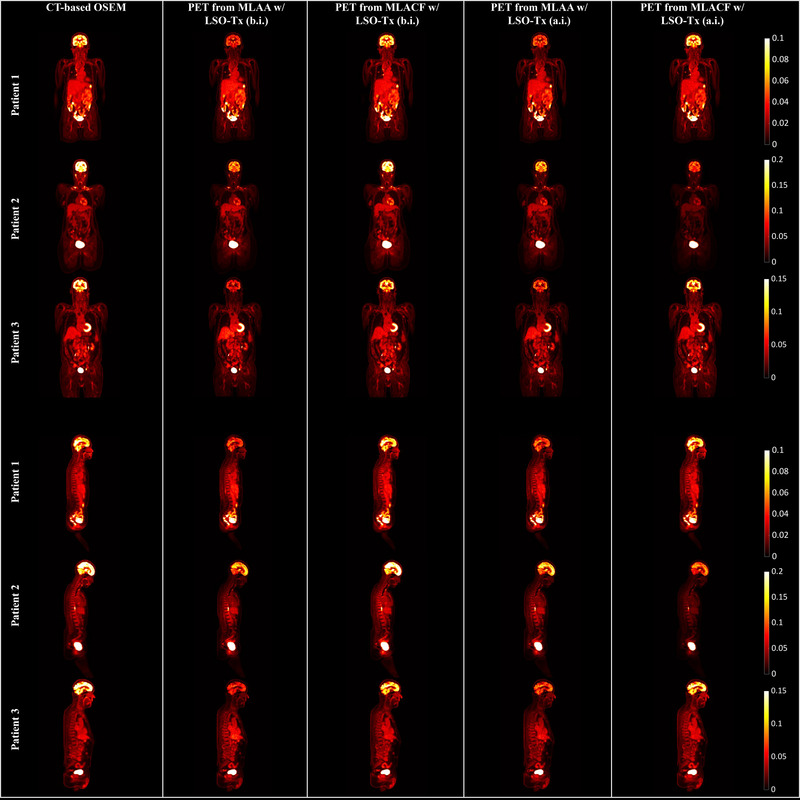
Sample coronal and sagittal slices of positron emission tomography (PET) images obtained from different reconstructions
Attenuation images obtained from joint reconstruction algorithms, as presented in Figure 7, show some crosstalk issues, in particular around the bladder and in MLACF μ‐maps. Also, an overestimation of attenuation coefficients can be seen in the skull bones in MLACF μ‐maps. However, generally, bony structures are better distinguished in MLACF μ‐maps than in the ones from MLAA.
Studying the attenuation and PET images from the joint reconstruction techniques, it appears that the noisy initial LSO‐Tx μ‐maps (LSO‐Tx a.i. images) resulted in images that were closely comparable to the output images when using LSO‐Tx b.i. images as the initial condition. It appears that the underestimation of the attenuation coefficients in the skull in MLAA μ‐maps has resulted in a subsequent underestimation of the brain activity in MLAA PET images.
3.4. Final quantitative PET images
Using the updated μ‐maps from the studied joint reconstruction techniques, Figure 9 shows the final OSEM PET images obtained using μ‐maps from CT, MLAA, and MLACF.
FIGURE 9.
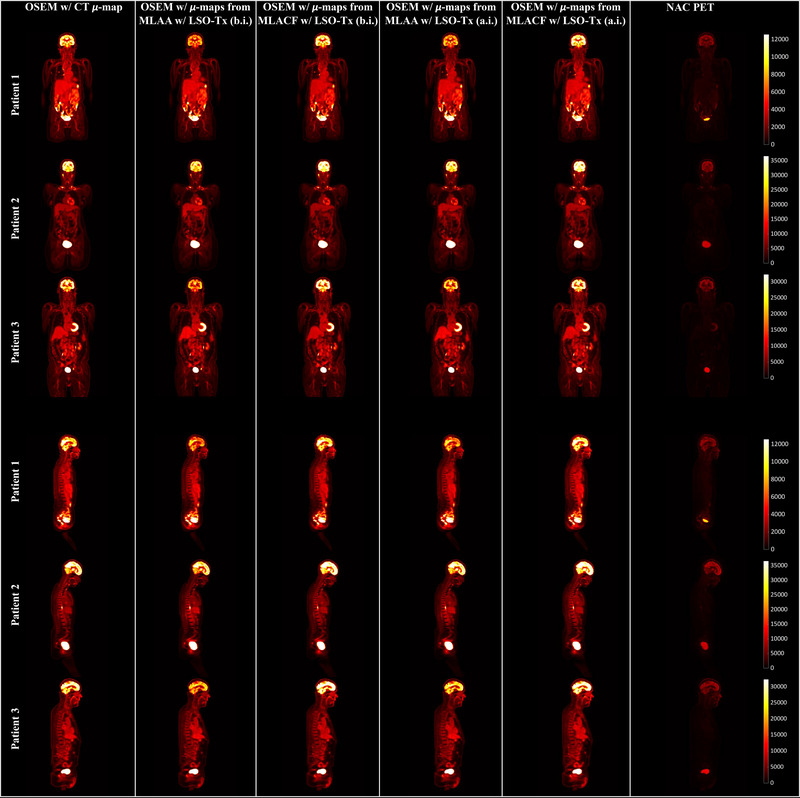
Sample slice of positron emission tomography (PET) images from ordered subset expectation maximization (OSEM) using, from left to right, computed tomography (CT)–based, maximum likelihood estimation of attenuation and activity (MLAA) with lutetium oxyorthosilicate (LSO) transmission events (Tx) before injection (b.i), maximum likelihood estimation of activity and attenuation correction coefficients (MLACF) with LSO‐Tx b.i., MLAA with LSO‐Tx after injection (a.i.), MLACF with LSO‐Tx a.i. attenuation maps, and non‐attenuation‐corrected (NAC) PET data
Quantitative differences between the PET images corrected with CT‐based μ‐maps and with the μ‐maps from the joint reconstruction algorithms are demonstrated in the images in Figure 10. Also, a graph of SUV comparison between the PET images corrected with various μ‐maps for each patient is shown in Figure 11.
FIGURE 10.
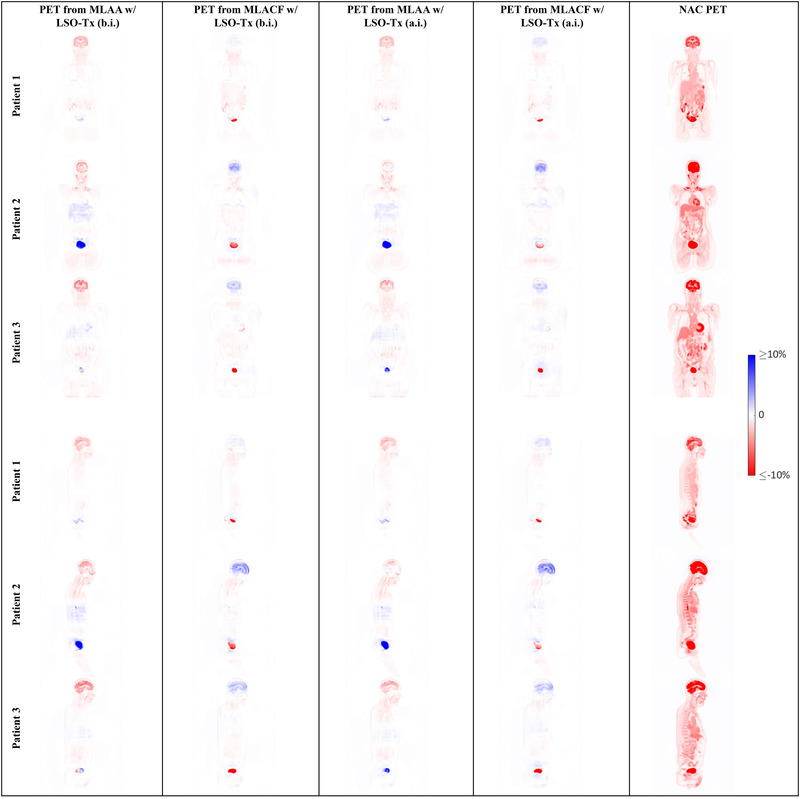
Sample slices showing the relative difference between the positron emission tomography (PET) images corrected with computed tomography–based attenuation maps (μ‐maps) and PET images using the μ‐maps from various joint reconstruction techniques
FIGURE 11.
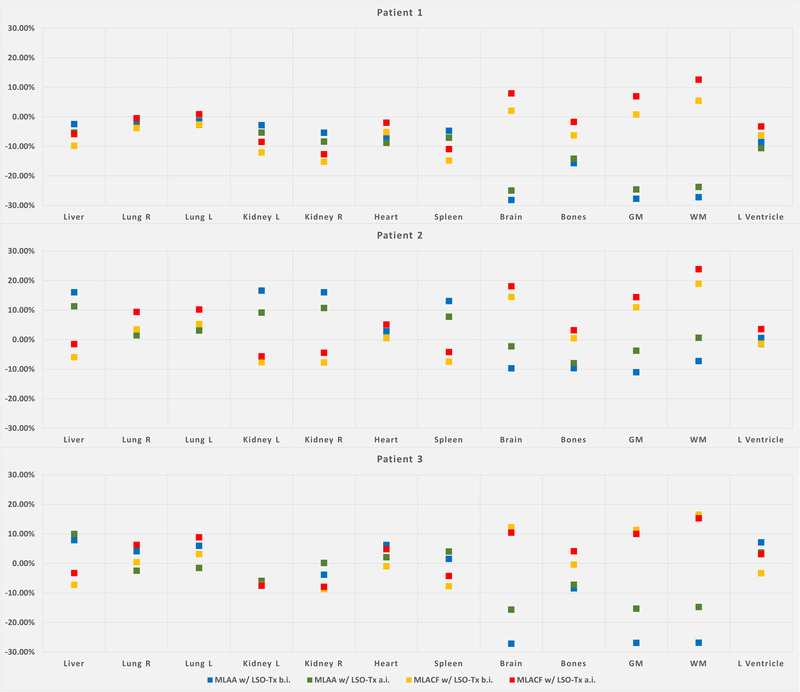
Percentage standardized uptake value difference in various organs between positron emission tomography images obtained using attenuation maps from different joint reconstruction techniques and computed tomography for the three studied patients (GM: grey matter; WM: white matter)
4. DISCUSSION
Long‐axial FOV PET scanners have gained a significant amount of interest in the nuclear medicine society over the recent years. A long‐axial FOV scanner provides far greater geometrical sensitivity than conventional PET scanners, which in turn enables studies that were deemed impossible in the past. One of the great advantages of the increased sensitivity is that the background radiation from lutetium at 202 and 307 keV can be used as an “external source” for transmission tomography. The 202 keV background radiation has a lower flux than 307 keV due to a higher degree of self‐absorption in the originating scintillator. Nonetheless, it was seen that both photon energies can be used in the reconstruction of an initial μ‐map. To evaluate the effects of 511 keV emission photons on the μ‐maps from background radiation, LSO‐Tx before and after the injection of FDG was acquired. Given the absence of a scatter correction technique and the significantly high randoms rate in LSO‐Tx a.i. studies, LSO‐Tx a.i. μ‐maps show inferior image quality in comparison with the LSO‐Tx b.i. μ‐maps. Since these μ‐maps are not corrected for scattered photons, often attenuation coefficients are underestimated. We have therefore scaled these images prior to feeding them into MLAA or MLACF such that the image histogram peak corresponds to the LAC of water at 511 keV (0.096 1/cm). No further scaling was done during the joint reconstruction algorithms.
Given the low photon flux of LSO‐Tx, a long acquisition is ideally preferred. However, to maintain practically, it is desired that the LSO‐Tx be acquired in conjunction with the emission data and not beyond the PET scan time. We evaluated only 5 min of LSO‐Tx data b.i. and a.i. to ensure that the patients can bear the entire PET scan. Despite the low signal‐to‐noise ratio of the LSO‐Tx μ‐maps, the scaled μ‐maps from LSO‐Tx b.i. and a.i. provide reasonable initial condition for a joint activity and attenuation reconstruction algorithm.
It was shown that the initial μ‐maps from LSO‐Tx can be used to estimate scatter, which is a potential solution to the problem of scatter estimation in a joint reconstruction technique. 46 , 47 Comparing scatter sinograms using CT‐based and LSO‐Tx μ‐maps, it was seen that scatter can slightly be underestimated when using LSO‐Tx μ‐maps. The underestimation is largely due to the indistinguishability of the bony structures in the LSO‐Tx μ‐maps. Nevertheless, the scatter sinograms and scatter fractions were in reasonable agreement with the CT‐based scatter data and the use of TOF data reduces the sensitivity to the correctness of scatter estimates. 24
Activity images from joint reconstruction algorithms were not of particular interest as only attenuation images were later used in the final OSEM step. Since attenuation sinograms are updated in MLACF, a back projection of attenuation sinograms was done to reconstruct μ‐maps. In the developed reconstruction algorithm, the attenuation sinograms were compressed transaxially with an azimuthal mashing factor of 8 and axially with a spanning of factor 19. In practice, such high degree of compression does not compromise the PET images given a TOF resolution of less than 250 ps. 48 However, compressed sinograms are not ideal for non‐TOF transmission tomography. Therefore, the μ‐maps obtained from MLAA or the back projection of ACFs from MLACF show visible artefacts and may lead to a systematic overestimation of LACs in some voxels. The explained issue is likely the cause for the overestimation of LACs in the skull in the MLACF μ‐maps. Minimally compressed or fully uncompressed attenuation sinograms are therefore preferred for a joint reconstruction algorithm but can cause practical challenges especially for a long‐axial FOV scanner. A list‐mode joint reconstruction algorithm is under development to further evaluate the effects of data compression on the patient images. Furthermore, the back projection of ACFs has led to an overestimation of ACFs in the lungs in the MLACF μ‐maps. Despite the 225 ps coincidence timing resolution of Siemens Biograph Vision Quadra, μ‐maps from joint reconstruction algorithms show some crosstalk as well. In particular, the bladder and its surrounding area in MLACF μ‐maps are highly affected by the crosstalk issue. The use of a crosstalk mitigation technique such as that by Hwang et al. 49 remains as future work. When comparing MLACF and MLAA μ‐maps, a visual inspection of the μ‐maps reveals that the bony structures are more visible in the MLACF μ‐maps in comparison with the MLAA μ‐maps. Nonetheless, the LAC values for the bones and in particular for the skull appeared to be overestimated. In the absence of CT images, the μ‐maps from MLAA or MLACF are also a means for anatomical correlation of PET images, though they have a diagnostic value that is inferior to CT images, even compared to low‐dose CT scans in a PET/CT scanner. Furthermore, in the presence of CT images, attenuation images from a joint reconstruction technique can also provide a basis for tracking and correcting for patient motion in PET/CT.
Currently, only a limited dataset of three subjects was available for this study. A more thorough investigation with a larger patient dataset is required to better evaluate the quantitative performance of the proposed methods. A quantitative comparison of the final PET images reconstructed using various μ‐maps revealed that the PET images reconstructed with MLACF μ‐maps provide slightly lower quantitative error than the MLAA μ‐maps. For patients 1, 2, and 3, the mean absolute error (averaged over all the studied organs: liver, lungs, kidneys, heart, spleen, brain, and bones) was, respectively, 8.0%, 5.9%, and 5.4% when using MLACF b.i. and 7.7%, 10.2%, and 8.1% when using MLAA b.i. μ‐maps. When using MLACF a.i. μ‐maps, the mean absolute error was 5.7%, 6.9%, and 6.4% and when using MLAA a.i. μ‐maps, the mean absolute error was 8.9%, 6.0%, and 5.5% for patients 1, 2, and 3, respectively. The most noticeable and consistent quantitative difference can be seen in the brain, where MLAA μ‐maps lead to an underestimation while the PET images corrected with the MLACF μ‐maps showed an overestimation of the brain activity. The under‐ and overestimation of the brain activity was seen consistently across the grey and white matter of the brain. Currently, we are working on artificial intelligence approaches to improve the initial condition and reduce crosstalk in the joint reconstruction algorithms. 50
The proposed method also has some limitations that one needs to consider. Ideally, noiseless LSO‐Tx blank data need to be acquired for a long time and periodically as noise in the blank scan data propagates into the μ‐maps. Also, in order to capture LSO‐Tx events, the energy and coincidence timing windows need to be extended when acquiring data. The extended energy and coincidence timing windows (and particularly for long‐axial FOV scanners) essentially create a large list‐mode dataset, which can be much larger than a typical PET list‐mode file. It is therefore desirable to implement an online LSO‐Tx event inspector and/or histogrammer in the scanner front‐end electronics. Also, while the presented work was based on 18F‐FDG studies, it should be noted that nonpure positron emitters can potentially make the separation of background radiation from emission events more challenging, which remains to be investigated in a future study.
5. CONCLUSIONS
In this work, joint reconstruction algorithms for long‐axial FOV scanners were explored. The proposed algorithms benefit from the lutetium background radiation in the scintillators to create an estimate of the μ‐maps, which are then improved in a joint reconstruction algorithm such as MLAA or MLACF. The improved μ‐maps were then used in an OSEM reconstruction algorithm and compared against PET images corrected with CT‐based μ‐maps. The proposed algorithm was evaluated using patient data from a Siemens Biograph Vision Quadra PET/CT scanner. An SUV analysis of the PET images showed a mean quantitative error of up to 6.0% when using MLACF and 7.4% when using MLAA across all the studied organs.
CONFLICT OF INTERESTS
Mohammadreza Teimoorisichani, Vladimir Panin, Harold Rothfuss, and Maurizio Conti are employee of Siemens Medical Solutions USA, Inc. Hasan Sari is an employee of Siemens Healthcare AG.
ACKNOWLEDGMENT
No external funding and material support is declared for this work.
Teimoorisichani M, Panin V, Rothfuss H, Sari H, Rominger A, Conti M. A CT‐less approach to quantitative PET imaging using the LSO intrinsic radiation for long‐axial FOV PET scanners. Med Phys. 2022;49:309–323. 10.1002/mp.15376
DATA AVAILABILITY STATEMENT
Research data are not shared.
REFERENCES
- 1. Huang S‐C, Hoffman EJ, Phelps ME, Kuhl DE. Quantitation in positron emission computed tomography: 2. Effects of inaccurate attenuation correction. J Comput Assist Tomogr. 1979;3(6):804–814. [PubMed] [Google Scholar]
- 2. Burger C, Goerres G, Schoenes S, Buck A, Lonn AH, Von Schulthess GK. PET attenuation coefficients from CT images: experimental evaluation of the transformation of CT into PET 511‐keV attenuation coefficients. Eur J Nucl Med Mol Imaging. 2002;29(7):922–927. 10.1007/s00259-002-0796-3 [DOI] [PubMed] [Google Scholar]
- 3. Holdsworth CH, Levin CS, Farquhar TH, Dahlbom M, Hoffman EJ. Investigation of accelerated Monte Carlo techniques for PET simulation and 3D PET scatter correction. IEEE Trans Nucl Sci. 2001;48(1):74–81. 10.1109/23.910835 [DOI] [Google Scholar]
- 4. Zaidi H, Montandon ML. Scatter compensation techniques in PET. PET Clin. 2007;2(2):219–234. 10.1016/j.cpet.2007.10.003 [DOI] [PubMed] [Google Scholar]
- 5. Levin CS, Dahlbom M, Hoffman EJ. A Monte Carlo correction for the effect of Compton scattering in 3‐D PET brain imaging. IEEE Trans Nucl Sci. 1995;42(4):1181–1185. 10.1109/23.467880 [DOI] [Google Scholar]
- 6. Watson CC, Newport D, Casey ME. A single scatter simulation technique for scatter correction in 3D PET. In: Three‐Dimensional Image Reconstruction in Radiology and Nuclear Medicine. Springer; 1996:255–268. [Google Scholar]
- 7. Watson CC. New, faster, image‐based scatter correction for 3D PET. IEEE Trans Nucl Sci. 2000;47(4):1587–1594. 10.1109/23.873020 [DOI] [Google Scholar]
- 8. Watson C. Extension of single scatter simulation to scatter correction of time‐of‐flight PET. IEEE Trans Nucl Sci. 2007;54(5):1679–1686. 10.1109/tns.2007.901227 [DOI] [Google Scholar]
- 9. Berker Y, Li Y. Attenuation correction in emission tomography using the emission data—a review. Med Phys. 2016;43(2):807–832. 10.1118/1.4938264 [DOI] [PMC free article] [PubMed] [Google Scholar]
- 10. Kops ER, Herzog H. Template Based Attenuation Correction for PET in MR‐PET Scanners: 2008 IEEE Nuclear Science Symposium Conference Record, Dresden, Germany, 19–25 October 2008. IEEE; 2009. [Google Scholar]
- 11. Hofmann M, Pichler B, Scholkopf B, Beyer T. Towards quantitative PET/MRI: a review of MR‐based attenuation correction techniques. Eur J Nucl Med Mol Imaging. 2009;36(Suppl 1):S93–S104. 10.1007/s00259-008-1007-7 [DOI] [PubMed] [Google Scholar]
- 12. Mannheim JG, Schmid AM, Schwenck J, et al. PET/MRI hybrid systems. Semin Nucl Med. 2018;48(4):332–347. 10.1053/j.semnuclmed.2018.02.011 [DOI] [PubMed] [Google Scholar]
- 13. Keereman V, Fierens Y, Broux T, De Deene Y, Lonneux M, Vandenberghe S. MRI‐based attenuation correction for PET/MRI using ultrashort echo time sequences. J Nucl Med. 2010;51(5):812–818. 10.2967/jnumed.109.065425 [DOI] [PubMed] [Google Scholar]
- 14. Mehranian A, Arabi H, Zaidi H. Vision 20/20: magnetic resonance imaging‐guided attenuation correction in PET/MRI: challenges, solutions, and opportunities. Med Phys. 2016;43(3):1130–1155. 10.1118/1.4941014 [DOI] [PubMed] [Google Scholar]
- 15. Keereman V, Holen RV, Mollet P, Vandenberghe S. The effect of errors in segmented attenuation maps on PET quantification. Med Phys. 2011;38(11):6010–6019. 10.1118/1.3651640 [DOI] [PubMed] [Google Scholar]
- 16. Keereman V, Mollet P, Berker Y, Schulz V, Vandenberghe S. Challenges and current methods for attenuation correction in PET/MR. MAGMA. 2013;26(1):81–98. 10.1007/s10334-012-0334-7 [DOI] [PubMed] [Google Scholar]
- 17. Vandenberghe S, Marsden PK. PET‐MRI: a review of challenges and solutions in the development of integrated multimodality imaging. Phys Med Biol. 2015;60(4):R115–R154. 10.1088/0031-9155/60/4/R115 [DOI] [PubMed] [Google Scholar]
- 18. Nuyts J, Dupont P, Stroobants S, Benninck R, Mortelmans L, Suetens P. Simultaneous maximum a posteriori reconstruction of attenuation and activity distributions from emission sinograms. IEEE Trans Med Imaging. 1999;18(5):393–403. 10.1109/42.774167 [DOI] [PubMed] [Google Scholar]
- 19. Shepp LA, Vardi Y. Maximum likelihood reconstruction for emission tomography. IEEE Trans Med Imaging. 1982;1(2):113–122. 10.1109/TMI.1982.4307558 [DOI] [PubMed] [Google Scholar]
- 20. Hudson HM, Larkin RS. Accelerated image reconstruction using ordered subsets of projection data. IEEE Trans Med Imaging. 1994;13(4):601–609. 10.1109/42.363108 [DOI] [PubMed] [Google Scholar]
- 21. Nuyts J, De Man B, Dupont P, Defrise M, Suetens P, Mortelmans L. Iterative reconstruction for helical CT: a simulation study. Phys Med Biol. 1998;43(4):729–737. 10.1088/0031-9155/43/4/003 [DOI] [PubMed] [Google Scholar]
- 22. Salomon A, Goedicke A, Schweizer B, Aach T, Schulz V. Simultaneous reconstruction of activity and attenuation for PET/MR. IEEE Trans Med Imaging. 2011;30(3):804–813. 10.1109/TMI.2010.2095464 [DOI] [PubMed] [Google Scholar]
- 23. Rezaei A, Defrise M, Bal G, et al. Simultaneous reconstruction of activity and attenuation in time‐of‐flight PET. IEEE Trans Med Imaging. 2012;31(12):2224–2233. 10.1109/TMI.2012.2212719 [DOI] [PubMed] [Google Scholar]
- 24. Conti M. Why is TOF PET reconstruction a more robust method in the presence of inconsistent data? Phys Med Biol. 2011;56(1):155–168. 10.1088/0031-9155/56/1/010 [DOI] [PubMed] [Google Scholar]
- 25. Rezaei A, Defrise M, Nuyts J. ML‐reconstruction for TOF‐PET with simultaneous estimation of the attenuation factors. IEEE Trans Med Imaging. 2014;33(7):1563–1572. 10.1109/TMI.2014.2318175 [DOI] [PubMed] [Google Scholar]
- 26. Panin VY, Defrise M, Nuyts J, Rezaei A, Casey ME. Reconstruction of Uniform Sensitivity Emission Image with Partially Known Axial Attenuation Information in PET‐CT Scanners: 2012 IEEE Nuclear Science Symposium and Medical Imaging Conference Record (NSS/MIC), Anaheim, CA, USA, 27 October to 3 November 2012. IEEE; 2013. [Google Scholar]
- 27. Salvo K, Defrise M. sMLACF: a generalized expectation‐maximization algorithm for TOF‐PET to reconstruct the activity and attenuation simultaneously. Phys Med Biol. 2017;62(21):8283–8313. 10.1088/1361-6560/aa82ea [DOI] [PubMed] [Google Scholar]
- 28. Salvo K, Defrise M. Pitfalls in MLAA and MLACF: 2016 IEEE Nuclear Science Symposium, Medical Imaging Conference and Room‐Temperature Semiconductor Detector Workshop (NSS/MIC/RTSD), Strasbourg, France, 29 October to 6 November 2016. IEEE; 2017. [Google Scholar]
- 29. Panin VY, Aykac M, Casey ME. Simultaneous reconstruction of emission activity and attenuation coefficient distribution from TOF data, acquired with external transmission source. Phys Med Biol. 2013;58(11):3649–3669. 10.1088/0031-9155/58/11/3649 [DOI] [PubMed] [Google Scholar]
- 30. Rothfuss H, Panin V, Hong I, et al. LSO Background Radiation as a Transmission Source Using Time of Flight Information: 2013 IEEE Nuclear Science Symposium and Medical Imaging Conference (2013 NSS/MIC), Seoul, Korea (South), 27 October to 2 November 2013. IEEE; 2014. [DOI] [PubMed] [Google Scholar]
- 31. Rothfuss H, Panin V, Moor A, et al. LSO background radiation as a transmission source using time of flight. Phys Med Biol. 2014;59(18):5483–5500. 10.1088/0031-9155/59/18/5483 [DOI] [PubMed] [Google Scholar]
- 32. Teimoorisichani M, Panin V, Rothfuss H, Conti M. Development of a TOF‐MLAA Algorithm Using LSO Background Radiation: 2020 IEEE Nuclear Science Symposium and Medical Imaging Conference (NSS/MIC), Boston, MA, USA, 31 October to 7 November 2020. IEEE; 2021. [Google Scholar]
- 33. Hult M, Vidmar T, Rosengard U, Marissens G, Lutter G, Sahin N. Half‐life measurements of lutetium‐176 using underground HPGe‐detectors. Appl Radiat Isot. 2014;87:112–117. 10.1016/j.apradiso.2013.11.071 [DOI] [PubMed] [Google Scholar]
- 34. Huber JS, Moses WW, Jones WF, Watson CC. Effect of 176Lu background on singles transmission for LSO‐based PET cameras. Phys Med Biol. 2002;47(19):3535–3541. 10.1088/0031-9155/47/19/307 [DOI] [PubMed] [Google Scholar]
- 35. Dorenbos P, de Haas JTM, van Eijk CWE, Melcher CL, Schweitzer JS. Non‐linear Response in the Scintillation Yield of Lu/sub 2/SiO/sub 5/:Ce/sup 3+: 1993 IEEE Conference Record Nuclear Science Symposium and Medical Imaging Conference, San Francisco, CA, USA, 31 October to 6 November 1993. IEEE; 1994. [Google Scholar]
- 36. Conti M, Eriksson L, Rothfuss H, et al. Characterization of (176)Lu background in LSO‐based PET scanners. Phys Med Biol. 2017;62(9):3700–3711. 10.1088/1361-6560/aa68ca [DOI] [PubMed] [Google Scholar]
- 37. Cates JW, Levin CS. Advances in coincidence time resolution for PET. Phys Med Biol. 2016;61(6):2255–2264. 10.1088/0031-9155/61/6/2255 [DOI] [PubMed] [Google Scholar]
- 38. Berg E, Cherry SR. Innovations in instrumentation for positron emission tomography. Semin Nucl Med. 2018;48(4):311–331. 10.1053/j.semnuclmed.2018.02.006 [DOI] [PMC free article] [PubMed] [Google Scholar]
- 39. Prenosil GA, Hentschel M, Fürstner M, Sari H, Rominger A. NEMA NU 2–2018 performance measurements of Biograph Vision Quadra PET/CT system. presented at the 59. Nuklearmedizin. 2021;60:152. [Google Scholar]
- 40. Mehranian A, Zaidi H. Joint estimation of activity and attenuation in whole‐body TOF PET/MRI using constrained gaussian mixture models. IEEE Trans Med Imaging. 2015;34(9):1808–1821. 10.1109/TMI.2015.2409157 [DOI] [PubMed] [Google Scholar]
- 41. van Griethuysen JJM, Fedorov A, Parmar C, et al. Computational radiomics system to decode the radiographic phenotype. Cancer Res. 2017;77(21):e104–e107. 10.1158/0008-5472.CAN-17-0339 [DOI] [PMC free article] [PubMed] [Google Scholar]
- 42. Beare R, Lowekamp B, Yaniv Z. Image segmentation, registration and characterization in R with simple ITK. J Stat Softw. 2018;86:1–35. 10.18637/jss.v086.i08 [DOI] [PMC free article] [PubMed] [Google Scholar]
- 43. Yaniv Z, Lowekamp BC, Johnson HJ, Beare R. SimpleITK image‐analysis notebooks: a collaborative environment for education and reproducible research. J Digit Imaging. 2018;31(3):290–303. 10.1007/s10278-017-0037-8 [DOI] [PMC free article] [PubMed] [Google Scholar]
- 44. Lowekamp BC, Chen DT, Ibanez L, Blezek D. The design of SimpleITK. Front Neuroinform. 2013;7:45. 10.3389/fninf.2013.00045 [DOI] [PMC free article] [PubMed] [Google Scholar]
- 45. Vandenberghe S, Mikhaylova E, D'Hoe E, Mollet P, Karp JS. Recent developments in time‐of‐flight PET. EJNMMI Phys. 2016;3(1):3. 10.1186/s40658-016-0138-3 [DOI] [PMC free article] [PubMed] [Google Scholar]
- 46. Hwang D, Kim KY, Choi H, Lee JS. A solution for scatter estimation problem in simultaneous reconstruction, and its impact on deep learning based attenuation correction. J Nucl Med. 2021;62:58. [Google Scholar]
- 47. Zhu W, Feng T, Dong Y, Bao J, Li H. A Systematic Study on Factors Influencing the Accuracy of MLAA: 2017 IEEE Nuclear Science Symposium and Medical Imaging Conference (NSS/MIC), Atlanta, GA, USA, 21–28 October 2017. IEEE; 2018. [Google Scholar]
- 48. Panin VY, Aykac M, Hong I. TOF Data Compression on High Time Resolution Clinical Scanner: 2018 IEEE Nuclear Science Symposium and Medical Imaging Conference Proceedings (NSS/MIC), Sydney, NSW, Australia, 10–17 November 2018. IEEE; 2019. [Google Scholar]
- 49. Hwang D, Kim KY, Kang SK, et al. Improving the accuracy of simultaneously reconstructed activity and attenuation maps using deep learning. J Nucl Med. 2018;59(10):1624–1629. 10.2967/jnumed.117.202317 [DOI] [PubMed] [Google Scholar]
- 50. Zhu G, Jiang B, Tong L, Xie Y, Zaharchuk G, Wintermark M. Applications of deep learning to neuro‐imaging techniques. Front Neurol. 2019;10:869. 10.3389/fneur.2019.00869 [DOI] [PMC free article] [PubMed] [Google Scholar]
Associated Data
This section collects any data citations, data availability statements, or supplementary materials included in this article.
Data Availability Statement
Research data are not shared.


