

Abstract
Background
Racial disparities in the uptake of cancer genetic services are well documented among African American (AA) women. Understanding the multiple social and psychological factors that can influence the uptake of genetic testing among AA women is needed.
Methods
Data came from 270 AA women diagnosed with ovarian cancer and participating in a population‐based, case‐control study of ovarian cancer who were asked about genetic testing. Logistic regression analyses tested the associations of predisposing, enabling, and need factors with reported genetic testing uptake.
Results
One‐third of the sample (35%) reported having had genetic testing. In the multivariable model, AA women with higher incomes had more than double the odds of being tested than those with the lowest income (odds ratio [OR] for $25,000‐$74,999, 2.04; 95% confidence interval [CI], 1.06‐3.99; OR for ≥$75,000, 2.32; 95% CI, 0.92‐5.94). AA women who reported employment discrimination were significantly less likely to report genetic testing than those who did not report job discrimination (OR, 0.39; 95% CI, 0.14‐0.95). Marital status, Medicaid versus other insurance, prayer frequency, and perceived social support were significantly associated with genetic testing uptake in bivariate analyses but were not significant contributors in multivariable analyses.
Conclusions
Consistent with other studies of AA women, a minority of African American Cancer Epidemiology Study participants had undergone genetic testing. Having a lower income and experiencing job discrimination decreased the likelihood of testing. These results provide foundational evidence supporting the need for interventions to improve the uptake of genetic testing among AA women by reducing cost barriers and providing credible assurances that genetic results will be kept private and not affect social factors such as employability.
Keywords: African American, disparities, genetic testing, ovarian cancer, prevention
Short abstract
African American women with lower incomes who have experienced job discrimination are less likely to undergo testing. These results support the need for interventions to reduce cost barriers and provide credible assurances that genetic results will be kept private and not affect social factors such as employability.
Introduction
Since 2007, the National Comprehensive Cancer Network has recommended that all women diagnosed with high‐grade ovarian, fallopian tube, or peritoneal cancer be offered genetic counseling for BRCA1/2. 1 , 2 Racial disparities in the uptake of genetic counseling and testing are well documented, with notable and consistently lower uptake among African American (AA) women compared with White women. 3 , 4 , 5
When referred, AA women are less likely than White women to seek genetic counseling and testing when they are determined eligible. 5 , 6 Interventions aimed at increasing access to and uptake of genetic counseling and testing services (eg, telegenetic counseling) have not uniformly shown improvements for AA women. 7 , 8 Studies of genetic testing uptake among minority groups conclude that despite their generally positive attitudes toward genetic services, a number of concerns (eg, confidentiality, discrimination, and health care–related trust) inhibit their uptake of genetic counseling and testing. 6 , 9 , 10 , 11 , 12 , 13 However, to date, the relative contributions of multiple psychosocial factors to the uptake of genetic services among AA women have yet to be explored.
Two conceptual frameworks can be applied to consider multivariable factors inhibiting AAs from seeking genetic services. Critical race theory 14 suggests that AAs' lived experiences within social systems characterized by endemic structural racism inhibit access and shape their expectations regarding the benefits and harms of genetic services. 15 Applying this thinking to genetic service uptake, we posit that AA women who have experienced discrimination perceive that the risks of genetic services outweigh the potential benefits. Indeed, previous evidence suggests that individuals reporting more everyday discrimination experiences also report lower levels of health care utilization, including genetic services. 16 In the context of genetic testing, as described previously, AA women cite distrust of how genetic information might be used against them as a deterrent to uptake. 4 Additionally, structural racism contributes to fewer income and education opportunities, and this in turn limits access to health care and inhibits the uptake of genetic testing. Social assets, including strong religiosity and available social support, have had a mixed association with the uptake of genetic testing. 12 For example, religiosity has been both negatively and positively associated with genetic service uptake among AAs. 12 , 13 Similarly, Andersen's Access to Care Model 17 , 18 is widely applied in health services contexts to conjointly consider multiple influences on health care uptake. Andersen's conceptualization holds that the perceived need for genetic testing (eg, a cancer diagnosis or family history) is driven by predisposing factors that impede the uptake of genetic testing (eg, education and distrust due to discrimination experiences) and personal and community factors that enable uptake (eg, religiosity and social support).
We analyzed survey data from a prospective, observational study of AA women diagnosed with ovarian cancer. The observational study included assessments of a complement of psychosocial factors that align with critical race theory and the Access to Care Framework (Fig. 1).
Figure 1.
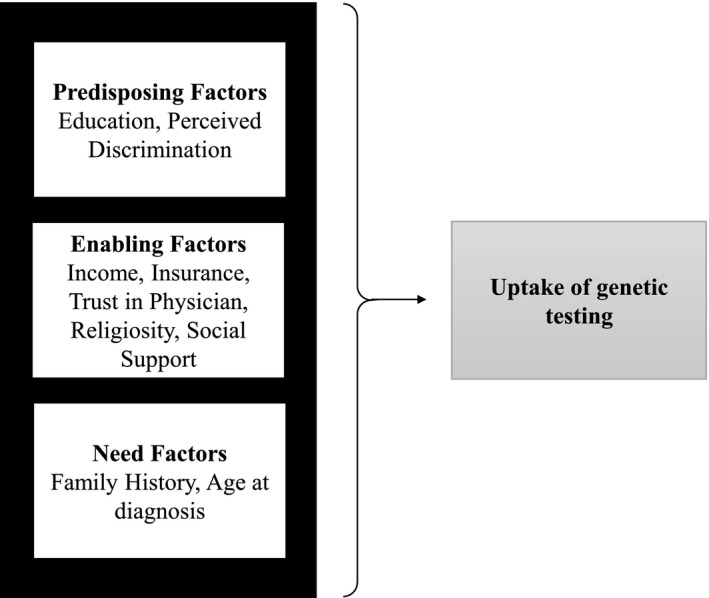
Conceptual model of factors associated with the uptake of genetic testing.
Materials and Methods
Study Population
The African American Cancer Epidemiology Study (AACES) is a multisite, population‐based, case‐control study of ovarian cancer. Detailed study methods have been reported elsewhere. 19 Briefly, study sites were selected on the basis of geographic regions with large AA populations and included Alabama, Georgia, Louisiana, metropolitan Detroit, Michigan, New Jersey, North Carolina, Ohio, South Carolina, Tennessee, and Texas. Women were eligible to participate if they self‐identified as AA or Black, were 20 to 79 years old at diagnosis, had histologically confirmed epithelial ovarian cancer, and had the ability to complete an interview in English. The protocol and study materials were approved by the institutional review boards at all participating sites and at Duke University, the lead institution.
AACES Recruitment and Data Collection
Rapid case ascertainment was used to identify cases through state cancer or Surveillance, Epidemiology, and End Results registries and through gynecologic oncology departments at individual hospitals. Participants were recruited between December 2010 and December 2015. Once enrolled, participants completed a baseline telephone survey that collected information on the following: sociodemographic characteristics, medical history, self‐reported family history of cancer, lifestyle characteristics, perceived daily and lifetime discrimination, religiosity, health insurance status, health care provider access, and trust in health care providers. Participants completed a 12‐month follow‐up survey that reassessed topics from the baseline survey with some additional measures, including ever having genetic testing.
A total of 546 cases completed the full baseline survey. One hundred twenty‐seven of these cases were not approached for follow‐up because of late recruitment to the study, 51 participants completed a shortened survey without psychosocial measures, and 276 were not included. The final analytic sample comprised the 270 cases who completed the full baseline and follow‐up surveys and responded to the genetic testing question. There were no statistically significant differences in predisposing, enabling, or need factors between those excluded (n = 276) and those included (n = 270; Table 1).
TABLE 1.
Participant Characteristics by Genetic Testing Status
| Andersen Access to Care Construct | Excluded AACES Cases (n = 276) | Self‐Reported Genetic Testing | P | |
|---|---|---|---|---|
| Yes (n = 94) | No (n = 176) | |||
| Predisposing | ||||
| Highest level of education, No. (%) | .136 | |||
| High school or less | 122 (44.2) | 33 (35.1) | 88 (50.0) | |
| Some college | 69 (25.0) | 28 (29.8) | 40 (22.7) | |
| College graduate | 54 (19.6) | 20 (21.3) | 28 (15.9) | |
| Graduate degree | 31 (11.2) | 13 (13.8) | 20 (11.4) | |
| Perceived Everyday Discrimination Score, mean (SD) | 2.21 (3.36) | 2.54 (3.17) | 2.23 (3.42) | .460 |
| For unfair reasons, have you ever been not hired for a job?, No. (%) | 39 (14.2) | 7 (7.5) | 27 (15.5) | .094 |
| Enabling | ||||
| Annual family income, No. (%) | .001 | |||
| <$10,000 | 66 (24.5) | 7 (7.4) | 44 (25.4) | |
| $10,000‐$24,999 | 58 (21.6) | 20 (21.3) | 48 (27.7) | |
| $25,000‐$49,999 | 61 (22.7) | 30 (31.9) | 42 (24.3) | |
| $50,000‐$74,999 | 42 (15.6) | 16 (17.0) | 21 (12.1) | |
| $75,000‐$100,000 | 24 (8.9) | 12 (12.8) | 13 (7.5) | |
| >$100,000 | 18 (6.7) | 9 (9.6) | 5 (2.9) | |
| Marital status, No. (%) | .035 | |||
| Single | 76 (27.5) | 11 (11.7) | 44 (25.0) | |
| Partnered | 89 (32.2) | 37 (39.4) | 58 (33.0) | |
| Widowed/divorced | 111 (40.2) | 46 (48.9) | 74 (42.0) | |
| Have a primary care provider, No. (%) | 220 (79.7) | 85 (90.4) | 145 (82.4) | .111 |
| Have health insurance, No. (%) | 253 (91.7) | 93 (98.9) | 160 (90.9) | .020 |
| Insurance type, No. (%) | .002 | |||
| Medicaid or none | 91 (33.1) | 19 (20.2) | 69 (39.2) | |
| Other | 184 (66.9) | 75 (79.8) | 107 (60.8) | |
| Total Trust in Physician score, mean (SD) | 38.9 (13.6) | 40.22 (11.5) | 39.53 (10.8) | .627 |
| Very religious or spiritual (3 categories), No. (%) | .489 | |||
| Not/slightly | 13 (4.75) | 4 (4.3) | 13 (7.4) | |
| Moderately | 81 (29.6) | 30 (31.9) | 48 (27.3) | |
| Very | 180 (65.7) | 60 (63.8) | 115 (65.3) | |
| Religious service attendance, No. (%) | .195 | |||
| ≤1 time a month | 70 (25.4) | 15 (16.0) | 46 (26.1) | |
| 2‐3 times a month | 46 (16.7) | 13 (13.8) | 23 (13.1) | |
| 1 time a week | 107 (38.8) | 45 (47.9) | 65 (36.9) | |
| Several times a week | 53 (19.2) | 21 (22.3) | 42 (23.9) | |
| Frequency of prayer, No. (%) | .006 | |||
| ≤1 time a week | 9 (3.3) | 1 (1.1) | 7 (4.0) | |
| Several times a week | 6 (2.2) | 0 (0.0) | 8 (4.5) | |
| 1‐2 times a day | 79 (28.6) | 32 (34.0) | 33 (18.8) | |
| Many times a day | 182 (65.9) | 61 (64.9) | 128 (72.7) | |
| Religion/spirituality involved in dealing with stressful situations, No. (%) | .790 | |||
| Not at all/not very | 7 (2.5) | 2 (2.1) | 6 (3.4) | |
| Somewhat | 41 (14.9) | 9 (9.6) | 19 (10.8) | |
| Very | 228 (82.6) | 83 (88.3) | 151 (85.8) | |
| Perceived Social Support, mean (SD) | 4.20 (0.70) | 4.36 (0.56) | 4.22 (0.65) | .078 |
| Need | ||||
| Family history risk, No. (%) | .096 | |||
| Low risk | 182 (74.0) | 55 (61.8) | 119 (73.0) | |
| Medium risk | 32 (13.0) | 12 (13.5) | 21 (12.9) | |
| High risk | 32 (13.0) | 22 (24.7) | 23 (14.1) | |
| Age at diagnosis ≤ 55 y, No. (%) | 119 (44.9) | 40 (43.5) | 61 (35.7) | .268 |
Abbreviation: AACES, African American Cancer Epidemiology Study.
The P value compares the values between genetic testing groups.
Statistical Analyses
Univariate analyses were conducted to characterize variable distributions and missing data. In the sample of 270 people, there was less than 10% missing data for any of the study variables. Bivariate analyses were conducted to test associations of the predisposing, enabling, and need factors with genetic testing uptake. Because of the binary outcome variable and continuous/interval covariates and predictors, a point‐biserial correlation analysis was conducted. The point‐biserial correlation is mathematically equivalent to the Pearson correlation function 20 ; therefore, Pearson correlation coefficients were used to assess the associations between the study variables. To consider potential confounding effects on the outcome variable, a multivariable logistic regression model including all covariates and predictors was conducted. For this analysis, the variance inflation factor values were significantly under the recommended value of 10, and this indicated little evidence for confounding.
Multivariable logistic regression was performed to calculate odds ratios and 95% confidence intervals (CIs) for factors found in bivariate analyses to be associated with uptake of genetic testing at the P < .10 level of significance for inclusion in the multivariable logistic regressions. For the multivariable logistic regression analyses, conceptually aligned response options for these covariates were collapsed to facilitate interpretation. Odds ratios and 95% CIs were computed and reported when the CI did not include 1. All analyses were performed with SAS version 9.4.
Measures
Outcome
Genetic testing was assessed with the following question: “Have you ever had genetic testing to determine a gene mutation for ovarian or breast cancer?” Participants were asked to respond to this question at each follow‐up that they completed. If the participants ever reported genetic testing, they were coded as having genetic testing, and if at no follow‐up the participants reported genetic testing, they were coded as not having genetic testing.
Predisposing factors
Education was assessed with the following question: “What is the highest level of school you have completed?” Eight response categories, ranging from ≤8th grade to a graduate or professional degree, were offered.
Perceived discrimination was assessed with the 5‐item Williams Everyday Discrimination Scale (Cronbach α = 0.76). The following is an example of an item: “In your day‐to‐day life, how often have any of the following things happened to you: you are treated with less courtesy or respect than other people?” Response options ranged from never to almost every day. Responses were averaged with a range of 0 to 5. The 6‐item Perceived Major Experiences of Discrimination Scale was also assessed. 21 , 22 The Cronbach α for the scale was low at 0.56. Item analysis showed that 1 item—“For unfair reasons, have ever not been hired for a job?” (yes/no)—differed significantly when it was crossed with ever have genetic testing versus not being tested (7.5% and 15.5%, respectively; P = .09), and it was included as a predisposing factor.
Enabling factors
Annual family income was assessed categorically with 5 categories ranging from “less than $10,000” to “more than $100,000.”
Health insurance was assessed with the following question: “Do you currently have health insurance or some form of health coverage?” The response options were yes and no. Given that virtually all participants reported having health insurance (93%), we also considered the type of insurance in analyses as “Medicaid or no insurance” versus any other insurance source.
The health care provider status was assessed with the following question: “Do you have a person that you consider your regular doctor or health care provider?” The response options were yes and no.
Trust in physicians was measured with the Trust in Physician Scale. 23 An example of a question is “I trust my doctor so much I always try to follow his/her advice.” Five response options ranging from 1 (strongly disagree) to 5 (strongly agree) were offered. Responses were reverse‐coded as appropriate and summed across 11 questions in the survey about trust with a range of 0 to 55, where higher scores indicated higher levels of trust. In this analytic sample, the Cronbach α was 0.91.
Social Support: Perceived social support was measured with the 12‐item Multidimensional Scale for Perceived Social Support 24 (eg, an example of an item is “I get the emotional help and support I need from my family,” with response options ranging from strongly disagree to strongly agree). The Cronbach α for the scale was 0.94. Responses were summed and averaged with a range of 1 to 5; higher scores indicated greater perceived social support.
Religious and spiritual beliefs were assessed with the 4‐item Brief Multidimensional Measure of Religiousness/Spirituality 25 (eg, an example of an item is “How often do you attend religious services?”).
Need factors
The age at diagnosis was assessed on the basis of the difference between the date of diagnosis and the date of birth.
The family history was calculated on the basis of the reported number of first‐degree female relatives (parents, siblings, and daughters) who had been diagnosed with BRCA1/2‐related cancers (ie, breast and ovarian cancers) and the age of diagnosis (<50 vs ≥50 years). Familial risk was ranked as 1) low risk (those with no first‐degree relatives with a history of breast or ovarian cancer), 2) medium risk (those with at least 1 first‐degree relative diagnosed with breast cancer at an age ≥ 50 years), or 3) high risk (those with at least 1 first‐degree relative diagnosed with breast cancer under the age of 50 years and/or any family history of ovarian cancer). These classifications were adapted from previous studies that used National Health Interview Survey data. 26
Results
Of the 270 women, 94 (35%) reported ever having had genetic testing. Thirty‐eight percent of the women reported being diagnosed with ovarian cancer at an age younger than 55 years, and 30% were at medium or greater risk for carrying a BRCA1/2 mutation on the basis of their family history. The women had a mean age of 58.4 years, with 61.6% being older than 55 years. The majority were not partnered (67% were single or widowed/divorced), and most had health insurance and a health care provider (92% and 84%, respectively). One‐third of the women reported a college degree or greater, and 28% reported a family income greater than $50,000.
With respect to predisposing factors, differences in education by genetic testing status were not significant (P = .14). Experiences of everyday discrimination also did not differ by genetic testing status (P = .46; Table 1). However, those who reported job discrimination experiences were marginally less likely to report having genetic testing than those who had not experienced such discrimination (15.5% vs 7.5%; P = .09).
As shown in Table 1, for enabling factors, those who had genetic testing reported significantly higher annual household income (P = .001) and were more likely to have health insurance other than Medicaid (P = .002) than those who had not been tested. Women who reported being single were less likely to have had genetic testing than those who had been or were partnered (P = .035). Women who reported more frequent praying were less likely to have had genetic testing than those who prayed less frequently (P = .006). Additionally, women who perceived greater social support were marginally more likely to have genetic testing than those with lower levels of perceived support (mean level of support, 4.36 vs 4.22; P = .078). There were no differences in the reported uptake of genetic testing by having a primary care provider or trust in a health care provider.
With respect to need factors, in bivariate analyses, AA women who had undergone genetic testing were marginally more likely to have a family history indicating a medium or high risk for a BRCA1/2 mutation based on family history (P = .096). There were no differences in genetic service uptake based on the age at diagnosis alone.
Multivariable Model
The predisposing, enabling, and need factors associated with genetic testing uptake at the P < .10 level of significance were tested in a multivariable logistic regression. These included experiences of not being hired for unfair reasons, income, marital status, Medicaid or no insurance, frequency of prayer, social support, and family history. Results showed that the odds of having genetic testing for those who had experienced not being hired for a job for unfair reasons were 0.39 (95% CI, 0.14‐0.95) times the odds for those who had not had the discriminatory experience (Table 2). Women in the highest family income category had a 2.3 times greater likelihood of being tested in comparison with those with the lowest family income. Family history, Medicaid or no‐insurance status, marital status, frequency of prayer, and perceived social support were not significant contributors to uptake of genetic testing in the multivariable model.
TABLE 2.
Multivariable Logistic Regression Predicting Genetic Testing Status
| Characteristic | Β (SE) | Odds Ratio | 95% CI | P |
|---|---|---|---|---|
| Predisposing | ||||
| For unfair reasons, have you ever been not hired for a job? | ||||
| No | — | 1.0 | Referent | — |
| Yes | –0.94 (0.47) | 0.39 | 0.14‐0.95 | .048 |
| Highest level of education | ||||
| High school or less | — | 1.0 | Referent | — |
| More than high school | 0.15 (0.33) | 1.16 | 0.60‐2.22 | .660 |
| Enabling | ||||
| Annual family income | ||||
| < $24,999 | — | 1.0 | Referent | — |
| $25,000‐$74,999 | 0.71 (0.34) | 2.04 | 1.06‐3.99 | .034 |
| ≥ $75,000 | 0.84 (0.47) | 2.32 | 0.92‐5.94 | .076 |
| Marital status | ||||
| Partnered | — | 1.0 | Referent | — |
| Single | –0.51 (0.40) | 0.60 | 0.26‐1.28 | .199 |
| Insurance type | ||||
| Medicaid or none | — | 1.0 | Referent | — |
| Other | 0.44 (0.36) | 1.56 | 0.77‐3.21 | .220 |
| Frequency of prayer | ||||
| Many times a day | — | 1.0 | Referent | — |
| Not many times a day | 0.42 (0.30) | 1.52 | 0.84‐2.76 | .162 |
| Perceived Social Support | 0.25 (0.26) | 1.28 | 0.77‐2.18 | .345 |
| Need | ||||
| Family history risk | ||||
| Low | — | 1.0 | Referent | — |
| Medium/high | 0.52 (0.31) | 1.68 | 0.92‐3.10 | .093 |
Abbreviation: CI, confidence interval.
The χ2 likelihood ratio was 29.273; the overall model P value was .0006.
Discussion
To our knowledge, this is the first study of the uptake of genetic testing among AA women with ovarian cancer. Thirty‐five percent of AA women with ovarian cancer who completed the follow‐up AACES survey reported having had genetic testing. In accordance with differing recommendations, these genetic testing rates were higher than those reported in the context of breast cancer; 26.7% was reported by McCarthy and colleagues 27 in a population‐based study of AA women diagnosed with breast cancer. Others 28 have reported substantially higher rates of genetic testing uptake (58%) among AA women. However, these higher rates were found when the denominator was based on women who received genetic counseling, were deemed eligible, and were then referred for genetic testing. Neither the current study nor the McCarthy study assessed whether women had undergone genetic counseling and been advised to have genetic testing but decided otherwise. However, on the basis of National Comprehensive Cancer Network guidelines, all of the women in our sample, by virtue of their ovarian cancer diagnosis, were appropriate for referral to genetic testing.
In this study, we found that the AA women with ovarian cancer who reported discriminatory hiring, lower income, and being single were least likely to report having had genetic testing. Other factors related to religiosity/spirituality, family history, Medicaid health insurance, health care provider trust, and everyday experiences of discrimination were not statistically significantly associated with genetic testing uptake despite prior evidence indicating that these concerns limit uptake. 4
This study is among the few to assess well‐validated discrimination measures. Although the reliability of the everyday discrimination scale was replicated in this sample, the major discrimination scale had poor internal consistency in this sample. This may be due to the characteristics of the sample, including the high levels of insurance coverage and the relatively high levels of trust participants reported in their health care provider. Women with more extensive experience with major discrimination may have self‐selected out of study participation, and this could have limited variability in responses to the items.
It is also noteworthy that the 2 discrimination scales assess conceptually distinct aspects of discrimination. Everyday experiences are thought to tap into chronic slights and hassles based on race, 29 whereas major discrimination experiences can be past experiences of racial bias that are thought to have a negative effect on social standing. 30 Accordingly, differences have been found in the association of these measures with health outcomes. 21 , 31 Everyday discrimination has been negatively associated with mental health outcomes, 21 , 31 whereas major discrimination has been negatively associated with self‐rated health. 32 Others have recommended that this distinction be more carefully considered when one is conceptualizing how discrimination experiences—whether daily or over a lifetime—influence health outcomes. 21 , 31 For example, in considering AA women's general reticence to access genetic services, one might start with the premise that major discrimination experiences, more than everyday ones, activate AA women's perception that unfair systems increase the potential for misuse of genetic test results. Accordingly, measures of perceived discrimination that can be tied more closely to this conceptualization should be considered. This work could be informative in directing communication approaches to increase AA women's access to genetic services.
The AACES sample showed relatively comparable levels of discriminatory experiences as reported by others. For example, Glover and colleagues 33 reported the mean everyday discrimination score for the Jackson Heart Study participants to be 2.1 (SD, 1.02), whereas 2.3 (SD, 3.35) was reported for AACES cases. These levels could be regarded as relatively modest and may reflect study recruitment processes whereby AA women with discrimination experiences opted out of research participation. The same pattern was observed for provider trust, social support, and religiosity. 33 This suggests that AAs who agree to participate in genetics‐related research have considerable social capital that could lessen their concerns about unfair treatment. This line of reasoning suggests that, if anything, the prevalence of cancer genetic testing observed in the current study may overestimate the true prevalence.
The study does have limitations worth noting. The major discrimination experience was noted by a single item because of the poor internal consistency of the overall scale. Genetic counseling was not assessed; thus, we were unable to assess what proportion of women were referred to and underwent counseling, which would have clarified the results. Reported levels of spirituality and trust in health care were highly skewed.
In conclusion, this report is among the few in the literature to examine multifaceted and conceptually based factors related to the uptake of genetic testing among AA survivors. Despite more than a decade of recommendations that women with ovarian cancer receive genetic services, uptake remains concerningly low among AA women. If we are to foster equity in access to prevention advances, we must proactively direct genetic services to AA survivors who have low social capital and carefully consider factors related to discrimination that inhibit genetic service seeking among those who could benefit most.
Funding Support
Funding was provided by the National Cancer Institute of the National Institutes of Health of the US Department of Health and Human Services (CA142081 and CA237318).
Conflict of Interest Disclosures
Lauren C. Peres reports funding from the National Cancer Institute to her institution (K99/R00CA218681). The other authors made no disclosures.
Author Contributions
Colleen M. McBride: Conceptual model, writing and revision of the manuscript, and approval of the final version. Sarita Pathak: Conceptual model, data analysis, and writing and revision of the manuscript. Courtney E. Johnson: Data analysis and writing and revision of the manuscript. Anthony J. Alberg: Original African American Cancer Epidemiology Study (AACES) investigator and comments and feedback on the manuscript (specifically the methods and the interpretation of the results). Elisa V. Bandera: Original AACES investigator and comments and feedback on the manuscript (specifically the methods and the interpretation of the results). Jill S. Barnholtz‐Sloan: Original AACES investigator and comments and feedback on the manuscript (specifically the methods and the interpretation of the results). Melissa L. Bondy: Original AACES investigator and comments and feedback on the manuscript (specifically the methods and the interpretation of the results). Michele L. Cote: Original AACES investigator and comments and feedback on the manuscript (specifically the methods and the interpretation of the results). Patricia G. Moorman: Original AACES investigator and comments and feedback on the manuscript (specifically the methods and the interpretation of the results). Lauren C. Peres: Original AACES investigator and comments and feedback on the manuscript (specifically the methods and the interpretation of the results). Edward S. Peters: Original AACES investigator and comments and feedback on the manuscript (specifically the methods and the interpretation of the results). Ann G. Schwartz: Original AACES investigator and comments and feedback on the manuscript (specifically the methods and the interpretation of the results). Paul D. Terry: Original AACES investigator and comments and feedback on the manuscript (specifically the methods and the interpretation of the results). Joellen M. Schildkraut: Original AACES investigator, access to data, writing and revision of the manuscript, and approval of the final version.
McBride CM, Pathak S, Johnson CE, Alberg AJ, Bandera EV, Barnholtz‐Sloan JS, Bondy ML, Cote ML, Moorman PG, Peres LC, Peters ES, Schwartz AG, Terry PD, Schildkraut JM. Psychosocial factors associated with genetic testing status among African American women with ovarian cancer: Results from the African American Cancer Epidemiology Study. Cancer.2022. 10.1002/cncr.34053
References
- 1. Armstrong DK, Alvarez RD, Bakkum‐Gamez JN, et al. NCCN Guidelines Insights: Ovarian Cancer, Version 1.2019: featured updates to the NCCN guidelines. J Natl Compr Canc Netw. 2019;17:896‐909. doi: 10.6004/jnccn.2019.0039 [DOI] [PubMed] [Google Scholar]
- 2. Pruthi S, Gostout BS, Lindor NM. Identification and management of women with BRCA mutations or hereditary predisposition for breast and ovarian cancer. Mayo Clin Proc. 2010;85:1111‐1120. doi: 10.4065/mcp.2010.0414 [DOI] [PMC free article] [PubMed] [Google Scholar]
- 3. Daly B, Olopade OI. A perfect storm: how tumor biology, genomics, and health care delivery patterns collide to create a racial survival disparity in breast cancer and proposed interventions for change. CA Cancer J Clin. 2015;65:221‐238. doi: 10.3322/caac.21271 [DOI] [PubMed] [Google Scholar]
- 4. Hann KEJ, Freeman M, Fraser L, et al. Awareness, knowledge, perceptions, and attitudes towards genetic testing for cancer risk among ethnic minority groups: a systematic review. BMC Public Health. 2017;17:503. doi: 10.1186/s12889-017-4375-8 [DOI] [PMC free article] [PubMed] [Google Scholar]
- 5. Levy DE, Byfield SD, Comstock CB, et al. Underutilization of BRCA1/2 testing to guide breast cancer treatment: Black and Hispanic women particularly at risk. Genet Med. 2011;13:349‐355. doi: 10.1097/gim.0b013e3182091ba4 [DOI] [PMC free article] [PubMed] [Google Scholar]
- 6. Butrick M, Kelly S, Peshkin BN, et al. Disparities in uptake of BRCA1/2 genetic testing in a randomized trial of telephone counseling. Genet Med. 2015;17:467‐475. doi: 10.1038/gim.2014.125 [DOI] [PMC free article] [PubMed] [Google Scholar]
- 7. Kinney AY, Butler KM, Schwartz MD, et al. Expanding access to BRCA1/2 genetic counseling with telephone delivery: a cluster randomized trial. J Natl Cancer Inst. 2014;106:dju328. doi: 10.1093/jnci/dju328 [DOI] [PMC free article] [PubMed] [Google Scholar]
- 8. Schwartz MD, Valdimarsdottir HB, Peshkin BN, et al. Randomized noninferiority trial of telephone versus in‐person genetic counseling for hereditary breast and ovarian cancer. J Clin Oncol. 2014;32:618‐626. doi: 10.1200/jco.2013.51.3226 [DOI] [PMC free article] [PubMed] [Google Scholar]
- 9. Sheppard VB, Graves KD, Christopher J, Hurtado‐de‐Mendoza A, Talley C, Williams KP. African American women's limited knowledge and experiences with genetic counseling for hereditary breast cancer. J Genet Couns. 2014;23:311‐322. doi: 10.1007/s10897-013-9663-6 [DOI] [PMC free article] [PubMed] [Google Scholar]
- 10. Sheppard VB, Mays D, LaVeist T, Tercyak KP. Medical mistrust influences Black women's level of engagement in BRCA 1/2 genetic counseling and testing. J Natl Med Assoc. 2013;105:17‐22. doi: 10.1016/s0027-9684(15)30081-x [DOI] [PMC free article] [PubMed] [Google Scholar]
- 11. Sherman KA, Miller SM, Shaw L‐K, Cavanagh K, Sheinfeld Gorin S. Psychosocial approaches to participation in BRCA1/2 genetic risk assessment among African American women: a systematic review. J Community Genet. 2014;5:89‐98. doi: 10.1007/s12687-013-0164-y [DOI] [PMC free article] [PubMed] [Google Scholar]
- 12. Leyva B, Nguyen AB, Allen JD, Taplin SH, Moser RP. Is religiosity associated with cancer screening? Results from a national survey. J Relig Health. 2015;54:998‐1013. doi: 10.1007/s10943-014-9843-1 [DOI] [PMC free article] [PubMed] [Google Scholar]
- 13. Moorman PG, Barrett NJ, Wang F, et al. Effect of cultural, folk, and religious beliefs and practices on delays in diagnosis of ovarian cancer in African American women. J Womens Health (Larchmt). 2019;28:444‐451. doi: 10.1089/jwh.2018.7031 [DOI] [PMC free article] [PubMed] [Google Scholar]
- 14. Ford CL, Airhihenbuwa CO. Critical race theory, race equity, and public health: toward antiracism praxis. Am J Public Health. 2010;100(suppl 1):S30‐S35. doi: 10.2105/ajph.2009.171058 [DOI] [PMC free article] [PubMed] [Google Scholar]
- 15. Graham L, Brown‐Jeffy S, Aronson R, Stephens C. Critical race theory as theoretical framework and analysis tool for population health research. Crit Public Health. 2011;21:81‐93. doi: 10.1080/09581596.2010.493173 [DOI] [Google Scholar]
- 16. Fazeli Dehkordy S, Hall KS, Dalton VK, Carlos RC. The link between everyday discrimination, healthcare utilization, and health status among a national sample of women. J Womens Health (Larchmt). 2016;25:1044‐1051. doi: 10.1089/jwh.2015.5522 [DOI] [PMC free article] [PubMed] [Google Scholar]
- 17. Andersen RM. Revisiting the behavioral model and access to medical care: does it matter? J Health Soc Behav. 1995;36:1‐10. [PubMed] [Google Scholar]
- 18. Andersen R, Newman JF. Societal and individual determinants of medical care utilization in the United States. Milbank Q. 2005;83:1‐28. doi: 10.1111/j.1468-0009.2005.00428.x [DOI] [PubMed] [Google Scholar]
- 19. Schildkraut JM, Alberg AJ, Bandera EV, et al. A multi‐center population‐based case–control study of ovarian cancer in African‐American women: the African American Cancer Epidemiology Study (AACES). BMC Cancer. 2014;14:688. doi: 10.1186/1471-2407-14-688 [DOI] [PMC free article] [PubMed] [Google Scholar]
- 20. V6 SAS note: point biserial correlations can be obtained from PROC CORR. SAS Support Site. Accessed May 8, 2020. https://support.sas.com/techsup/unotes/V6/3/3956.html [Google Scholar]
- 21. Lewis TT, Cogburn CD, Williams DR. Self‐reported experiences of discrimination and health: scientific advances, ongoing controversies, and emerging issues. Annu Rev Clin Psychol. 2015;11:407‐440. doi: 10.1146/annurev-clinpsy-032814-112728 [DOI] [PMC free article] [PubMed] [Google Scholar]
- 22. Sternthal MJ, Slopen N, Williams DR. Racial disparities in health. Du Bois Rev. 2011;8:95‐113. doi: 10.1017/s1742058x11000087 [DOI] [PMC free article] [PubMed] [Google Scholar]
- 23. Anderson LA, Dedrick RF. Development of the Trust in Physician scale: a measure to assess interpersonal trust in patient‐physician relationships. Psychol Rep. 1990;67(pt 2):1091‐1100. doi: 10.2466/pr0.1990.67.3f.1091 [DOI] [PubMed] [Google Scholar]
- 24. Zimet GD, Dahlem NW, Zimet SG, Farley GK. The Multidimensional Scale of Perceived Social Support. J Pers Assess. 1988;52:30‐41. doi: 10.1207/s15327752jpa5201_2 [DOI] [Google Scholar]
- 25. Szaflarski M, Kudel I, Cotton S, Leonard AC, Tsevat J, Ritchey PN. Multidimensional assessment of spirituality/religion in patients with HIV: conceptual framework and empirical refinement. J Relig Health. 2012;51:1239‐1260. doi: 10.1007/s10943-010-9433-9 [DOI] [PMC free article] [PubMed] [Google Scholar]
- 26. Mai PL, Vadaparampil ST, Breen N, McNeel TS, Wideroff L, Graubard BI. Awareness of cancer susceptibility genetic testing. Am J Prev Med. 2014;46:440‐448. doi: 10.1016/j.amepre.2014.01.002 [DOI] [PMC free article] [PubMed] [Google Scholar]
- 27. McCarthy AM, Bristol M, Domchek SM, et al. Health care segregation, physician recommendation, and racial disparities in BRCA1/2 testing among women with breast cancer. J Clin Oncol. 2016;34:2610‐2618. doi: 10.1200/jco.2015.66.0019 [DOI] [PMC free article] [PubMed] [Google Scholar]
- 28. Susswein LR, Skrzynia C, Lange LA, Booker JK, Graham ML, Evans JP. Increased uptake of BRCA1/2 genetic testing among African American women with a recent diagnosis of breast cancer. J Clin Oncol. 2008;26:32‐36. doi: 10.1200/jco.2007.10.6377 [DOI] [PubMed] [Google Scholar]
- 29. Kessler RC, Mickelson KD, Williams DR. The prevalence, distribution, and mental health correlates of perceived discrimination in the United States. J Health Soc Behav. 1999;40:208‐230. [PubMed] [Google Scholar]
- 30. Krieger N, Smith K, Naishadham D, Hartman C, Barbeau EM. Experiences of discrimination: validity and reliability of a self‐report measure for population health research on racism and health. Soc Sci Med. 2005;61:1576‐1596. doi: 10.1016/j.socscimed.2005.03.006 [DOI] [PubMed] [Google Scholar]
- 31. Lewis TT, Williams DR, Tamene M, Clark CR. Self‐reported experiences of discrimination and cardiovascular disease. Curr Cardiovasc Risk Rep. 2014;8:365. doi: 10.1007/s12170-013-0365-2 [DOI] [PMC free article] [PubMed] [Google Scholar]
- 32. Cuevas AG, Reitzel LR, Cao Y, et al. Mediators of discrimination and self‐rated health among African Americans. Am J Health Behav. 2013;37:745‐754. doi: 10.5993/AJHB.37.6.3 [DOI] [PMC free article] [PubMed] [Google Scholar]
- 33. Glover LM, Sims M, Winters K. Perceived discrimination and reported trust and satisfaction with providers in African Americans: the Jackson Heart Study. Ethn Dis. 2017;27:209‐216. doi: 10.18865/ed.27.3.209 [DOI] [PMC free article] [PubMed] [Google Scholar]