

Abstract
BACKGROUND
Bursaphelenchus xylophilus, the pinewood nematode, kills millions of pine trees worldwide every year, and causes enormous economic and ecological losses. Despite extensive research on population variation, there is little understanding of the population‐wide variation spectrum in China.
RESULTS
We sequenced an inbred B. xylophilus strain using Pacbio+Illumina+Bionano+Hi‐C and generated a chromosome‐level assembly (AH1) with six chromosomes of 77.1 Mb (chromosome N50: 12 Mb). The AH1 assembly shows very high continuity and completeness, and contains novel genes with potentially important functions compared with previous assemblies. Subsequently, we sequenced 181 strains from China and the USA and found ~7.8 million single nucleotide polymorphisms (SNPs). Analysis shows that the B. xylophilus population in China can be divided into geographically bounded subpopulations with severe cross‐infection and potential migrations. In addition, distribution of B. xylophilus is dominated by temperature zones while geographically associated SNPs are mainly located on adaptation related GPCR gene families, suggesting the nematode has been evolving to adapt to different temperatures. A machine‐learning based epidemic tracking method has been established to predict their geographical origins, which can be applied to any other species.
CONCLUSION
Our study provides the community with the first high‐quality chromosome‐level assembly which includes a comprehensive catalogue of genetic variations. It provides insights into population structure and effective tracking method for this invasive species, which facilitates future studies to address a variety of applied, genomic and evolutionary questions in B. xylophilus as well as related species.
Keywords: Bursaphelenchus xylophilus, chromosome‐level assembly, SNPs, population structure, epidemic tracking
Our study provides the community with the first high‐quality long‐read based assembly, a comprehensive catalogue of genetic variations, insights into population structure and effective tracking method for Bursaphelenchus xylophilus.

© 2021 The Authors. Pest Management Science published by John Wiley & Sons Ltd on behalf of Society of Chemical Industry.
1. INTRODUCTION
The pine wood nematode (PWN), Bursaphelenchus xylophilus (Steiner & Buhrer) Nickle, is an invasive species and the causative agent of pine wilt disease originating from North America. 1 It does not harm the local pine trees in North America but poses a great threat to all pine forests in Asia and Europe. 2 The PWN was first found in Japan in the early twentieth century. 3 In the 1980s, it spread to other Asian countries, such as China and Korea. In 1999 it was reported in Portugal and continued to infect new forest areas in the Portuguese center region. 4 , 5 Now this nematode is also present in the Madeira Islands 6 and Spain. 7 In China, the infected area has reached 666 counties, 18 provinces and 1 114 000 ha according to State Forestry and Grassland Administration of China. Obviously, this invasive species has spread into very large areas of China within the span of 38 years. It is clear that the widespread and severe cross‐infection of B. xylophilus in China was mostly caused by human mediated activities, such as wood product exchange and infrastructure construction. 8 However, it is still unclear how this parasitic nematode could quickly spread and adapt to various environments. Plenty of studies advocate that the best time to control biological invasions is in their early stages, in terms of cost and effectiveness. Therefore, utilizing quarantine measures in conjunction with identifying geographical pathways should be the first step 9 in preventing the spread of this nematode.
The explicit descriptions of B. xylophilus' origin and population structure are essential for epidemic source tracking, monitoring and prevention. Most relevant studies regarding the geographical origins or genetic variations of B. xylophilus are based on the different enzyme sites within DNA fragments, like the inter‐simple sequence repeat (ISSR), amplified fragment length polymorphism (AFLP) and restriction fragment length polymorphism (RFLP) methods. 10 , 11 , 12 Apart from valuable information generated from those studies, struggling to properly identify nucleotide polymorphisms may impede researchers from attaining more promising results in areas with severe cross‐infection, like China. Consequently, we have consistently failed to draw concrete conclusions about the possible population structures or origins of B. xylophilus in most invaded areas. 12 , 13 , 14 It is necessary to try other genetic markers to elucidate the population structures in China to prevent the spread of B. xylophilus.
Alternatively, single nucleotide polymorphisms (SNPs) have been proved to be an efficient tool in population genetics due to their abundance and diversity in many species. 15 , 16 , 17 There is pervasive evidence that genome‐wide association studies could be a powerful approach to reveal population structures and other complex traits in mammals, plants and microbes. 18 , 19 , 20 Meanwhile, it is undoubted that an accurate and complete genome assembly should be the fundamental prerequisite in all aspects of molecular researches, including SNP genotyping. 21 Since the first announcement of short‐read sequencing based genome assembly, SNPs markers began to be employed by researchers to identify possible origins and pathogenic traits of B. xylophilus. 22 , 23 , 24 However, few studies have characterized the genetic variations in B. xylophilus with adequate sample sizes. This lack of genetic information hinders the field of B. xylophilus research from advancing the understanding of population structures and invasion routes from a standpoint of genetics and genomics. In addition, short‐read based assembly inherently cannot characterize complex regions and sequences with extreme GC contents, and inevitably leads to reduced assembly contiguity. 25 , 26 Technically, third‐generation, long‐read sequencing is gaining popularity and is proven to be superior in de novo assembly. 27 It would be beneficial for all researchers to have access to a more continuous and accurate genome assembly with the help of new sequencing platforms. 28
We therefore performed single‐molecule real‐time (SMRT) long‐read sequencing 29 and BioNano physical mapping 30 of the B. xylophilus genome coupled with genome re‐sequencing of 181 B. xylophilus strains covering almost all infected cities in China. The ultimate goals of this study were to generate a high‐quality reference assembly to decipher the genomic variation landscape and adaptation associated genes of B. xylophilus all over China. This assembly will elucidate current B. xylophilus populations and subpopulations, inevitably boosting the current research and monitoring system on this invasive species.
2. MATERIALS AND METHODS
2.1. Sampling
The strain AMA3 is an inbred line maintained by Lihua Zhu in Jianren Ye's laboratory for 20 generations and is used for subsequent SMRT PacBio sequencing and Bionano optical map generation.
The other 180 nematode strains used for genome re‐sequencing and SNP genotyping were collected from infected trees located in 16 provinces by local forestry departments, with the approval of the State Forestry and Grassland Administration of China. All 180 strains were extracted from chopped trees using the Baermann funnel method. 31 Each strain consists of ~40 hand‐picked individuals under a microscope from one single tree and cultured separately on the fungus Botrytis cinerea Pers. at 25 °C for 7–10 days to obtain sufficient sample sizes. The nematodes were recovered again and stored in water suspension using a 1.5‐mL centrifuge tube for downstream short‐read sequencing. The sole USA strain used in this study was intercepted and isolated from imported wood product and has been maintained in our laboratory since 2014. Detailed sampling information can be found in Table S8.
2.2. Generation of sequence data
The high‐molecular‐weight DNA was extracted from inbred line AMA3 for SMRT PacBio sequencing using Qiagen DNeasy Blood & Tissue Kit (Wuhan, China). DNA quality was assessed by Nanodrop, Qubit (Thermo Fisher) and visualized in agarose gel. A 20‐kb insert SMRT cell library was generated and the PacBio RS II platform was used to produce nine SMRT cells of raw data (Nextomics, Wuhan, China). For the BioNano optical map, DNA extracted from the AMA3 inbreed line went through optical scanning, with nicking enzyme NT.BssSI following protocols recommended by the manufacturer (BGI, Shenzhen, China). The Hi‐C library was constructed and sequenced via the Illumina Novaseq/MGI‐2000 platform (Nextomics). The short‐read DNA‐Seq data for genome polishing and RNA‐Seq data for transcriptome analyses were generated using the same AMA3 inbred line. 32 For genome re‐sequencing, the genomic DNA was isolated from the B. xylophilus strains using the CTAB method 33 and sequenced on an Illumina Hiseq 4000 (150 bp paired‐end reads).
2.3. Hybrid genome assembly and quality assessment
De novo genome assembly was constructed by minimap (v1cd6ae3) and miniasm (v17d5bd1) 32 using PacBio SMRT long reads. Parameters, optimized based on genome continuity and completeness, were assessed by BUSCO (v2.0). 34 Errors in long reads were then corrected by five rounds of iterative Racon (v0f6d4aa) polishing 35 with long reads. To further correct insertion and deletion errors from long‐read sequencing, three rounds of short‐read polishing were carried out. 28 Both long‐read and short‐read polishing were iterated until no significant improvement was observed with respect to genome completeness and number of errors corrected. The polished assembly was aligned against the National Center for Biotechnology Informatio (NCBI) representative microbe genomes database using BLAST 36 to remove any contigs with microbe contamination (qcov> = 80%, identity> = 85%; ftp://ftp.ncbi.nlm.nih.gov/blast/db/). For quality assessment, PacBio reads were aligned back to the finished assemblies using minimap2 (v2.14‐r883) 37 with preset parameters for PacBio data. Bionano optical data were first filtered with static label SNR 3.2, and the molecular quality report was done with ‘minlen 150 ‐T 1e‐7’. The de novo assembly was carried out with default arguments for medium genome size, and hybrid scaffolding was performed with ‘initial alignment P value 1e‐10, merging P value 1e‐11, final alignment P value 1e‐10’ along with ‘Resolve Conflicts’ option using IrysView (v2.5.1).
To anchor hybrid scaffolds onto the chromosome, genomic DNA was extracted for the Hi‐C library from AMA3. Then, we constructed the Hi‐C library and obtained sequencing data via the Illumina Novaseq/MGI‐2000 platform. In total, 370 million paired‐end reads were generated from the libraries. Quality controlling of Hi‐C raw data was performed using Hi‐C‐Pro as former research. 38 First, low‐quality sequences (quality scores <20), adaptor sequences and sequences shorter than 30 bp were filtered out using fastp, and then the clean paired‐end reads were mapped to the draft assembled sequence using bowtie2 (v2.3.2) (−end‐to‐end, –very‐sensitive ‐L 30) to get the unique mapped paired‐end reads. Valid interaction paired reads were identified and retained by HiC‐Pro (v2.8.1) from unique mapped paired‐end reads for further analysis. Invalid read pairs, including dangling‐end, self‐cycle, re‐ligation and dumped products, were filtered by HiC‐Pro (v2.8.1). The scaffolds were further clustered, ordered and oriented onto chromosomes by LACHESIS (https://github.com/shendurelab/, LACHESIS), CLUSTER_MIN_RE_SITES = 100, CLUSTER_MAX_LINK_DENSITY = 2.5, CLUSTER NONINFORMATIVE RATIO = 1.4, ORDER MIN N RES IN TRUNK = 60 and ORDER MIN N RES IN SHREDS = 60. Finally, placement and orientation errors exhibiting obvious discrete chromatin interaction patterns were manually adjusted.
QUAST 37 , 39 (5.0.0.dev0) was used to align AH1 (Anhui 1) onto JP (Japan) contigs to determine genome coverage and consensus accuracy (−‐large –circos ‐m 300 ‐i 65 ‐x 1000 ‐t 4). BUSCO (v3.0.2) 34 was run in ‘geno’ mode with the Nematoda lineage database (OrthoDB v9) to identify common orthologs in the assemblies to assess completeness. Sequence similarity analysis between AH1 (query) and JP (reference) derived genes was done by BLAST (−task megablast ‐outfmt ‘7 qacc sacc qstart qend evalue length pident qcovs’ ‐perc_identity 85 ‐max_target_seqs 50). Genome comparison was visualized by dot plot with D‐genies (http://dgenies.toulouse.inra.fr/).
2.4. Genome annotation
The genome annotation was carried out with a MAKER2 tool kit following the recommended protocol (http://gmod.org/wiki/MAKER_Tutorial). 40 The repeat sequences were predicted by RepeatModeler and RepeatMasker (http://www.repeatmasker.org/). We chose Augustus (http://augustus.gobics.de/), SNAP, FGENE and other built‐in packages for ab inito gene prediction and included the protein, mRNA sequences obtained from early assembly together with previously generated RNA‐Seq as external evidence (https://parasite.wormbase.org/ftp.html). MAKER2 was then used to integrate the ab inito and existing evidence to revise the gene model. Subsequently, Gene Ontology, Swissprot and Interpro databases were used to conduct functional annotation.
2.5. Transcriptome analysis
Genome alignment and transcript assembly process were done by following the protocol described by Cole Trapnell et al. 41 RNA‐Seq data were aligned to the genome using TopHat (v2.1.1) allowing two mismatches, 42 and transcriptome assembly and gene expression analysis were generated by Cufflinks and Cuffdiff 43 (v2.2.2.1). Putative exon skipping events were identified by GESS (v1.0) with default parameters. 44 Total RNA was extracted using Trizol reagent following the product descriptions (https://www.thermofisher.com/order/catalog/product/15596018?SID=srch-srp-15596018). RNA qualities were assessed by Nanodrop 2000 (http://www.nanodrop.com/Productnd2000overview.aspx) and visualized in agarose gel. Upstream and downstream primers for novel transcripts and exon‐skipping events were designed based on the genomic coordinates. PCR was carried out by the following procedure: 94 °C for 2 min, followed by 37 cycles (94 °C for 30 s, 58 °C for 30s and 72 °C for 30 s) and finally 72 °C for 10 min. The PCR products were examined by 1% agarose gel electrophoresis.
2.6. Genome variation analysis
The re‐sequencing DNA‐Seq was aligned to the genome using BWA‐MEM (v0.7.15‐r1140) and SAMtools (v1.6). 45 , 46 Duplicates were removed by Picard (http://broadinstitute.github.io/picard/). Putative SNPs were called by freebayes 47 (v1.1.0) with ‘‐u ‐C 5 ‐e 50 –standard‐filters –min‐coverage 10’. Then, VCFtools (v0.1.15) and custom Perl (v5.14.2) scripts were applied to gather general SNP genotyping information among different strains. 48 The R package SNPRelate (v1.14.0) was employed to process minor allele frequency MAF, missing rate and linkage disequilibrium (LD) filtering 49 ; the remaining SNPs were used to perform principal component analysis (PCA) and hierarchical clustering analysis. Treemix 50 (v1.13) was used to estimate population splitting events among different provinces with at least more than two strains to avoid bias using ‘‐noss ‐bootstrap’, and the migration events were inferred by ‘‐m’ with increased numbers. Duite was used to compute the D‐statistics based on the ABBA‐BABA test (https://github.com/millanek/Dsuite). Plink (v1.90b6.1) and R package qqman (v0.1.4) were then used to conduct geographically associated SNP identification and Manhattan plot with minimum threshold 1.6e‐9 (0.05/(SNP numbers*4)). 51 The annotation of SNPs was performed using ANNOVAR 52 (v2018Apr16) and enriched gene functions were analyzed by agriGO (http://systemsbiology.cau.edu.cn/agriGOv2/). The temperature zones were divided based on the average temperature data from 1981 to 2010 obtained from the Open Source Geospatial Foundation (https://www.osgeo.cn/). Environmental factors were downloaded from WorldClime (https://www.worldclim.org/) and association studies were conducted by SPSS using Pearson correlation and Duncan's test.
2.7. Experimental validation of genomic variations
Two SNP sites of all 181 samples were validated by the pyro‐sequencing technique using PyroMark Q96 ID. The two pairs of amplification primers and one pair of sequencing primers were designed by PyroMark Assay Design Software 2.0, and one pair of the amplification primers was assigned with biotin label (Table S11). PCR reactions were performed in a total volume of 50 μL containing 2 μL of genomic DNA, 25 μL of mix, 2 μL of forward primer, 2 μL of reverse primer and 19 μL of double‐distilled H2O (ddH2O). PCR amplifications were performed with an initial denaturation for 3 min at 98 °C, followed by 45 cycles of denaturation for 10 s at 98 °C, primer annealing for 30 s at 58 °C and extension for 30 s at 72 °C, followed by a final extension for 5 min at 72 °C. Amplicons were analyzed by gel electrophoresis on a 2% agarose gel and visualized by ultraviolet transillumination.
After gel electrophoresis, 10 μL of the residual biotinylated PCR product was immobilized onto 3 μL of streptavidin sepharose beads (GE Healthcare, USA) in 40 μL of binding buffer mixed with 27 μL of ddH2O under 15 min of shaking at 1400 rpm. Single‐stranded DNA was prepared with a PyroMark Q96 Vacuum Workstation (Qiagen, USA). PCR products were washed with 100 mL of 70% ethanol, denatured with 90 mL of denaturation buffer and re‐washed with 110 mL of wash buffer for 5 s each. The beads were released into a 96‐well plate prefilled with sequencing primer in 40 μL of annealing buffer per well. For primer annealing, the 96‐well plate was heated at 80 °C for 2 min and thereafter cooled to room temperature for use. Pyrosequencing assays were performed for all the study samples on a PyroMark Q96 ID system using PyroMark Gold Q96 Reagents (Qiagen). PyroMark Q96 ID was implemented with AQ (allele quantification) mode, and assays were created according to the manufacturer's instructions.
2.8. Geographic location prediction model
We determined the latitude and longitude of each sample based on the city or county where the sample was collected, up to two decimal points. One‐unit difference in the second decimal place of latitude or longitude is roughly 1.1 km in distance, therefore two decimal points are sufficiently accurate for our purposes. We then ran a random parameter search 53 in scitkit‐learn (v0.19.1) 54 for XGBoost (v0.7). 55 XGBoost is a gradient boosting method that attempts to build an ensemble of decision trees for prediction. It was chosen because it has been ranked as the top performing model in many Kaggle (kaggle.com) data challenges, and it also gave us the best results in our internal comparison (data not shown) of deep learning networks and automated machine learning framework like h2o (http://docs.h2o.ai/h2o/latest-stable/h2o-docs/automl.html). Input to the model was counts of alternative alleles of the SNPs used in our principal component analysis. All loci were biallelic and therefore possible values were 0, 1 and 2 at each locus. The best set of hyper parameters was chosen from 500 rounds of randomized search, ranked by mean squared error of 5‐fold cross‐validation. Similarly, the predictions were generated by 5‐fold cross validation, i.e. data were randomly split into four partitions. For each partition, a new model was trained based on the other four partitions, and predictions were made on the untrained partition. Randomization seeds for random search and cross‐validation prediction were different to avoid bias caused by random search. The latitude and longitude were modeled separately. Due to the small sample size, we subsequently used bootstrapping to estimate the distribution of errors, i.e. the haversine distance 56 between true and predicted locations. All samples were chosen at random, with replacement, and then were subject to random search and 5‐fold cross‐validation prediction. Bootstrapping can also be used to estimate the confidence intervals of a single‐point predictions. 57
3. RESULTS
3.1. High‐quality long‐read based assembly of the B. xylophilus genome
We leveraged SMRT DNA sequencing technology 29 and sequenced genomic DNA from an inbred nematode strain (AH1) at 123X coverage (Table S1). In total, we obtained about 1 million subreads after quality filtering. These subreads have a mean length of 10.1 kb and a N50 length of 13.8 kb, where sequences are longer than the N50 composite half of the total sequence lengths. We also generated 46X short reads DNA‐Seq on the Illumina un‐stranded 100 bp paired‐end platform (Table S1) for genome polishing. 32
Minimap and miniasm 32 were used to perform de novo genome assembly on the long reads. Then five rounds of Racon 35 polishing using long reads and four rounds of short reads polishing 28 were performed to correct sequencing errors. In total, 5395 single nucleotide variation and 102 719 inserstion, deletion (INDELs) are corrected by short reads (Table S2). The polished assembly was further compared against the NCBI representative microbe genomes database using BLAST 36 to remove contigs with possible microbe contaminations. As a result, 14 contigs (27 Mb) were discarded (Table S3) while 129 contigs were kept in the AH1 draft assembly with N50 at 5.8 Mb. Subsequently, the Bionano Irys‐chip (537X) and Hi‐C were used to scaffold those assembled contigs and six chromosomes were obtained after hybrid scaffolding with N50 at 12 Mb, size totaling 77.1 Mb (Figs 1(a) and S1).
Figure 1.

Summary of genome assembly and annotation results between AH1 and Japan (JP). (a) De novo BioNano assembly and chromosome contact matrix of AH1 assembly. Scaffold number is on top left corner. BioNano scaffolding assembly is in green, while Pacbio based contigs are in blue. (b) Dot‐plot of AH1 assembly against JP. (c) Gene length distribution between the two assemblies. (d) Gene ontology enrichment of Bursaphelenchus xylophilus novel genes on AH1 (coverage <50%, identity >85%).
The AH1 assembly is considerably more contiguous than the existing assembly (JP) assembled from short reads 24 based on N50 and sequence length (Table 1). QUAST 37 , 39 was used to compare AH1 against JP and it was found that 79.14% of JP can be covered by AH1 and the consensus accuracy of the aligned bases reaches 99.04% on average. Mapping by minimap2 37 showed that 79.6% and 77.3% subreads can be aligned to AH1 and JP contigs, respectively, and there are 1.37 alignments per aligned read on AH1 and 3.16 on JP. BUSCO 34 analysis showed that 78.4% (770/982) of near‐universal single‐copy orthologs in Nematoda can be found in AH1 compared with 74.0% (727/982) in JP assembly (Table S4). Over 76.4% of the assembly showed high similarities with JP assembly by genome dot plot (Fig. 1(b)). The above assessments unanimously suggest that the AH1 assembly is more complete, contiguous and contains fewer mis‐assemblies than the JP assembly.
Table 1.
Comparison between the AH1 and Japan (JP) de novo assemblies on Bursaphelenchus xylophilus
| Strain | Ka4C1* (JP) | AMA3 (AH1) |
|---|---|---|
| Accession | GCA_000231135.1 | N/A |
| Sequencing platform | Illumina | PacBio SMRT |
| Scaffolding platform | N/A |
BioNano Irys Chip Hi‐C |
| PacBio long‐read mapping rate | 77.26% | 81.16% |
| Size | 74 561 461 | 77 273 647 |
| Number of contigs a | 10 432 | 129 |
| Longest contigs a | 200 348 | 11 860 753 |
| Contig N50 a | 18 150 | 5 825 809 |
| Median contig length a | 2459 | 33 909 |
| Number of CHR | N/A | 6 |
| Longest CHR | N/A | 12 450 865 |
| CHR N50 | N/A | 12 382 933 |
| Consensus accuracy b | N/A | 99.16% |
| Complete BUSCOs | 727 (74.03%) | 770 (78.41%) |
| Alignments per long read | 3.16 | 1.37 |
| Exons | 80 655 | 79 734 |
| Genes | 12 568 | 12 197 |
| Gene density (genes/Mb) | 150.33 | 158.19 |
| Average gene size | 1451.13 | 1453.79 |
| Average exon size | 225.12 | 222.39 |
Contigs downloaded from NCBI; scaffolds downloaded from WormBase.
Measured against JP.
The RNA‐Seq data of the AMA3 inbred line as well as mRNA and protein sequences of B. xylophilus deposited in WormBase were included to perform genome annotation using MAKER2 (v2.31). 32 , 40 The AH1 genome contains 12 197 genes and 79 734 exons. The average lengths of genes and exons are ~1453 bp and ~222 bp, respectively. At the same time, JP assembly contains 12 568 genes and 80 655 exons. The average lengths of genes and exons are ~1451 and ~225 bp, respectively. The overall view of gene length distribution also suggested that the AH1 assembly increases the gene length, especially for genes <5 kb (Fig. 1(c)). Functional analysis showed that ~8826 genes (70%) in the AH1 assembly could be assigned with putative functions. The novel gene candidates showing less than 85% identity and 50% coverage compared with JP are mainly enriched in functions, such as single organism process, signal transduction, catalytic activity and oxidoreductase activity (Fig. 1(d)).
3.2. Functional annotation of the AH1 genome reveals novel adaptation‐important gene families
We further characterized several key proteins associated with the pathogenicity and host‐adaptation of B. xylophilus. Glycoside hydrolase (GH) cellulase families are known to play important roles in breaking down host cell walls during nematode infection. 24 Here, we found 19 GH families in the AH1 assembly while six of them can be detected in the JP assembly (Table S5). Among the new GH families, GH30 was missed by JP due to the use of a now obsolete protein database a decade ago. The remaining families including GH31, GH37 (bx1.10725‐RA), GH18 and GH29, to name a few, are encoded by novel genes identified only in the AH1 assembly (Table S5). Additionally, we found that cytochrome P450 (CYP), glutathione S‐transferase, GH, and pectate lyase genes are multicopy genes with the help of chromosome level assembly. 58
3.3. Transcriptome characterization finds novel transcripts in the AH1 genome
To further evaluate the accuracy and quality of the AH1 assembly on a transcript level, we aligned the same RNA‐Seq data used in genome annotation to both AH1 and JP. The mapping rate of the RNA‐Seq data on AH1 is 88%, which is 11% higher than that of the JP assembly (77%). Among the unmapped reads (23%) from the JP assembly, half can be mapped back to the AH1 assembly. The AH1‐derived transcriptome contains 13 368 genes and 15 425 transcripts with ~30 Mb, while the JP transcriptome contains 17 658 genes and 19 481 transcripts with ~27 Mb. The overall transcript lengths are significantly longer compared with transcripts from the JP assembly (Fig. 2(a)). Out of the 19 481 transcripts in JP, 85% can also be found in AH1 with >85% coverage while 549 (no hits in JP) transcripts are considered as novel transcripts (Fig. 2(b)). Then 10 randomly selected novel transcripts were amplified via PCR to prove the validity of transcriptome assembly (Fig. 2(c) and Table S6). Furthermore, 93 exon‐skipping events are identified in AH1, and six of those chosen for validation were supported by PCR amplification (Fig. 2(d) and Table S7). The transcriptomic analysis again indicated that the AH1 assembly could be more complete and contiguous than the JP assembly on both the gene and transcript level. Functional annotation of all newly identified transcripts including GH, G‐protein coupled receptor (GPCR) and cytochromeP450 (CYP450) suggests that they are mainly involved in metabolic process, catalytic activity and membrane formation.
Figure 2.

Evaluations of AH1 and Japan (JP) assembly based on the same RNA‐Seq data. (a) Transcript length distributions generated from RNA‐Seq data using AH1 and JP assemblies. (b) RNA‐Seq based sequence similarity analysis between AH1 (query) and JP (reference) transcripts using BLAST. x axis indicates query sequence coverage rate. (c) PCR validation of 10 novel transcripts identified in the AH1 assembly only. Lane M, DNA 1000 marker; lanes 1–10 indicate 10 novel transcripts, see Table S6 for details. (d) PCR validation of six exon‐skipping events identified in the AH1 assembly. Lane M, DNA 1000 marker; lanes 1–6 indicate six exon‐skipping events, see Table S7 for details.
3.4. Genotyping analysis shows geographically bounded subpopulations of B. xylophilus in China
The genomes of 180 strains from 16 provinces in China together with one alien strain from the USA were sequenced at average 102X coverage (Tables S1 and S8). The average mapping rate on AH1 is 92% (Table S9). Overall, there are 7 807 717 unique SNPs among all 181 nematode strains, 7 395 877 are biallelic SNPs and the rest of the SNPs (5.3%) have more than one alternate allele. The allele frequencies mostly range from 0 to 0.2 (Fig. 3(a)). Up to 24% of the SNPs are located within the exonic regions, 27% in intronic, and 49% in intergenic and flanking regions (Fig. 3(b)). Moreover, 27% of the exonic SNPs are predicted as nonsynonymous SNPs, which might lead to amino acid changes. The median SNP counts, missing SNPs (SNPs absent in one strain but can be found in other strains), homozygous, transitions and transversions are 288 883, 422 622, 137 704, 149 574, and 138 541, respectively (Fig. 3(c) and Table S10). Meanwhile, six genotypes (A to G, C to G, C to T, G to A, G to C, T to C) showed significantly higher counts than other genotypes (Fig. 3(d) and Table S10). Last but not least, 4.8% of the SNPs are found in novel gene candidates according to functional annotation. The enriched gene functions affected by nonsynonymous SNPs are signaling, regulation of biological process and response to stimulus.
Figure 3.
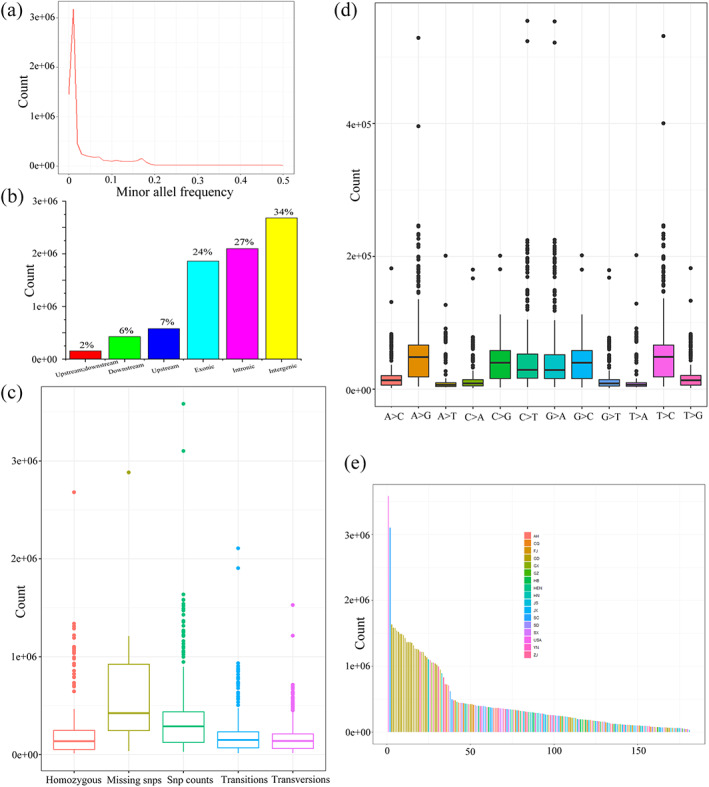
Overview of all SNPs found in 181 Bursaphelenchus xylophilus strains. (a) Distribution of minor allele frequencies. (b) Locations of all SNPs in genes. (c) Homozygosity, missing SNP, SNP count, transition and transversion distributions of the SNPs found in 181 strains. (d) Box plots of SNP genotypes in 181 strains. (e) SNP counts distribution among 181 strains.
Strains with the highest SNPs counts come from the USA (3582068), followed by one strain from Sichuan (SC) and 18 strains from Guangdong (GD) province (Fig. 3(e)). Similar rankings can be found if the strains are sorted based on homozygous numbers, transitions and transversions. (Tables 2 and S10). Obviously, most of the strains from SC, GD and the USA exhibit different genome variations compared with other strains. Since B. xylophilus is a native species in North America but a foreign species in China, the strains from China may have lost some genetic diversity due to multiple cross‐infection among different areas.
Table 2.
General statistics of identified Bursaphelenchus xylophilus SNPs from different localities
| Localities a | Max. SNPs | Min. SNPs | Mean # of SNPs | Mean # of homozygotes | Mean # of missing SNPs | Mean # of private SNPs | Mean # of transitions | Mean # of transversions |
|---|---|---|---|---|---|---|---|---|
| All | 3 582 068 | 3207 | 455 754 | 266 880 | 542 777 | 20 852 | 254 579 | 205 283 |
| AH | 366 651 | 60 374 | 235 453 | 132 461 | 514 392 | 168 | 123 758 | 114 527 |
| CQ | 721 468 | 80 982 | 310 675 | 99 959 | 254 007 | 285 | 169 054 | 146 460 |
| FJ | 482 391 | 45 248 | 186 645 | 101 044 | 538 885 | 353 | 99 889 | 89 740 |
| GD | 1 635 962 | 78 245 | 1 079 572 | 748 667 | 558 571 | 2748 | 619 309 | 465 212 |
| GX | 1 057 731 | 67 137 | 562 434 | 40 250 | 526 319 | 512 | 313 534 | 252 513 |
| GZ | 173 487 | 53 962 | 105 157 | 53 743 | 575 461 | 97 | 58 272 | 47 602 |
| HB | 457 945 | 123 881 | 266 438 | 137 711 | 474 623 | 418 | 140 753 | 130 031 |
| HEN | 426 875 | 264 140 | 363 367 | 215 066 | 315 153 | 383 | 190 737 | 180 544 |
| HN | 1 104 349 | 59 855 | 435 275 | 274 241 | 553 499 | 440 | 240 784 | 197 461 |
| JS | 342 897 | 29 015 | 166 309 | 117 667 | 691 097 | 211 | 86 225 | 81 611 |
| JX | 374 490 | 61 856 | 175 007 | 112 946 | 583 442 | 112 | 93 274 | 83 121 |
| SC | 3 101 663 | 71 990 | 558 622 | 385 098 | 684 350 | 189 559 | 319 074 | 247 130 |
| SD | 443 330 | 50 149 | 224 630 | 77 558 | 625 420 | 293 | 116 049 | 113 535 |
| SX | 393 143 | 43 939 | 277 210 | 148 247 | 355 590 | 249 | 148 906 | 131 058 |
| USA | 3 582 068 | 3 582 068 | 3 582 068 | 1 095 820 | 249 350 | 1 290 757 | 2 106 722 | 1 527 444 |
| YN | 292 635 | 292 635 | 292 635 | 213 359 | 363 485 | 32 | 155 039 | 140 586 |
| ZJ | 1 224 018 | 71 775 | 417 282 | 190 182 | 545 389 | 3140 | 231 354 | 189 767 |
The acronyms for different provinces are used here to represent the B. xylophilus sampling areas, e.g, AH for Anhui, CQ for Chongqing, FJ for Fujian, GD for Guangdong, GX for Guangxi, GZ for Guizhou, HB for Hubei, HEN for Henan, HN for Hunan, JS for Jiangsu, SC for Sichuan, SD for Shandong, SX for Shaanxi, USA for the United States, YN for Yunnan, ZJ for Zhejiang.
The SNPs were filtered by LD, MAF and missing SNP rate before downstream analyses (Methods) as described in the standard Genome‐wide Association Study (GWAS). 59 To illustrate the population substructures that may exist among all sequenced samples, 3137 candidate SNPs were used as the input data to perform PCA and population splitting event detection.
The PCA results indicate that the 181 strains can be divided into four major populations, which are in accordance with their sampling locations differed on latitudes (Figs 4(a),(b) and S2). The Pop1 contains 23 strains collected from GD province and another five strains from the USA (one), Zhejiang (ZJ) (two) and Hunan (HN) (two), so Pop1 mostly consists of GD strains. It is worth noticing that the only alien strain (USA) is placed in Pop1, which suggests the B. xylophilus in Guangdong province might originate from the USA and further spread within GD province. The Pop2 includes eight strains from SC and two strains from Fujian (FJ) and Yunnan, respectively. The Pop3 includes nine strains from ZJ (five), SC (two), GD (one) and Guangxi (one). The Pop4 is mixed with 134 strains from 15 provinces (Fig. 4(b),(c)). It is clear that the B. xylophilus population in China had undergone severe cross‐infection, but significant genetic variations can still be found to correlate with geography. In addition, the number of synonymous and nonsynonymous substitutions also varied among different populations (Fig. S3). It is common sense that latitude is one of the main factors affecting temperature while province‐based population splitting analysis provided insights into potential correlation between nematode populations and temperature zones (divided based on the average annual temperature data from 1981 to 2010). Most strains from JS, GZ, HB, HEN, AH and SD (Pop4) share similar SNP allele frequencies and they all belong to the 12 °C to 16 °C zone. Strains from CQ, FJ, SC, SX, JX, ZJ and HN (Pop2,3,4) form another group within the 16 to 20 °C zone. Strains from GD (Pop1) are independently assigned within 20–24 °C(Fig. 4(a),(d)). Detailed statistical analysis also revealed that the population clustering result is highly correlated with temperature and precipitation (Tables S11 and S12). Since we observed a small portion of geographically distant strains classified in the same cluster, we performed introgression analysis and found three spread routes in China: 1, GD to HN; 2, GD to SC; 3, HEN to ZJ (Fig. 4(a),(e)). The ABBA‐BABA test result also supports the above introgressions among different strains (Fig. S4). This indicates that GD could be one spread center in southern China but no migration routes can be found in other areas due to severe cross‐infections.
Figure 4.

Population structures of Bursaphelenchus xylophilus in China. (a) Geographical locations (green dots) of B. xylophilus strains collected in China. Different temperature zones are highlighted with gradient colors and the arrows represent possible migration events. (b) PCA results of 181 strains based on 3137 SNP markers. (c) Hierarchical clustering results of all 181 strains. (d) Population splitting tree of 181 strains based on sampling provinces. Samples from the same temperature zones are shown in circles of different colors. (e) Introgression analysis revealed possible B. xylophilus migration routes in China.
3.5. SNPs highly associated with geographic origins
Previous analysis illustrated the current population structures of B. xylophilus in China. It would be beneficial to identify the geographically associated SNPs and their functions. The genome‐wide association results show that 230 (Pop1), 60 (Pop2), 7 (Pop3) and 239 (Pop4) SNPs are significantly associated with their subpopulations after post filtering, respectively (Fig. 5(a)). Moreover, four of them are found on the novel genes from AH1 assembly. In addition, most of the SNPs are located within the intron and intergenic regions (66%) while more than half of the exonic SNPs are identified as nonsynonymous SNPs, which will lead to the change of protein sequences. The highly associated SNPs (nonsynonymous) are found on 7TM GPCR families, which may contribute to the notable correlation between temperature and B. xylophilus subpopulation structure (Fig. 5(a)). 60 , 61 Other proteins, like the GH family, may also have important roles in regulating the adaption and growth of B. xylophilus. 62 GO enrichment analysis also suggested those identified SNPs were involved in protein binding (HSP involved) and G‐protein coupled receptor activity (Fig. 5(b)). To validate the accuracy of the SNP genotyping results based on the new AH1 assembly, we employed pyro‐sequencing to quantify two geographically associated SNPs for all 181 strains (Table S13). The SNP (A to G) at CHR05 shares the same alternate allele G among Pop1 strains while other populations possess reference allele A. The other SNP (C to T) at CHR03 shares the reference allele C among Pop4 while other populations show alternate allele T (Figs 5(c),(d) and S5). The pyro‐sequencing results indicate that genotypes in all 181 samples are 100% identical with the next‐generation sequencing calling results.
Figure 5.
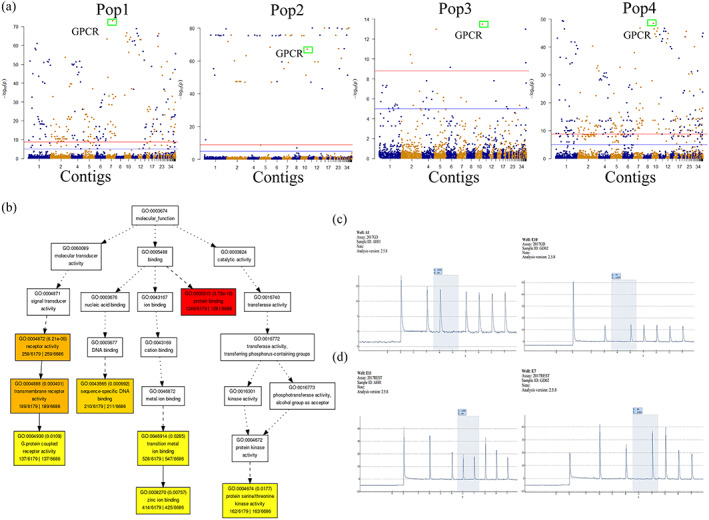
Genome‐wide identification of geographical associated SNPs and experimental validations. (a) Manhattan plot for SNPs highly associated with different population structures. Blue lines indicate genome‐wide suggestive line = −log10(1e‐05); red lines indicate genome‐wide significance lines = −log10(1.6e‐09); green boxes indicate SNPs on GPCR genes. (b) Hierarchical tree graphs of over‐represented GO terms for genes affected by geographical associated SNPs. Boxes in the graphs represent GO terms and significant terms (adjusted P value ≤0.05) are highlighted. (c) Screenshots for pyro‐sequencing validation of candidate SNPs (Contig007:3426052) in Pop1. (d) Screenshots for pyro‐sequencing validation of candidate SNPs (Contig001:790035) in Pop4.
3.6. Epidemic tracking by machine learning method
In practice, it would be useful to track the epidemic source for unknown strains in order to set up specific quarantine measures. However, the aforementioned model cannot directly predict locations. Since location information will be valuable for effective local control when newly infected areas are detected, we used machine learning to predict the longitude and latitude of the strains in China using SNPs associated with population structure (Methods). The real‐world modeling performance was estimated via 240 iterations of bootstrapping. 57 Haversine distance (distance on sphere) was calculated by comparing true longitude and latitude with predicted values. The distribution of true vs predicted distances (Fig. 6) was skewed with a long tail. Ninety percent predictions are within 727.3 km of true locations, with a mean distance of 293.0 km and a median of 143.3 km. Looking at the worst 5% predictions, i.e. predictions with the largest distances, we found that 10 samples account for 39.7% of all samples seen in the worst 5% predictions. Detailed examination revealed that the 10 samples had distinct genotypes compared to samples collected in nearby locations (Fig. S6). This might be a result of artificial migration of distant populations or biased representation of the underlying region. Nonetheless, it would be necessary to collect more samples from the aforementioned locations to validate our hypothesis. Predictions were also made for the original data without bootstrapping. The distance between true and predicted coordinates ranged from 28.5 to 1137.5 km, with a mean of 434.7 km and a median of 365.6 km.
Figure 6.
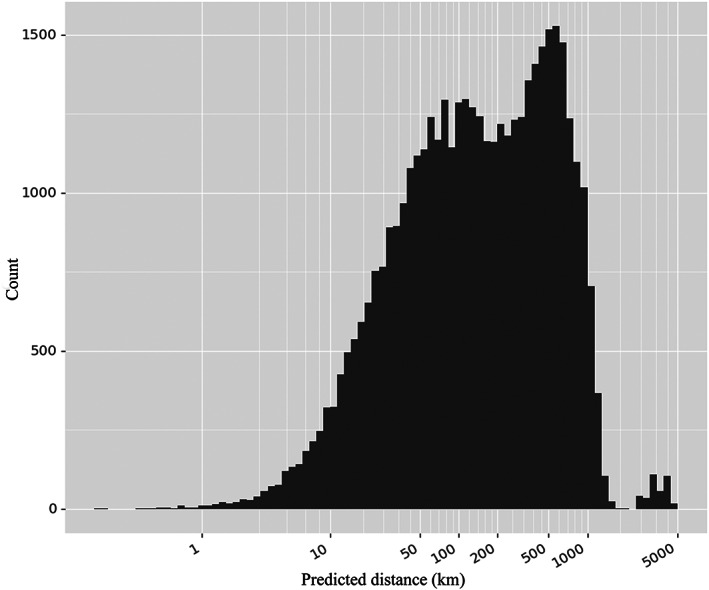
Distribution of distances of true vs predicted coordinates in 240 iterations of bootstrapping.
4. DISCUSSION
In this study, we generated the first long‐read based, chromosome‐level genome assembly for B. xylophilus. The AH1 assembly is much more continuous than the previous JP assembly. The AH1 assembly has the longest chromosome at 13 Mb, which is 60 times longer than the JP assembly (0.2 Mb), and the median contig lengths are 14 times longer than JP. In addition, the functional annotation and RNA‐Seq data analysis proved that more novel genes and isoforms could be identified with the new assembly, which should help researchers to capture the complete landscape of the B. xylophilus transcriptome. The newly discovered GH, GPCR and CYP families and differentially expressed genes with potentially adaptation‐critical functions will provide new insights for future pathogenicity‐related studies. The new assembly also generates a subset of AH1‐specific SNPs, which serves as the key tool to elucidate current B. xylophilus population structures in China.
The first report on B. xylophilus genome variations 23 found ~3 million SNPs based on JP assembly and concluded that the high level of genetic variations can be explained by a founder effect. 63 In our analysis, the number of SNPs is doubled to over 7 million using AH1 from 181 B. xylophilus strains. Obviously, the increasing sample sizes provide us with more genetic variation resources for downstream subpopulation detection. Our SNP profiling result indicates notable SNP variations among B. xylophilus strains in China and four different subpopulations could be identified in accordance with their latitudes changes. In addition, we found that GD strains may have been introduced from the USA, which led to distinct genome variation patterns compared with other strains (Fig. 4(b),(c)). The numbers of SNPs in each strain (Fig. 3(e)) also agree with the hypothesis that strains from GD might represent closer descendants of foreign ancestors. B. xylophilus is known as the local species in the USA and is most likely to be brought into GD via human‐mediated activities. 8 , 64 Similar research using SNP markers (located on 10 effector transcripts) to assess the geographical origins 22 grouped strains from China, the USA and Japan into one independent cluster. With limited sample sizes, the author did not give further classification within each country but proved that each geographic cluster might carry unique SNPs. Apart from the prediction results, we have nongenetic evidence to support part of the clustering results. In 2015, some infected pine wood was intercepted by the Yunnan (YN) government and the dealer confessed that it was illegally purchased from Sichuan (SC). This pine wood (YN01) was, and the clustering results perfectly support the fact that YN01 is clustered together with SC strains. The same situation can be found in SX and JX provinces as mentioned before. Introgression analysis also captures long‐distance migration events from GD to other provinces. Consequently, the current nematode populations in China are mixed with each other by severe cross‐infection while only small portions of introgressions can be traced in the southern part of China (GD).
On the other hand, population splitting analysis reveals that the genetic variations among different strains are possibly induced by temperature and precipitation while those two environmental factors normally interact with each other. Meanwhile, relevant studies usually indicate that temperature is important for the adaptation and survival of B. xylophilus. 65 , 66 , 67 , 68 This identification may suggest that the nematodes could evolve to adapt to different environments to expand their populations. The hypothesis is further confirmed by nonsynonymous SNPs (geographically associated) found on signaling‐related genes like GPCR families. 61 , 69 , 70 Above all, our study suggests that the nematode could evolve to adapt to different environments and spread to more areas with the help of the global warming effect. Coincidently, B. xylophilus was first found and killed many pine trees in Liaoning province (average temperature below 10 °C) recently while Liaoning was previously considered as an unsuitable areas for B. xylophilus to survive.
Additionally, our population classification results reveal finer population structure in China, adding more insights to previously underpowered work based on other molecular markers. Other similar studies using internal transcribed spacer PCR (ITS‐PCR), mitochondrial DNA, tandem repeat and the microsatellite marker method proposed that the B. xylophilus strains in China were grouped together as one major clade. 14 , 71 , 72 , 73 In addition, Mallez et al. 10 , 74 reported that a strong genetic variation was found in native strains (USA), low level or no sign of polymorphism in invaded area. All these findings indicate that the native B. xylophilus strains shows more obvious genetic variations than invasive strains. We believe that the abundant genome‐wide SNPs markers provide us with higher sensitivity than previous markers, which would in turn generate more insight results other than ITS, microsatellite and mitochondrial markers.
However, we do not observe distinct genetic patterns in JS, and it shares similar SNP variations with many other provinces. The first observation of B. xylophilus was in JS in 1982. 12 After that, this nematode spread rapidly to nearby areas from JS. It is quite obvious that infrastructure construction and other human activities greatly accelerate the spread speed and cross‐infection of this invasive nematode based on the annual statistics of B. xylophilus invaded counties issued by the State Forestry and Grassland Administration of China (http://english.forestry.gov.cn/). Thus, multiple introductions of B. xylophilus may homogenise genetic diversities in JS and other areas regardless of the population divisions. 10
The major concern in controlling pine wilt disease is to block the transmission route of B. xylophilus. Consequently, we present the first method in B. xylophilus to track the epidemic origin based on genomic information. Bootstrapping analysis showed that the model can predict with about 700 km of error for 90% of samples in our study. The results are largely in line with the studies on human population 18 where 90% of individuals could be placed within 840 km of their origin, even though a much larger sample size (n = 3192) was used. We noticed that the model tends to make more predictions near the center of all sampling locations, possibly attributable to the small sample size and the use of mean squared error for optimization. Even though the model still needs improvement for practical application in forest pest control, the accuracy will increase over time as more samples are added for training. It could still be used as a preliminary approach to track the potential spread route of B. xylophilus, as well as in conjunction with other measures to help the forestry administration to make pertinent prevention measures. It can slso be applied to any other species with sufficient re‐sequencing data to conduct such analysis.
5. CONCLUSION
In summary, generation of the new AH1 assembly greatly improves the genome blueprint with which genetic variations, and gene and transcript mapping in B. xylophilus can be studied. Although it is necessary to include more strains to get clustering result on a finer scale, we provide the first comprehensive catalog for SNPs of broad allele frequencies and origins in B. xylophilus and refined population structures using 181 strains from China and the USA. Above all, we need to be aware that B. xylophilus may be able to survive in areas with low temperatures beyond our early expectation and reinforcement of quarantine measures should be taken in those areas.
CONFLICT OF INTEREST
The authors declare no competing financial interests.
Supporting information
Figure S1. Detailed hybrid scaffolding result of AH1 assembly based on Bionano optical map.
Figure S2. Population splitting analysis of 181 Bursaphelenchus xylophlius strains. The color scheme is in accordance with Figure 4b.
Figure S3. Number of synonymous and nonsynonymous substitutions among different populations.
Figure S4. Introgression analysis results using Dsuite. The highlighted areas showed the same introgression events as identified by treemix.
Figure S5. Pro‐sequencing validation result of two selected SNPs for 181 strains. (a) SNP at Contig001:790035 (C to T) and (b) SNP at Contig007:3426052 (A to G).
Figure S6. SNPs among the 10 most frequently seen strains accounting for the top 5% of predictions with largest distances (error). The 10 strains are in blue, as shown on the left, followed by nearby strains in green. The labels on the right show sample name, sum of allele counts, and longitude and latitude of sampling location. While it is unclear what exactly caused abnormally large errors, one explanation is that some strains are far away from their closest neighbors, e.g. SC17, and some strains show drastically different genotypes compared with samples literally a few kilometers away, e.g. SC10. More samples, ideally uniformly distributed, will aid prediction accuracy and help decide whether some strains are recently introduced or not.
Table S1. Summary of sequencing data for AH1
Table S2. Genome polishing using short‐reads DNA‐Seq data
Table S3. Bacteria contamination identified from polished assembly
Table S4. BUSCO assessment results
Table S5. GH family annotation status among two different assemblies
Table S6. Primers design for novel transcripts
Table S7. Primers design for exon‐skipping events
Table S8. List of all 181 Bursaphelenchus xylophilus strains collected from different areas in China and the USA
Table S9. The resequencing DNA‐Seq map rate of 181 Bursaphelenchus xylophilus strains
Table S10. The detailed information of all SNPs identified from 181 Bursaphelenchus xylophilus strains
Table S11. Average climatic characteristics among different populations
Table S12. Pearson correlation coefficients of the principal components and climatic factors
Table S13. Primers design for pyro‐sequencing validation
ACKNOWLEDGEMENTS
This project is supported by the National Key Research and Development Project 2018YFD0600203 (J.Y.), the National Natural Science Foundation of China 31800543 (X.D.) and the Priority Academic Program Development of Jiangsu Higher Education Institutions (PAPD). We thank all Forestry Bureaus who kindly provided nematode samples in China. We thank Dr Wei Liang from Astrazeneca for providing valuable comments on this paper. We thank Qiang Chen for generating the sampling map in China and Mr. Kendal Alexander Whitlock for reviewing the manuscript.
Contributor Information
Jianren Ye, Email: njfu_jrye@163.com.
Xiaoqin Wu, Email: xqwu@njfu.edu.cn.
DATA ACCESSIBILITY
The data that support the findings of this study are available on request from the corresponding author. The genome assembly data for AH1 have been deposited in the NCBI archive under study PRJNA524063.
DATA AVAILABILITY STATEMENT
The data that support the findings of this study are openly available in NCBI at https://www.ncbi.nlm.nih.gov/.
REFERENCES
- 1. Mamiya Y, Pathology of the pine wilt disease caused by Bursaphelenchus xylophilus . Annu Rev Phytopathol 21:201–220 (1983). [DOI] [PubMed] [Google Scholar]
- 2. Soliman T, Mourits MCM, van der Werf W, Hengeveld GM, Robinet C and Lansink AGJMO, Framework for modelling economic impacts of invasive species, applied to pine wood nematode in Europe. PLoS One 7:e45505 (2012). [DOI] [PMC free article] [PubMed] [Google Scholar]
- 3. Mamiya Y, Pine wilt disease in Japan. Nematol Monogr Persp 1:9–20 (2004). [PMC free article] [PubMed] [Google Scholar]
- 4. Mota MM, Braasch H and Bravo MA, First report of Bursaphelenchus xylophilus in Portugal and in Europe. Nematology 1:727–734 (1999). [Google Scholar]
- 5. Inacio ML, Nobrega F, Vieira P, Bonifacio L, Naves P, Sousa E et al., First detection of Bursaphelenchus xylophilus associated with Pinus nigra in Portugal and in Europe. Forest Pathol 45:235–238 (2015). [Google Scholar]
- 6. Fonseca L, Cardoso JMS, Lopes A, Pestana M, Abreu F, Nunes N et al., The pinewood nematode, Bursaphelenchus xylophilus, in Madeira Island. Helminthologia 49:96–103 (2012). [Google Scholar]
- 7. Abelleira A, Picoaga A, Mansilla JP and Aguin O, Detection of Bursaphelenchus xylophilus, causal agent of pine wilt disease on Pinus pinaster in northwestern Spain. Plant Dis 95:776–776 (2011). [DOI] [PubMed] [Google Scholar]
- 8. Robinet C, Roques A, Pan HY, Fang GF, Ye JR, Zhang YZ et al., Role of human‐mediated dispersal in the spread of the pinewood nematode in China. PLoS One 4:e4646 (2009). [DOI] [PMC free article] [PubMed] [Google Scholar]
- 9. Simberloff D, Martin JL, Genovesi P, Maris V, Wardle DA, Aronson J et al., Impacts of biological invasions: what's what and the way forward. Trends Ecol Evol 28:58–66 (2013). [DOI] [PubMed] [Google Scholar]
- 10. Mallez S, Castagnone C, Espada M, Vieira P, Eisenback JD, Harrell M et al., Worldwide invasion routes of the pinewood nematode: what can we infer from population genetics analyses? Biol Invasions 17:1199–1213 (2015). [Google Scholar]
- 11. Takemoto S, Kanzaki N and Futai K, PCR‐RFLP image analysis: a practical method for estimating isolate‐specific allele frequency in a population consisting of two different strains of the pinewood nematode, Bursaphelenchus xylophilus (Aphelenchida: Aphelencoididae). Appl Entomol Zool 40:529–535 (2005). [Google Scholar]
- 12. Cheng XY, Cheng FX, Xu RM and Xie BY, Genetic variation in the invasive process of Bursaphelenchus xylophilus (Aphelenchida: Aphelenchoididae) and its possible spread routes in China. Heredity 100:356–365 (2008). [DOI] [PubMed] [Google Scholar]
- 13. Zhang K, Liu H, Sun J, Liu J, Fei K, Zhang C et al., Molecular phylogeny of geographical isolates of Bursaphelenchus xylophilus: implications on the origin and spread of this species in China and worldwide. J Nematol 40:127–137 (2008). [PMC free article] [PubMed] [Google Scholar]
- 14. Zhou LF, Chen FM, Xie LY, Pan HY and Ye JR, Genetic diversity of pine‐parasitic nematodes Bursaphelenchus xylophilus and Bursaphelenchus mucronatus in China. For Pathol 47:e12334 (2017). [Google Scholar]
- 15. Kwong QB, Teh CK, Ong AL, Heng HY, Lee HL, Mohamed M et al., Development and validation of a high‐density SNP genotyping array for African oil palm. Mol Plant 9:1132–1141 (2016). [DOI] [PubMed] [Google Scholar]
- 16. Sun J, Ma DR, Tang L, Zhao MH, Zhang GC, Wang WJ et al., Population genomic analysis and de novo assembly reveal the origin of weedy rice as an evolutionary game. Mol Plant 12:632–647 (2019). [DOI] [PubMed] [Google Scholar]
- 17. Su TB, Wang WH, Li PR, Zhang B, Li P, Xin XY et al., A genomic variation map provides insights into the genetic basis of spring Chinese cabbage (Brassica rapa ssp pekinensis) selection. Mol Plant 11:1360–1376 (2018). [DOI] [PubMed] [Google Scholar]
- 18. Novembre J, Johnson T, Bryc K, Kutalik Z, Boyko AR, Auton A et al., Genes mirror geography within Europe. Nature 456:98–101 (2008). [DOI] [PMC free article] [PubMed] [Google Scholar]
- 19. Morris GP, Ramu P, Deshpande SP, Hash CT, Shah T, Upadhyaya HD et al., Population genomic and genome‐wide association studies of agroclimatic traits in sorghum. Proc Natl Acad Sci USA 110:453–458 (2013). [DOI] [PMC free article] [PubMed] [Google Scholar]
- 20. Schloissnig S, Arumugam M, Sunagawa S, Mitreva M, Tap J, Zhu A et al., Genomic variation landscape of the human gut microbiome. Nature 493:45–50 (2013). [DOI] [PMC free article] [PubMed] [Google Scholar]
- 21. Naidoo N, Pawitan Y, Soong R, Cooper DN and Ku CS, Human genetics and genomics a decade after the release of the draft sequence of the human genome. Hum Genomics 5:577–622 (2011). [DOI] [PMC free article] [PubMed] [Google Scholar]
- 22. Figueiredo J, Simoes MJ, Gomes P, Barroso C, Pinho D, Conceicao L et al., Assessment of the geographic origins of pinewood nematode isolates via single nucleotide polymorphism in effector genes. PLoS One 8:e83542 (2013). [DOI] [PMC free article] [PubMed] [Google Scholar]
- 23. Palomares‐Rius JE, Tsai IJ, Karim N, Akiba M, Kato T, Maruyama H et al., Genome‐wide variation in the pinewood nematode Bursaphelenchus xylophilus and its relationship with pathogenic traits. BMC Genomics 16:845 (2015). [DOI] [PMC free article] [PubMed] [Google Scholar]
- 24. Kikuchi T, Cotton JA, Dalzell JJ, Hasegawa K, Kanzaki N, McVeigh P et al., Genomic insights into the origin of parasitism in the emerging plant pathogen Bursaphelenchus xylophilus . PLoS Pathog 7:e1002219 (2011). [DOI] [PMC free article] [PubMed] [Google Scholar]
- 25. Alkan C, Sajjadian S and Eichler EE, Limitations of next‐generation genome sequence assembly. Nat Methods 8:61–65 (2011). [DOI] [PMC free article] [PubMed] [Google Scholar]
- 26. Chaisson MJP, Wilson RK and Eichler EE, Genetic variation and the de novo assembly of human genomes. Nat Rev Genet 16:627–640 (2015). [DOI] [PMC free article] [PubMed] [Google Scholar]
- 27. Pendleton M, Sebra R, Pang AWC, Ummat A, Franzen O, Rausch T et al., Assembly and diploid architecture of an individual human genome via single‐molecule technologies. Nat Methods 12:780–786 (2015). [DOI] [PMC free article] [PubMed] [Google Scholar]
- 28. Shi L, Guo Y, Dong C, Huddleston J, Yang H, Han X et al., Long‐read sequencing and de novo assembly of a Chinese genome. Nat Commun 7:12065 (2016). [DOI] [PMC free article] [PubMed] [Google Scholar]
- 29. Eid J, Fehr A, Gray J, Luong K, Lyle J, Otto G et al., Real‐time DNA sequencing from single polymerase molecules. Science 323:133–138 (2009). [DOI] [PubMed] [Google Scholar]
- 30. Cao H, Tegenfeldt JO, Austin RH and Chou SY, Gradient nanostructures for interfacing microfluidics and nanofluidics. Appl Phys Lett 81:3058–3060 (2002). [Google Scholar]
- 31. Viglierchio DR and Schmitt RV, On the methodology of nematode extraction from field samples: baermann funnel modifications. J Nematol 15:438–444 (1983). [PMC free article] [PubMed] [Google Scholar]
- 32. Ding X, Ye J, Lin S, Wu X, Li D and Nian B, Deciphering the molecular variations of pine wood nematode Bursaphelenchus xylophilus with different virulence. PLoS One 11:e0156040 (2016). [DOI] [PMC free article] [PubMed] [Google Scholar]
- 33. Stewart CN Jr and Via LE, A rapid CTAB DNA isolation technique useful for RAPD fingerprinting and other PCR applications. Biotechniques 14:748–750 (1993). [PubMed] [Google Scholar]
- 34. Simao FA, Waterhouse RM, Ioannidis P, Kriventseva EV and Zdobnov EM, BUSCO: assessing genome assembly and annotation completeness with single‐copy orthologs. Bioinformatics 31:3210–3212 (2015). [DOI] [PubMed] [Google Scholar]
- 35. Vaser R, Sovic I, Nagarajan N and Sikic M, Fast and accurate de novo genome assembly from long uncorrected reads. Genome Res 27:737–746 (2017). [DOI] [PMC free article] [PubMed] [Google Scholar]
- 36. Altschul SF, Gish W, Miller W, Myers EW and Lipman DJ, Basic local alignment search tool. J Mol Biol 215:403–410 (1990). [DOI] [PubMed] [Google Scholar]
- 37. Mikheenko A, Prjibelski A, Saveliev V, Antipov D and Gurevich A, Versatile genome assembly evaluation with QUAST‐LG. Bioinformatics 34:142–150 (2018). [DOI] [PMC free article] [PubMed] [Google Scholar]
- 38. Burton JN, Adey A, Patwardhan RP, Qiu RL, Kitzman JO and Shendure J, Chromosome‐scale scaffolding of de novo genome assemblies based on chromatin interactions. Nat Biotechnol 31:1119–1125 (2013). [DOI] [PMC free article] [PubMed] [Google Scholar]
- 39. Gurevich A, Saveliev V, Vyahhi N and Tesler G, QUAST: quality assessment tool for genome assemblies. Bioinformatics 29:1072–1075 (2013). [DOI] [PMC free article] [PubMed] [Google Scholar]
- 40. Holt C and Yandell M, MAKER2: an annotation pipeline and genome‐database management tool for second‐generation genome projects. BMC Bioinf 12:491 (2011). [DOI] [PMC free article] [PubMed] [Google Scholar]
- 41. Trapnell C, Roberts A, Goff L, Pertea G, Kim D, Kelley DR et al., Differential gene and transcript expression analysis of RNA‐seq experiments with TopHat and cufflinks. Nat Protoc 7:562–578 (2012). [DOI] [PMC free article] [PubMed] [Google Scholar]
- 42. Kim D, Pertea G, Trapnell C, Pimentel H, Kelley R and Salzberg SL, TopHat2: accurate alignment of transcriptomes in the presence of insertions, deletions and gene fusions. Genome Biol 14:R36 (2013). [DOI] [PMC free article] [PubMed] [Google Scholar]
- 43. Trapnell C, Hendrickson DG, Sauvageau M, Goff L, Rinn JL and Pachter L, Differential analysis of gene regulation at transcript resolution with RNA‐seq. Nat Biotechnol 31:46–53 (2013). [DOI] [PMC free article] [PubMed] [Google Scholar]
- 44. Ye Z, Chen Z, Lan X, Hara S, Sunkel B, Huang TH et al., Computational analysis reveals a correlation of exon‐skipping events with splicing, transcription and epigenetic factors. Nucleic Acids Res 42:2856–2869 (2014). [DOI] [PMC free article] [PubMed] [Google Scholar]
- 45. Li H and Durbin R, Fast and accurate long‐read alignment with burrows‐wheeler transform. Bioinformatics 26:589–595 (2010). [DOI] [PMC free article] [PubMed] [Google Scholar]
- 46. Li H, Handsaker B, Wysoker A, Fennell T, Ruan J, Homer N et al., The sequence alignment/map format and SAMtools. Bioinformatics 25:2078–2079 (2009). [DOI] [PMC free article] [PubMed] [Google Scholar]
- 47. Garrison E and Marth G, Haplotype‐based variant detection from short‐read sequencing. arXiv preprint arXiv:12073907 [q‐bioGN] 2012).
- 48. Danecek P, Auton A, Abecasis G, Albers CA, Banks E, DePristo MA et al., The variant call format and VCFtools. Bioinformatics 27:2156–2158 (2011). [DOI] [PMC free article] [PubMed] [Google Scholar]
- 49. Zheng X, Levine D, Shen J, Gogarten SM, Laurie C and Weir BS, A high‐performance computing toolset for relatedness and principal component analysis of SNP data. Bioinformatics 28:3326–3328 (2012). [DOI] [PMC free article] [PubMed] [Google Scholar]
- 50. Pickrell JK and Pritchard JK, Inference of population splits and mixtures from genome‐wide allele frequency data. PLoS Genet 8:e1002967 (2012). [DOI] [PMC free article] [PubMed] [Google Scholar]
- 51. Chang CC, Chow CC, Tellier LC, Vattikuti S, Purcell SM and Lee JJ, Second‐generation PLINK: rising to the challenge of larger and richer datasets. GigaScience 4:7 (2015). [DOI] [PMC free article] [PubMed] [Google Scholar]
- 52. Wang K, Li MY and Hakonarson H, ANNOVAR: functional annotation of genetic variants from high‐throughput sequencing data. Nucleic Acids Res 38:e164 (2010). [DOI] [PMC free article] [PubMed] [Google Scholar]
- 53. Bergstra J and Bengio Y, Random search for hyper‐parameter optimization. J Mach Learn Res 13:281–305 (2012). [Google Scholar]
- 54. Pedregosa F, Varoquaux G, Gramfort A, Michel V, Thirion B, Grisel O et al., Scikit‐learn: machine learning in python. J Mach Learn Res 12:2825–2830 (2011). [Google Scholar]
- 55. Chen T and Guestrin C, Xgboost: a scalable tree boosting system, in Proceedings of the 22nd Acm Sigkdd International Conference on Knowledge Discovery and Data Mining. ACM, United States of America, pp. 785–794 (2016). [Google Scholar]
- 56. van Brummelen G, Heavenly Mathematics: The Forgotten Art of Spherical Trigonometry. Princeton University Press, United States of America: (2012). [Google Scholar]
- 57. Efron B, Bayesian inference and the parametric bootstrap. Ann Appl Stat 6:1971–1997 (2012). [DOI] [PMC free article] [PubMed] [Google Scholar]
- 58. Cotton JA, Lilley CJ, Jones LM, Kikuchi T, Reid AJ, Thorpe P et al., The genome and life‐stage specific transcriptomes of Globodera pallida elucidate key aspects of plant parasitism by a cyst nematode. Genome Biol 15:R43 (2014). [DOI] [PMC free article] [PubMed] [Google Scholar]
- 59. Anderson CA, Pettersson FH, Clarke GM, Cardon LR, Morris AP and Zondervan KT, Data quality control in genetic case‐control association studies. Nat Protoc 5:1564–1573 (2010). [DOI] [PMC free article] [PubMed] [Google Scholar]
- 60. Wang F, Li D, Chen Q and Ma L, Genome‐wide survey and characterization of the small heat shock protein gene family in Bursaphelenchus xylophilus . Gene 579:153–161 (2016). [DOI] [PubMed] [Google Scholar]
- 61. Geary TG and Kubiak TM, Neuropeptide G‐protein‐coupled receptors, their cognate ligands and behavior in Caenorhabditis elegans . Trends Pharmacol Sci 26:56–58 (2005). [DOI] [PubMed] [Google Scholar]
- 62. Lin S, Jian H, Zhao H, Yang D and Liu Q, Cloning and characterization of a venom allergen‐like protein gene cluster from the pinewood nematode Bursaphelenchus xylophilus . Exp Parasitol 127:440–447 (2011). [DOI] [PubMed] [Google Scholar]
- 63. Li JZ, Absher DM, Tang H, Southwick AM, Casto AM, Ramachandran S et al., Worldwide human relationships inferred from genome‐wide patterns of variation. Science 319:1100–1104 (2008). [DOI] [PubMed] [Google Scholar]
- 64. Kanzaki N and Futai K, A PCR primer set for determination of phylogenetic relationships of Bursaphelenchus species within the xylophilus group. Nematology 4:35–41 (2002). [Google Scholar]
- 65. Wang BW, Hao X, Xu JY, Wang BY, Ma W, Liu XF et al., Cytochrome P450 metabolism mediates low‐temperature resistance in pinewood nematode. FEBS Open Bio 10:1171–1179 (2020). [DOI] [PMC free article] [PubMed] [Google Scholar]
- 66. Chen QL, Zhang RZ, Li DL, Wang F, Jiang SW and Wang JN, Trehalose in pine wood nematode participates in DJ3 formation and confers resistance to low‐temperature stress. BMC Genomics 22:524 (2021). [DOI] [PMC free article] [PubMed] [Google Scholar]
- 67. Iki T, Matsunaga K, Hirao T, Ohira M, Yamanobe T, Iwaizumi MG et al., Effects of temperature factors on resistance against pine wood nematodes in Pinus thunbergii, based on multiple location sites nematode inoculation tests. Forests 11:922 (2020). [Google Scholar]
- 68. Panesar TS, Peet FG, Sutherland JR and Sahota TS, Effects of temperature, relative humidity and time on survival of pinewood nematodes in wood chips. For Pathol 24:287–299 (2010). [Google Scholar]
- 69. Wang F, Wang Z, Li D and Chen Q, Identification and characterization of a Bursaphelenchus xylophilus (Aphelenchida: Aphelenchoididae) thermotolerance‐related gene: Bx‐HSP90 . Int J Mol Sci 13:8819–8833 (2012). [DOI] [PMC free article] [PubMed] [Google Scholar]
- 70. Maman M, Marques FC, Volovik Y, Dubnikov T, Bejerano‐Sagie M and Cohen E, A neuronal GPCR is critical for the induction of the heat shock response in the nematode C. elegans . J Neurosci 33:6102–6111 (2013). [DOI] [PMC free article] [PubMed] [Google Scholar]
- 71. Pereira F, Moreira C, Fonseca L, van Asch B, Mota M, Abrantes I et al., New insights into the phylogeny and worldwide dispersion of two closely related nematode species, Bursaphelenchus xylophilus and Bursaphelenchus mucronatus . PLoS One 8:e56288 (2013). [DOI] [PMC free article] [PubMed] [Google Scholar]
- 72. Jung J, Han H, Ryu SH and Kim W, Microsatellite variation in the pinewood nematode, Bursaphelenchus xylophilus (Steiner and Buhrer) Nickle in South Korea. Genes Genomics 32:151–158 (2010). [Google Scholar]
- 73. Vieira P, Castagnone C, Mallez S, Espada M, Navas A, Mota M et al., Sequence variability of the Mspi satellite DNA family of the pinewood nematode Bursaphelenchus xylophilus at different geographic scales. J Nematol 45:324–324, 129 (2013). [DOI] [PubMed] [Google Scholar]
- 74. Mallez S, Castagnone C, Espada M, Vieira P, Eisenback JD, Mota M et al., First insights into the genetic diversity of the pinewood nematode in its native area using new polymorphic microsatellite loci. PLoS One 8:e59165 (2013). [DOI] [PMC free article] [PubMed] [Google Scholar]
Associated Data
This section collects any data citations, data availability statements, or supplementary materials included in this article.
Supplementary Materials
Figure S1. Detailed hybrid scaffolding result of AH1 assembly based on Bionano optical map.
Figure S2. Population splitting analysis of 181 Bursaphelenchus xylophlius strains. The color scheme is in accordance with Figure 4b.
Figure S3. Number of synonymous and nonsynonymous substitutions among different populations.
Figure S4. Introgression analysis results using Dsuite. The highlighted areas showed the same introgression events as identified by treemix.
Figure S5. Pro‐sequencing validation result of two selected SNPs for 181 strains. (a) SNP at Contig001:790035 (C to T) and (b) SNP at Contig007:3426052 (A to G).
Figure S6. SNPs among the 10 most frequently seen strains accounting for the top 5% of predictions with largest distances (error). The 10 strains are in blue, as shown on the left, followed by nearby strains in green. The labels on the right show sample name, sum of allele counts, and longitude and latitude of sampling location. While it is unclear what exactly caused abnormally large errors, one explanation is that some strains are far away from their closest neighbors, e.g. SC17, and some strains show drastically different genotypes compared with samples literally a few kilometers away, e.g. SC10. More samples, ideally uniformly distributed, will aid prediction accuracy and help decide whether some strains are recently introduced or not.
Table S1. Summary of sequencing data for AH1
Table S2. Genome polishing using short‐reads DNA‐Seq data
Table S3. Bacteria contamination identified from polished assembly
Table S4. BUSCO assessment results
Table S5. GH family annotation status among two different assemblies
Table S6. Primers design for novel transcripts
Table S7. Primers design for exon‐skipping events
Table S8. List of all 181 Bursaphelenchus xylophilus strains collected from different areas in China and the USA
Table S9. The resequencing DNA‐Seq map rate of 181 Bursaphelenchus xylophilus strains
Table S10. The detailed information of all SNPs identified from 181 Bursaphelenchus xylophilus strains
Table S11. Average climatic characteristics among different populations
Table S12. Pearson correlation coefficients of the principal components and climatic factors
Table S13. Primers design for pyro‐sequencing validation
Data Availability Statement
The data that support the findings of this study are available on request from the corresponding author. The genome assembly data for AH1 have been deposited in the NCBI archive under study PRJNA524063.
The data that support the findings of this study are openly available in NCBI at https://www.ncbi.nlm.nih.gov/.