

Abstract
Background and Aims
Androgen receptor (AR) has been reported to play an important role in the development and progression of man’s prostate cancer. Hepatocellular carcinoma (HCC) is also male‐dominant, but the role of AR in HCC remains poorly understood. Mechanistic target of rapamycin complex 1 (mTORC1) also has been reported to be highly activated in HCC. In this study, we aimed to explore the role of AR phosphorylation and its relationship with mTORC1 in hepatocarcinogenesis.
Approach and Results
In vitro experiment, we observed that mTORC1 interacts with hepatic AR and phosphorylates it at S96 in response to nutrient and mitogenic stimuli in HCC cells. S96 phosphorylation promotes the stability, nuclear localization, and transcriptional activity of AR, which enhances de novo lipogenesis and proliferation in hepatocytes and induces liver steatosis and hepatocarcinogenesis in mice independently and cooperatively with androgen. Furthermore, high ARS96 phosphorylation is observed in human liver steatotic and HCC tissues and is associated with overall survival and disease‐free survival, which has been proven as an independent survival predictor for patients with HCC.
Conclusions
AR S96 phosphorylation by mTORC1 drives liver steatosis and HCC development and progression independently and cooperatively with androgen, which not only explains why HCC is man‐biased but also provides a target molecule for prevention and treatment of HCC and a potential survival predictor in patients with HCC.
INTRODUCTION
Hepatocellular carcinoma (HCC) is the predominant form of liver cancer and was a leading cause of cancer‐related death in 2018.[ 1 ] According to the American Cancer Society (https://www.cancer.org/cancer/liver‐cancer/about/what‐is‐key‐statistics.html), liver cancer incidence and death rates in the United States have more than tripled and doubled, respectively, over the last four decades. A major risk factor of HCC is NAFLD, the most common type of liver disease, with over 100 million cases in the United States alone,[ 2 ] which is mainly caused by excessive high dietary sugar and fat intake.[ 3 ] Interestingly, HCC is strongly male‐dominant. HCC has a male‐to‐female ratio between 2:1 and 7:1 regardless of etiology, ethnicity, and geography.[ 4 , 5 ] Although the gender disparity in HCC is well recognized, the underlying molecular mechanisms remain poorly understood. Androgen receptor (AR) is a member of the steroid hormone receptor superfamily. On androgen stimulation in prostate cells, AR migrates into the nucleus, where it binds with androgen response elements (AREs) in the promoter of target genes and controls their expression.[ 6 , 7 ] AR is an established driver and therapeutic target in prostate cancer. It is also thought to play a role in male‐biased HCC.[ 8 , 9 ] AR has been proposed to mediate hepatitis B virus (HBV)‐dependent hepatocarcinogenesis,[ 10 ] which, however, cannot fully explain the gender difference that is present in both viral and nonviral HCC.
Mechanistic target of rapamycin (mTOR) is a highly conserved protein kinase.[ 11 , 12 ] It forms two distinct complexes, mTORC1 and mTORC2.[ 13 ] mTORC1 is a master regulator of nutrient signaling and a central controller of cell growth and metabolism.[ 11 , 12 ] Chronic hyperactivation of mTORC1 underlies the epidemic of obesity. Excessive mTORC1 signaling is thought to be a major cause of NAFLD and HCC. For example, mTORC1 activation is commonly observed in human NAFLD and HCC clinical samples, and persistent activation of mTORC1 signaling is sufficient to induce hepatosteatosis and disease progression to HCC in animal models.[ 14 , 15 ] We previously found that AR is frequently overexpressed and activated in human HCC clinical samples, which is correlated with poor prognosis.[ 16 ] Furthermore, mTORC1 is required for the stability and nuclear localization of AR in HCC cells.[ 16 ] However, precisely how mTORC1 regulates hepatic AR is not known.
Herein, we report the finding that hepatic AR is a direct target of mTORC1. mTORC1 regulates AR stability and activity through S96 phosphorylation, promoting de novo lipogenesis and proliferation in vitro and development of liver steatosis and tumors in vivo. Moreover, elevated S96 phosphorylation in clinical samples is associated with liver steatosis and HCC progression and poor prognosis. These findings reveal that AR is a driver of hepatic steatosis and tumorigenesis in response to nutrient‐mTORC1 and androgen signaling.
MATERIALS AND METHODS
Cell culture, transfection, and drugs
SNU449 and SNU423, human HCC cell lines were preserved in the State Key Lab of Oncology in South China and cultured in RPMI1640 (Invitrogen #C11875500BT) supplemented with 10% fetal bovine serum (FBS; Invitrogen #10099‐141), 100 units/ml penicillin, and 100 μg/ml streptomycin in a humidified atmosphere containing 5% CO2. Human embryonic kidney (HEK) 293T human cell lines, which can be transfected by the various techniques with efficiencies approaching 100%, and MEFTSC1+/+/MEFTSC−/− mice cell lines, which negatively/positively regulate mTOR activity, were cultured in DMEM (Invitrogen #C11995500BT) supplemented with 10% FBS (Invitrogen #10099‐141). All cell lines were authenticated by short tandem repeat DNA profiling (Microread Diagnostics Co., Ltd.). Nutrient starvation of cells was first cultured in total nutrient medium with 10% FBS for at least 3 days, followed by 24 h starvation of amino acid (AA), FBS, or glucose (G) using different nutrient deficient mediums (Caisson #RPL22‐500ML, Chenxue Biotech #CM10043). For the hormone‐stimulation experiment, cells were incubated in phenol‐red free DMEM or 1640 supplemented with 5% charcoal/dextran‐treated FBS.
Cell transfection was conducted by lipo3000 reagent (Invitrogen) or DNA transfection reagent (Neofect) according to the manufacturers’ instructions. Rapamycin (Selleck Chemicals) was used at 200 nM for experiments. Methyltrienolone (R1881) (Perkin Elmer) was used at 10−8 M for experiments. Cycloheximide (Sigma) was used at 100 μg/ml for different time, dissolved in DMSO. MG132 (Stemcell) was used at 200 nM dissolved in DMSO for experiment.
Double luciferase reporter gene experiment
ARE‐luciferase (Luc) report assay: 1 × 10⁵ cells were seeded in NEST 24‐well plates, and when cells reached 70–80% confluence, they were transfected in each well with 1 μg AR plasmids for 24 h and then added 1 μg pGMARE‐Lu (Shanghai YEASEN) and 10 ng pRL‐TK (Renilla Luc) (Shanghai YEASEN) for another 24 h. The double Luc reporter gene was determined using the Dual‐Luciferase Reporter Assay Kit (Promega) and was tested by GloMax2020 Luminescence detector E5331 (Promega) according to the manufacturer’s instructions. The Luc activity of the gene promoter was normalized to Renilla Luc activity as an internal standard control. Sterol regulatory element binding protein 1 (SREBP1) Luc report assay: PGL4.10‐SREBP1 reporter plasmids were constructed by PCR cloning of SREBP1 promoter into PGL4.10‐Basic plasmids using the In‐Fusion HD Cloning Kit (Takara #639648) and were confirmed by Sanger sequencing (Ruibiotech). Then, the double Luc reporter gene assay was performed as before. One treatment group was detected with three or more duplicates in every experiment, and three independent experiments were conducted. T test was used for analysis.
Immunoprecipitation
For co‐immunoprecipitation (co‐IP) of AR and mTOR in whole‐cell proteins, SNU449 cells were cultured for at least 2 days and then lysated in Pierce IP Lysis Buffer (Invitrogen) with 1 mM phenylmethyl sulfonyl fluoride (KeyGEN), 1× protease inhibitors (KeyGEN), 1× phosphatase inhibitors (KeyGEN), and the supernatant was collected after centrifugation at 14,000 × g. The protein lysate was quantified with BCA Protein Assay Kit (Thermo Scientific). The equal concentration and volume of protein lysate was incubated with specific antibodies and protein A/G Sepharose beads (Life) for co‐IP assay. The precipitated protein complexes were washed using IP lysis buffer at least five times before being separated on SDS‐PAGE and immunoblotting by the indicated antibodies.
Proximity ligation assay
Proximity ligation assay (PLA) was used to visually detection whether and where two proteins were connected to each other using the in situ kit (Sigma‐Aldrich #DUO92101) following the protocol. Briefly, cells were transfected with HA‐mTOR for 48 h and incubated with anti‐AR rabbit antibodies and anti‐HA mice antibodies at 4℃ overnight. Cells were then incubated with PLA probes and ligase. After that, nuclei was stained with DAPI (Abcam). Finally, the results were analyzed with an LSM880 (Zeiss) confocal microscope.
Mass spectrometry
For mass spectrometry of AR protein phosphorylation, SNU449 cells cultured in 15‐cm dishes were lysated in Pierce IP Lysis Buffer (Invitrogen) with 1 mM phenylmethyl sulfonyl fluoride (KeyGEN), 1× protease inhibitors (KeyGEN), and 1× phosphatase inhibitors (KeyGEN), and the supernatant was collected after centrifugation. The supernatant was incubated with anti‐AR antibodies (Cell Signaling Technology Company) and protein A/G Sepharose beads (Life) overnight at 4℃ according to the co‐IP protocol. The co‐IP materials were then separated on SDS‐PAGE and stained by Coomassie blue staining. Finally, the indicated gel band was cut and identified by Matrix‐assisted laser desorption/ionization‐time of flight (MALDI‐TOF) mass spectrometry by H‐Wayen Biotechnology.
Immunohistochemistry
The immunohistochemistry (IHC) was carried out as previously described. The antigen retrieval was conducted by a pressure cooker at full pressure for 3 min in the EDTA buffer pH 8.0 (ORIGENE # ZLI‐9067) and then blocked in 10% FBS for 1 h. Then, the paraffin sections were incubated with the first antibodies diluted in antibodies diluent buffer (ORIGENE # ZLI‐9029) at 4℃ overnight and with horseradish peroxidase−conjugated secondary antibody (ORIGENE # ZLI‐9017) at 37℃ for 1 h. Finally, 3,3´‐diaminobenzidine chromogenic solutions (ORIGENE # ZLI‐9017) were used to detect the positive staining.
In the conformation experiment of the specificity of the custom anti‐AR‐pS96 antibody, we first mixed 1 μl anti‐ARpS96 antibodies (0.5 mg/ml) with 0.5 mg synthetic phosphorylated or nonphosphorylated AR‐S96 peptides(91‐‐QGEDG{pSer/Ser}PQAHRRGP‐‐104) (Genscript), respectively, and incubated the mixture at 4℃ overnight to block the antibody. Then, the antibodies were diluted to 1:1,000 for IHC assay in consecutive sections of mouse and human liver tissues.
Human normal and steatotic liver tissue analysis
Four human normal liver tissues and three steatotic liver tissues were collected from patients with hepatic hemangioma or liver adenoma who were subjected to surgery from January 2019 to June 2020 at Sun Yat‐Sen University Cancer Center, China. These samples were evaluated by an experienced pathologist. None of the patients had received any tumor‐related treatment except surgery. These samples were detected with IHC to estimate AR‐pS96 expression. This research was approved by the Research Ethics Committee of the Sun Yat‐Sen University Cancer Center. Written informed consent was obtained from all the patients. No donor organs were obtained from executed prisoners or other institutionalized persons.
For additional materials and methods, see the Supporting Information.
RESULTS
Regulation of hepatic AR by mitogenic and nutrient signals
We previously found that AR is a downstream target of mTORC1 signaling.[ 16 ] Because mTORC1 is a central controller of mitogenic and nutrient signaling, we asked if hepatic AR activity responds to mitogenic and nutrient stimulation in hepatocytes. To this end, a Luc reporter under the control of ARE was used to measure AR activity (Figure 1A). The transcriptional activity of AR was notably repressed by starvation from FBS or G but not AA in SNU449 and SNU423 HCC cells (Figure 1B). Similarly, starvation from FBS and G, but not AA, led to down‐regulation of AR protein level (Figure 1C), whereas AR mRNA level was not affected (Figure S1A). Starvation of FBS and G, but not AA, also attenuated activation of ARE‐Luc reporter by the synthetic androgen R1881 in HCC cells (Figure 1D,E). These results indicate that AR selectively responds to stimulation by G and mitogenic signals independently of and cooperatively with androgen. Consistent with our previous observation,[ 16 ] rapamycin similarly inhibited ARE reporter activity and protein expression in the absence or presence of R1881 (Figures 1F and S1B), suggesting that mTORC1 is a mediator of the nutrient and mitogenic effects.
FIGURE 1.
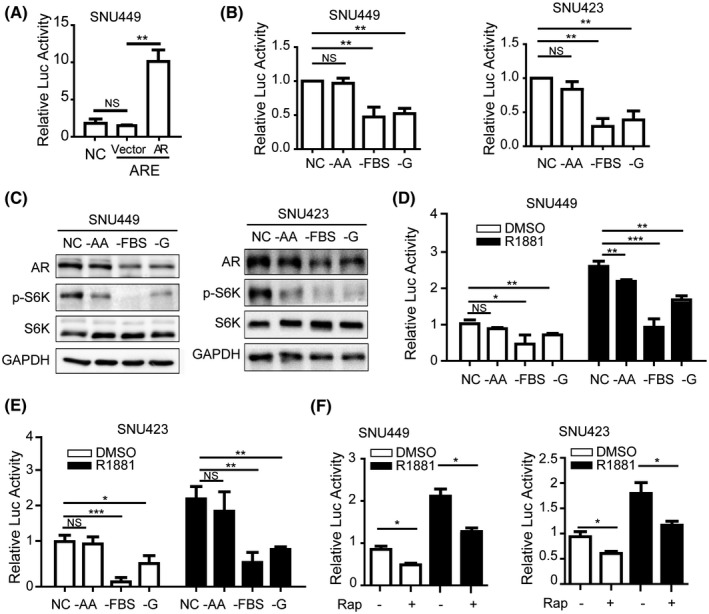
AR undergoes the regulation of mTOR to sense the sufficient nutrients. AR activates transcription in HCC cells. AR or a control plasmid vector was transiently transfected together with an ARE‐Luc in SNU449 cells and measured for Luc activity. AR, pT3‐HA‐AR plasmids; ARE, cells transfected with pGMARE‐Lu plasmids containing ARE sequence as an experimental group of the report gene system; NC, cells transfected with pGM vector plasmids as a negative control of reporter gene system; vector, control vector of pT3. Data (mean ± SD, n = 3) were analyzed by unpaired two‐tailed t test; NS, no statistical significance; **p < 0.01. (B) G and FBS, but not AA, activate AR transcription in HCC cells. SNU449 and SNU423 cells carrying ARE‐Luc reporter were deprived of AA, FBS, or G for 24 h, and measured for Luc activity. NC, no starvation, complete medium containing AA, FBS, and G. Data (mean ± SD, n = 3). **p < 0.01. (C) G and FBS, but not AA, regulate AR protein in HCC cells. AR, p‐S6K, and S6K were measured by immunoblot. NC, no starvation, complete medium containing AA, FBS, and G. GAPDH was used as a loading control. (D,E) Nutrient and mitogen regulate AR transcription cooperatively with yet independently of androgen in HCC cells. SNU449 (D) and SNU423 (E) cells carrying ARE‐Luc reporter were deprived of AA, FBS, or G in the absence or presence of R1881 for 24 h and measured for Luc activity. NC, no starvation, complete medium containing AA, FBS, and G. Data (mean ± SD, n = 3). *p < 0.05, **p < 0.01, ***p < 0.001. (F) mTORC1 regulates AR transcription cooperatively with yet independently of androgen in HCC cells. SNU449 and SNU423 cells carrying ARE‐Luc reporter were treated without or with rapamycin in the absence or presence of R1881 for 24 h and measured for Luc activity. Data (mean ± SD, n = 3). *p < 0.05
mTORC1 interacts with AR and regulates AR phosphorylation in a hormone‐independent manner
To see if mTORC1 has a direct role in regulating AR, we examined their possible interaction by co‐IP of endogenous AR and mTOR. The results showed that when AR was immunoprecipitated, mTOR was detected in the anti‐AR IP but not in an IgG control IP (Figure 2A). Conversely, when mTOR was immunoprecipitated, AR was detected in the anti‐mTOR IP but not in an IgG control IP (Figure 2A). We further investigated subcellular localization of AR and mTOR with immunofluorescence, and their interaction in intact HCC cells using PLA.[ 17 ] Both AR and mTOR were found to be distributed throughout the cells, with AR and mTOR predominantly in the nucleus and cytoplasm, respectively (Figure 2B). Interestingly, AR‐mTOR interaction appeared to be mainly in the cytoplasm (Figures 2C and S2). These results demonstrate that mTOR and AR specifically interact with each other.
FIGURE 2.
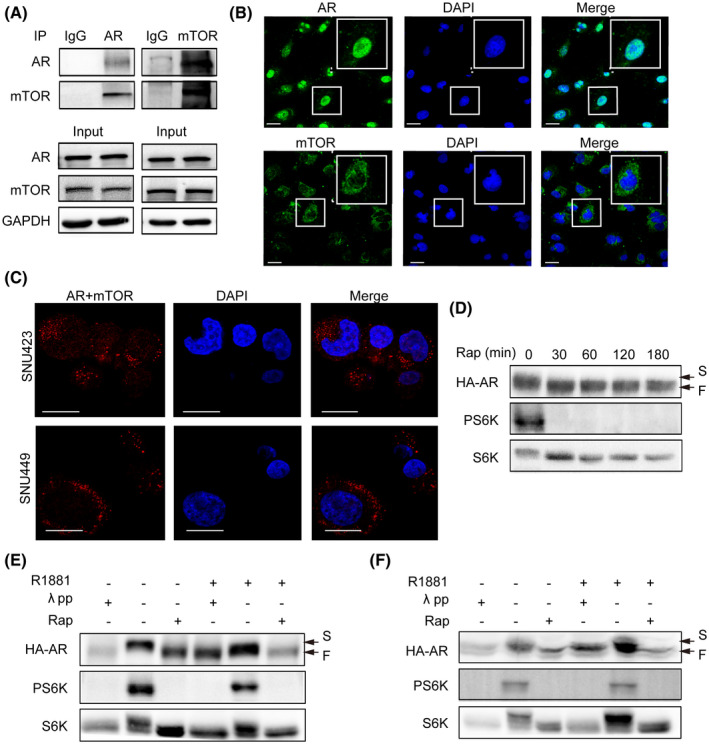
mTOR interacts with AR and regulates AR phosphorylation. mTOR interacts with AR. Left panel: AR was immunoprecipitated from SNU449 cells with an anti‐AR antibody. The anti‐AR IP was analyzed by immunoblot with AR and mTOR antibodies. Right panel: mTOR was immunoprecipitated from SNU449 cells with an anti‐mTOR antibody. The anti‐mTOR IP was analyzed by immunoblot with AR and mTOR antibodies. GAPDH was used as a loading control. Subcellular localization of AR and mTOR. AR and mTOR was analyzed by IF in SNU449. Nuclei were stained deep blue by DAPI. (Scale bar = 10 μm). (C) mTOR interacts with AR in intact HCC cells. In situ interaction between mTOR and AR was carried out by PLA in SNU449 and SNU423 cells. Nuclei were stained by DAPI. (Scale bar = 10 μm.) (D) Rapamycin increases electrophoretic mobility of AR protein. HA‐AR was transiently expressed in HEK293T cells. Then, the cells were treated with rapamycin for different times and measured for electrophoretic mobility. (E,F) mTORC1 regulates AR phosphorylation in a hormone‐independent manner. HA‐AR was transiently expressed in HEK293T cells. Then, the cells were treated with rapamycin in the absence or presence of R1881. Extracts of control cells treated without or with R1881 were also treated with λ pp. (E) and (F) are two repeated and independent assays. F, fast mobility form; S, slow mobility form
Because mTOR is a serine/threonine protein kinase that regulates downstream effectors by phosphorylation, we further asked if mTORC1 regulates AR through phosphorylation. We found that the electrophoretic mobility of HA‐AR was markedly increased 30 min following rapamycin treatment (Figure 2D). Treatment with λ phosphatase (λ pp) also increased electrophoretic mobility of HA‐AR (Figure 2E,F), indicating that the slow electrophoretic band of HA‐AR is a hyperphosphorylated form and the fast band is the hypophosphorylated form. In contrast, R1881 did not affect the electrophoretic mobility of HA‐AR and λ pp‐induced or rapamycin‐induced electrophoretic mobility change (Figure 2E,F). Together, these results show that mTORC1 regulates AR phosphorylation in a hormone‐independent manner.
mTORC1 regulates AR phosphorylation at S96 in vivo and phosphorylates S96 in vitro
To determine if the phosphorylation site(s) of AR is regulated by mTORC1, we performed MALDI TOF mass spectrometry analysis of AR proteins isolated from SNU449 cells. The results revealed several major phosphorylation sites on AR protein, including S96, S215, S258, S310, and S650 (Table S1). To pinpoint the specific mTORC1‐dependent site(s), we mutated each of the five serine residues of HA‐AR to alanine or glutamate to mimic the dephosphorylated and phosphorylated state, respectively. Interestingly, only HA‐ARS96E and HA‐ARS96A exhibited significant difference in electrophoretic mobility, which was similar to the hyperphosphorylated and hypophosphorylated form, respectively (Figure 3A). Importantly, both the S96A and S96E mutants no longer underwent electrophoretic changes in response to rapamycin treatment (Figure 3B). These results indicate that S96 is the mTORC1‐dependent phosphorylation site.
FIGURE 3.
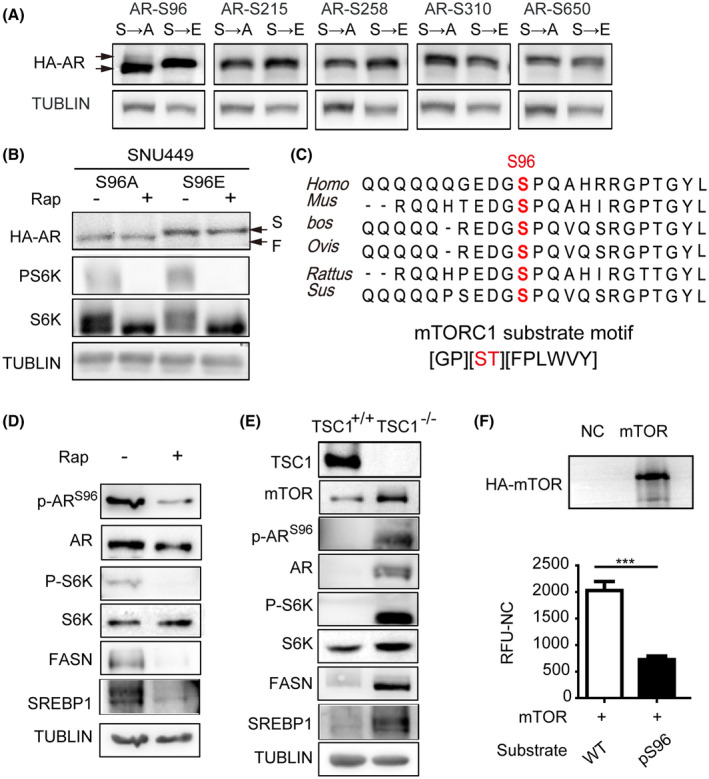
mTOR phosphorylates AR at S96. (A) Phosphorylation of S96, not another serine phosphorylation site, regulates HA‐AR electrophoretic mobility. HA‐AR carrying S to A or S to E mutation was expressed in SNU449 cells and analyzed for their electrophoretic mobility. TUBLIN was used as a loading control. (B) The electrophoretic mobility of HA‐ARS96 mutants was not affected by rapamycin. SNU449 cells transfected with HA‐ARS96A/HA‐ARS96E were treated with rapamycin for 12 h and analyzed for the electrophoretic mobility of HA‐AR proteins. TUBLIN was used as a loading control. (C) S96 of AR is an evolutionarily conserved mTORC1 consensus substrate motif. Upper panel: alignment of AR AA sequences surrounding S96 from different species. Bottom panel: mTORC1 consensus substrate site. (D) Inhibition of mTORC1 by rapamycin decreases S96 phosphorylation. SNU449 cells was treated with rapamycin for 12 h and analyzed for S96 phosphorylation by immunoblot with a p‐S96–specific antibody. P‐S6, total S6K, FASN, and SREBP1 proteins were also analyzed. TUBLIN was used as a loading control. (E) Activation of mTORC1 increases S96 phosphorylation. TSC1+/+ and TSC1−/− MEF cells were examined for S96 phosphorylation by immunoblot with an anti‐p‐S96 antibody. mTOR, P‐S6, total S6K, FASN, and SREBP1 proteins were also analyzed. TUBLIN was used as a loading control. (F) mTOR phosphorylates S96 of AR in vitro. mTOR was immunoprecipitated from HEK293T cells and assayed for phosphorylation of a synthetic AR peptide substrate containing S96. A control peptide containing S96A was used as a negative control. Data (mean ± SD, n = 3) was analyzed by unpaired two‐tail t test; *p < 0.05. F, fast mobility form; S, slow mobility form
S96 is highly conserved among different mammals, and the peptide sequence containing S96 fits an mTORC1 consensus substrate site (Figure 3C). To facilitate the study of AR phosphorylation, we developed a custom p‐S96–specific antibody, which recognized HA‐AR but not HA‐ARS96A or HA‐ARS96E (Figure S3). Moreover, S215A and S215E mutations did not affect recognition by this antibody (Figure S3A). The specificity of p‐S96 antibody was confirmed using IHC detection in mouse and human tissues by blocking the antibody with the peptides containing phosphorylated or nonphosphorylated S96 site (Figure S3B). Thus, the antibody is highly specific for p‐S96. Consistently with S96 is an mTORC1‐dependent phosphorylation site, inhibition of mTORC1 by rapamycin inhibited S96 phosphorylation (Figure 3D). Conversely, activation of mTORC1 by TSC1 knockout stimulated S96 phosphorylation (Figure 3E) but did not affect AR mRNA (Figure S4A). To ask if mTOR can directly phosphorylate S96, we immunoprecipitated mTOR and performed in vitro kinase assay with a wild‐type AR peptide as a substrate and an S96A mutant peptide as a control. We found that mTOR phosphorylated the wild‐type peptide, and the phosphorylation was suppressed by the S96A mutation (Figure 3F). Collectively, these results indicate that mTORC1 is an ARS96 kinase.
S96 phosphorylation regulates AR activity, subcellular localization, and stability
To understand the role of S96 phosphorylation in AR regulation, we transiently expressed wild type (WT) and mutant HA‐AR proteins in HCC cells (Figure S4B) and investigated their ability to activate ARE‐Luc reporter. The results showed that the transcriptional activity of ARS96A was significantly lower than WT AR and that of ARS96E was significantly higher (Figure 4A), indicating that S96 phosphorylation activates AR. R1881 enhanced the transcriptional activity of both WT and mutant AR (Figure 4A), indicating that mTORC1‐dependent S96 phosphorylation and androgen regulate AR independently and cooperatively. Furthermore, the transcriptional activity of S96 mutants was no longer responsive to rapamycin treatment (Figure 4B), demonstrating that S96 phosphorylation mediates mTORC1‐dependent regulation and rapamycin inhibition. We previously found that mTORC1 promotes AR nuclear localization.[ 16 ] We therefore investigated if S96 phosphorylation plays a role in this regulation. HA‐ARS96A was found to be predominantly cytoplasmic, whereas HA‐ARS96E was almost exclusively nuclear (Figure 4C), indicating that S96 phosphorylation regulates AR nuclear localization.
FIGURE 4.
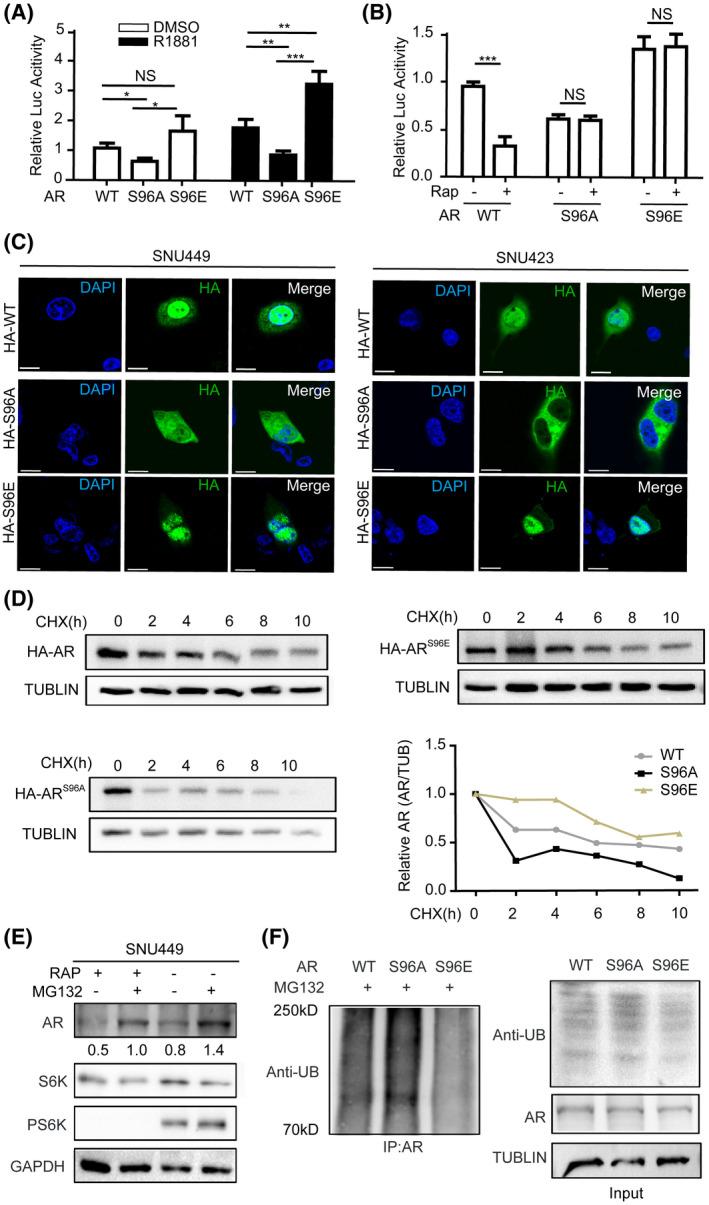
S96 phosphorylation regulates AR’s transcriptional activity and protein stability. Phosphorylation of ARS96 regulates transcriptional activity of AR. WT HA‐AR, HA‐ARS96A, or HA‐ARS96E were transiently expressed in SNU449 cells carrying the ARE‐Luc reporter. Cells were treated with R1881 or drug vehicle (DMSO) and measured for Luc activity. Data (mean ± SD, n = 3) were analyzed by unpaired two‐tailed t test. NS, no statistical significance; *p < 0.05, **p < 0.01. (B) S96 phosphorylation is required for mTORC1 to regulate AR’s transcriptional activity. WT HA‐AR, HA‐ARS96A, or HA‐ARS96E were transiently expressed in SNU449 cells carrying the ARE‐Luc reporter. Cells were treated with rapamycin or drug vehicle (DMSO) and measured for Luc activity. Data (mean ± SD, n = 3) were analyzed by unpaired two‐tailed t test. NS, no statistical significance; ***p < 0.001. (C) S96 phosphorylation regulates subcellular localization of AR. WT HA‐AR, HA‐ARS96A, or HA‐ARS96E were transiently expressed in SNU449 or SNU423 cells. Subcellular localization of WT and mutant HA‐AR was analyzed by immunofluorescence staining. (D) S96 phosphorylation regulates AR stability. HEK293T cells transiently expressing WT HA‐AR, HA‐ARS96A, or HA‐ARS96E were treated with cycloheximide (CHX) for different times. The protein level of HA‐AR was analyzed by immunoblot, and HA‐AR protein level was expressed as relative value to TUBLIN loading control. (E) Rapamycin induces proteasome‐dependent degradation of AR. SNU449 cells were treated with rapamycin or DMSO for 12 h and then with MG132 for another 12 h. The protein level of endogenous AR was examined by immunoblot with anti‐AR antibodies, which was expressed relative to TUBLIN. (F) S96 phosphorylation regulates AR polyubiquitination. WT HA‐AR, HA‐ARS96A, or HA‐ARS96E were transiently expressed in HEK293T cells in the presence of MG132. HA‐AR proteins were immunoprecipitated with anti‐HA antibodies and immunoblotted for ubiquitin (UB)
We previously found that rapamycin accelerates proteasomal degradation of AR.[ 16 ] To see if S96 phosphorylation controls AR stability, we treated HCC cells with cycloheximide to block new protein synthesis and measured the protein stability of WT and mutant HA‐AR proteins by immunoblot. The result showed that HA‐ARS96E and HA‐ARS96A were more stable and less stable, respectively, than WT HA‐AR (Figure 4D). In contrast to WT HA‐AR, rapamycin treatment did not significantly alter the stability of HA‐AR S96 mutants (Figure S5). Thus, S96 phosphorylation mediates mTORC1 regulation to promote AR protein stability. Treatment with the proteasome inhibitor MG132 in SNU449 cells markedly stabilized AR protein with or without rapamycin treatment (Figure 4E). Consistently, the level of polyubiquitination for HA‐ARS96E was less than WT HA‐AR, whereas that of HA‐ARS96A was more ubiquitinated than HA‐ARWT (Figure 4F). Thus, S96 phosphorylation inhibits AR polyubiquitination and proteasomal degradation.
S96 phosphorylation activates AR to promote lipogenesis in HCC cells
mTORC1 promotes liver steatosis and tumorigenesis in part by activating the master lipogenic transcription factor SREBP1‐dependent de novo lipid biosynthesis.[ 18 , 19 ] In agreement with mTORC1 regulation of SREBP‐dependent lipogenesis, rapamycin treatment markedly down‐regulated SREBP1 and fatty acid synthase (FASN) (Figure 3D,E). To determine if AR plays a role in fat acid metabolism in HCC, we analyzed a transcriptome dataset of The Cancer Genome Atlas (TCGA) database, which is consisting of 373 primary HCC tumor samples (http://ualcan.path.uab.edu/). We found that fat acid metabolism pathway was enriched in high AR‐expressing HCC tumors (Figure 5A). Interestingly, four ARE motifs were found in the promoter of SREBP1 (http://jaspar.genereg.net/) (Figure 5B), suggesting that AR regulates transcription of SREBP1.
FIGURE 5.
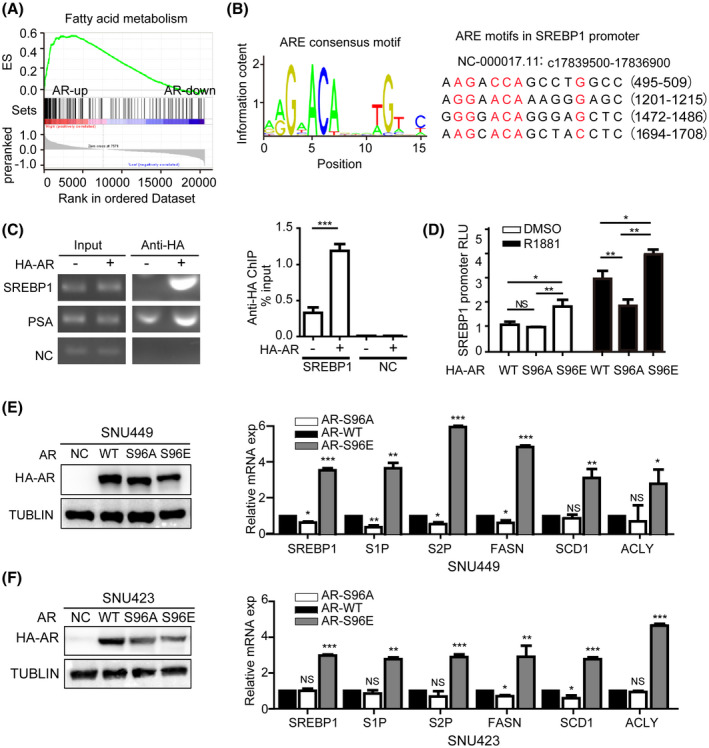
ARS96 phosphorylation induces hepatic lipogenic pathway. (A) AR is positively correlated with fat acid metabolism pathway in HCC. Shown is gene set enrichment analysis (GESA) from The Cancer Genome Atlas transcriptome dataset of 373 primary human HCC tumors in high and low AR expression groups. (B) AR consensus binding motif based on the JASPAR chromatin immunoprecipitation (ChIP)‐seq database. (http://jaspar.genereg.net/) (left). Shown are four potential AR binding motifs in SREBP1 promoter (right). (C) AR binds to SREBP1 promoter. SNU449 cells transiently expressing HA‐AR were assayed for AR binding to SREBP1 promoter by ChIP, which was measured by PCR (left) and qPCR (right). PSA was used as a positive control and a random sequence was used as a negative control (NC). Data (mean ± SD, n = 3) was analyzed by unpaired two‐tailed t test. ***p < 0.001. (D) S96 phosphorylation regulates the ability of AR to activate SREBP1 promoter. WT HA‐AR, HA‐ARS96A, or HA‐ARS96E were transiently expressed in SNU449 cells carrying SREBP1 promoter‐Luc reporter. Cells were treated with R1881 or drug vehicle (DMSO) and measured for Luc activity. Data (mean ± SD, n = 3) was analyzed by unpaired two‐tailed t test. NS, no statistical significance, *p < 0.05, **p < 0.01. (E,F) AR activation of lipogenic pathway is dependent on S96 phosphorylation. HA‐ARWT, HA‐ARS96A, or HA‐ARS96E were transiently expressed in SNU449 or SNU423 cells. Expression of HA‐AR proteins was examined by immunoblot. mRNA expression of lipogenic genes were analyzed by qRT‐PCR. Data (mean ± SD, n = 3) was analyzed by unpaired two‐tailed t test; NS, no statistical significance; *p < 0.05, **p < 0.01, ***p < 0.001
To determine whether AR directly regulates SREBP1 expression, we performed chromatin immunoprecipitation and found that HA‐AR specifically bound to SREBP1 promoter (Figure 5C). We next assayed SREBP1 promoter activity in response to AR using a Luc reporter under the control of SREBP1 promoter in a dual‐Luc reporter system. Indeed, expression of HA‐AR stimulated SREBP1‐Luc reporter in SNU449 cells. Although HA‐ARS96E increased SREBP1‐Luc reporter activity compared with WT HA‐AR, HA‐ARS96A decreased SREBP1‐Luc reporter activity, regardless of whether R1881 was present (Figure 5D). We further measured the mRNA expression level of lipogenic genes (SREBP1, FASN, S1P, S2P, ACLY, and SCD1) in SNU449 and SNU423 cells expressing WT and mutant HA‐AR. The results showed that HA‐ARS96E, not HA‐ARS96A, robustly stimulated expression of lipogenic genes compared with WT HA‐AR (Figure 5E,F). These observations show that AR is a transcriptional activator of the de novo lipogenic pathway and S96 phosphorylation stimulates AR‐dependent lipogenesis.
Excessive AKT signaling promotes male‐biased liver steatosis and tumorigenesis in mice
AKT‐mTORC1 signaling is a major oncogenic pathway for HCC.[ 20 ] Stable expression of constitutively active HA‐AKT in hepatocytes by hydrodynamic transfection (HDT) is sufficient to cause development of HCC in an mTORC1‐dependent manner in mice.[ 19 , 21 ] In our AKT‐driven mouse HCC by HDT, we checked the transfection efficiency of AKT plasmids in mouse hepatocytes with western blot at 24 h after HDT. The result showed that the transfection efficiency had no significant difference between male and female mice (Figure S6A). Remarkably, AKT‐expressing male mice developed liver tumors much more rapidly than AKT‐expressing female animals. The mean survival time was about 8 weeks after HDT for the AKT male group compared with 12 weeks after HDT for the AKT female group (Figure 6A,B). Consistently, the tumors in the AKT male group developed much more robustly as judged by liver/body weight and size of individual tumors. For example, the tumor burden in the AKT male group had already reached terminal stage by 9 weeks after HDT compared with only small precancerous lesions that were detected in the AKT female group at this time (Figure 6C,D). It took ~15 weeks after HDT for the AKT female group to develop tumor burdens similar to that of the AKT male group at 9 weeks after HDT (Figure 6E,F).
FIGURE 6.
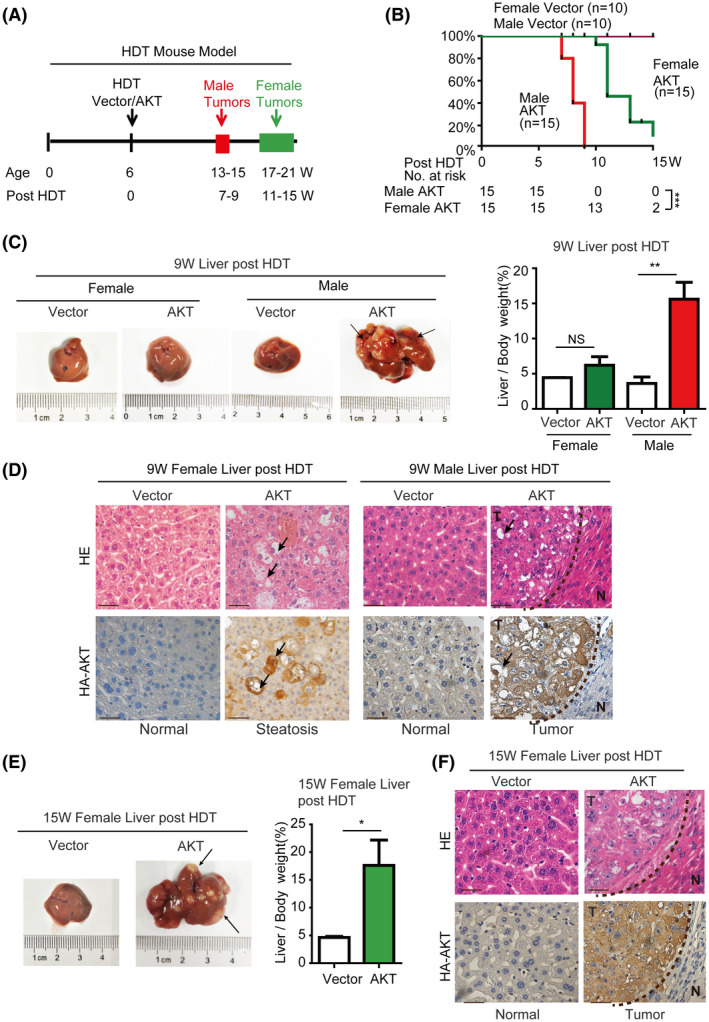
Excessive AKT signaling induces hepatocarcinogenesis in a male‐biased manner in mice. (A) Experimental scheme for AKT‐driven HDT liver tumorigenesis model in female and male mice. (B) Kaplan‐Meier analysis of the survival rates of mice after HDT delivery of AKT or vector plasmid. Female AKT group (n = 10) has considerable survival advantage over male AKT group (n = 10) (p < 0.0001). No mortality was observed with the vector control groups during the course of the study. ***p < 0.001. (C,D) Excessive AKT signaling induces significant hepatocarcinogenesis in male mice but not female mice at 9 weeks after HDT. (C) Morphology of representative livers from each animal group at 9 weeks after HDT and liver/body weight from each animal group. NS, no statistical significance; **p < 0.01. (D) Representative histology of AKT expressing female and male liver tissues 9 weeks after HDT. (Scale bar = 50 μm). Female liver shows big lipid vacuoles (arrows) in AKT‐expressing cells but no tumor lesions. Male liver contains large tumor burdens (T) with big lipid vacuoles (arrows). N, normal liver. (E,F). Excessive AKT signaling induces significant hepatocarcinogenesis in female mice at 15 weeks after HDT. (E) morphology of a representative female liver at 15 weeks after HDT and liver/body weight from female vector and AKT groups. NS, no statistical significance; **p < 0.01. (F) Histology of vector control or AKT female liver tissue at 15 weeks after HDT. (Scale bar = 50 μm)
We next performed molecular and histological analysis of the liver tissues from different experimental groups. In the early stage (fourth week) of the AKT HDT model, AKT‐positive cells were focally distributed and mainly gathered around the central vein in AKT male mouse and scatteredly distributed around the central vein in AKT female mouse, but no AKT‐positive cells were observed in vector male or female mouse (Figure S6B), indicating that AKT‐mTOR signaling induced more remarkable precancerous lesion in male mouse than in female mouse. In the late stage of the model, AKT expression or positive is observed in small precancerous foci or liver tissues in female mice (9th week) and in liver tumor nodules or liver tissues in male (9th week) and female (15th week) mice (Figures 6D,F and S8). Phosphorylation level of AR‐S96 and AR were also markedly increased in both AKT‐expressing gender groups compared with that in the control vector groups (Figures S7 and S8), indicating that AKT expression leads to activation of mTORC1 signaling and companion AR phosphorylation. Interestingly, expression of SREBP1 and FASN was much higher in AKT male livers at 9 weeks after HDT than that in AKT female livers at 9 weeks after HDT (Figures S7 and S8). Moreover, Ki‐67 staining was also stronger in AKT‐expressing male liver tissues at 9 weeks after HDT than that in AKT female liver tissues at 9 weeks after HDT (Figure S7). These observations are in agreement with our in vitro data that S96 phosphorylation cooperates with male hormones to activate AR and AR‐dependent lipogenesis and proliferation, which is likely to contribute to male‐biased liver steatosis and tumorigenesis.
AR promotes liver steatosis and tumorigenesis in mice in an S96 phosphorylation‐dependent manner
NRAS proto‐oncogene alone is insufficient to induce liver tumors in the HDT mouse models. However, it enhances tumorigenesis by other oncogenes or loss of tumor suppressor genes, which has been explored as a useful tool for evaluating the oncogenic events.[ 21 ] Although AR is overexpressed in human HCC and its overexpression promotes HCC cell proliferation in vitro and in vivo,[ 16 ] the oncogenic role of phosphorylated AR has not been examined in vivo. Therefore, we aimed to assess the oncogenic potential of phosphorylated AR in the HDT mouse model. Because AR alone including AR‐WT and ARS96A was not sufficient to cause primary liver tumor within 22 weeks of the HDT model (Figure S9A–E), we established a mouse model by expressing NRAS alone or in combination with HA‐AR or HA‐ARS96A in mice by HDT (Figure 7A). As expected, NRAS alone did not cause discernible pathological changes in mouse liver during the course of the study (Figure 7). Remarkably, coexpression of NRAS and HA‐AR caused development of liver tumors with a mean survival time of 18 weeks after HDT (Figure 7B–D). In contrast, coexpression of NRAS and HA‐ARS96A failed to induce liver tumorigenesis or cause mortality (Figure 7B–D). Histological analysis indicated that NRAS/HA‐AR livers contained large tumors with large lipid vacuoles by 21 weeks after HDT (Figure 7E). In contrast, NRAS and NRAS/HA‐ARS96A livers did not exhibit apparent pathological changes (Figure 7E). Consistently, NRAS/HA‐AR liver tumors were highly proliferative, as indicated by Ki‐67 staining, and severely steatotic, as shown by Oil‐Red staining, which were not seen in NRAS or NRAS/HA‐ARS96A livers (Figure 7F). Consistently, expression of SREBP1 and FASN was elevated in NRAS/HA‐AR livers but not in NRAS or NRAS/HA‐ARS96A livers (Figures 7F and S10). These results indicate that AR is a driver of liver steatosis and tumorigenesis. Therefore, this study also provides the target molecule for prevention of NAFLD and HCC in humans.
FIGURE 7.
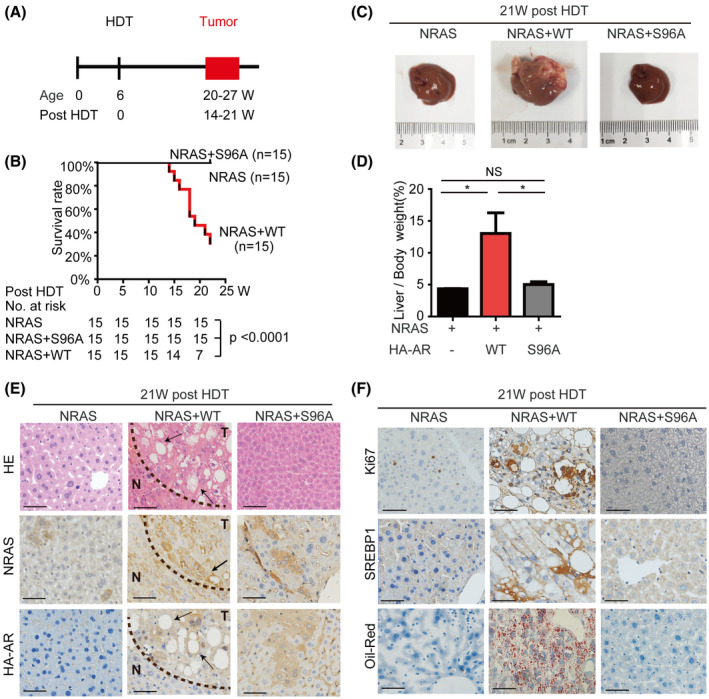
AR is a driver of hepatocarcinogenesis in an S96 phosphorylation‐dependent manner in mice. Experimental scheme for NRAS/HA‐AR–driven HDT liver tumorigenesis model in male mice. Kaplan‐Meier analysis of the survival rates of mice after HDT delivery of NRAS, NRAS/HA‐AR, or NRAS/HA‐ARS96A. The NRAS/HA‐AR group (n = 15) has a mean survival of 18 weeks after HDT (p < 0.0001). No mortality was observed with the NRAS group and NRAS/HA‐ARS96A group during the course of the study. (C,D) NRAS/HA‐AR but not NRAS alone or NRAS/HA‐ARS96A induces hepatocarcinogenesis in mice. (C) Representative mouse liver from each experimental group at 21 weeks after HDT. (D) Liver/body weight from each animal group (n = 15). NS, no statistical significance; *p < 0.05. (E) NRAS/HA‐AR but not NRAS alone or NRAS/HA‐ARS96A induces liver steatosis and tumorigenesis in mice. Shown are liver sections with HE staining and IHC staining of NRAS and HA‐AR of mouse liver at 21 weeks after HDT. (Scale bar = 50 μm). NRAS/HA‐AR liver tumor contains large tumor burdens (T) with big lipid vacuoles (arrows). N, normal liver. (F) NRAS/HA‐AR but not NRAS alone or NRAS/HA‐ARS96A promotes liver cell proliferation and steatosis. Shown are liver sections with IHC staining of Ki‐67 and SREBP, and Oil‐Red staining at 21 weeks after HDT. (Scale bar = 50 μm)
Phosphorylation of ARS96 is correlated with hepatic steatosis and tumorigenesis in human clinical samples
To explore the clinical significance of ARS96 phosphorylation, we asked whether it occurs in human livers and whether this phosphorylation changes during hepatopathogenesis. To this end, we performed HE staining and IHC staining with anti‐p‐ARS96 antibody on human normal and steatotic liver tissue samples. Through IHC assay, we found that p‐ARS96 was elevated in steatotic tissues compared with that in normal liver tissues (Figure 8A). We further carried out anti‐p‐ARS96 IHC staining with a tissue microarray consisting of 75 HCC samples and 65 paired adjacent noncancerous liver tissues. The result showed that the level of p‐ARS96 was significantly higher in HCC tumor compared with paired adjacent noncancerous liver tissues (Figure 8B–D). Strikingly, patients with high liver tumor p‐ARS96 expression had significantly worse overall survival (OS) and disease‐free survival than those with low liver tumor p‐ARS96 expression, as judged by Kaplan‐Meier analysis (Figure 8E). High p‐ARS96 was correlated with serum HBsAg (p = 0.020), tumor size (p = 0.045), and tumor pathological grade (p = 0.028) (Table S2). Multivariate Cox regression analysis demonstrated that the expression of p‐ARS96and tumor number are independent risk factors for OS in patients with HCC (p‐ARS96: HR = 2.385, 95% CI = 1.162–4.893, p = 0.018) (Table S3). We have demonstrated that mTOR signaling pathway phosphorylates AR S96 in liver tumor in vitro and in vivo. To verify whether this regulation existed in human HCC tumors, we conducted IHC for p‐S6K and p‐AR in 62 HCC samples and analyzed the relationship between the phosphorylated proteins. A positive correlation was observed between p‐S6K and p‐AR (Figure 8E and Table S4), implying that mTOR signaling pathway phosphorylates AR in human HCC, consistently with the aforementioned results we have shown. These results provide clinical evidence supporting our findings in mice that AR is a driver of hepatocarcinogenesis. More importantly, this study also provides a potential survival predictive marker for patients with HCC.
FIGURE 8.
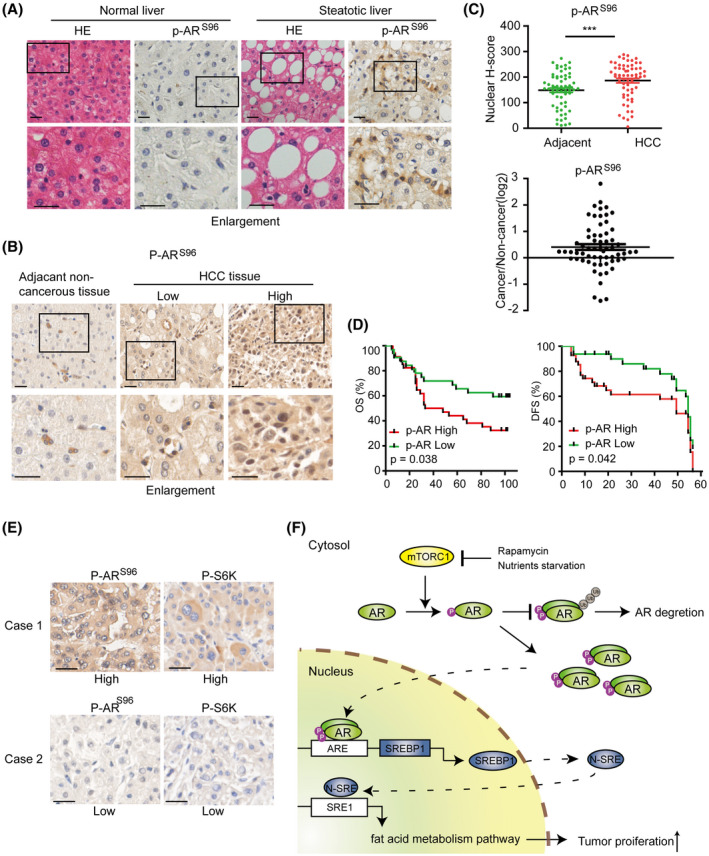
ARS96 phosphorylation is correlated with hepatic steatosis and tumorigenesis in human clinical samples. AR S96 phosphorylation is elevated in steatotic liver tissue. Normal and steatotic human liver tissue sections were stained by HE and IHC with p‐ARS96–specific antibody. (Scale bar = 50 μm). Representative IHC staining image of HCC tissues with low and high p‐ARS96 expression. (Scale bar = 50 μm). (C) Elevated ARS96 phosphorylation in HCC as indicated by scatter plots of nuclear ARpS96 IHC scores in HCC and adjacent tissues (upper panel) and the ratio of p‐ARS96 IHC scores in paired tumor/adjacent tissues(lower panel). **p < 0.01. (D) Patients with HCC and high p‐ARS96 have worse OS and disease‐free survival (DFS). Kaplan‐Meier analysis of OS (up) and DFS (down) in patients with low versus high p‐ARS96 expression. (E) The p‐AR expression is positively correlated with p‐S6K in HCC. Representative immunohistochemical images of p‐AR and p‐S6K in HCC tumors. (Scale bar = 50 μm). In the same HCC tissue, p‐S6K is higher and p‐AR is also higher, and vice versa. (F) Graphic illustration of AR regulation by nutrient‐mTORC1 signaling to promote liver steatosis and tumorigenesis
DISCUSSION
Nutrients supply building blocks for generating biomass and energy for fueling biochemical reactions. They are also chemical signals that dictate cellular growth and metabolism. Overnutrition not only creates imbalanced metabolism but also causes excessive nutrient signaling that promotes aberrant cellular metabolism and proliferation, leading to obesity, NAFLD, and cancer.[ 11 , 12 , 13 ] As a central organ that controls diet digestion and utilization, the liver is prone to hyperactive nutrient signaling and development of NAFLD and related liver diseases, such as HCC. Chronic activation of mTORC1 signaling is a major cause of NAFLD and HCC.[ 22 ] Elevated mTORC1 signaling is common in samples of human patients and mouse models with NAFLD and HCC.[ 23 , 24 ] We showed that excessive AKT signaling in mouse liver is sufficient to cause liver steatosis and tumorigenesis, which is consistent with hepatic PTEN knockout that also leads to development of NAFLD and HCC.[ 25 , 26 ]
In this study, we demonstrate that hepatic AR is a direct target of mTORC1. mTORC1 phosphorylates AR at S96 in response to nutrient and mitogenic stimuli, which regulates the stability, nuclear localization, and activity of hepatic AR. AR protein consists of the N‐terminal domain (NTD), the middle DNA‐binding domain, and the C‐terminal ligand‐binding domain.[ 27 ] AR contains two activation domains, located in NTD and C‐terminal domain (CTD), respectively. Although the CTD activation domain is regulated by ligand (androgen), the NTD is ligand independent,[ 28 ] with each of the two activation domains contributing ~50% to the total AR activity.[ 29 ] Interestingly, S96 is located within the NTD activation domain, providing a mechanism for ligand‐independent activation of AR functions. mTORC1‐dependent S96 phosphorylation in NTD is also consistent with mTORC1, and androgen signaling controls AR independently and cooperatively (Figure 8F).
AR is an established driver of prostate carcinogenesis. Although AR is ubiquitously expressed in different tissues, whether it can act as an oncogene outside the prostate remains unclear. Herein, we show that AR is sufficient to cause liver steatosis and tumorigenesis when combined with NRAS but not NRAS alone. When activated by S96 phosphorylation, AR promotes hepatic proliferation and de novo lipogenesis. AR activates transcription of SREBP1, the master transcription factor for the lipid biosynthesis pathway. Moreover, AR‐driven development of hepatic steatosis and tumors is dependent on S96 phosphorylation. Hence, AR is a liver oncogene, and its oncogenic potential is regulated by mTORC1 signaling. More importantly, dephosphorylation of AR S96 failed to cause hepatic steatosis and hepatocarcinogenesis in mice with hepatic NRAS overexpression, suggesting that AR S96 phosphorylation is a potential target site for preventing liver steatosis and HCC in male people, especially in men with obesity.
Epidemiological studies showed that men develop NAFLD and HCC much more frequently than women, regardless of etiology and country of origin.[ 30 , 31 ] The male‐to‐female ratio for these liver diseases ranges from 2:1 to 7:1, depending on specific populations. In our study, the male‐to‐female ratio for HCC is about 8:1, which is similar to the reported ratio. Accumulating evidence indicates that hepatic AR signaling is involved in the male‐dominant trait.[ 9 , 32 ] Strikingly, hepatopathogenesis driven by hyperactive mTORC1 signaling displays a male‐dominant trait. We show that in the HDT model, constitutive AKT activation leads to liver steatosis and HCC much earlier and more robustly in male mice than female mice. Thus, cooperative activation of AR by mTORC1 and androgen signaling provides a plausible explanation for why excessive nutrient signaling promotes liver cancer in a male‐biased manner.
Consistently, with a custom antibody against AR S96 phosphorylation, in human liver steatotic tissues and HCC samples, we observed a high level of AR‐PS96 phosphorylation in human liver steatosis and HCC samples compared with that in normal liver tissues and paired noncancerous liver tissues, which is an independent risk factor for poor OS in patients with HCC, indicating that AR‐PS96 phosphorylation is a potential predictive marker for survival of patients with HCC.
In conclusion, this study unravels a mechanism by which nutrient‐mTORC1 signaling phosphorylates AR‐S96 that drives liver pathogenesis. Our results establish AR as an oncogenic driver of liver steatosis and liver cancer in response to nutrient‐mTORC1 and male hormone signaling, which not only explains why the HCC is male‐dominant but also provides a target molecule for prevention and treatment of HCC and a potential survival predictor in patients with HCC.
CONFLICT OF INTEREST
The authors declare no potential conflicts of interest.
AUTHOR CONTRIBUTIONS
Hui‐Yun Wang and X.F. Steven Zheng conceived the overall project; Hui‐Yun Wang, Qian‐Nan Ren, and X.F. Steven Zheng designed the studies; Qian‐Nan Ren, Hong Zhang, Chao‐Yue Sun, Yu‐Feng Zhou, Xiao‐Xing Li, and Mei‐Yin Zhang performed the experiments; Xue‐Feng Yang, Jian‐Wu Long, and Min‐Shan Chen collected clinical information and samples; Shi‐Juan Mai, and Hui‐Zhong Zhang provided pathological diagnosis; Hai‐Qiang Mai, Hui‐Yun Wang, and X.F. Steven Zheng provided laboratory infrastructures and/or funding; Hui‐Yun Wang, Qian‐Nan Ren, and X.F. Steven Zheng wrote and/or edited the manuscript.
Supporting information
Supplementary Material
Supplementary Material
ACKNOWLEDGMENTS
We are thankful to Dr. Qi Wang, Pharm.D., M.D., a resident in the Department of Surgery, University of Massachusetts, and a research fellow in Memorial Sloan Kettering Cancer Center for helping us to proofread this manuscript. This study was supported by the National Natural Science Foundation of China 81772991, 81730081, 81572466, 81572440, 81972640, and 81373465 (to M.S.C., H.Y.W., and X.F.Y.), and New Jersey Commission on Cancer Research DCHS20PPC017 and DFHS18CRF007 (to H.Z. and X.F.Z.).
Ren Q‐N, Zhang H, Sun C‐Y, Zhou Y‐F, Yang X‐F, Long J‐W, et al. Phosphorylation of androgen receptor by mTORC1 promotes liver steatosis and tumorigenesis. Hepatology. 2022;75:1123–1138. doi: 10.1002/hep.32120
Contributor Information
Min‐Shan Chen, Email: chenmsh@sysu.org.cn.
X.F. Steven Zheng, Email: zhengst@cinj.rutgers.edu.
Hui‐Yun Wang, Email: wanghyun@mail.sysu.edu.cn.
REFERENCES
- 1. Bray F, Ferlay J, Soerjomataram I, Siegel RL, Torre LA, Jemal A. Global cancer statistics 2018: GLOBOCAN estimates of incidence and mortality worldwide for 36 cancers in 185 countries. CA Cancer J Clin. 2018;68(6):394–424. [DOI] [PubMed] [Google Scholar]
- 2. Williams CD, Stengel J, Asike MI, Torres DM, Shaw J, Contreras M, et al. Prevalence of nonalcoholic fatty liver disease and nonalcoholic steatohepatitis among a largely middle‐aged population utilizing ultrasound and liver biopsy: a prospective study. Gastroenterology. 2011;140(1):124–31. [DOI] [PubMed] [Google Scholar]
- 3. Pearson‐Stuttard J, Zhou B, Kontis V, Bentham J, Gunter MJ, Ezzati M. Worldwide burden of cancer attributable to diabetes and high body‐mass index: a comparative risk assessment. Lancet Diabetes Endocrinol. 2018;6(6):e6–15. [DOI] [PMC free article] [PubMed] [Google Scholar]
- 4. Tian Y, Wong VS, Chan HY, Cheng AL. Epigenetic regulation of hepatocellular carcinoma in non‐alcoholic fatty liver disease. Semin Cancer Biol. 2013;23(6):471–82. [DOI] [PubMed] [Google Scholar]
- 5. El‐Serag HB. Epidemiology of viral hepatitis and hepatocellular carcinoma. Gastroenterology. 2012;142(6):1264–73.e1. [DOI] [PMC free article] [PubMed] [Google Scholar]
- 6. Sheckter CB, Matsumoto AM, Bremner WJ. Testosterone administration inhibits gonadotropin secretion by an effect directly on the human pituitary. J Clin Endocrinol Metab. 1989;68(2):397–401. [DOI] [PubMed] [Google Scholar]
- 7. Tilley WD, Marcelli M, Wilson JD, McPhaul MJ. Characterization and expression of a cDNA encoding the human androgen receptor. Proc Natl Acad Sci USA. 1989;86(1):327–31. [DOI] [PMC free article] [PubMed] [Google Scholar]
- 8. Lunardi A, Ala U, Epping MT, Salmena L, Clohessy JG, Webster KA, et al. A co‐clinical approach identifies mechanisms and potential therapies for androgen deprivation resistance in prostate cancer. Nat Genet. 2013;45(7):747–55. [DOI] [PMC free article] [PubMed] [Google Scholar]
- 9. Ma WL, Lai HC, Yeh S, Cai X, Chang C. Androgen receptor roles in hepatocellular carcinoma, fatty liver, cirrhosis and hepatitis. Endocr Relat Cancer. 2014;21(3):R165–82. [DOI] [PMC free article] [PubMed] [Google Scholar]
- 10. Wu MH, Ma WL, Hsu CL, Chen YL, Ou JHJ, Ryan CK, et al. Androgen receptor promotes hepatitis B virus‐induced hepatocarcinogenesis through modulation of hepatitis B virus RNA transcription. Sci Transl Med. 2010;2(32):32ra35. [DOI] [PMC free article] [PubMed] [Google Scholar]
- 11. Düvel K, Yecies JL, Menon S, Raman P, Lipovsky AI, Souza AL, et al. Activation of a metabolic gene regulatory network downstream of mTOR complex 1. Mol Cell. 2010;39(2):171–83. [DOI] [PMC free article] [PubMed] [Google Scholar]
- 12. Jewell JL, Guan KL. Nutrient signaling to mTOR and cell growth. Trends Biochem Sci. 2013;38(5):233–42. [DOI] [PMC free article] [PubMed] [Google Scholar]
- 13. Laplante M, Sabatini DM. mTOR signaling in growth control and disease. Cell. 2012;149(2):274–93. [DOI] [PMC free article] [PubMed] [Google Scholar]
- 14. Dibble CC, Cantley LC. Regulation of mTORC1 by PI3K signaling. Trends Cell Biol. 2015;25(9):545–55. [DOI] [PMC free article] [PubMed] [Google Scholar]
- 15. Guri Y, Colombi M, Dazert E, Hindupur SK, Roszik J, Moes S, et al. mTORC2 promotes tumorigenesis via lipid synthesis. Cancer Cell. 2017;32(6):807–23.e12. [DOI] [PubMed] [Google Scholar]
- 16. Zhang H, Li XX, Yang Y, Zhang Yanjie, Wang HY, Zheng XFS, et al. Significance and mechanism of androgen receptor overexpression and androgen receptor/mechanistic target of rapamycin cross‐talk in hepatocellular carcinoma. Hepatology. 2018;67(6):2271–86. [DOI] [PMC free article] [PubMed] [Google Scholar]
- 17. Söderberg O, Gullberg M, Jarvius M, Ridderstråle K, Leuchowius K‐J, Jarvius J, et al. Direct observation of individual endogenous protein complexes in situ by proximity ligation. Nat Meth. 2006;3(12):995–1000. [DOI] [PubMed] [Google Scholar]
- 18. Calvisi DF, Wang C, Ho C, Ladu S, Lee SA, Mattu S, et al. Increased lipogenesis, induced by AKT‐mTORC1‐RPS6 signaling, promotes development of human hepatocellular carcinoma. Gastroenterology. 2011;140(3):1071–83. [DOI] [PMC free article] [PubMed] [Google Scholar]
- 19. Li L, Pilo GM, Li X, Cigliano A, Latte G, Che LI, et al. Inactivation of fatty acid synthase impairs hepatocarcinogenesis driven by AKT in mice and humans. J Hepatol. 2016;64(2):333–41. [DOI] [PMC free article] [PubMed] [Google Scholar]
- 20. Engelman JA, Luo J, Cantley LC. The evolution of phosphatidylinositol 3‐kinases as regulators of growth and metabolism. Nat Rev Genet. 2006;7(8):606–19. [DOI] [PubMed] [Google Scholar]
- 21. Chen X, Calvisi DF. Hydrodynamic transfection for generation of novel mouse models for liver cancer research. Am J Pathol. 2014;184(4):912–23. [DOI] [PMC free article] [PubMed] [Google Scholar]
- 22. Matsuda S, Kobayashi M, Kitagishi Y. Roles for PI3K/AKT/PTEN pathway in cell signaling of nonalcoholic fatty liver disease. ISRN Endocrinol. 2013;2013:472432. [DOI] [PMC free article] [PubMed] [Google Scholar]
- 23. Kubrusly MS, Corrêa‐Giannella ML, Bellodi‐Privato M, de Sá SV, Cauduro Soares I, Wakamatsu A, et al. A role for mammalian target of rapamycin (mTOR) pathway in non alcoholic steatohepatitis related‐cirrhosis. Histol Histopathol. 2010;25(9):1123–31. [DOI] [PubMed] [Google Scholar]
- 24. Li Y, Tsang CK, Wang S, Li XX, Yang Y, Fu L, et al. MAF1 suppresses AKT‐mTOR signaling and liver cancer through activation of PTEN transcription. Hepatology. 2016;63(6):1928–42. [DOI] [PMC free article] [PubMed] [Google Scholar]
- 25. Horie Y, Suzuki A, Kataoka EI, Sasaki T, Hamada K, Sasaki J, et al. Hepatocyte‐specific Pten deficiency results in steatohepatitis and hepatocellular carcinomas. J Clin Invest. 2004;113(12):1774–83. [DOI] [PMC free article] [PubMed] [Google Scholar]
- 26. Stiles B, Wang Y, Stahl A, Bassilian S, Lee WP, Kim YJ, et al. Liver‐specific deletion of negative regulator Pten results in fatty liver and insulin hypersensitivity [corrected]. Proc Natl Acad Sci U S A. 2004;101(7):2082–7. [DOI] [PMC free article] [PubMed] [Google Scholar]
- 27. Anbalagan M, Huderson B, Murphy L, Rowan BG. Post‐translational modifications of nuclear receptors and human disease. Nucl Recept Signal. 2012;10:e001. [DOI] [PMC free article] [PubMed] [Google Scholar]
- 28. Davey RA, Grossmann M. Androgen receptor structure, function and biology: from bench to bedside. Clini Biochem Rev. 2016;37(1):3–15. [PMC free article] [PubMed] [Google Scholar]
- 29. Bevan CL, Hoare S, Claessens F, Heery DM, Parker MG. The AF1 and AF2 domains of the androgen receptor interact with distinct regions of SRC1. Mol Cell Biol. 1999;19(12):8383–92. [DOI] [PMC free article] [PubMed] [Google Scholar]
- 30. Pan JJ, Fallon MB. Gender and racial differences in nonalcoholic fatty liver disease. World J Hepatol. 2014;6(5):274–83. [DOI] [PMC free article] [PubMed] [Google Scholar]
- 31. Forner A, Llovet JM, Bruix J. Hepatocellular carcinoma. Lancet. 2012;379(9822):1245–55. [DOI] [PubMed] [Google Scholar]
- 32. Wang SH, Chen PJ, Yeh SH. Gender disparity in chronic hepatitis B: mechanisms of sex hormones. J Gastroenterol Hepatol. 2015;30(8):1237–45. [DOI] [PubMed] [Google Scholar]
Associated Data
This section collects any data citations, data availability statements, or supplementary materials included in this article.
Supplementary Materials
Supplementary Material
Supplementary Material