

Abstract
Gastric cancer (GC) is one of the most common human malignancies due to its invasiveness and metastasis. 5‐Fu is a widely applied chemotherapeutic agent against GC. Although 5‐Fu therapy has achieved improvements in GC treatment, a large fraction of patients developed drug resistance which significantly limited its clinical applications. Recent studies revealed the pivotal roles of long noncoding RNAs (lncRNAs) in tumorigenesis and progressions of various tumors, including GC. However, the biological roles and molecular mechanisms of lncRNA HAGLR in GC remain unclear. Here, we report HAGLR was upregulated in both GC tissues and cell lines. In addition, HAGLR was associated with a poorly survival rate of GC patients. Blocking HAGLR inhibited GC cells proliferation and sensitized GC cells to 5‐Fu. Bioinformatical analysis and luciferase assay demonstrated that HAGLR sponged microRNA (miR)‐338‐3p, which functions as a tumor suppressor in GC to downregulate its expressions. Moreover, from the established 5‐Fu resistant GC cell line (HGC27 5‐Fu R), we detected significantly elevated HAGLR, downregulated miR‐338‐3p, and glucose metabolism compared with parental HGC27 cells. We identified lactate dehydrogenase‐A (LDHA), a glucose metabolism key enzyme, was the direct target of miR‐338‐3p in GC cells. Rescue experiments demonstrated that restoration of miR‐338‐3p in HAGLR‐overexpressing HGC27 5‐Fu R cells successfully overrode the HAGLR‐promoted 5‐Fu resistance through targeting LDHA. Taken together, this study revealed essential roles and molecular mechanisms for the HAGLR‐mediated 5‐Fu resistance in GC, contributing to the development of new noncoding RNA‐based therapeutic strategies against chemoresistant GC.
Keywords: chemoresistance, gastric cancer, glucose metabolism, LDHA, lncRNA HAGLR, Warburg effect
1. INTRODUCTION
Gastric cancer (GC) is one of the most frequent malignancies, contributing to the second leading cause of cancer mortality (Biagioni et al., 2019). Recently, despite therapeutic approaches such as surgery, chemotherapy and radiation have been improved, GC patients with advanced tumor stage still received disappointing prognosis and low 5‐year survival rate (Biagioni et al., 2019; Karimi et al., 2014). 5‐fluorouracil (5‐Fu) is one of the adjuvant and palliative therapeutic agents by acting through interfering the incorporating fluoronucleotides into RNA and DNA, leading to DNA damage and cancer cell death (Lee et al., 2016). Although 5‐Fu has recently achieved improved prognosis and survival rate of GC patients, the development of 5‐Fu resistance remains significant challenge, which greatly limited the clinical application of 5‐Fu‐based chemotherapy (Blondy et al., 2020). Thus, investigating the molecular targets and underlying mechanisms of 5‐Fu resistance is urgent for developing therapeutic strategies against 5‐Fu resistance.
Long noncoding RNAs (lncRNAs) are a class of endogenous RNA with relative long size (>200 nucleotides) (Peng et al., 2017). LncRNAs have been reported to be involved in numerous biological tumor processes including tumorigenesis, metabolism, proliferation, invasion, migration, metabolism, apoptosis, and chemoresistance (Bhan et al., 2017). Recently, accumulating evidence revealed that the dysregulation of lncRNAs plays crucial roles in chemosensitivity of GC (Ghafouri‐Fard & Taheri, 2020). LncRNA HAGLR has been detected to be upregulated in various malignant tumors such as lung cancer (Lu et al., 2017), esophageal cancer (Yang et al., 2019), breast cancer (Mahlab‐Aviv et al., 2020), and colon cancer (Sun et al., 2020). In addition, the upregulated HAGLR was negatively associated with prognosis and survival rates of cancer patients (Lu et al., 2017; Mahlab‐Aviv et al., 2020; Sun et al., 2020; Yang et al., 2019). Mounting evidence indicated that lncRNA functions as competitive endogenous RNAs (ceRNA) of microRNAs (miRNAs) by competing with them to de‐repress the expression of downstream target genes (Paraskevopoulou & Hatzigeorgiou, 2016). Moreover, the lncRNA‐miRNA network has been implicated in a variety of cancer processes (Zhang et al., 2018), indicating targeting the lncRNA‐based noncoding RNA axis is a potentially therapeutic approach against chemoresistant cancers. However, the biological roles and mechanism of HAGLR in GC have not been elucidated.
Cancer cells display aberrant glucose metabolic characteristics that they consume incremental amounts of glucose and metabolize the majority of them into lactate, a phenomenon is referred to “Warburg effect” (Pascale et al., 2020). Furthermore, metabolic reprogramming of cancer cells contributes to various tumor progressions and targeting the dysregulated metabolism has been exploited to effectively treat cancers for decades (Liu et al., 2019). The lactate dehydrogenase‐A (LDHA), which catalyzes the conversion of pyruvate to lactate (Feng et al., 2018), has a key role in aerobic glycolysis and is widely recognized as a therapeutic anticancer target. In this study, the roles of HAGLR in 5‐Fu resistance and glucose metabolism of GC will be evaluated. Specific miRNA targets of HAGLR will be identified in GC tumors and cells. The miRNA targets which play vital roles in the HAGLR‐mediated glucose metabolism and 5‐Fu resistance will be explored. This study will contribute to developing the noncoding RNA‐based new therapeutic agents for the treatment of chemoresistant GC.
2. MATERIALS AND METHODS
2.1. Gastric tumor tissue samples
This study was approved by the Institutional Review Board of Ningbo Medical Center Lihuili Hospital. A total of 40 GC patients who had early GC (n = 5) and advanced GC (n = 35) were evaluated in this study (Table 1). Patients did not receive radio‐ or/and chemotherapy before surgery. Gastric tumor or normal tissues were obtained from patients who underwent surgery at the Department of Radiation Oncology, Ningbo Medical Center Lihuili Hospital between 2014 and 2018. Tissues samples were immediately frozen by liquid nitrogen and stored at −80°C. All patients provided written informed consent.
Table 1.
Characteristics of 40 gastric cancer patients
| Characteristic | Cases | Percentages |
|---|---|---|
| Age | ||
| <30 | 2 | 5 |
| 30–50 | 15 | 37.5 |
| >50 | 23 | 57.5 |
| Gender | ||
| Male | 22 | 55 |
| Female | 18 | 45 |
| Grading | ||
| 1 | 8 | 20 |
| 2 | 12 | 30 |
| 3 | 19 | 47.5 |
| NS | 1 | 2.5 |
| Histology | ||
| Adenocarcinoma | 31 | 77.5 |
| Signet ring cell | 6 | 15 |
| Undifferentiated | 2 | 5 |
| Other | 1 | 2.5 |
| Metastasis | ||
| No | 28 | 75 |
| Yes | 12 | 30 |
| 5‐Fu sensitivity | ||
| Sensitive | 16 | 40 |
| Resistant | 24 | 60 |
2.2. Cell culture and reagents
GC cell lines HGC27, SGC‐7901, AGS, MKN‐45, and BGC‐823 and normal gastric epithelial cell line, GES‐1 were provided by the cell bank of the Chinese Science Academy. Cells were cultured in RPMI 1640 medium (Thermo Fisher Scientific, Inc.) with 10% fetal bovine serum (FBS) (Biorad), 100 units/ml penicillin, and 100 μg/ml streptomycin (Thermo Fisher Scientific, Inc.) at 37°C in a humidified atmosphere with 5% CO2. The establishment of 5‐Fu resistant GC cell line was conducted according to the previous reports (Li et al., 2017). Rabbit anti‐LDHA (#3582) and anti‐β‐actin (#4970) antibodies were purchased from Cell Signaling Technology. 5‐Fu was purchased from Sigma‐Aldrich.
2.3. Transfections of siRNA, miRNA, or plasmid DNA
Transfections were conducted using the commercially available Lipofectamine 3000 transfection reagent (Invitrogen) was used for transfection according to the manufacturer's protocols. Briefly, GC cells (4 × 10⁵/well) were plated on six‐well plates for 24 h. Negative controls and miR‐338‐3p or small interfering RNA (siRNA) were transfected at 50 nM for 48 h. Plasmid DNA was transfected at 1 µg/well for 48 h. miRNA‐338‐3p precursor, siRNA against LDHA or HAGLR as well as their negative controls were synthesized by GenePharma Inc.
2.4. Quantitative real‐time polymerase chain reaction (qRT‐PCR)
Total RNA isolation was performed using the TRIzol (Thermo Fisher Scientific, Inc.) methods according to the manufacturer's protocols. The quality and concentration of RNA samples were examined using a NanoDrop™ 2000/2000c Spectrophotometers (Thermo Fisher Scientific, Inc.). cDNA was synthesized by reverse transcription using the High Capacity RNA‐to‐cDNA kit (#4387406, Thermo Fisher Scientific, Inc.). Quantitative real‐time polymerase chain reaction (qRT‐PCR) was performed using the Taqman 2× Universal PCR Master Mix (Thermo Fisher Scientific) by a 7900 Real‐time PCR System (Applied Biosystems). The thermal profile was set as follows: 95°C for 1 min and 40 cycles at 95°C for 15 s, 58°C for 20 s, and 72°C for 20 s. For miRNA detection, results were normalized to U6. For mRNA and lncRNA detections, results were normalized to β‐actin. The primers were as follows: miR‐338‐3p forward, 5′‐ACACTCCAGCTGGGGTTGTTTTAGTG‐3′; reverse, 5′‐CTCAACTGGTGTCGTGGA‐3′; U6 forward, 5′‐CTCGCTTCGGCAGCACA‐3′; reverse, 5′‐AACGCTT CACGAATTTGCGT‐3′; LDHA forward, 5′‐AGCCCGATTCCGTTACCT‐3′; reverse, 5′‐CACCAGCAACATTCATTCCA‐3′; lncRNA HAGLR forward, 5′‐GGGCTGGTACAGACTAGGGA‐3′; reverse, 5′‐TAAGCAGGTCAGAAAGGGCG‐3′; β‐actin forward, 5′‐GCATCGTCACCAACTGGGAC‐3′; reverse, 5′‐ACCTGGCCGTCAGGC AGCTC‐3′. The relative expression was calculated by the 2−ΔΔCt method. Experiments were performed in triplicate and repeated three times.
2.5. Luciferase reporter assay
Wild‐type (WT) and mutated (Mut) HAGLR or 3′‐untranslated region (UTR) sequences of LDHA mRNA were amplified and inserted into the pGL3 luciferase reporter vector (Promega). GC cells (5 × 10⁵ cells/well) were transfected with miR‐338‐3p or control miRNA plus WT‐ or Mut‐ HAGLR or LDHA 3′‐UTR reporter plasmids in 24‐well plates. Luciferase activity was measured 48 h posttransfection by a Dual‐luciferase reporter assay system (Promega) according to the manufacturer's instructions. Experiments were repeated three time and performed in triplicate.
2.6. Bioinformatics analysis of the lncRNA–miRNA, miRNA–mRNA interactions
Predictions of the HAGLR and miR‐338‐3p, miR‐338‐3p, and LDHA 3′‐UTR were performed from the starBase 2.0 of ENCORI: http://starbase.sysu.edu.cn/. Kaplan–Meier Plotter survival analysis of GC patients with different HAGLR or miR‐338‐3p level were performed from kmplot.com.
2.7. Measurements of glucose metabolism
The glucose metabolism was evaluated by glucose uptake assay and extracellular acidification rate (ECAR) according to previous reports (Li et al., 2017). The glucose uptake was examined using the glucose test kit (Applygen Technologies) according to the manufacturer's instructions. The lactate product assay was performed using the l‐lactate assay kit (BioVision) according to the manufacturer's instructions. The ECAR was measured in GC cells following transfections using the Seahorse XF96e analyzer (Seahorse Bioscience) according to the manufacture's instruction. ECAR of GC cells was measured in XF base medium containing 4 mM glutamine following the addition of 10 µM glucose, 1 µM oligomycin, and 50 mM 2‐DG. Experiments were repeated three times. Results were normalized by the ratio of the cell number of treated cells to that of control cells.
2.8. Colony formation assay
After transfection or 5‐Fu treatments, 500 GC cells were seeded into each well of six‐well plates. Cells were then cultured for three weeks in RPMI‐1640 medium containing 10% FBS. Cell colonies were then fixed with 4% paraformaldehyde (Sangon Ltd.) for 10 min and stained with 0.25% crystal violet (Beyotime Ltd.) for 10 min at room temperature. Colonies (>30 mm diameter) were counted, photographed, and analyzed under the microscope. Each experiment was performed in triplicates.
2.9. Cell proliferation and viability assay
Cell proliferation and viability assays were determined by the 3‐(4,5‐dimethyl‐2‐thiazolyl)‐2,5‐diphenyl‐2‐H‐tetrazolium bromide (MTT) assay (Sigma‐Aldrich) according to the manufacturer's protocol. Briefly, GC cells (1000 cells/well) were seeded into 96‐well plates and maintained in RPMI 1640 medium supplemented with 10% FBS. At different time points (0, 24, 48, and 72 h after seeding) or 48 h post 5‐Fu treatments, 20‐µl MTT solution was added into each well, followed by incubation at 37°C for an additional 4 h. Then 100 μl dimethyl sulfoxide (DMSO) was added to dissolve the formed formazan for 1 h. Absorbance was measured at 450 nm using a microplate reader (Bio‐Rad Laboratories). Experiments were performed in triplicate and repeated three times.
2.10. Flow cytometry
GC cell death rate in response to 5‐Fu treatment was determined using an Annexin V/fluorescein isothiocyanate (FITC) Apoptosis Detection Kit I (BD Biosciences) according to the manufacturer's instruction. Following treatments, cells were gathered and centrifuged at 2000 rpm for 3 min. Cells were washed using PBS two times and resuspended in 300 ml of a binding buffer from the kits. Cells were then stained with Annexin V FITC (5 ml) and propidium iodide (5 ml) solution for 15 min in the dark at room temperature. Analysis was carried out using a FACScan flow cytometer (BD Biosciences). Experiments were performed in triplicate and repeated three times.
2.11. Western blot
Total protein from GC tissues or cultured cells was extracted by ice‐cold RIPA buffer (Thermo Fisher Scientific, Inc.) supplied with 1× protease inhibitor cocktail (Thermo Fisher Scientific Inc.) according to the manufacturer's instructions. Protein was quantified using the Bradford method. An equal amount (30 μg) of total protein from each sample was separated onto a 10% sodium dodecyl sulfate‐polyacrylamide gel electrophoresis. Proteins were then transferred onto a polyvinylidene fluoride membrane (Bio‐rad) followed by blocking by 5% BSA for 1 h at room temperature. Membranes were incubated with primary antibodies for LDHA (1:1000) and β‐actin (1:3000) separately at 4°C overnight. After washing by PBST three times, membranes were incubated with peroxidase‐coupled secondary antibody for 1 h at room temperature. Protein bands were detected using Hyperfilm‐ECL kits (GE Healthcare Biosciences). β‐actin expression was a loading control. Three independent experiments were performed for each analysis.
2.12. Statistical analysis
Prism 6.0 (GraphPad Software) was used for all statistical analyses. Results are expressed as the mean ± standard error (SD). Experiments were repeated three times. The differences between the two experimental groups were evaluated by Student's t‐test. The differences of more than two groups were analyzed using one‐way analysis of variance. Survival analyses were performed using the Kaplan–Meier plots approach. p value less than .05 was considered to be statistically significant.
3. RESULTS
3.1. LncRNA HAGLR is upregulated and associates with a poor prognosis of GC
To evaluate the biological roles of HAGLR in the progress of GC, bioinformatics analysis was performed to compare the HAGLR expressions in normal gastric tissues and GC tumors from the TCGA database. Results demonstrated that HAGLR was obviously upregulated in the GC specimens (Figure 1a), suggesting HAGLR acts as an oncogene in GC. We performed qRT‐PCR in 40 paired GC and adjacent nontumorous tissues. Consistent results showed that HAGLR was significantly elevated in GC tissues (Figure 1b). To examine the clinical relevance of HAGLR, a Kaplan–Meier Plotter analysis was performed and results in Figure 1c demonstrated that GC patients with higher HAGLR levels were associated with an overall poorer survival rates. Expectedly, HAGLR expressions were detected to be significantly upregulated GC cell lines compared with normal gastric epithelial cell lines (Figure 1d). Taken together, this analysis consistently uncovered oncogenic roles of HAGLR in GC.
Figure 1.
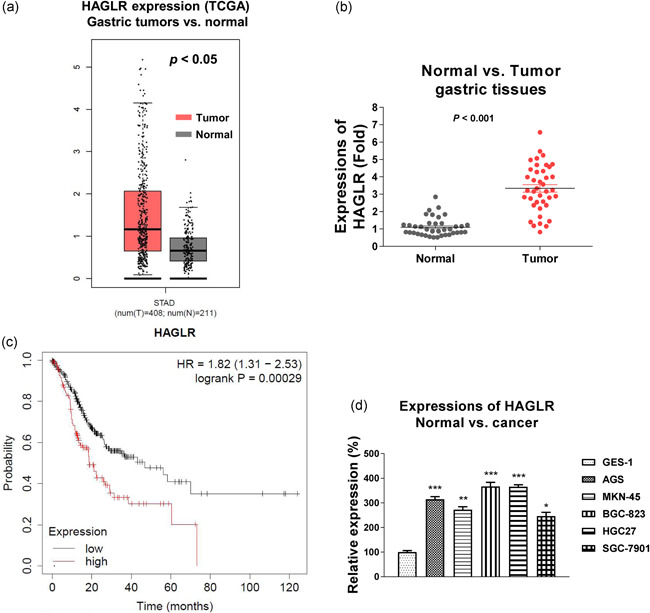
HAGLR is upregulated in gastric cancer (GC). (a) Expressions of HAGLR from GC and normal gastric tissues were analyzed by GEPIA online bioinformatics service. (b) Expressions of HAGLR were detected in GC tumor specimens (n = 40) and adjacent gastric nontumor specimens (n = 40) by quantitative real‐time polymerase chain reaction (qRT‐PCR). (c) Kaplan–Meier plotter analysis to compare the survival rate of gastric cancer patients with high or low HAGLR level. (d) Expressions of HAGLR were detected in normal gastric epithelial cell and five gastric cancer cells by qRT‐PCR. *p < .05; **p < .01; ***p < .001
3.2. HAGLR promotes cell proliferation and 5‐Fu resistance of GC
To assess the effect of lncRNA‐HAGLR on cell proliferation of GC cells, we silenced HAGLR in HGC27 and AGS cells by transfection of HAGLR siRNA (Figure S1). Expectedly, knockdown of HAGLR effectively inhibited cell proliferation of GC cells at 48 h and 72 h posttransfection (Figure 2a,b), indicating HAGLR could be a selective target against GC. Moreover, inhibition of HAGLR significantly suppressed the in vitro migration of GC cells (Figure 2c). Given that chemoresistance is a remarked cancer hallmark, we evaluated the correlation between HAGLR and 5‐Fu resistance in GC patients. From a totally 40 GC patients, the low‐HAGLR expression patients were 14 and the high‐HAGLR expression patients were 26 (Figure 2d). From the 5‐Fu sensitive patients (n = 16), we observed 12 of them (81.25%) was associated with low HAGLR level, while only four patient (8.75%) displayed high HAGLR expression. Among the 5‐Fu resistant patients (n = 24), the majority of them (n = 22, 91.67%) were associated with high HAGLR expression (Figure 2d). On the other aspect, among the high‐HAGLR expression patients (n = 26), four of them are 5‐Fu sensitive and 22 patients were 5‐Fu resistant (Figure 2d). These clinical statistical analyses consistently demonstrated that HAGLR expression was positively associated with 5‐Fu resistance of GC. We further examined the roles of HAGLR in 5‐Fu sensitivity in GC cells. AGS and HGC27 cells with or without HAGLR silencing were treated with 5‐Fu at elevated concentrations. Cell viability assays demonstrated that GC cells with lower HAGLR expression were more sensitive to 5‐Fu (Figure 2e,f). The 5‐Fu IC50s of AGS and HGC27 cells were 155.2 µM and 103.8 µM, respectively. Silencing HAGLR significantly reduced the IC50s of AGS and HGC27 cells to 65.6 µM and 47.1 µM (Figure 2e,f). Meanwhile, overexpression of HAGLR significantly promoted the proliferation (Figure S2a), migration (Figure S2b), and 5‐Fu resistance (Figure S2c) of GC cells. In summary, these results clearly demonstrated HAGLR contributes to GC proliferation, migration, and 5‐Fu resistance.
Figure 2.
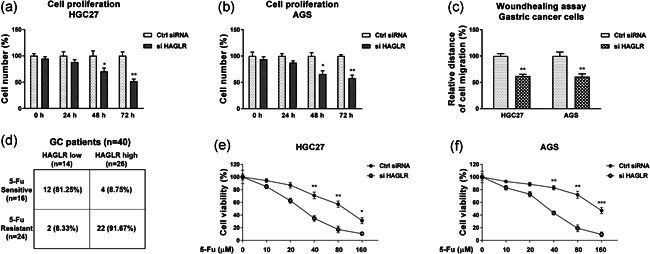
HAGLR promotes proliferation, migration, and 5‐Fu resistance of GC. (a) HAGLR was knocked down by specific siRNA in HGC27 and (b) AGS cells. Cell proliferation assays were performed in 0, 24, 48, and 72 h. (c) The above‐transfected cells were subjected to wound healing assay at 0, 16 h. (d) Comparison of HAGLR expressions in 5‐Fu sensitive and 5‐Fu resistant GC patients. (e) HGC27 and (f) AGS cells were transfected with control siRNA or HAGLR siRNA for 48 h, followed by 5‐Fu treatments at the indicated concentrations for 48 h. Cell viability was determined by the MTT assay. *p < .05; **p < .01; ***p < .001. GC, gastric cancer; siRNA, small interfering RNA
3.3. HAGLR sponges miR‐338‐3p to downregulate its expression in GC
We then investigated the molecular mechanism of the HAGLR‐promoted 5‐Fu resistance in GC. Studies have revealed that lncRNAs function as miRNAs sponges to downregulate their expressions, leading to de‐repression of miRNA targets (Paraskevopoulou & Hatzigeorgiou, 2016). Bioinformatics analysis through the noncoding RNA database starBase2.0 showed miRNA‐338‐3p, which has been reported to be negatively associated with various cancer progression, contains putative HAGLR binding sites (Figure 3a). Moreover, Pearson's correlation coefficient analysis showed a significantly negative correlation between HAGLR and miR‐338‐3p expressions in gastric tumor specimens (Figure 3b). AGS and HGC27 cells with higher HAGLR expressions showed effectively attenuated miR‐338‐3p expressions (Figure 3c). To confirm the interaction between lncRNA‐HAGLR and miR‐338‐3p, we performed RNA‐pull down assay. Biotin‐labeled sense or antisense DNA probe of HAGLR as well as a scramble control was incubated with AGS cell lysate. Results from qRT‐PCR illustrated that the biotin‐labeled antisense DNA probe of HAGLR pulled down enriched miR‐338‐3p (Figure 3d), while the endogenous miR‐338‐3p was not effectively pulled down by sense DNA probe of lncRNA‐HAGLR, suggesting that HAGLR interacts with miR‐338‐3p in GC cells. To validate whether HAGLR directly binds on the seeding region of miR‐338‐3p, AGS, and HGC27 cells were cotransfected with luciferase vector containing wild‐type HAGLR (WT‐HAGLR) or binding site mutant HAGLR (Mut‐HAGLR) and miR‐338‐3p or control miRNA. Luciferase activity of GC cells cotransfected with WT‐HAGLR and miR‐338‐3p was significantly blocked compared with that from the Mut‐HAGLR and miRNA‐338‐3p Cotransfection (Figure 3e,f). In summary, the above results demonstrated HAGLR downregulates miR‐338‐3p expressions through sponging it in GC cells.
Figure 3.
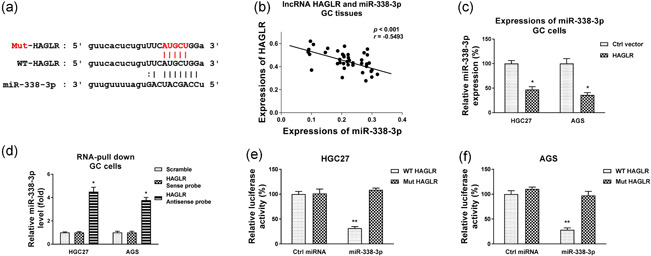
HAGLR sponges miR‐338‐3p as ceRNA. (a) Prediction of miR‐338‐3p binding sites on HAGLR from StarBase. (b) Pearson's correlation coefficient analysis shows a negative correlation between HAGLR and miR‐338‐3p in GC specimens. (c) HGC27 and AGS cells were transfected with HAGLR overexpression plasmid for 48 h, expressions of miR‐338‐3p were detected by qRT‐PCR. (d) HGC27 cell lysates were incubated with biotin‐labeled scramble control, sense or antisense HAGLR DNA probes for biotin pull‐down assay, miR‐338‐3p and HAGLR were assessed by qRT‐PCR. (e) Dual‐luciferase reporter assay was performed by transfection of luciferase vector containing WT‐HAGLR or Mut‐HAGLR with control miRNA or miR‐338‐3p into HGC27 and (f) AGS cells. Luciferase activities were detected. *p < .05; **p < .01. miRNA, microRNA; qRT‐PCR, quantitative real‐time polymerase chain reaction; WT, wild‐type
3.4. miR‐338‐3p is downregulated in GC tissues and cells negatively correlates with 5‐Fu resistance
We then examined the biological roles of miR‐338‐3p in GC. Bioinformatics analysis from GEPIA (Tang et al., 2017) clearly indicated miR‐338‐3p was downregulated in GC (Figure 4a). Moreover, miR‐338‐3p expression was negatively associated with GC tumor grades from TCGA database (Figure S3), suggesting miR‐338‐3p plays suppressive roles in GC. miR‐338‐3p‐high expressed GC patients were associated with an overall better survival rates from a Kaplan–Meier plotter analysis (Figure 4b). We then compared the expressions of miR‐338‐3p in paired GC and adjacent nontumorous tissues as well as GC cells and normal gastric epithelial cell lines. Results in Figure 4c,d consistently demonstrated miR‐338‐3p was significantly downregulated in GC tissues and cells. Expectedly, GC cells with overexpression of miR‐338‐3p showed significantly blocked glucose metabolism (Figure S4a,b) and increased sensitivity to 5‐Fu treatments compared with control cells (Figure 4e,f), suggesting miR‐338‐3p could be a therapeutic agent for overcoming chemoresistant GC.
Figure 4.
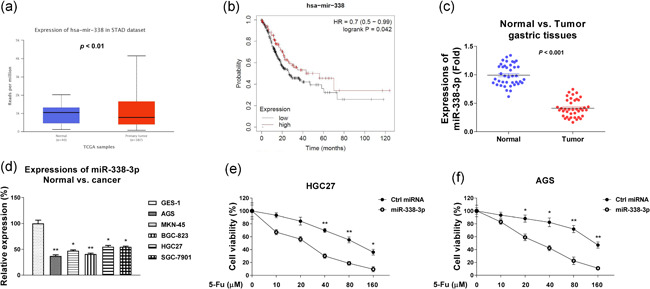
miR‐338‐3p negatively associates with GC. (a) Expressions of miR‐338‐3p in normal or GC specimens were analyzed from TCGA database through UALCAN.com. (b) Kaplan–Meier plotter analysis to compare the survival rate of gastric cancer patients with high or low miR‐338‐3p level. (c) Expressions of miR‐338‐3p were detected in GC tumor specimens (n = 40) and adjacent gastric nontumor specimens (n = 40) by qRT‐PCR. (d) Expressions of miR‐338‐3p were detected in normal gastric epithelial cells and five gastric cancer cells by qRT‐PCR. (e) HGC27 and (f) AGS cells were transfected with control miRNA or miR‐338‐3p for 48 h, followed by treatments with 5‐Fu at the indicated concentrations for 48 h. Cell viability was determined by the MTT assay. *p < .05; **p < .01. miRNA, microRNA; MTT, 3‐(4,5‐dimethyl‐2‐thiazolyl)‐2,5‐diphenyl‐2H‐tetrazolium bromide; qRT‐PCR, quantitative real‐time polymerase chain reaction
3.5. 5‐Fu resistant GC cells display upregulated HAGLR and glucose metabolism and downregulated miR‐338‐3p
The above results uncovered a HAGLR‐promoted 5‐Fu resistance. To explore the underlying cellular mechanisms of 5‐Fu resistance, we developed a 5‐Fu resistant GC (5‐Fu R) cell line from HGC27 by treating cells with gradually elevated concentrations of 5‐Fu. The HGC27 5‐Fu resistant cells showed higher survival capacities under 5‐Fu treatments compared with HGC27 parental cells (Figure 5a,b). The 5‐Fu IC50 of HGC27 5‐Fu R cells was 268.5 µM, which is significantly higher than that of HGC27 parental cells (102.3 µM) (Figure 5a). Consistent results from the clonogenic assay showed that HGC27 5‐Fu R cells could better tolerate 5‐Fu treatment than HGC27 parental cells (Figure 5b). As we expected, HAGLR was apparently upregulated in 5‐Fu resistant cells (Figure 5c). On the contrary, miR‐338‐3p was significantly downregulated in 5‐Fu resistant cells compared with parental cells (Figure 5d). These results consistently demonstrated the reverse roles of HAGLR and miR‐338‐3p in 5‐Fu resistant GC cells. Since the dysregulated glucose metabolism was known to affect the chemosensitivity of tumors (Abdel‐Wahab et al., 2019), we, therefore, investigated the functional roles of lncRNA‐HAGLR in anaerobic glycolysis in GC cells. Silencing HAGLR resulted in significantly decreased overall glucose consumption and extracellular acidification rate as measured by ECAR (Figure 5e,f), suggesting the HAGLR‐mediated 5‐Fu resistance was through the modulation of glucose metabolism.
Figure 5.
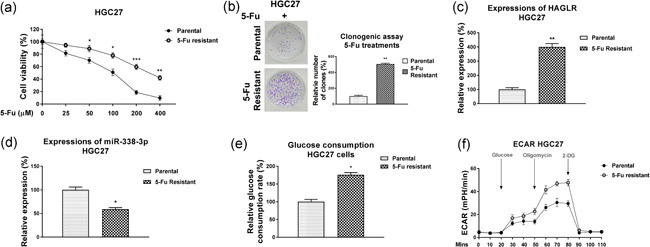
5‐Fu resistant GC cells positively associate with HAGLR and glucose metabolism. (a) The 5‐Fu responsiveness of HGC27 parental and 5‐Fu resistant cells under gradually increased 5‐Fu treatments was validated by MTT assay and (b) clonogenic assay. (c) HAGLR and (d) miR‐338‐3p expressions were detected in HGC27 parental and 5‐Fu resistant cells by qRT‐PCR. (e) The glucose uptake and (f) extracellular acidification rate (ECAR) of HGC27 parental and 5‐Fu resistant cells were measured. *p < .05; **p < .01; ***p < .001. GC, gastric cancer; miR, microRNA; MTT, 3‐(4,5‐dimethyl‐2‐thiazolyl)‐2,5‐diphenyl‐2H‐tetrazolium bromide; qRT‐PCR, quantitative real‐time polymerase chain reaction
3.6. miR‐338‐3p blocks glucose metabolism via direct targeting LDHA to sensitize GC cells to 5‐Fu
Accumulating evidence revealed that miRNAs function to inhibit mRNA transcription through binding to the 3ʹ‐UTR of their target mRNAs (Mollaei et al., 2019). We then investigated the molecular targets of miR‐338‐3p in GC cells by searching the noncoding RNA database, starBase2.0. Interestingly, among all the candidates, the 3ʹ‐UTR of LDHA, which catalyzes the conversion of pyruvate to lactate during the anaerobic glycolysis (Feng et al., 2018), contains a putative miR‐338‐3p binding sites (Figure 6a). We thus examined the clinical relevance of LDHA in GC. Expressions of LDHA were observed to be significantly upregulated in diverse cancers (Figure S5), including GC through both TGCA database analysis and qRT‐PCR (Figure 6b,c). Furthermore, upregulation of LDHA was observed in 5‐Fu resistant GC cells compared with parental cells (Figure 6d). To verify the oncogenic roles of LDHA in 5‐Fu resistance, LDHA was silenced by siRNA in HGC27 and AGS cells. Expectedly, GC cells with lower LDHA expression were more sensitive to 5‐Fu compared with control cells (Figure 6e,f). Expectedly, blocking LDHA significantly attenuated glucose metabolism of GC cells (Figure 6g,h). To evaluate the miR‐338‐3p‐LDHA network, the Pearson correlation coefficient analysis from tumor specimens demonstrated that higher LDHA mRNA was significantly correlated with lower miR‐338‐3p levels in GC patients (Figure 6i), suggesting LDHA might be a target of miR‐338‐3p in gastric tumors. To test whether the expression of LDHA could be regulated by miR‐338‐3p, AGS and HGC27 cells were transfected with control miRNA or miR‐338‐3p and the LDHA protein expression was examined. As shown in Figure 6j, overexpression of miR‐338‐3p resulted in inhibited LDHA protein expression. To validate whether miR‐338‐3p targets the 3ʹ‐UTR of LDHA, luciferase reporter assay was performed by cotransfection of control or miR‐338‐3p with luciferase plasmid containing 3ʹ‐UTR of WT‐LDHA or binding site mutant‐LDHA into GC cells. Consistent results demonstrated miR‐338‐3p significantly attenuated the luciferase activity of vector containing WT‐LDHA 3′‐UTR but not that of Mut‐LDHA 3′‐UTR (Figure 6k,l).
Figure 6.
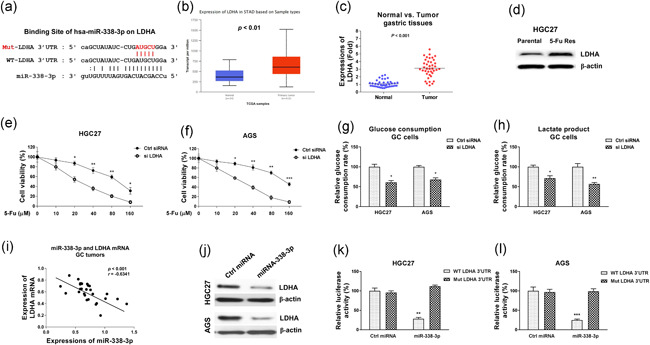
miR‐338‐3p directly targets 3ʹ‐UTR of LDHA to sensitize GC cells to 5‐Fu. (a) Prediction of miR‐338‐3p binding sites on LDHA 3ʹ‐UTR from StarBase. (b) Expressions of LDHA mRNA in normal or GC specimens were analyzed from TCGA database through UALCAN.com. (c) Expressions of LDHA mRNA in 40 normal or GC specimens were detected by qRT‐PCR. (d) Protein expressions of LDHA were examined in HGC27 parental and 5‐Fu resistant cells. β‐actin was an internal control. (e) HGC27 and (f) AGS cells were transfected with control siRNA or si LDHA for 48 h, cells were treated with 5‐Fu at the indicated concentrations. Cell viability was determined by MTT assay. (g) HGC27 and AGS cells were transfected with control siRNA or si LDHA for 48 h, the glucose consumption and (h) lactate product were evaluated. (i) Pearson's correlation coefficient analysis shows a positive correlation between HAGLR and LDHA mRNA in GC specimens. (j) HGC27 and AGS cells were transfected with miR‐338‐3p precursor for 48 h, protein expressions of LDHA were detected by Western blot. (k) Dual‐luciferase reporter assay was performed by transfection of luciferase vector containing 3ʹ‐UTR of WT‐LDHA or Mut‐LDHA with control miRNA or miR‐338‐3p into HGC27 and (l) AGS cells. Luciferase activities were detected. *p < .05; **p < .01; ***p < .001. miRNA, microRNA; MTT, 3‐(4,5‐dimethyl‐2‐thiazolyl)‐2,5‐diphenyl‐2H‐tetrazolium bromide; qRT‐PCR, quantitative real‐time polymerase chain reaction; siRNA, small interfering RNA; 3ʹ‐UTR, 3ʹ‐untranslated region
We then asked whether the miR‐338‐3p‐mediated glycolysis inhibition and 5‐Fu sensitization were through targeting LDHA. Consequently, rescue experiments were conducted by transfection of control, miR‐338‐3p alone or combined with LDHA overexpression vector into HGC27 cells. Western blot results showed cotransfection of LDHA with miR‐338‐3p into GC cells successfully rescued the LDHA protein expression (Figure 7a). As we expected, restoration of LDHA in miR‐338‐3p‐overexpressing GC cells effectively recovered the glucose uptake (Figure 7b), ECAR (Figure 7c), and 5‐Fu resistance (Figure 7d,e). Taken together, these data consistently demonstrated that miR‐338‐3p sensitizes GC cells to 5‐Fu via direct targeting the LDHA‐glycolysis pathway.
Figure 7.
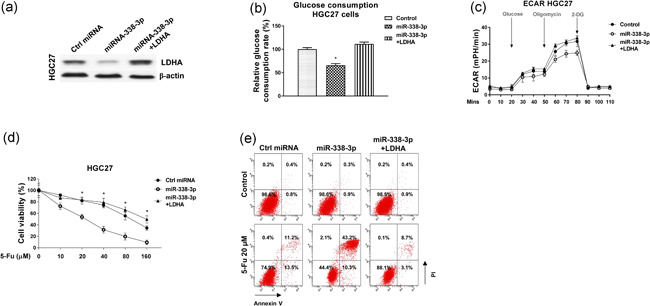
Restoration of LDHA overcomes the miR‐338‐3p‐inhibited glycolysis and 5‐Fu resistance in GC cells. (a) HGC27 cells were transfected with control, miR‐338‐3p alone or combined with LDHA for 48 h, expressions of LDHA were examined by western blot. (b) The above‐transfected cells were subjected to glucose uptake assay and (c) ECAR measurements. (d) The above‐transfected cells were treated with 5‐Fu at the indicated concentrations for 48 h, cell viability was determined by MTT assay and (e) Annexin V apoptosis assay. *p < .05. GC, gastric cancer; miR, microRNA; MTT, 3‐(4,5‐dimethyl‐2‐thiazolyl)‐2,5‐diphenyl‐2H‐tetrazolium bromide
3.7. Inhibition of HAGLR sensitizes 5‐Fu resistant GC cells through sponging the miR‐338‐3p‐LDHA axis
Finally, we evaluated whether the above described HAGLR‐promoted 5‐Fu resistance was through modulating the miR‐338‐3p‐LDHA‐glycolysis axis. Expression correlation analysis from both lncRNA database, Starbase, and qRT‐PCR results clearly showed that HAGLR was positively associated with LDHA mRNA expressions in GC specimens (Figure 8a). We performed mechanism rescue experiments by cotransfection of HGC27 cells with a control plasmid, HAGLR overexpression plasmid alone or combined with miR‐338‐3p. Western blot results in Figure 7b uncovered that overexpression of HAGLR significantly promoted LDHA expression. Cotransfection of HAGLR plus miR‐338‐3p successfully restored LDHA protein expressions to that from control cells (Figure 8b). Moreover, cotransfection of HAGLR plus miR‐338‐3p recovered the glucose metabolism in both HGC27 parental (Figure 8c,d) and 5‐Fu resistant cells (Figure S6a,b), indicating the HAGLR‐promoted glucose metabolism was through sponging miR‐338‐3p. Consequently, restoration of miR‐338‐3p in HAGLR‐overexpressing HGC27 cells significantly re‐sensitized cells to 5‐Fu (Figure 8e,f) by MTT assay and Annexin V apoptosis assay. Summarily, these results validated that the HAGLR‐promoted 5‐Fu resistance was through modifying the miR‐338‐3p‐LDHA axis.
Figure 8.
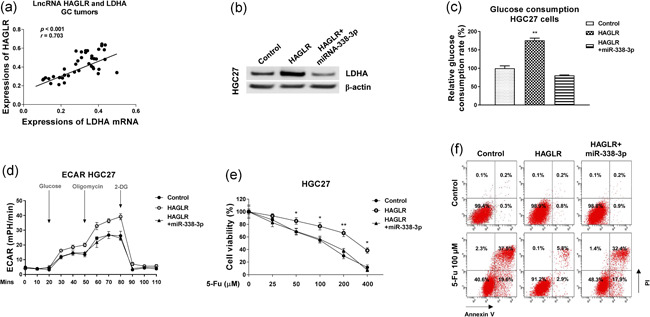
The roles of HAGLR‐miR‐338‐3p‐LDHA axis in 5‐Fu resistance. (a) Pearson's correlation coefficient analysis shows a positive correlation between HAGLR and LDHA in GC specimens. (b) HGC27 cells were transfected with control, HAGLR alone or combined with miR‐338‐3p for 48 h, expressions of LDHA were examined by western blot. (c) The above‐transfected cells were subjected to glucose uptake assay and (d) ECAR measurements. (e) The above‐transfected cells were treated with 5‐Fu at the indicated concentrations for 48 h, cell viability was determined by MTT assay and (f) Annexin V apoptosis assay. *p < .05; **p < .01. GC, gastric cancer; miR, microRNA; MTT, 3‐(4,5‐dimethyl‐2‐thiazolyl)‐2,5‐diphenyl‐2H‐tetrazolium bromide
4. DISCUSSION
GC, one of the most common human malignancies, remains a leading cause of cancer mortality (Biagioni et al., 2019; Karimi et al., 2014). 5‐Fu is a widely applied chemotherapeutic agent against GC especially at an advanced stage or at high risk of recurrence (Lee et al., 2016). However, due to the acquired chemoresistance, a large fraction of patients displayed attenuated therapeutic effects under 5‐Fu treatments. Currently, the molecular mechanisms for 5‐Fu resistance are still under investigation. Studies revealed that 5‐Fu resistance could be due to the increased expression and activities of some membrane drug transporters (Blondy et al., 2020). Moreover, drug resistance could be induced by upregulated or hyperactive oncogenic signaling pathway which plays vital role in the biosynthesis of anti‐chemotherapeutic molecules (Blondy et al., 2020). The present study uncovered a lncRNA/miRNA‐based molecular mechanism for 5‐Fu resistance of GC cells. Studies have reported that HAGLR was upregulated in various malignant tumors. For instance, HAGLR was upregulated in NSCLC specimens compared with normal tissues (Lu et al., 2017). Moreover, Kaplan–Meier survival analysis revealed that high HAGLR expression was linked to poor survival rate in NSCLC patients (Lu et al., 2017). However, the functional roles of HAGLR in GC have not been investigated. Our results demonstrated that HAGLR was significantly upregulated in GC tissues and cells, consistent with previous reports. Moreover, HAGLR expression was negatively associated with the survival rates of GC patients. Silencing HAGLR effectively sensitized GC cells to 5‐Fu, presenting lncRNA‐HAGLR as a potentially therapeutic target and biomarker of GC.
Mounting evidence revealed LncRNAs functions through sponging target miRNAs by forming a ceRNA complex, leading to modification of target mRNAs expressions (Paraskevopoulou & Hatzigeorgiou, 2016; Zhang et al., 2018). To further explore the underlying miRNA target which contributes to the oncogenic phenotypes of HAGLR in 5‐Fu resistance, we identified miR‐338‐3p as a HAGLR target in GC cells by RNA pull‐down and luciferase assays. Recent studies reported that miR‐338‐3p acts as tumor‐suppressive roles in multiple cancers such as ovarian cancer (Niu et al., 2019), colon cancer (Zou et al., 2018), cervical cancer (Luan & Wang, 2018), and breast cancer (He et al., 2020). Overexpression of miR‐338‐3p increased the cisplatin sensitivity of ovarian cancer (Niu et al., 2019), suggesting targeting the HAGLR‐miR‐338‐3p could be a potentially anti‐chemoresistant approach. Our results showed overexpression of HAGLR significantly downregulated miR‐338‐3p expressions in GC cells. Moreover, we found miR‐338‐3p was negatively associated with GC and 5‐Fu resistance, suggesting miR‐338‐3p acts as a tumor suppressor in GC.
Reprogramming of cellular metabolisms, such as elevated glucose metabolism, is a new hallmark of cancer due to the high demand for building blocks for rapid proliferation (Pascale et al., 2020). Furthermore, accumulation evidence demonstrated that the metabolic dependencies of tumors are tightly correlated with chemo‐sensitivity (Abdel‐Wahab et al., 2019, Liu et al., 2019), providing a novel therapeutic strategy for antitumor treatment. Results from this study showed glucose consumption and the extracellular acidification rate of 5‐Fu resistant GC cells were significantly elevated. Consistently, HAGLR was detected to be upregulated and miR‐338‐3p was suppressed in 5‐Fu resistant GC cells compared with parental cells.
LDHA is a known key glycolysis enzyme through catalyzing the conversion of pyruvate to lactate (Feng et al., 2018). It is widely studied as an effective target for anticancer therapeutics. Our findings showed LDHA was remarkedly upregulated in 5‐Fu resistant GC cells. Importantly, western blot and luciferase assay demonstrated that miR‐338‐3p directly targets 3ʹ‐UTR of LDHA in GC cells. Moreover, inhibition of glucose metabolism by either silencing LDHA or overexpression of miR‐338‐3p effectively overcame 5‐Fu resistance, suggesting targeting glucose metabolism pathway with noncoding RNA‐based approaches is potentially strategy against chemoresistance of GC. However, this study still has limits that in vitro results need further validation by in vivo xenograft mice experiments.
In summary, we demonstrate that HAGLR plays oncogenic roles in 5‐Fu resistance of GC cells. Mechanically, HAGLR sponges miR‐338‐3p as a ceRNA, resulting in modulation of the LDHA‐glycolysis pathway in GC. This study contributes to the development of new noncoding RNA‐based therapeutic strategies against chemoresistant GC.
CONFLICT OF INTERESTS
The authors declare that there are no conflict of interests.
AUTHOR CONTRIBUTIONS
Jing Hu, Lujie Huang, and Zhe Chen: Designed the experiments. Jing Hu, Lujie Huang, Qi Ding, Jiaming Lv, and Zhe Chen: carried out the experiments and analyzed the data. All authors participated in the manuscript preparation.
Supporting information
Figure S1. Knockdown effects of HAGLR siRNA on gastric cancer cells.
Figure S2. Effects of HAGLR overexpression on the proliferation, migration and 5‐Fu sensitivity of gastric cancer cells. (A) HGC27 cells were transfected with control vector or HAGLR for 48 hours, the cell proliferation, (B) migration and (C) 5‐Fu sensitivity were examined. *, p < 0.05; **, p < 0.01; ***, p < 0.001.
Figure S3. Expression of miR‐338‐3p in gastric cancer based on tumor grade.
Figure S4. Effects of miR‐338‐3p overexpression on the glucose metabolism of gastric cancer cells. (A) HGC27 cells were transfected with control miRNA or miR‐338‐3p for 48 hours, the glucose consumption and (B) lactate product were examined. *, p < 0.05; **, p < 0.01.
Figure S5. Expressions of LDHA on tumor and normal samples from TCGA cancer database.
Figure S6. The roles of HAGLR‐miR‐338‐3p‐LDHA axis in 5‐Fu resistance. (A) HGC27 5‐Fu resistant cells were transfected with control, HAGLR alone or combined with miR‐338‐3p for 48 hours, glucose uptake and (D) lactate product were examined. *, p < 0.05.
Supporting information.
ACKNOWLEDGEMENTS
The authors thank medical doctors, research scientists from the Ningbo Medical Center Lihuili Hospital for thoughtful discussions and comments on the manuscript. This study is supported by Ningbo Natural Science Foundation (Grant number: 2021J293).
Hu, J. , Huang, L. , Ding, Q. , Lv, J. , & Chen, Z. (2022). Long noncoding RNA HAGLR sponges miR‐338‐3p to promote 5‐Fu resistance in gastric cancer through targeting the LDHA‐glycolysis pathway. Cell Biol Int, 46, 173–184. 10.1002/cbin.11714
DATA AVAILABILITY STATEMENT
The data sets used and/or analyzed during the current study are available from the corresponding author on reasonable request.
REFERENCES
- Abdel‐Wahab, A. F. , Mahmoud, W. , & Al‐Harizy, R. M. (2019). Targeting glucose metabolism to suppress cancer progression: Prospective of anti‐glycolytic cancer therapy. Pharmacological Research, 150, 104511. [DOI] [PubMed] [Google Scholar]
- Bhan, A. , Soleimani, M. , & Mandal, S. S. (2017). Long noncoding RNA and cancer: A new paradigm. Cancer Research, 77, 3965–3981. [DOI] [PMC free article] [PubMed] [Google Scholar]
- Biagioni, A. , Skalamera, I. , Peri, S. , Schiavone, N. , Cianchi, F. , Giommoni, E. , Magnelli, L. , & Papucci, L. (2019). Update on gastric cancer treatments and gene therapies. Cancer and Metastasis Reviews, 38, 537–548. [DOI] [PubMed] [Google Scholar]
- Blondy, S. , David, V. , Verdier, M. , Mathonnet, M. , Perraud, A. , & Christou, N. (2020). 5‐Fluorouracil resistance mechanisms in colorectal cancer: From classical pathways to promising processes. Cancer Prevention Research, 111, 3142–3154. [DOI] [PMC free article] [PubMed] [Google Scholar]
- Feng, Y. , Xiong, Y. , Qiao, T. , Li, X. , Jia, L. , & Han, Y. (2018). Lactate dehydrogenase A: A key player in carcinogenesis and potential target in cancer therapy. Cancer Medicine, 7, 6124–6136. [DOI] [PMC free article] [PubMed] [Google Scholar]
- Ghafouri‐Fard, S. , & Taheri, M. (2020). Long non‐coding RNA signature in gastric cancer. Experimental and Molecular Pathology, 113, 104365. [DOI] [PubMed] [Google Scholar]
- He, J. , Wang, J. , Li, S. , Li, T. , Chen, K. , & Zhang, S. (2020). Hypoxia‐inhibited miR‐338‐3p suppresses breast cancer progression by directly targeting ZEB2. Cancer Prevention Research, 111, 3550–3563. [DOI] [PMC free article] [PubMed] [Google Scholar]
- Karimi, P. , Islami, F. , Anandasabapathy, S. , Freedman, N. D. , & Kamangar, F. (2014). Gastric cancer: Descriptive epidemiology, risk factors, screening, and prevention. Cancer Epidemiology, Biomarkers and Prevention, 23, 700–713. [DOI] [PMC free article] [PubMed] [Google Scholar]
- Lee, J. J. , Beumer, J. H. , & Chu, E. (2016). Therapeutic drug monitoring of 5‐fluorouracil. Cancer Chemotherapy and Pharmacology, 78, 447–464. [DOI] [PMC free article] [PubMed] [Google Scholar]
- Li, L. , Kang, L. , Zhao, W. , Feng, Y. , Liu, W. , Wang, T. , Mai, H. , Huang, J. , Chen, S. , Liang, Y. , Han, J. , Xu, X. , & Ye, Q. (2017). miR‐30a‐5p suppresses breast tumor growth and metastasis through inhibition of LDHA‐mediated Warburg effect. Cancer Letters, 400, 89–98. [DOI] [PubMed] [Google Scholar]
- Liu, Y. , Zhang, Z. , Wang, J. , Chen, C. , Tang, X. , Zhu, J. , & Liu, J. (2019). Metabolic reprogramming results in abnormal glycolysis in gastric cancer: A review. OncoTargets and Therapy, 12, 1195–1204. [DOI] [PMC free article] [PubMed] [Google Scholar]
- Lu, C. , Ma, J. , & Cai, D. (2017). Increased HAGLR expression promotes non‐small cell lung cancer proliferation and invasion via enhanced de novo lipogenesis. Tumour Biology, 39, 1010428317697574. [DOI] [PubMed] [Google Scholar]
- Luan, X. , & Wang, Y. (2018). LncRNA XLOC_006390 facilitates cervical cancer tumorigenesis and metastasis as a ceRNA against miR‐331‐3p and miR‐338‐3p. Journal of Gynecologic Oncology, 29, e95. [DOI] [PMC free article] [PubMed] [Google Scholar]
- Mahlab‐Aviv, S. , Zohar, K. , Cohen, Y. , Peretz, A. R. , Eliyahu, T. , Linial, M. , & Sperling, R. (2020). Spliceosome‐associated microRNAs signify breast cancer cells and portray potential novel nuclear targets. International Journal of Molecular Sciences, 21, E8132. [DOI] [PMC free article] [PubMed] [Google Scholar]
- Mollaei, H. , Safaralizadeh, R. , & Rostami, Z. (2019). MicroRNA replacement therapy in cancer. Journal of Cellular Physiology, 234, 12369–12384. [DOI] [PubMed] [Google Scholar]
- Niu, Q. , Liu, Z. , Gao, J. , & Wang, Q. (2019). miR‐338‐3p enhances ovarian cancer cell sensitivity to cisplatin by downregulating WNT2B. Yonsei Medical Journal, 60, 1146–1156. [DOI] [PMC free article] [PubMed] [Google Scholar]
- Paraskevopoulou, M. D. , & Hatzigeorgiou, A. G. (2016). Analyzing miRNA‐lncRNA interactions. Methods in Molecular Biology, 1402, 271–286. [DOI] [PubMed] [Google Scholar]
- Pascale, R. M. , Calvisi, D. F. , Simile, M. M. , Feo, C. F. , & Feo, F. (2020). The Warburg effect 97 years after its discovery. Cancers, 12, 2819. [DOI] [PMC free article] [PubMed] [Google Scholar]
- Peng, W. X. , Koirala, P. , & Mo, Y. Y. (2017). LncRNA‐mediated regulation of cell signaling in cancer. Oncogene, 36, 5661–5667. [DOI] [PMC free article] [PubMed] [Google Scholar]
- Sun, W. , Nie, W. , Wang, Z. , Zhang, H. , Li, Y. , & Fang, X. (2020). Lnc HAGLR promotes colon cancer progression through sponging miR‐185‐5p and activating CDK4 and CDK6 in vitro and in vivo. OncoTargets and Therapy, 13, 5913–5925. [DOI] [PMC free article] [PubMed] [Google Scholar]
- Tang, Z. , Li, C. , Kang, B. , Gao, G. , Li, C. , & Zhang, Z. (2017). GEPIA: A web server for cancer and normal gene expression profiling and interactive analyses. Nucleic Acids Research, 45, W98–W102. [DOI] [PMC free article] [PubMed] [Google Scholar]
- Yang, C. , Shen, S. , Zheng, X. , Ye, K. , Sun, Y. , Lu, Y. , & Ge, H. (2019). Long noncoding RNA HAGLR acts as a microRNA‐143‐5p sponge to regulate epithelial‐mesenchymal transition and metastatic potential in esophageal cancer by regulating LAMP3. FASEB Journal, 33, 10490–10504. [DOI] [PubMed] [Google Scholar]
- Zhang, G. , Pian, C. , Chen, Z. , Zhang, J. , Xu, M. , Zhang, L. , & Chen, Y. (2018). Identification of cancer‐related miRNA‐lncRNA biomarkers using a basic miRNA‐lncRNA network. PLoS One, 13), e0196681. [DOI] [PMC free article] [PubMed] [Google Scholar]
- Zou, T. , Duan, J. , Liang, J. , Shi, H. , Zhen, T. , Li, H. , Zhang, F. , Dong, Y. , & Han, A. (2018). miR‐338‐3p suppresses colorectal cancer proliferation and progression by inhibiting MACC1. International Journal of Clinical and Experimental Pathology, 11, 2256–2267. [PMC free article] [PubMed] [Google Scholar]
Associated Data
This section collects any data citations, data availability statements, or supplementary materials included in this article.
Supplementary Materials
Figure S1. Knockdown effects of HAGLR siRNA on gastric cancer cells.
Figure S2. Effects of HAGLR overexpression on the proliferation, migration and 5‐Fu sensitivity of gastric cancer cells. (A) HGC27 cells were transfected with control vector or HAGLR for 48 hours, the cell proliferation, (B) migration and (C) 5‐Fu sensitivity were examined. *, p < 0.05; **, p < 0.01; ***, p < 0.001.
Figure S3. Expression of miR‐338‐3p in gastric cancer based on tumor grade.
Figure S4. Effects of miR‐338‐3p overexpression on the glucose metabolism of gastric cancer cells. (A) HGC27 cells were transfected with control miRNA or miR‐338‐3p for 48 hours, the glucose consumption and (B) lactate product were examined. *, p < 0.05; **, p < 0.01.
Figure S5. Expressions of LDHA on tumor and normal samples from TCGA cancer database.
Figure S6. The roles of HAGLR‐miR‐338‐3p‐LDHA axis in 5‐Fu resistance. (A) HGC27 5‐Fu resistant cells were transfected with control, HAGLR alone or combined with miR‐338‐3p for 48 hours, glucose uptake and (D) lactate product were examined. *, p < 0.05.
Supporting information.
Data Availability Statement
The data sets used and/or analyzed during the current study are available from the corresponding author on reasonable request.