Abstract
Environmental mechanical cues are critical to guide cell fate. In cardiovascular tissues, changes in the mechanical properties of the extracellular matrix are associated with cellular dedifferentiation and subsequent functional decline. However, the underlying mechanoreceptive mechanisms are largely unclear. Recently, attention has been focused on the nucleus as a potential mechanosensor since it is tightly connected to the cytoskeleton. Here, we show that cardiomyocytes establish a distinct nuclear organization during maturation, characterized by reorganization of H3K9me3-marked chromatin toward the nuclear border. By generating high-resolution, full-field strain maps of cardiomyocyte nuclei during contraction, we demonstrated that intranuclear tension was spatially correlated with H3K9me3-marked chromatin. The reduction of nuclear deformation in vitro, through stiffening of the environment or LINC complex disruption, abrogated the reorganization of chromatin and leads to a dissociation of H3K9me3 from the nuclear periphery. Further, suppressing H3K9 methylation led to chromatin reorganization and decreased expression of cardiac developmental genes. Similar results were found in mouse and human disease models with reduced cardiac performance. Our findings provide evidence that CM nuclei integrate mechanical cues from the environment, forwarded via the cytoskeleton, through the reorganization of epigenetically marked chromatin to guide and stabilize cell fate.
Keywords: Cardiac development, Mechanosensation, Chromatin Organization, Nucleus, Epigenetics, Substrate Mechanics, Cardiac Hypertrophy
INTRODUCTION
Mechanics of cellular microenvironments play an important role in directing cell differentiation during development1 and maintaining tissue health during adulthood2. Changes in mechanical properties due to acute trauma, chronic conditions, or genetic predispositions lead to cellular degeneration and result in a range of pathologies3, including cardiac hypertrophy4,5. Further, regenerative medicine aims to engineer suitable microenvironments to guide cell fates for enhanced tissue regeneration. However, little is known about the underlying mechanisms that facilitate cell differentiation in response to environmental cues.
The nucleus is thought to be an essential mechanosensitive organelle6–10. To sense the mechanical environment, the nucleus is connected to the cytoskeleton through LINC (Linker of Nucleo- and Cytoskeleton) complexes11 comprised of proteins that span the inner (SUNs) and outer (nesprins) nuclear membranes12–14. Studies on isolated nuclei demonstrated that the nucleus alone can respond to stretch, however, only when engaged via LINC complexes15. Mutations in LINC complexes and nuclear envelope proteins are also related to developmental disorders16, particularly in mechanically active tissues such as cardiac and skeletal muscle17,18.
Moreover, chromatin organization has been linked to cell differentiation and changes from an unstructured organization in the zygote to a cell type-specific organization during development19–23. Recent efforts, including the 4D Nucleome Common Fund from the NIH, aim to map changes of the 3D organization during development to better understand this relationship24. Type-specific nuclear morphology can also have direct implications for cellular functions as has been described for plasma cells25, neutrophil granulocytes26, T-cells27 and photoreceptor cells28.
Based on existing evidence linking nuclear organization and differentiation, we hypothesized that biophysical signals from the cell environment might guide cell behavior through spatial rearrangement of chromatin; however, no study has investigated the effect of mechanical strains specifically within the nucleus on chromatin organization during cellular differentiation. To bridge this gap, we investigated the chromatin organization in embryonic cardiomyocytes (CM) during development, as well as in adult mice and humans during pathology. Our specific objective was to show the extent that nuclei of cardiomyocytes integrate mechanical cues from the environment through reorganization of epigenetically marked chromatin, thereby stabilizing differentiation and a mature phenotype. On substrates stiffer than native cardiac tissue, CMs show poor contractility and inhibited differentiation29–31. Due to their well-investigated behavior in response to substrate stiffness and contraction-mediated deformation of nuclei, CMs provided a good model to investigate the relation between the mechanics of cellular environments, cell differentiation, and chromatin organization, as well as the potential role of nuclear mechanosensation in these processes.
RESULTS
CMs Adopt a Distinct Nuclear Architecture During Development
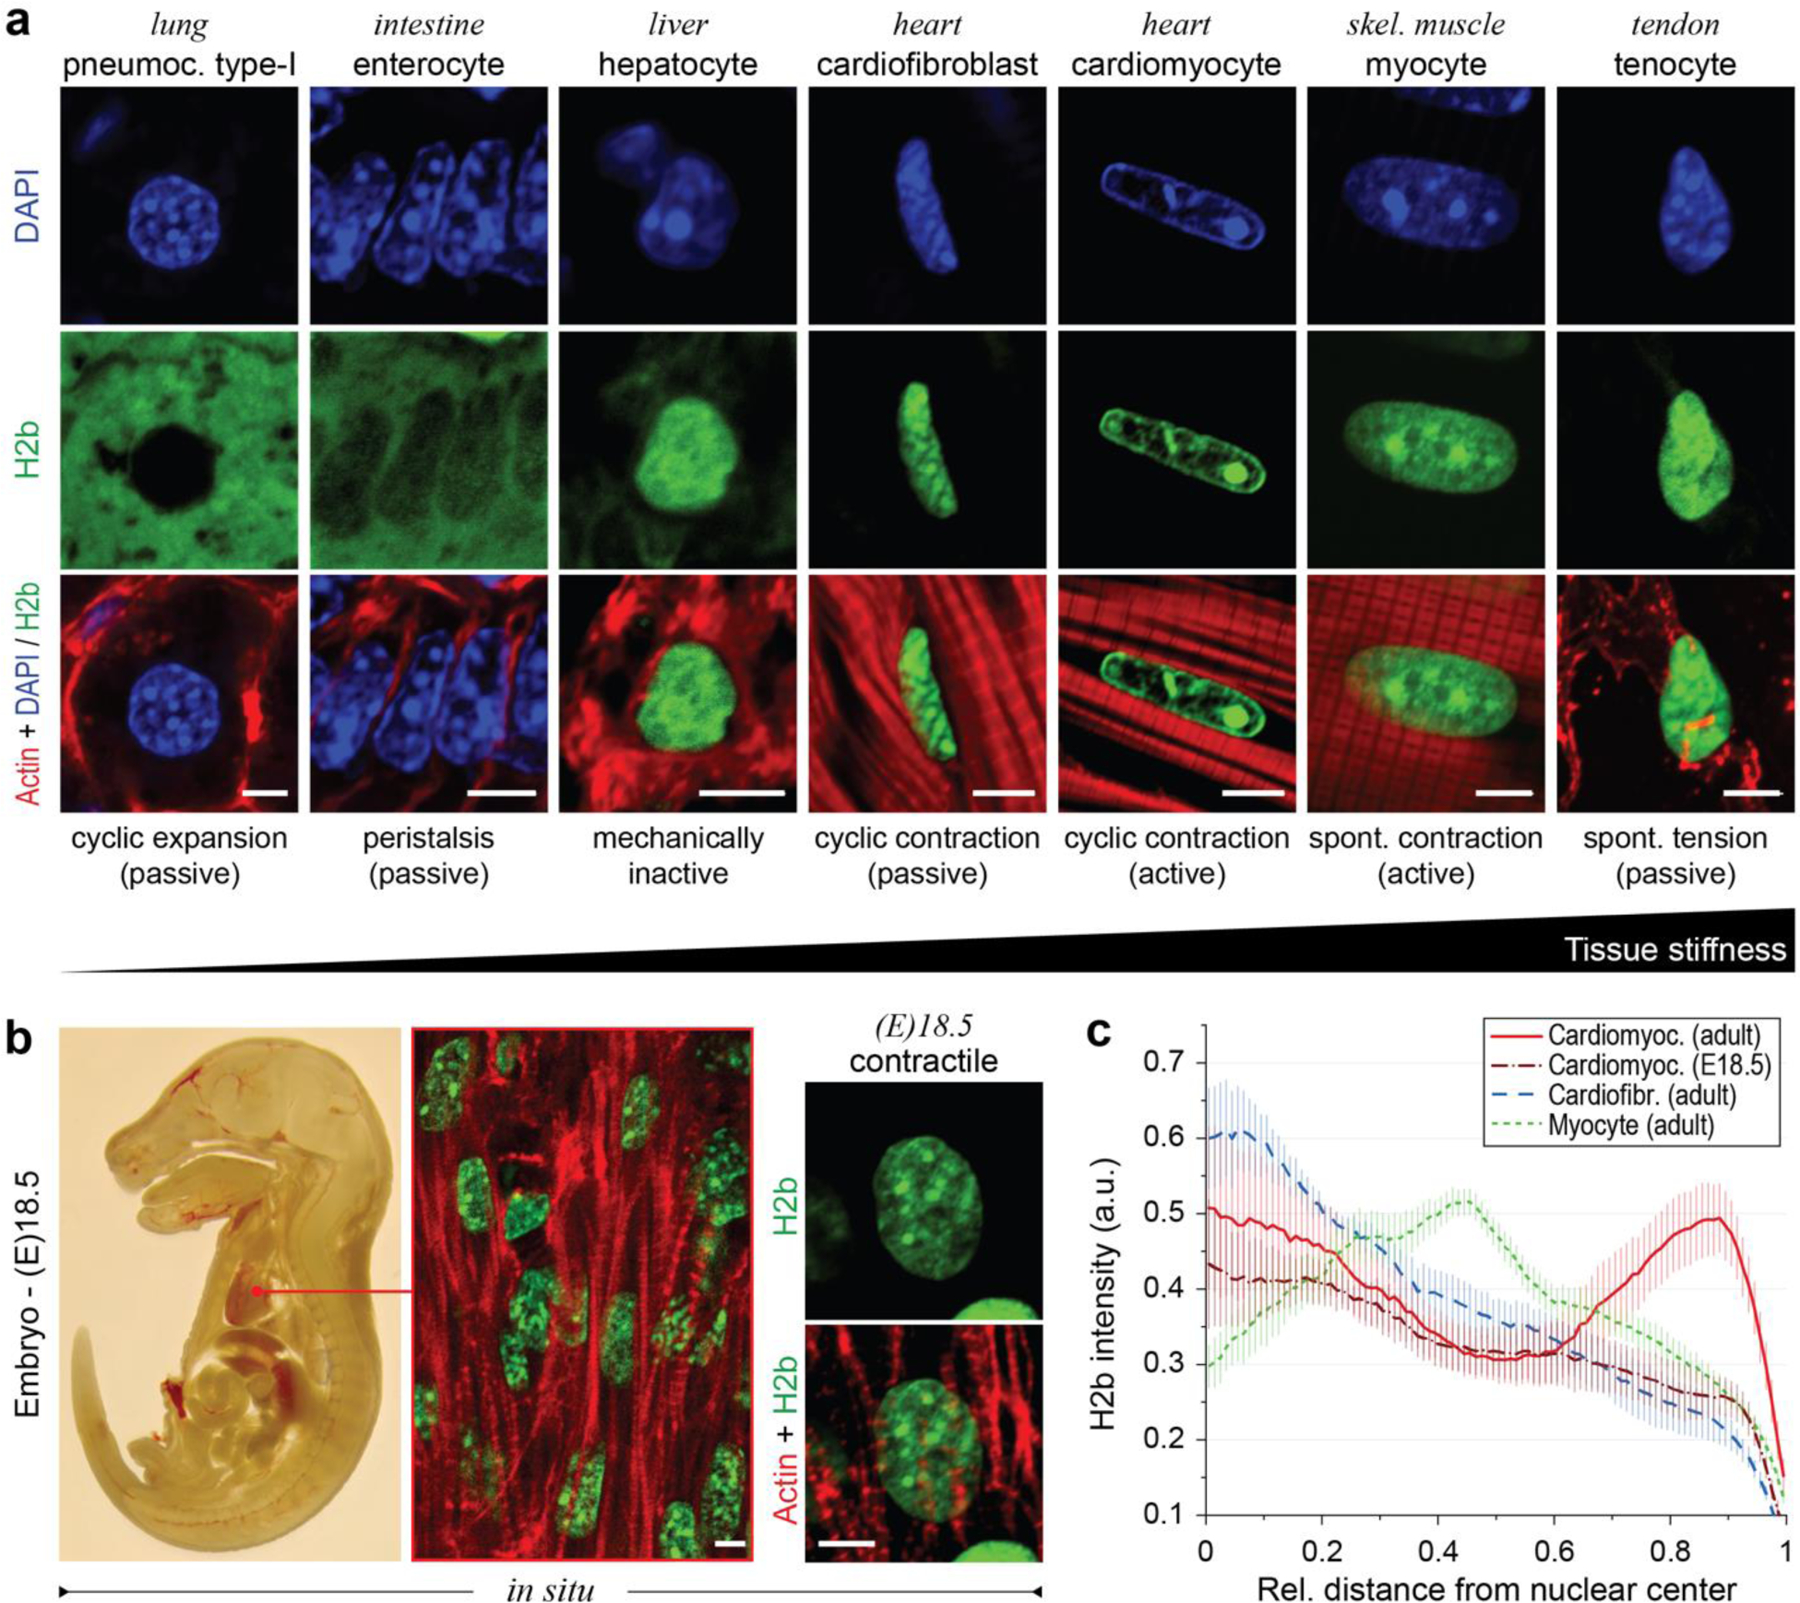
To study the relationships between the mechanical properties of cellular environments and chromatin organization, we analyzed the nucleus of cells in tissues that undergo a broad range of mechanical challenges in adult mice that expressed H2b-eGFP (Fig. 1a)32. In general, all cell types investigated showed distinct nuclear architectures. In particular, nuclei of CMs had an elongated morphology with a prominent, ring-like accumulation of chromatin at the nuclear border and inner cavities that appeared almost void of chromatin. Myocytes, which share functional similarities, and cardiofibroblasts (CF), which share a common mechanical environment to CMs, had a similar elongated nuclear morphology but showed a homogeneous distribution of chromatin throughout the nucleus. Analysis of late stage (day 18.5) embryonic hearts revealed that the nuclear architecture observed in adult CMs was not present in embryonic CMs. Embryonic CMs showed a more rounded morphology and a homogenous distribution of chromatin with no distinct accumulation of heterochromatin at the nuclear periphery (Fig. 1b).
Fig. 1: Cardiomyocytes (CMs) adopt a distinct nuclear architecture during development with high amounts of peripheral chromatin.
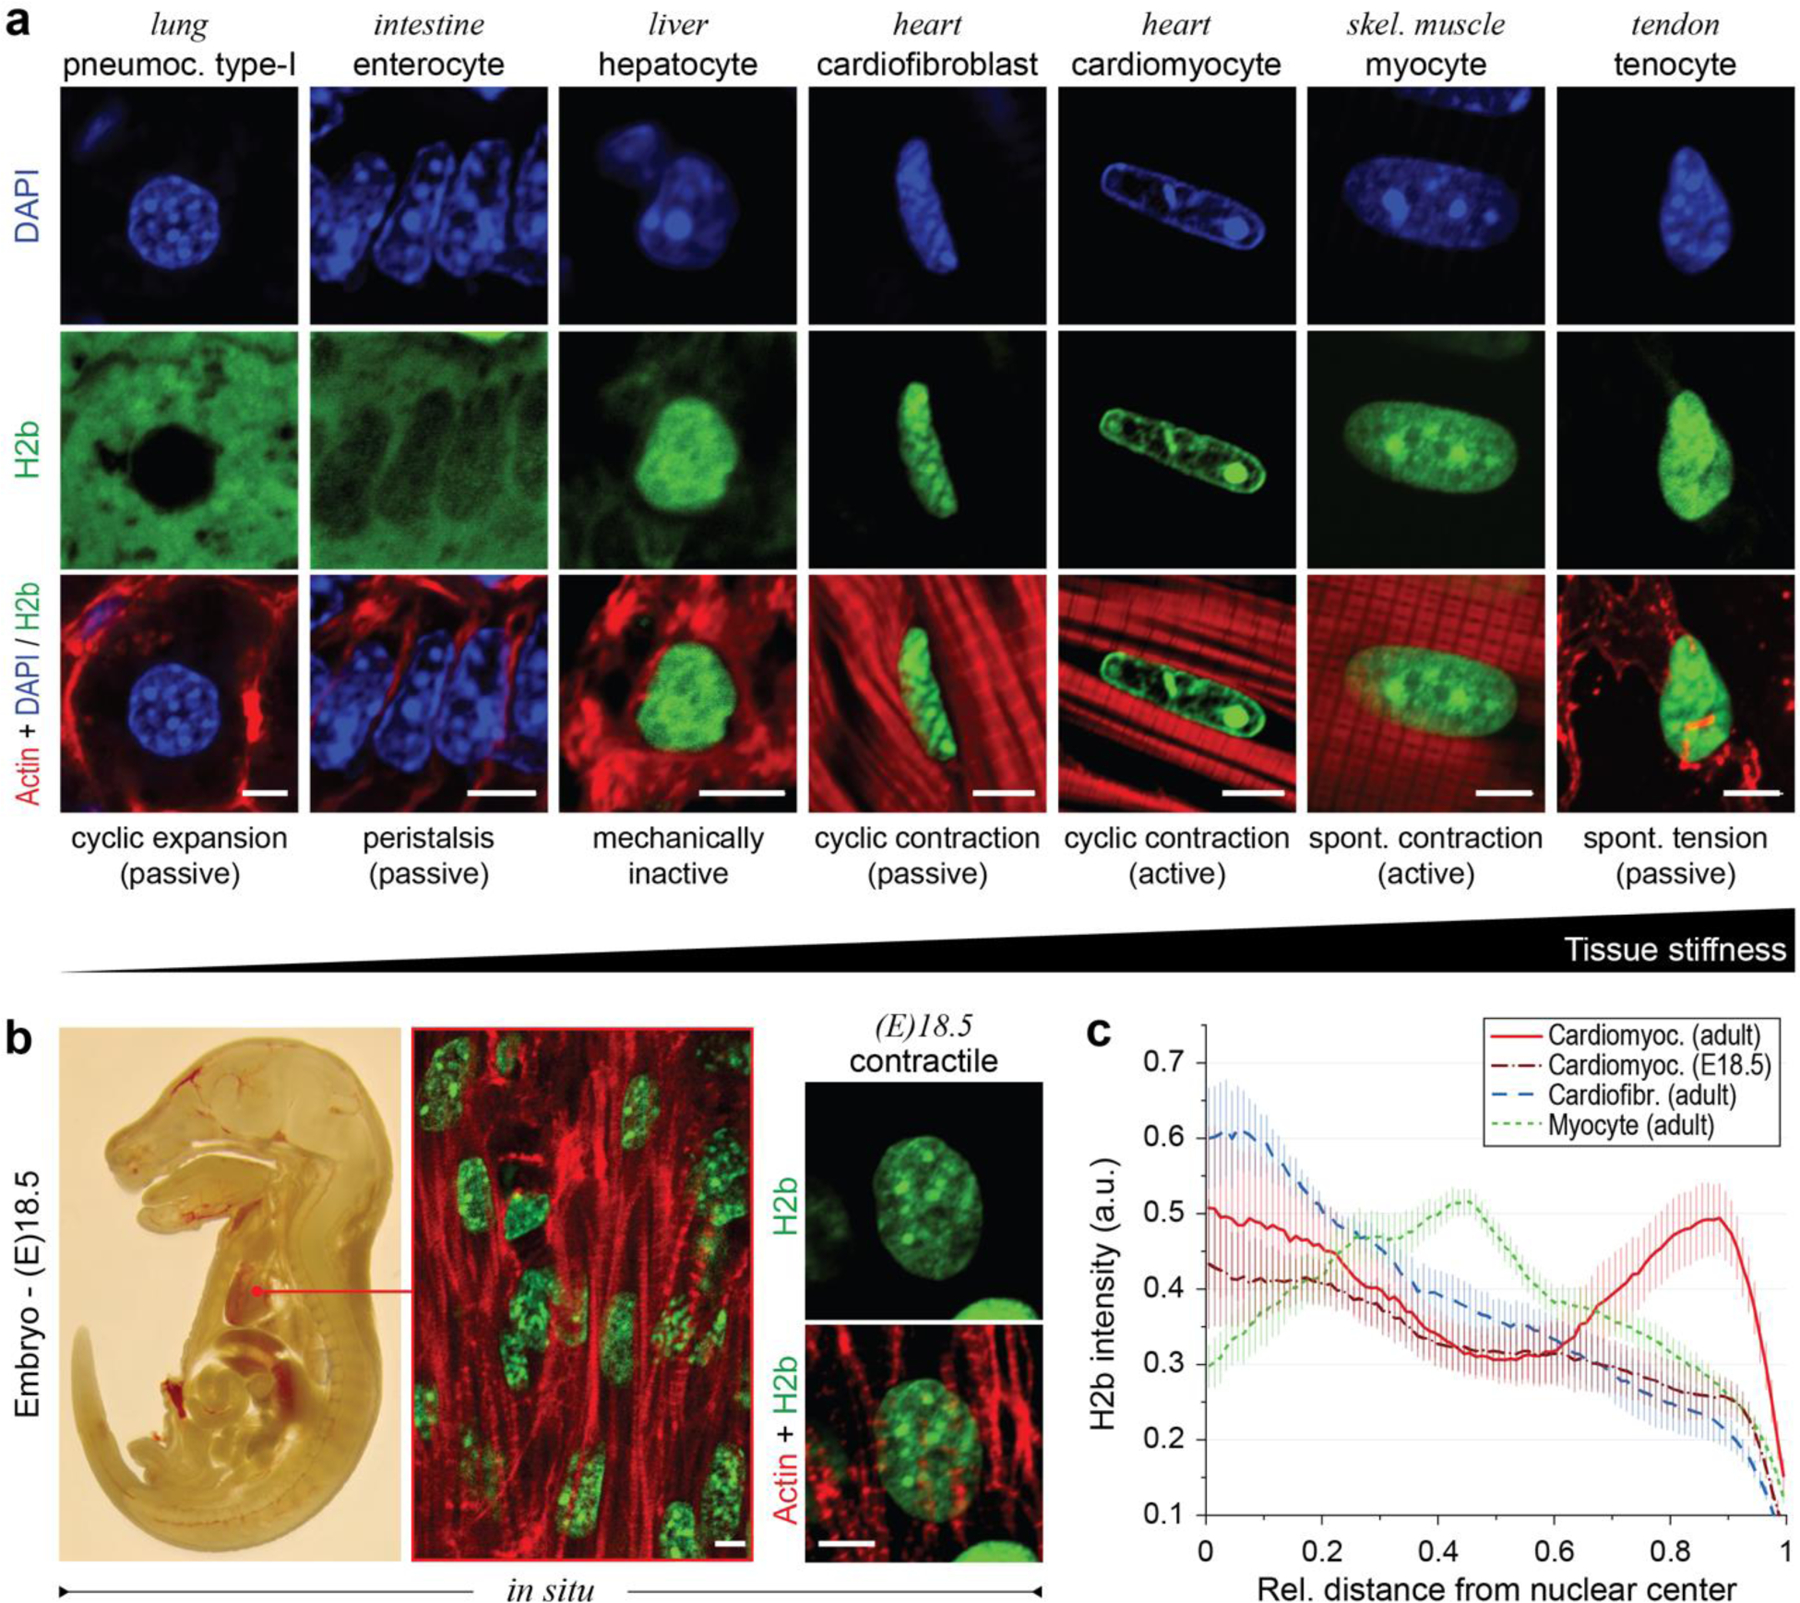
a) Tissues with diverse mechanical characteristics were harvested from adult H2b-eGFP mice and stained for actin. DAPI was used as DNA counterstain for soft tissues with weak GFP fluorescence. b) H2b-eGFP mice embryos were harvested at day 18.5, sectioned and stained for actin. Left: whole embryo mid-section. Middle: close-up of embryonic heart. Right: close-up of an embryonic CM nucleus, which showed a diffuse nuclear organization unlike adult CMs in (a). c) H2b intensity was analyzed with respect to its relative distance to the nuclear center (1=periphery) in nuclei of different cell types in situ. Adult CMs showed a high ratio of peripheral chromatin compared to other cell types. n=5; all scales=5 µm.
Peripheral accumulation of chromatin is often a hallmark of differentiated cells28. Quantification of chromatin intensities (H2b-eGFP) over the relative distance to the nuclear center further verified that peripheral chromatin accumulation was particularly prominent in adult CMs (Fig. 1c). In contrast, radial chromatin distribution of embryonic CMs was more similar to that of adult CFs. These results suggested that the adult nuclear phenotype may form postnatally or late in embryonic development when a sudden increase in cardiac activity triggers CM maturation33.
CM Chromatin Reorganization Can be Recapitulated in Embryonic CMs In Vitro
To investigate chromatin reorganization in CMs during development, we established an in vitro model to culture embryonic CMs on substrates with different mechanical properties. Previous studies reported that embryonic CMs differentiate best on substrates that match adult cardiac stiffness of 12 ± 4 kPa29–31. We extracted cells from embryonic hearts of H2b-eGFP mice and plated them on soft (13 kPa) PDMS substrates coated with basement membrane proteins to mimic the mechanical environment of adult hearts (Fig. 2a)29,30,34. Embryonic cardiac cells were isolated using an optimized mixture of ECM-specific peptidases (see methods for details) that we developed to achieve high CM viability compared to existing tryptic methods35. The resulting cardiac co-culture grew in connected clusters and contained a high percentage (61%) of contractile CMs as assessed by the formation of myofibrils (Fig. 2b and Extended Fig. 1). During the four-day culture period on soft PDMS, the CM ratio stayed roughly constant and CM contractions increased in frequency and became more synchronized (Fig. 2c, Extended Fig. 2a, b). In contrast, embryonic cardiac cells plated on stiff (140 kPa) PDMS showed a decline of contractile CMs, reduction in contraction frequency and synchronization, and decreased expression of CM transcription factors and structural markers after four days (Fig. 2g, top). Notably, aforementioned CM measurements were still similar between soft and stiff substrates on day two.
Fig. 2: Culture of CMs in vitro recapitulates the in vivo phenotype, and further shows that substrate stiffness disrupts nuclear organization and the expression of histones and histone modifying enzymes.
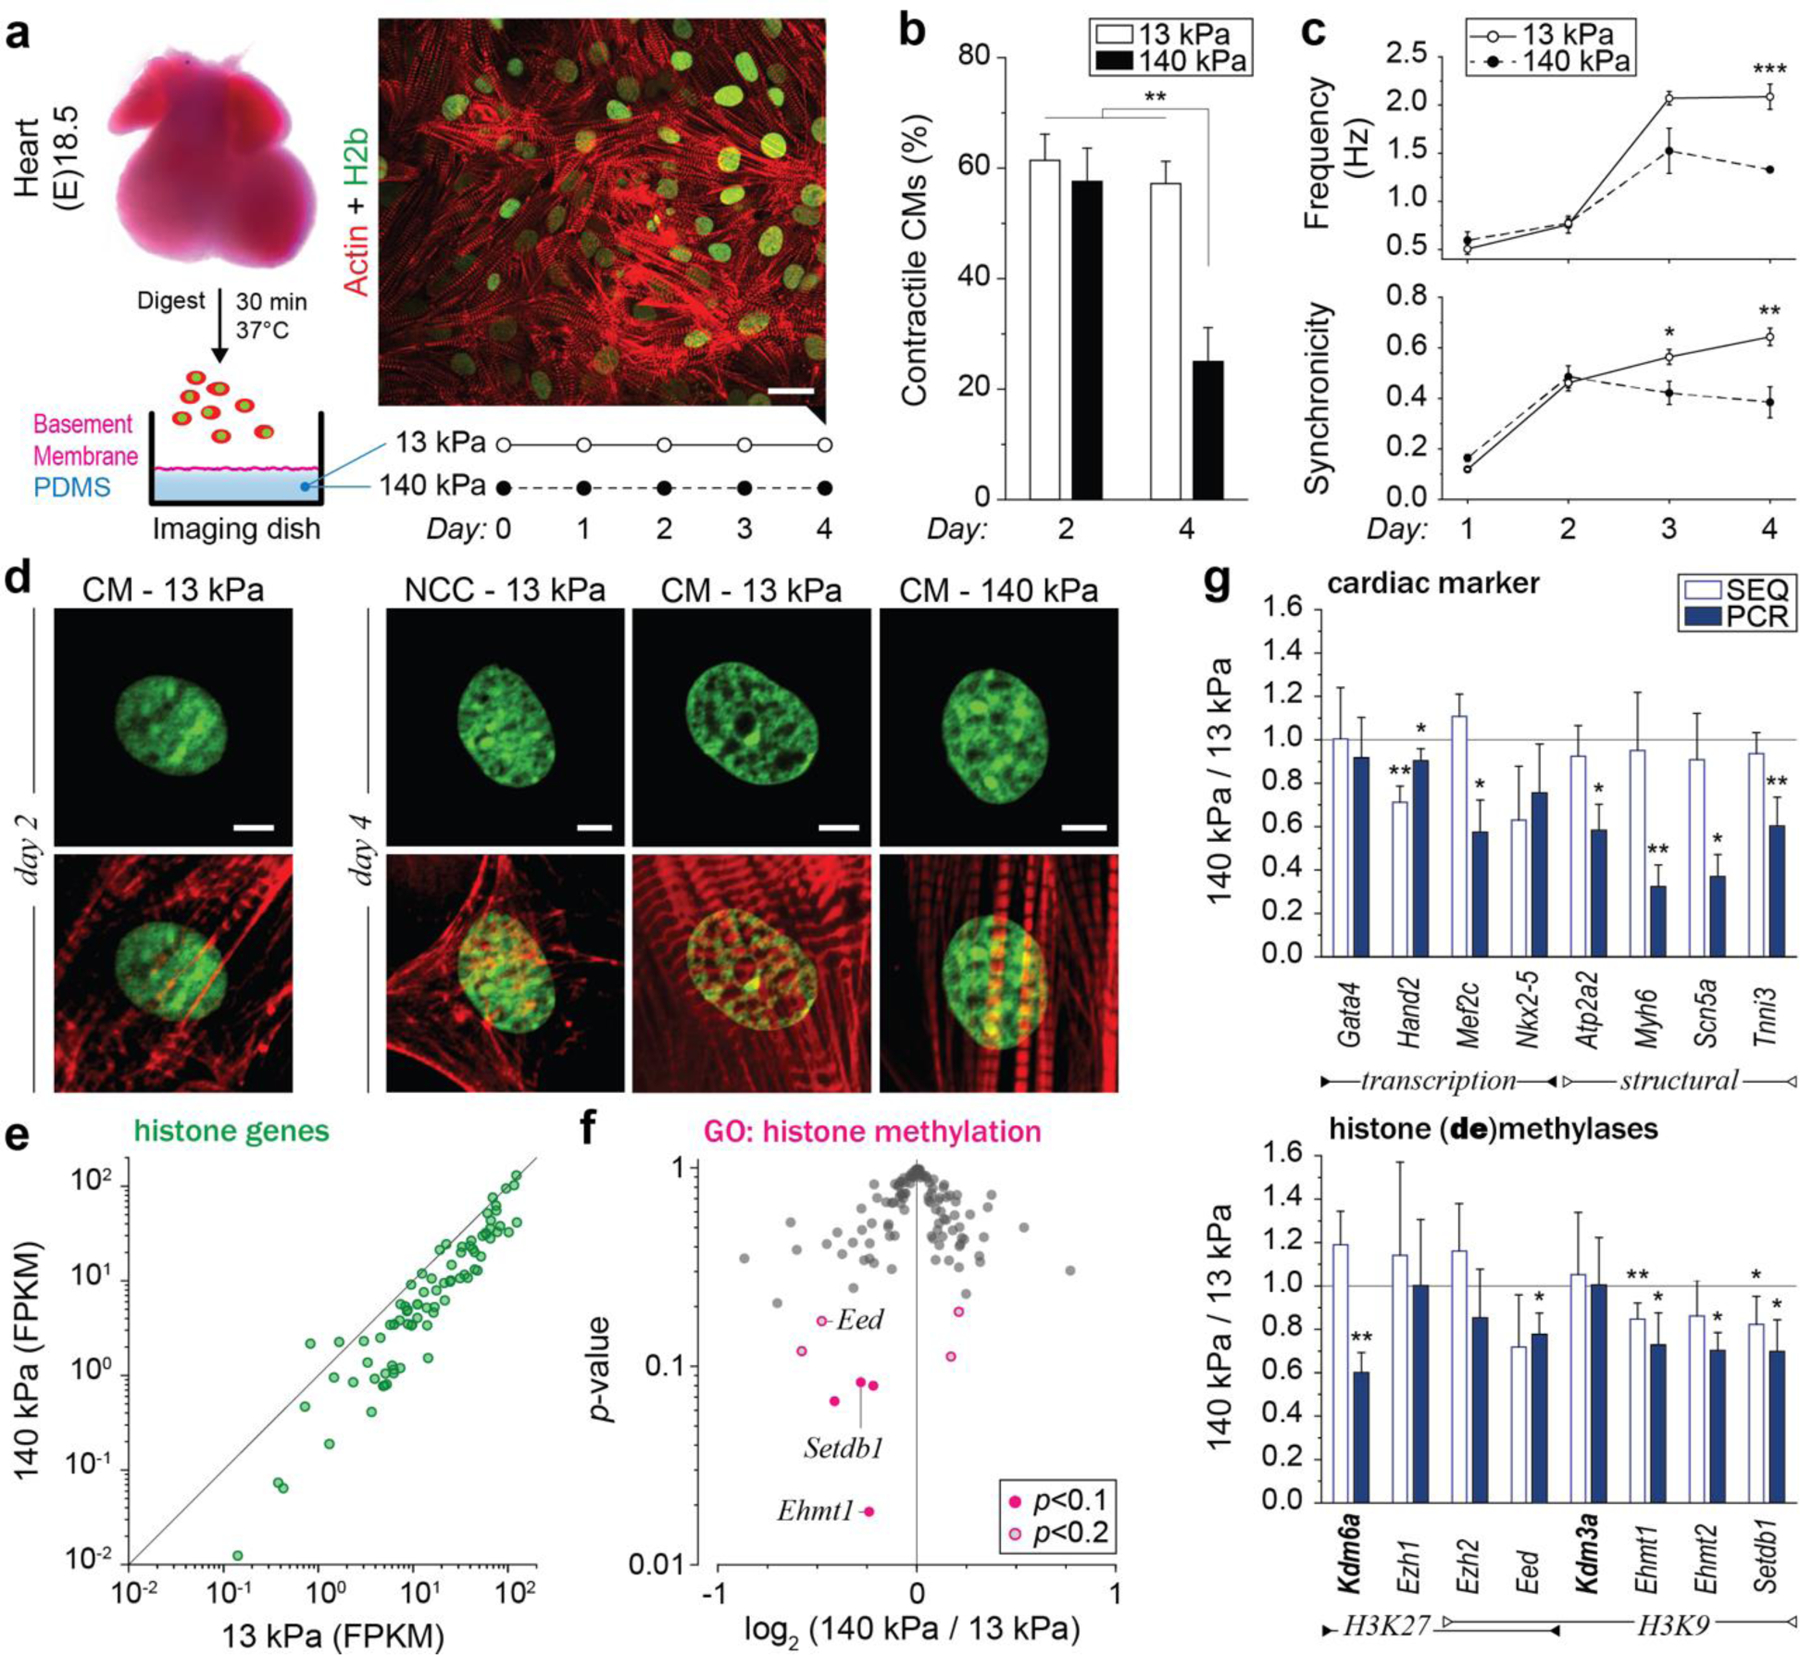
a) A warm digestion protocol was established using ECM-specific peptidases to isolate cells from (E)18.5 H2b-eGFP embryo hearts with high ratios of CMs. Cardiac cells were cultured on soft (13 kPa, shown) or stiff (140 kPa) Geltrex-coated PDMS substrates; scale=20 µm. b) After two and four days, cultures were stained for actin and the ratio of CMs with contractile myofibrils to non-contractile cells (NCC) was determined. The percentage of contractile CMs was significantly reduced after four days on stiff substrates compared to soft. SEM, n=9 from 3 exp., 2W-ANOVA: ** p<0.01. c) CMs were stained with Fluo-4 to analyze Ca2+-signaling. Cells on stiff substrates showed reduced frequency and synchronicity after 4 days in culture compared to cells on soft. d) Embryonic CMs with contractile myofibrils showed a change in nuclear organization at day four while non-contractile cells or CMs on stiff substrates do not; scales=5 µm. e) Total RNA was collected after four days of culture. RNAseq analysis revealed that most of the 82 expressed histone genes were downregulated on stiff PDMS. n=4; FPKM: Fragments Per Kilobase of transcript per Million mapped reads. f) Volcano plot of genes associated with the gene ontology term histone methylation (GO:0016571) as determined by RNAseq. Indicated are genes coding for H3K9 methylases, which were amongst the most significantly altered. g) PCR validation of RNAseq (SEQ) data verified downregulation of H3K9 methylating genes and showed that cardiac transcription and structural marker were decreased on stiff substrates. H3K9 demethylase Kdm3a and H3K27-specific methylase Ezh1 showed no change while H3K27 demethylase Kdm6a was downregulated. SD; n=4; T-test (HM=1): * p<0.05, ** p<0.01.
After two days in culture, chromatin organization in CMs on soft PDMS still appeared diffuse with no distinctive accumulation of heterochromatin at the nuclear border (Fig. 2d). However, after four days, cells exhibited intranuclear cavities devoid of chromatin and an overall shift of chromatin towards the nuclear periphery similar to adult CMs. Importantly, non-contractile cells (NCC) present in the co-culture continued to display a diffuse nuclear architecture more similar to adult CFs. In contrast to soft substrates, chromatin organization of CMs on stiff substrates still appeared mostly homogenous with no distinct reorganization towards the nuclear border, which is quantitatively confirmed later. These results suggested that the observed reorganization of chromatin during CM maturation could be recapitulated in vitro and that this reorganization can be disrupted by increasing the stiffness of the environment compared to the native heart stiffness.
Substrate Stiffness Affects Histone and Epigenetic Enzyme Expression In Vitro
Next, we used our in vitro model to screen for gene expression changes related to chromatin remodeling. Because stiff environments prevented the reorganization of chromatin in CMs, we performed a comparative RNAseq analysis between cardiac cells plated on either soft (13 kPa) or stiff (140 kPa) PDMS for four days. Most notably, the expression of most histone-coding genes was reduced on stiff substrates (Fig. 2e, Extended Table 1). The expression of replication-dependent canonical histones was particularly reduced across all histone families, which indicated inhibited cell proliferation on stiff substrates as previously reported (Extended Fig. 2c)31. We also observed downregulation of H1, H2a and H3 histone variants that replace canonical histones independent of replication and play a regulatory role in cell differentiation. H136 and H2a37 variants have been implicated in the reprogramming of pluripotent stem cells and H3 variants have been shown to play a role in neuronal development38 and cardiac hypertrophy39. Hence, this change of histone variant expression in stiff environments provided further evidence that mechanical environments can influence chromatin organization.
Pathway analysis of differentially expressed genes (p<0.02) identified several signal transduction pathways involved in cell differentiation and cardiac signaling (Extended Table 2). Functional network grouping further revealed a network that linked cell-ECM and intracellular mechanosensation pathways to MAPK (Extended Fig. 2d), an important pathway for cardiac development40 and epigenetic regulation41, and a potential regulator for chromatin organization42. Gene ontology (GO) term enrichment analysis of differentially expressed (p<0.2) genes with the parent GO term histone modification (GO:0016570) revealed the child GO terms histone methylation (GO:0016571) and histone acetylation (GO:0016573) as significantly enriched (p=1.30E-9, p=5.50E-6). Genes coding for H3K9 methylases (aka methyltransferases) Ehmt1 and Setdb1 were among the most downregulated on stiff substrates (Fig. 2f, Extended Table 3). RT-qPCR analysis validated the downregulation of H3K9 methylases, while no change in the expression of H3K9 demethylase Kdm3a was observed (Fig. 2g, bottom). This is of significance, because trimethylation of H3K9 is associated with gene repression and chromatin condensation43, and has shown to be crucial during cardiac development44 and maintenance4.
In addition, we found changes in expression of proteins involved in the methylation of H3K27 (Extended Table 3). Similar to H3K9, methylation of H3K27 is associated with gene repression and heterochromatin formation43; however, it is reported to have an inverse function during cardiac development and reduction of H3K27 methylation is crucial during cardiac differentiation45. In accordance, qPCR data showed that H3K27 demethylase Kdm6a was downregulated, while H3K27 methylases Ezh1 and Ezh2 remained similarly expressed on stiff PDMS.
H3K9 and H3K27 Trimethylated Chromatin Shows Opposing Patterns of Reorganization Between Contractile CMs and Non-Contractile Cells In Vitro
We further investigated whether changes in H3K9 and H3K27 methylation may be associated with changes in chromatin organization. First, we compared contractile CMs to non-contractile cells (NCCs) present in our in vitro co-culture since we already observed differences in their nuclear organization both in vivo and in vitro (see Fig. 1a and Fig. 2d). Immunostaining of embryonic H2b-eGFP cardiac cells on soft PDMS further revealed a distinct accumulation of H3K9me3-modified chromatin at the nuclear border of contractile CMs, while NCCs showed a homogenous distribution of H3K9me3 clusters throughout the nucleus (Fig. 3a, Extended Fig. 3).
Fig. 3: Culture of both contractile CMs and non-contractile cells in vitro show opposing enrichment of H3K9 and H3K27 trimethylated chromatin.
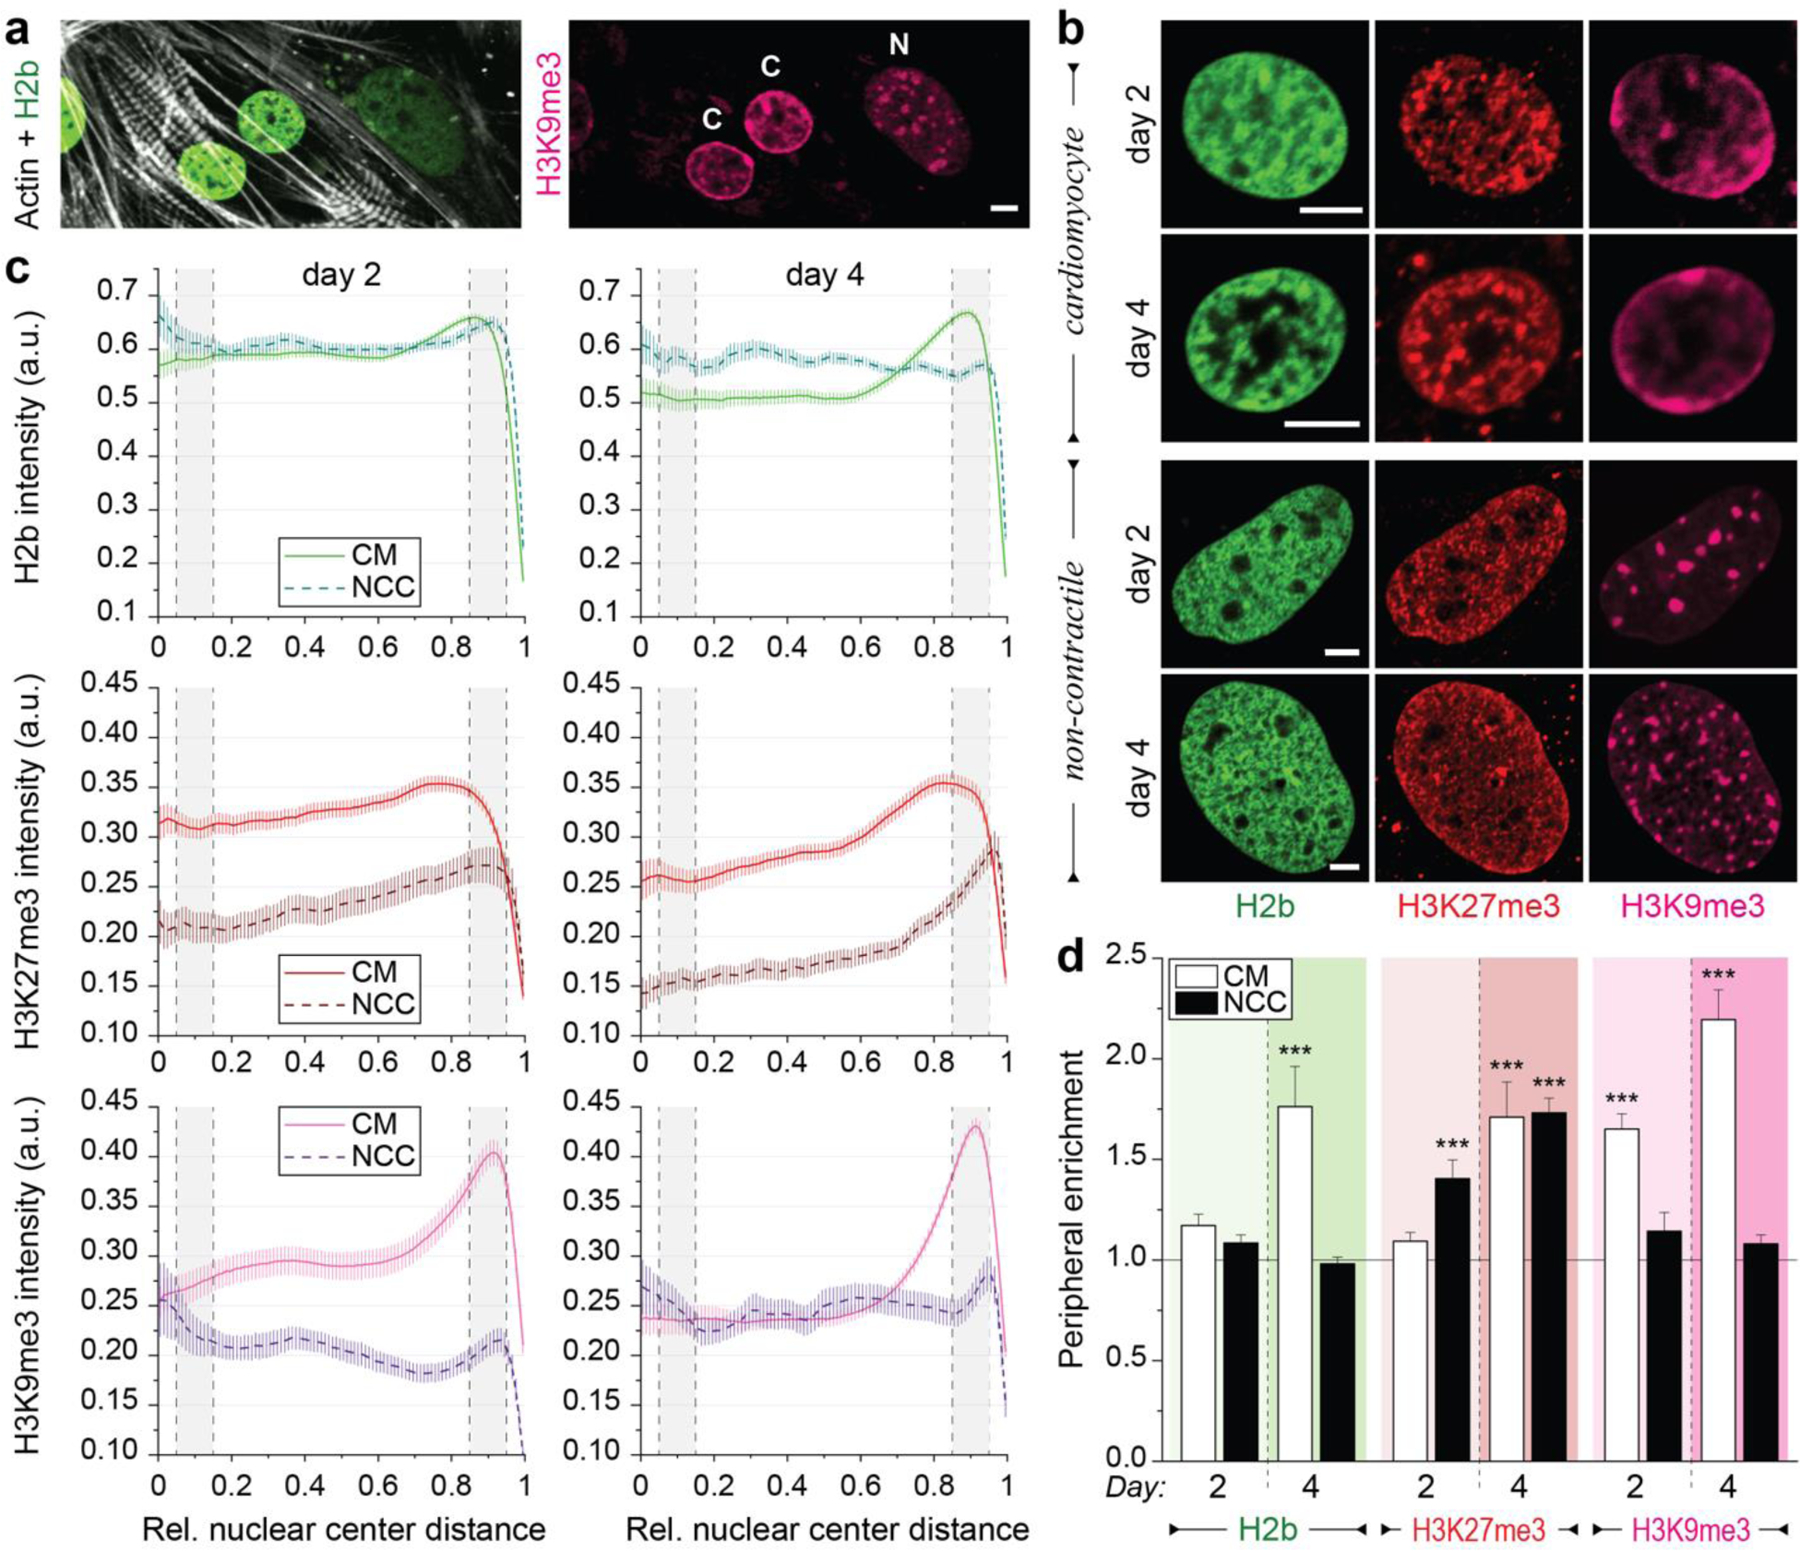
Embryonic cardiac cells were isolated from H2b-eGFP embryo hearts and cultured on soft (13 kPa) PDMS substrates. a) After two days in culture, contractile CMs (C) with distinct myofibrils showed peripheral accumulation of H3K9me3-modified chromatin while non-contractile cells (N) showed a homogenous distribution of H3K9me3 clusters. b) Cells were stained for H3K27me3 and H3K9me3 (and actin, Extended Fig. 3a) and images of nuclei from CMs or non-contractile cells (NCCs) were acquired at day two or four of culture. c) Stained nuclei were analyzed for peripheral enrichment of overall (H2b) or epigenetically marked chromatin. Intensity of each channel was analyzed with respect to its relative distance to the nuclear center (1=periphery). Gray areas indicate the center bin (0.05–0.15) and the peripheral bin (0.85–0.95) used to calculate enrichment scores. SEM; n>60 from 5 exp. d) Enrichment scores (marker intensity of the peripheral bin divided by the center bin) were calculated. CMs, but not non-contractile cells (NCC), displayed reorganization of chromatin towards the periphery at day four, which was preceded by enrichment of H3K9me3-marked chromatin at day two. SEM; n>60 from 5exp.; T-test (HM=1): *** p<0.001; all scales=5 µm.
To further quantify this, we analyzed spatial patterns of chromatin intensities with respect to the nuclear center (0=center, 1=periphery) as before and calculated a peripheral enrichment score as the ratio of the average intensity of the peripheral bin (0.85–0.95) divided by the center bin (0.05–0.15). CMs showed only minor peripheral accumulation of overall chromatin (H2b) after two days in culture (Fig. 3b-d). However, after four days, chromatin was significantly enriched at the nuclear border. In contrast, we observed a slight decrease in peripheral chromatin enrichment from day two compared to day four in NCCs, which verified our initial observations. Interestingly, H3K9me3-modified chromatin was significantly enriched at the nuclear border on day two already, when overall chromatin enrichment was not yet observed in CMs. Peripheral enrichment of H3K9me3 was further increased on day four in CMs, while no accumulation was observed in NCCs on either day. In turn, NCCs showed increased enrichment of H3K27me3-marked chromatin from day two to four. In CMs, peripheral enrichment of H3K27me3 occurred only on day four in conjunction with overall chromatin enrichment. Furthermore, patterns of H3K27 methylation closely matched that of overall chromatin in CMs. This suggested that enrichment of H3K27me3 mainly resulted from overall chromatin rearrangement in CMs, while in NCCs enrichment of H3K27me3 occurred in the absence of peripheral enrichment of overall chromatin.
Overall, these findings support the opposing roles of H3K9 and H3K27 methylation in CM development45 and provide further support for a link between chromatin organization and cell fate, as CMs and NCCs showed opposing patterns of enrichment for H3K9me3 and H3K27me3-marked chromatin. Moreover, they suggest that H3K9 trimethylations may play a role in chromatin reorganization during CM development, since peripheral accumulation of H3K9me3-marked chromatin preceded that of overall chromatin.
CM Chromatin Reorganization is Abrogated on Stiff Substrates In Vitro
To investigate whether peripheral accumulation of H3K9me3-modified chromatin is related to CM differentiation in vitro, we analyzed peripheral chromatin enrichment in embryonic CMs plated on soft (13 kPa) PDMS, stiff (140 kPa) PDMS, or tissue culture plastic (TCP, >1 GPa). Unexpectedly, CMs plated on stiff PDMS and TCP showed a higher enrichment of overall chromatin compared to cells on soft PDMS on day two (Fig. 4a-c). However, on day four, peripheral accumulation of overall chromatin decreased for CMs plated on stiff PDMS and TCP. Similarly, H3K9me3-marked chromatin was equally enriched for CMs on any substrate on day two. On day four, enrichment was significantly higher on soft PDMS compared to both stiffer substrates and higher for stiff PDMS compared to TCP. While there was no difference in enrichment on day two, overall H3K9me3 intensities were higher on softer substrates (Fig. 4b) in accordance with increased expression of H3K9 methylases observed on softer PDMS (see Fig. 2c). H3K27me3-marked chromatin was slightly more enriched for CMs on stiff PDMS on day two compared to cells on soft PDMS and TCP. After four days, peripheral accumulation of H3K27me3 was increased for CMs on all substrates and was highest in cells plated on the soft PDMS. However, enrichment of H3K27me3-marked chromatin was higher compared to overall chromatin on stiff substrates, similar to previous observations in NCCs (see Fig. 3).
Fig. 4: Peripheral enrichment of H3K9 trimethylated chromatin is inhibited in embryonic CMs cultured on stiff substrates in vitro.
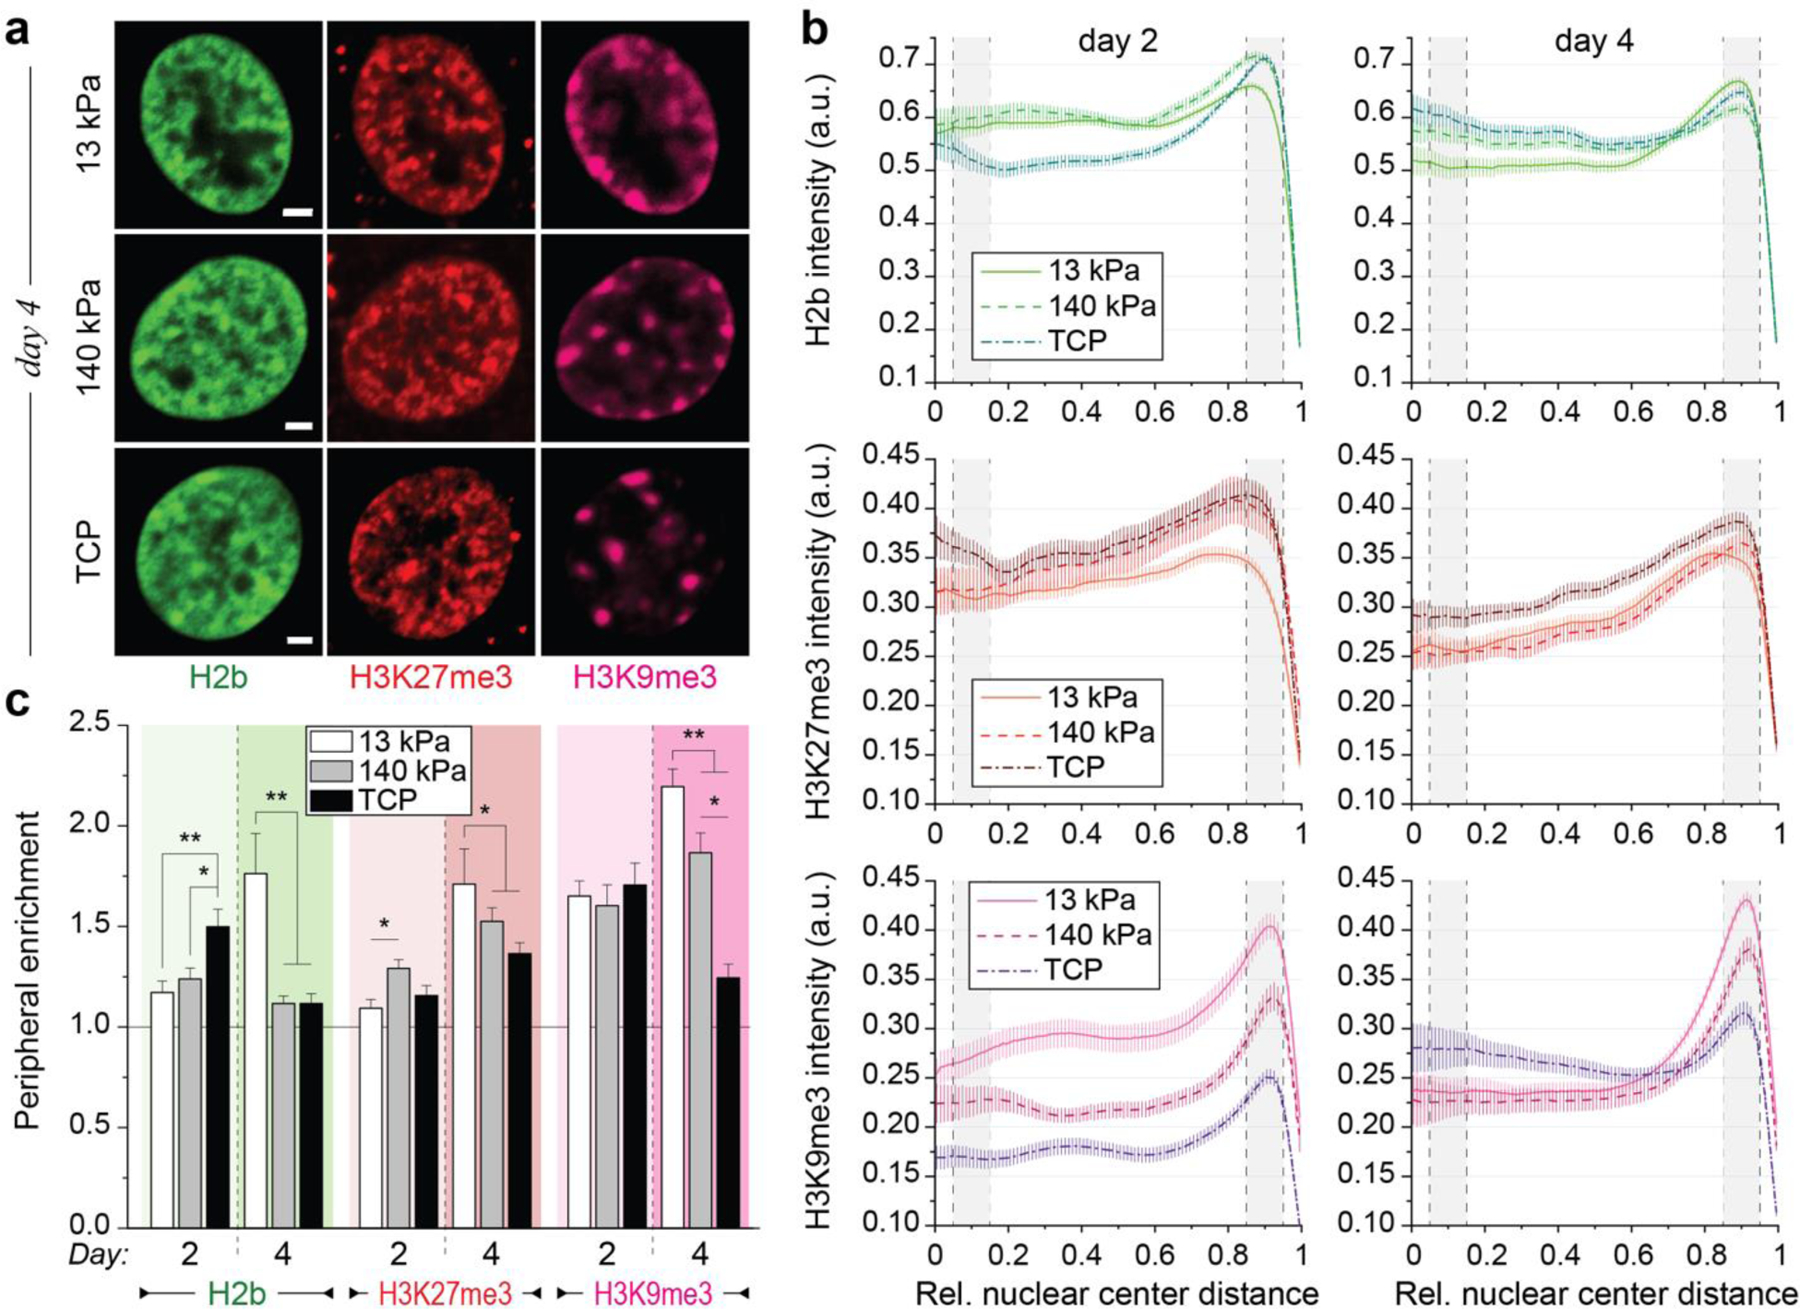
a) Isolated embryonic cardiac cells from H2b-eGFP mice were cultured on either soft (13 kPa) PDMS, stiff (140 kPa) PDMS or TCP for two or four days and stained for H3K27me3 and H3K9me3. Scales=5 µm b) Analysis of chromatin distribution with respect to nuclear center (1=periphery). Gray areas indicate center and peripheral bin. SEM; n≥60 from 5 exp. c) Enrichment scores for each chromatin marker (intensity quotient of peripheral bin and center bin). Enrichment of overall and H3K9me3-marked chromatin was abrogated on day four in cells plated on stiff PDMS and TCP compared to soft PDMS. Note: 13 kPa data same as CM data in Fig. 3d; SEM; n≥60 from 5 exp.; 1W-ANOVA: * p<0.05, ** p<0.01, *** p<0.001.
Substrate stiffness only moderately affected chromatin organization in NCCs. Peripheral enrichment remained low overall for H3K9me3-marked chromatin and high for H3K27me3-modified chromatin throughout the four-day culture period (Extended Fig. 4a-c). This suggested, that contractile CMs are more sensitive to substrate stiffness with regard to chromatin reorganization. Overall, these results show that mechanical properties of the cellular environment can influence the organization of chromatin and provide further support for a link between CM differentiation and H3K9me3-modified chromatin reorganization.
Adult CM Chromatin Organization is Abrogated in a Mouse Hypertrophy Model
Cardiac hypertrophy is associated with an increase in cardiac tissue stiffness, decrease in contractility and a loss of CM differentiation and function4,5. Because we found in vitro that stiff environments disrupt chromatin reorganization towards the mature CM phenotype, we investigated if cardiac hypertrophy in vivo resulted in the same disruption of chromatin architecture. We analyzed CM nuclei in mice that received angiotensin II (AngII) for 28 days to induce cardiac hypertrophy. Control mice received saline over the same period. Reduction in ejection fraction and fractional shortening during the treatment period confirmed cardiac performance decline in mice receiving AngII, but not saline (Fig. 5a, Extended Table 5). CM nuclei of hypertrophic mice showed reduced enrichment of overall (DAPI), H3K27me3 and H3K9me3-marked chromatin (Fig. 5b-d, Extended Fig. 5a), similar to CM nuclei cultured on stiff substrates in vitro. These results suggested that, in addition to guiding chromatin organization during development, mechanical environments also play a role in retaining CM nuclear architectures in adulthood.
Fig. 5: Peripheral enrichment of H3K9 trimethylated chromatin is abrogated in adult CMs in a mouse hypertrophy model and correlates with cardiac performance in human patients.
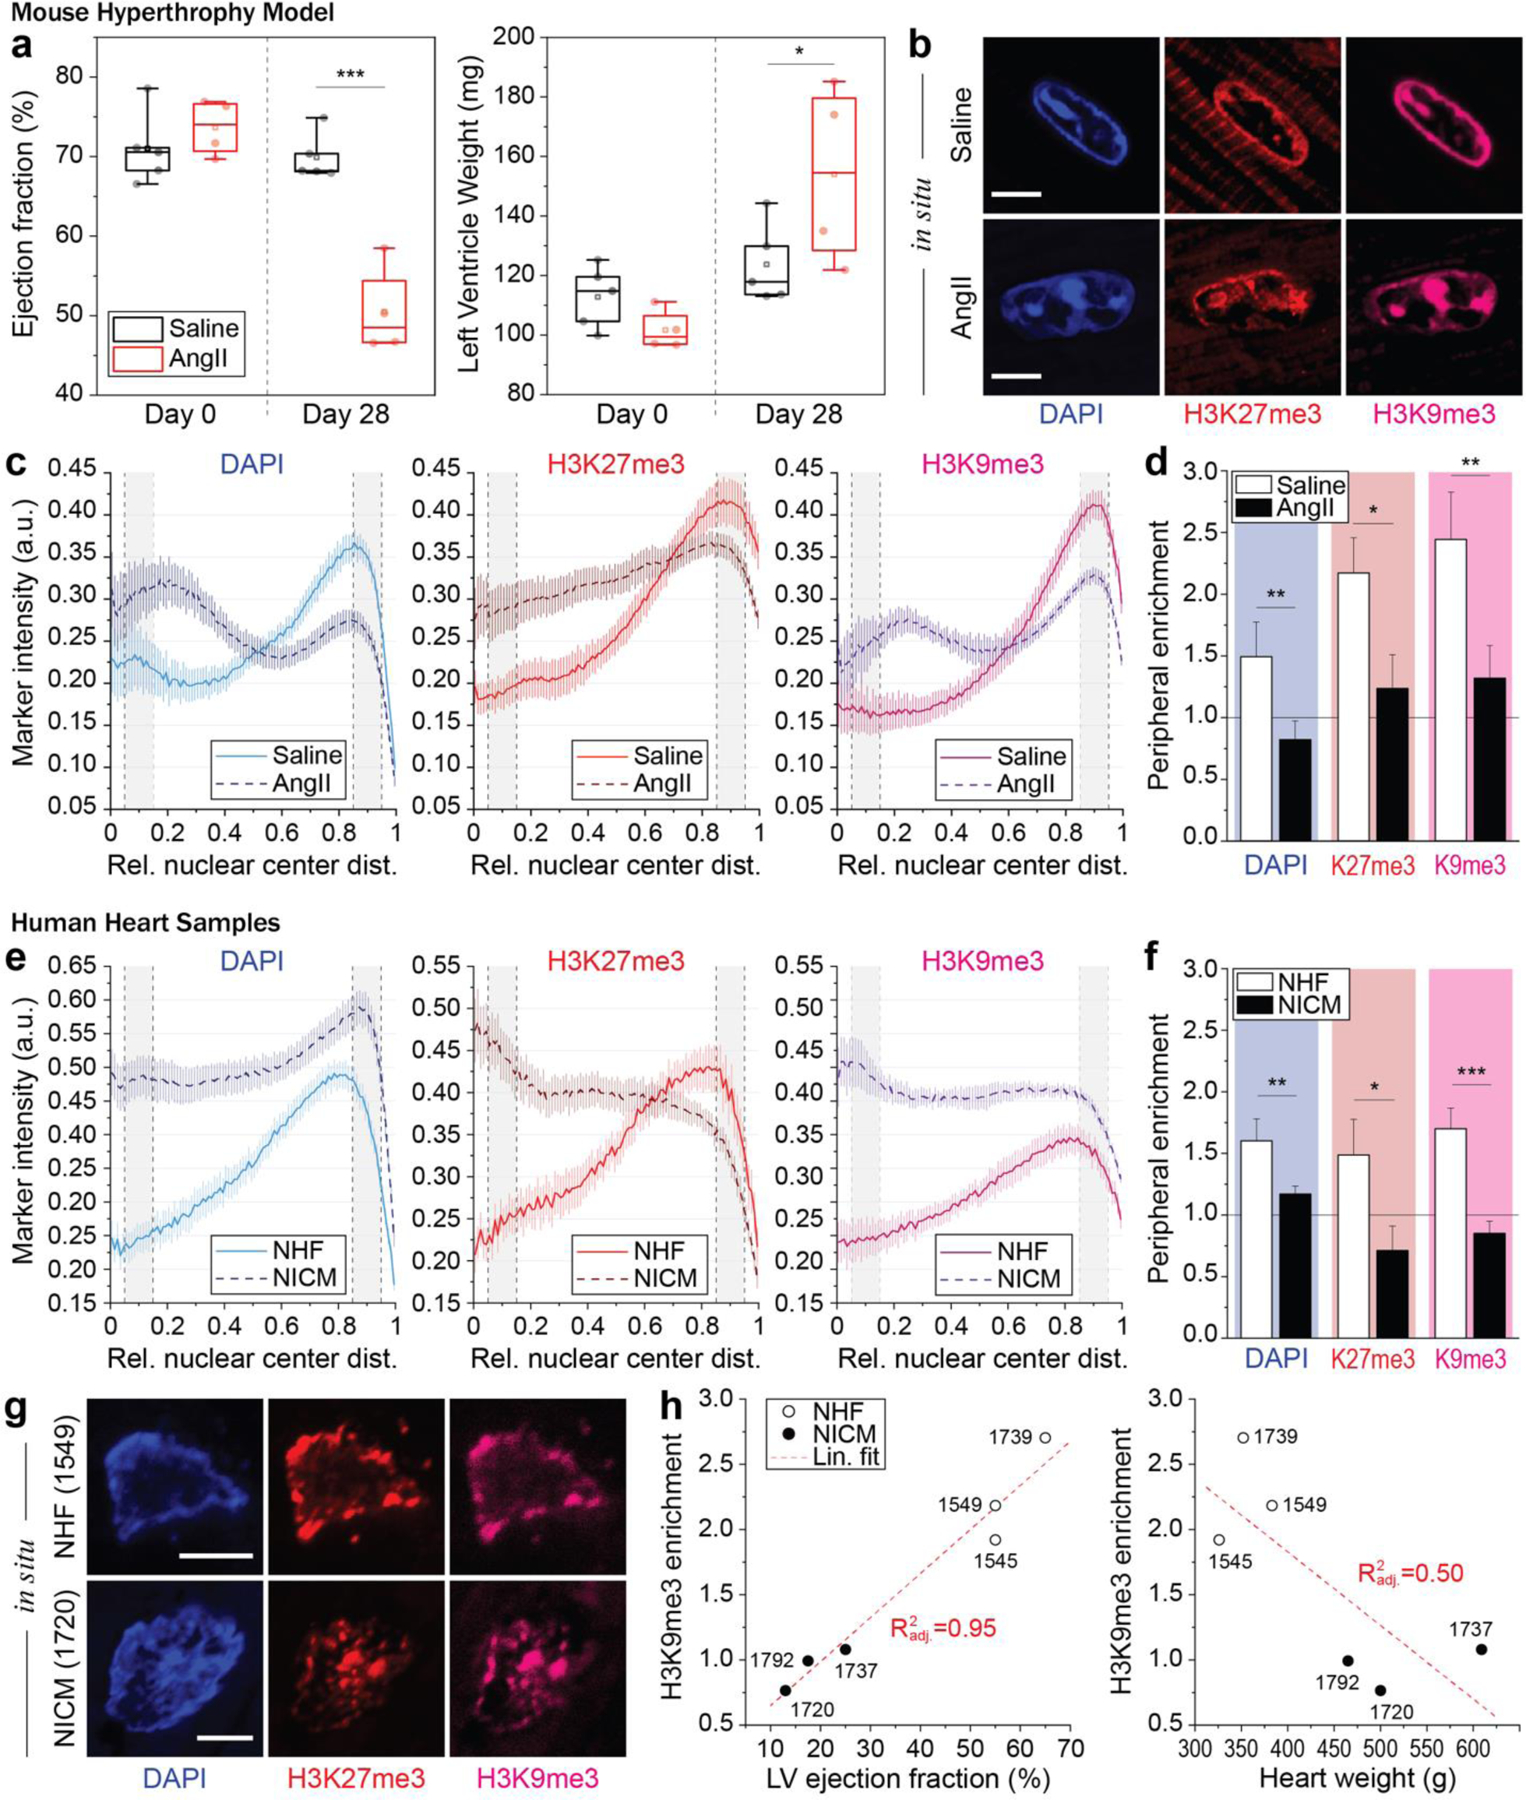
a) Mice were treated with angiotensin II (AngII, n=4) to induce cardiac hypertrophy. AngII receiving mice showed a reduction in heart performance (ejection fraction) and an increase in heart weight (left ventricle) after 28 days of treatment compared to day 0, while saline receiving control mice (n=5) showed no difference (see also Extended Table 5); 2W-ANOVA: * p<0.05, *** p<0.001. b) After 28 days, hearts were harvested and stained for H3K27me3 and H3K9me3. DAPI was used as DNA counterstain. c, d) Immunostained cardiac sections of hypertrophic (AngII) or control mice (Saline) were analyzed for peripheral enrichment of overall (DAPI) or epigenetically marked chromatin and enrichment scores were calculated. Enrichment of overall and methylated chromatin was abrogated in cardiac nuclei of hypertrophic mice. SEM; n≥40 from 4 (AngII) or 5 (saline) exp.; T-test: * p<0.05, ** p<0.01; all scales=5 µm. e-g) Human heart samples from patient suffering from either nonischemic cardiomyopathy (NICM, n=3), or control patients with no heart failure (NHF, n=3), were stained for overall chromatin (DAPI), as well as H3K9 and H3K27 trimethylated chromatin. Peripheral enrichment of all markers was markedly reduced in NICM patients, compared to control patients. T-test: * p<0.05, ** p<0.01, *** p<0.001. h) Peripheral enrichment scores were correlated with indicators of cardiac health, with peripheral enrichment of H3K9me3 and ejection fraction showing the highest adjusted correlation coefficient. LV=left ventricle.
Peripheral Chromatin Enrichment is Correlated with Heart Performance in Human Patients
We next explored whether the relation of CM chromatin organization and heart performance found in mice was also observed in human patients. We analyzed peripheral enrichment of overall (DAPI), H3K27me3 and H3K9me3-marked chromatin in transmural cardiac samples of patients suffering from nonischemic cardiomyopathy (NICM) or age-matched patients with no heart failure (NHF) as control (Extended Table 6). NICM patients showed a decrease in the volume of blood pumped (ejection fraction), increased heart weight and increased collagen deposition (Extended Fig. 5b), which is indicative of cardiac remodeling46,47. Due to the de- and rehydration for histology preservation and processing of cardiac samples, the tissue tended to shrink, resulting in crumbled nuclei, and was generally more difficult to stain. CM nuclei of NICM showed distinct trends of reduced enrichment of all chromatin markers (Fig. 5e-g) as observed in mice. Moreover, enrichment showed linear trends with indicators of cardiac health, with the strongest correlation being observed between enrichment of H3K9me3 and left ventricle ejection fraction (Fig. 5h, Extended Fig. 5c). In addition to supporting previous results in mice, these results further suggested that chromatin organization may be indicative of cardiac health in adults and could therefore have potential diagnostic or prognostic value.
Stiffened Substrates Reduce CM Contractility and Nuclear Deformation
Because we found that the microenvironment in vitro and in vivo influenced the chromatin architecture of CMs, we asked whether the nucleus, at least in part, integrates mechanical cues from its environment via its physical connection to the cytoskeleton. It has been shown before29 that stiffening of the environment inhibits contractility, first through increased resistance of the substrate and later by remodeling of the contractile apparatus and signaling cascades. We confirmed this observation through multiple experiments in vivo and in vitro. Hypertrophic mice showed a reduction in fractional shortening and, more indirectly, both mice and humans patients showed reduced ejection fractions (Extended Table 5 and 6). In vitro, we observed reduced frequency and synchronicity on stiff substrates (Fig. 2c). By recording fluorescently tagged α-actinin during CM contractions, we further confirmed that overall sarcomere (S) and A-band (A) shortening were reduced by more than half, while Z-disks (Z) went from extending to shortening in CMs plated on stiff compared to soft substrates (Extended Fig. 6a-c, Videos 1-3). In accordance with abrogated Z-disk extension, stretch-induced tyrosine-410 phosphorylation of p130Cas48, a mechanosensitive focal adhesion protein49 found within Z-disk lattice in CMs50, was reduced on stiff PDMS as well (Extended Fig. 2e). Along with the changes in the cytoskeleton and cell contraction, we analyzed nuclear motion in more detail and observed that bulk linear strain and translational movement of nuclei were reduced in CMs plated on stiff PDMS and TCP, compared to soft PDMS, over the four-day culture period (Extended Fig. 6d). Therefore, changes in substrate mechanics might be conveyed through changes in nuclear deformation via the cytoskeleton.
H3K9 Trimethylated Chromatin is Colocalized with Myofibrils in Embryonic CMs
We further analyzed intranuclear movement during CM contractions and observed that dense, H3K9me3-rich heterochromatin clusters had higher translational movement compared to the overall nucleus (Extended Fig. 6f). To investigate whether there is a direct association of H3K9me3-marked chromatin with myofibrils, we quantified the relative overlap of different chromatin markers with myofibrils in CMs cultured for four days on soft PDMS. In addition to H3K9me3 and actin, cells were stained for serine-2 phosphorylated RNA-polymerase II (RPIIS2) as a control (Fig. 6a) since actively transcribed chromatin51 is expected to be exclusive with suppressed H3K9me3-modified chromatin. Z-stacks of stained CMs were acquired and basal Z-slices, where myofibrils were primarily located in our in vitro cultures (Extended Fig. 7), were analyzed for marker overlap. A marker colocalization score was calculated by determining the number of overlapping pixels between two binarized marker channels and dividing it by the number of pixels that would overlap by chance (1 = colocalization by chance). H3K9me3-marked chromatin showed a higher than chance association with actin containing I-bands, while overall (H2b) and actively transcribed chromatin had lower than chance co-localization scores (Fig. 6b). The low association with overall chromatin is likely an effect of actin pushing chromatin out of the z-plane (Extended Fig. 7a). As expected, transcribed chromatin areas had a high coincidence score for overall chromatin, but a low score for H3K9me3 while the association of overall chromatin with H3K9me3 did not significantly deviate from chance (p=0.165).
Fig. 6: Colocalization of H3K9 trimethylated chromatin with actin and emerin is abrogated in CMs on stiff substrates in vitro.
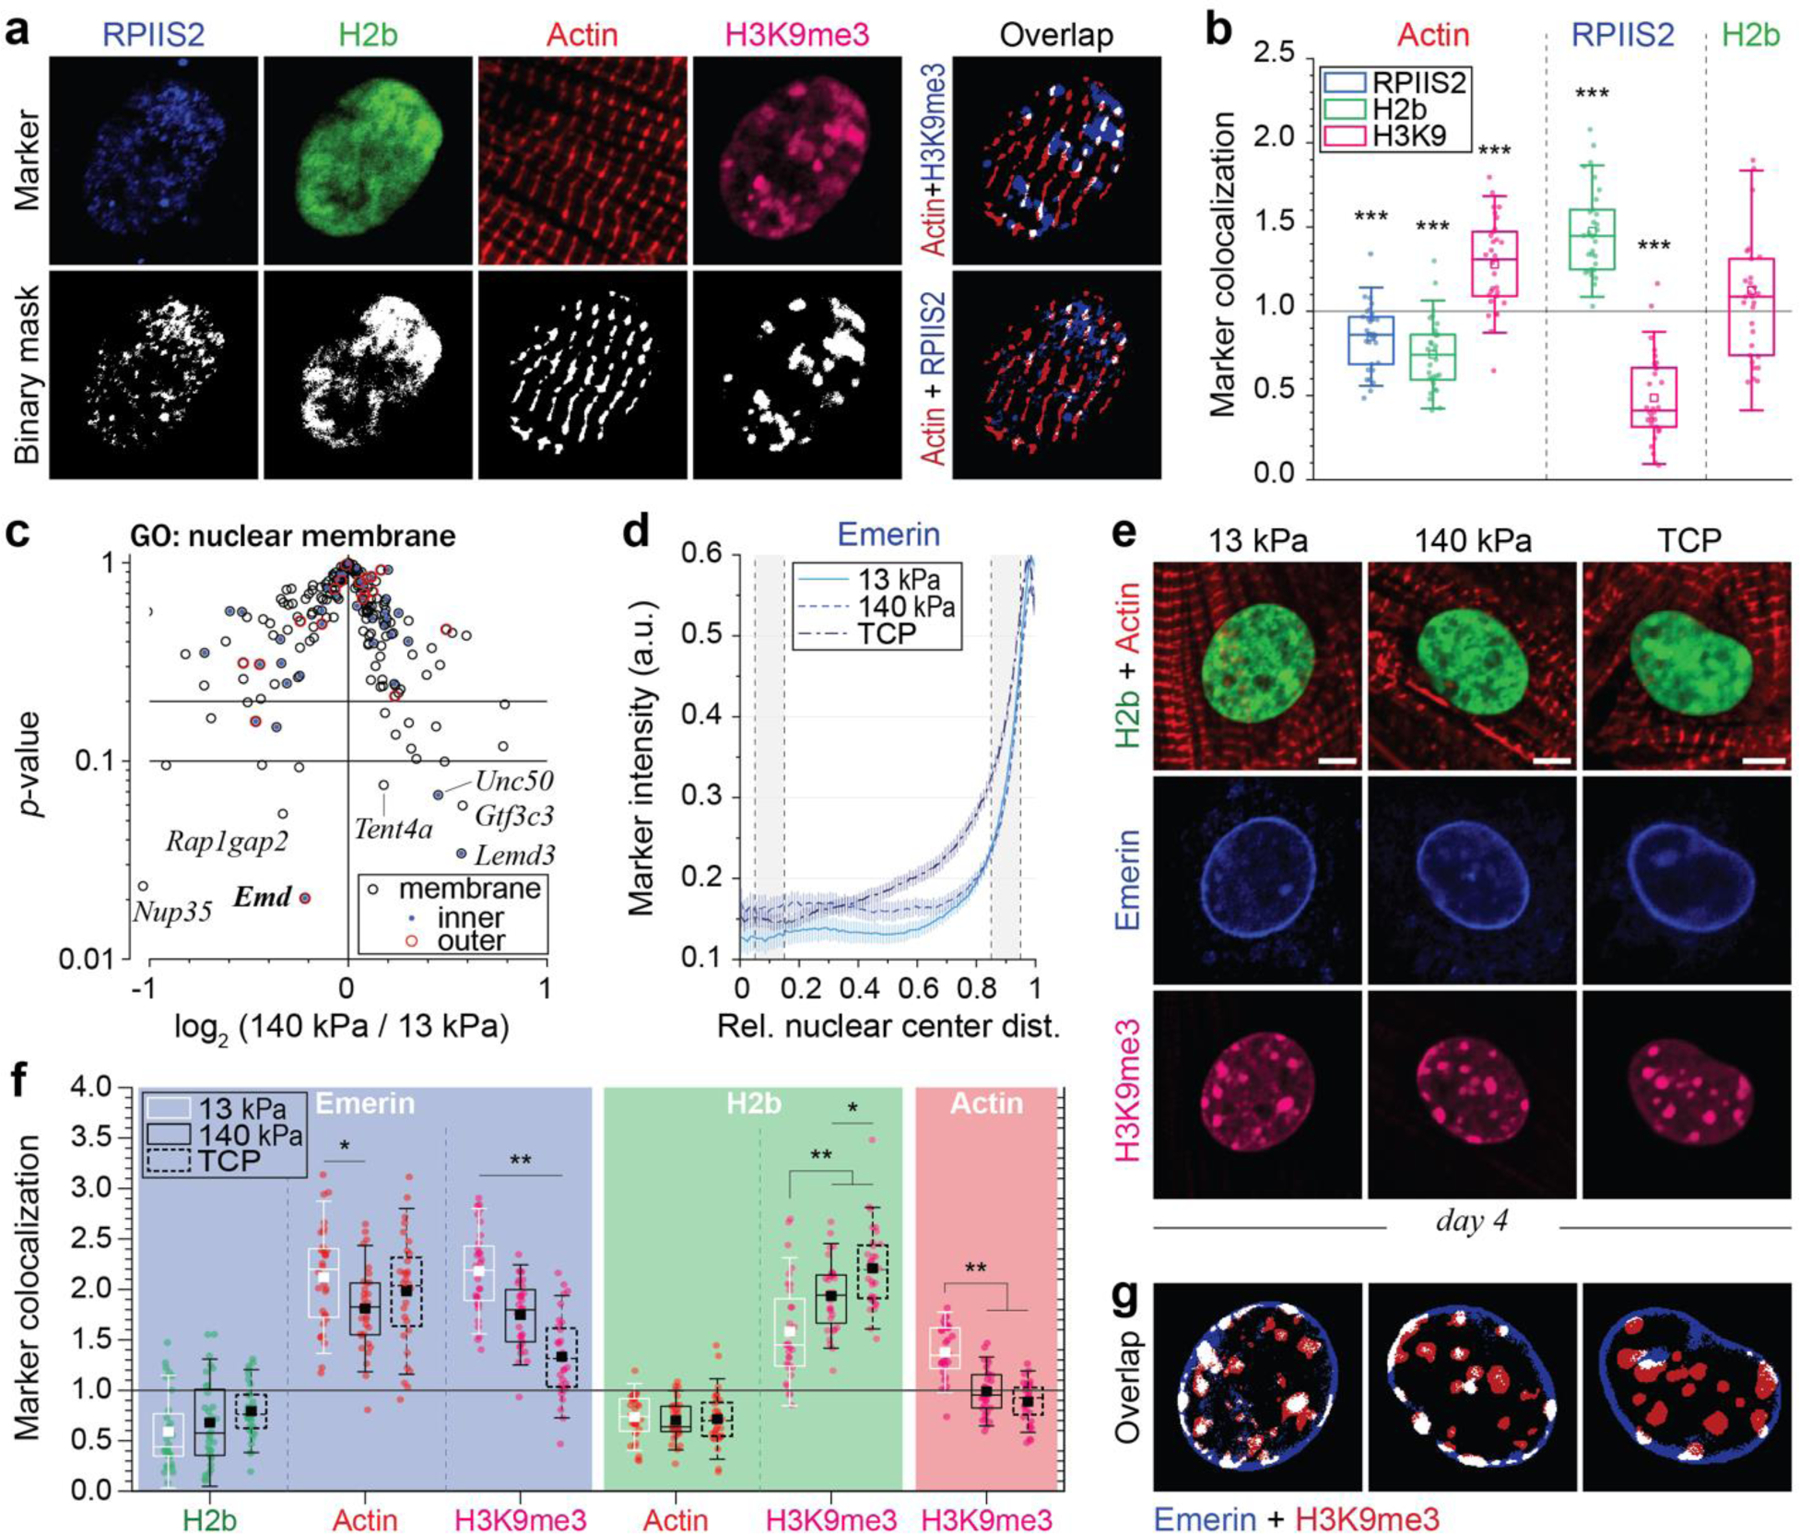
a, b) After four days in culture on soft PDMS, CMs were stained for regions of active transcription (RPIIS2), sarcomeric I-bands (actin) and H3K9me3. Marker channels were binarized and a colocalization score was calculated for each marker pair as the number of overlapping pixels normalized over the number of pixels that would overlap by chance (1=chance). H3K9me3-marked chromatin showed above chance associating with actin while regions of active transcription and overall chromatin did not. n=30 from 3 exp.; T-test (HM=1): *** p<0.001. c) Volcano plot of embryonic CMs, cultured for four days on soft (13 kPa) or stiff (140 kPa) PDMS, showing genes associated with the GO-term nuclear membrane (GO: 0031965), of which Emd (emerin) was the most significantly altered (see also Extended Table 7). n=4. d, e) Embryonic CMs were plated on soft or stiff PDMS or tissue culture plastic (TCP) for four days and stained for emerin, H3K9me3 and actin. Peripheral enrichment analysis showed only minor changes in emerin intensities distribution between all substrates. n=32 from 3 exp. f, g) Colocalization of emerin with H3K9me3 was significantly reduced on stiffer substrates, while no changes in the colocalization with actin was observed. n=32 from 3 exp.; 1W-ANOVA: * p<0.05, ** p<0.01.
Stiff Substrates Abrogate Colocalization of Emerin with H3K9 Trimethylated Chromatin in Embryonic CMs
We aimed to further explore the effect of substrate stiffness and potential mechanism of the observed association of myofibrils with H3K9me3-marked chromatin. Analysis of RNAseq data using the GO-term nuclear membrane showed that the gene coding for emerin (Emd) was most significantly downregulated on stiff compared to soft PDMS (Fig. 6c). Additionally, emerin has been shown to be sensitive to stretch15 and force-driven peripheral enrichment of emerin can change heterochromatin localization52. Analysis of CMs plated on soft or stiff PDMS or TCP for four days and stained for emerin, H3K9me3, and actin revealed that there was no distinct difference in peripheral enrichment of emerin between all substrates (Fig. 6d, e). Further, emerin showed a high colocalization score with actin on soft substrates which was only slightly reduced on stiff substrates and unchanged on TCP (Fig. 6f, g). However, colocalization of H3K9me3 with emerin observed on soft PDMS was abrogated on stiff PDMS and almost completely diminished on TCP. Similarly, colocalization of H3K9me3 with actin was also diminished on stiff substrates. Interestingly, the colocalization of H3K9me3 with overall chromatin (H2b) increased with substrate stiffness.
Because mechanical tension has previously been shown to induce an increase in outer nuclear enrichment of emerin52, we stained for emerin using a digitonin permeabilization, thus only permeabilizing the cell membrane and not the nuclear membrane. We found that regardless of substrate stiffness, emerin was present at the outer nuclear membrane (Extended Fig. 7b). Because CMs are constantly contracting, emerin may always be recruited towards the outer nuclear membrane. However, the colocalization of emerin with H3K9me3 along with actin may suggest that the mechano-sensitive nuclear envelope proteins, such as emerin, may anchor heterochromatin to the nuclear membrane. Further experiments could be done to examine the relationship between emerin and the reorganization of H3K9me3.
H3K9 Trimethylated Chromatin Domains are Localized to Intranuclear Subregions with Elevated Tensile Strains During CM Contractions
Our findings suggested that the relocation of H3K9 trimethylated chromatin to the nuclear membrane may be guided by myofibril-mediated nuclear deformation. We already showed that H3K9me3-rich heterochromatin clusters experience larger displacements compared the overall nucleus. To validate the link between nuclear strain and chromatin reorganization in CMs, we performed an in-depth analysis of the strain occupancy for different chromatin types during CM contraction. We utilized a recently published method, termed deformation microscopy53,54, which generates high-resolution spatial strain maps from an undeformed template and a deformed target image (Fig. 7a). Image series of nuclear deformations were recorded in contracting CMs on day two after which cells were fixed and stained for chromatin markers. Previously recorded CMs were relocated, imaged again and the common H2b-eGFP channel was used to register intranuclear strain maps with chromatin marker maps to calculate strain values for individual chromatin markers (Fig. 7b). Strain values were normalized to the average strain of each nucleus to allow for comparison between cells.
Fig. 7. H3K9 trimethylated chromatin is localized to intranuclear regions with elevated tensile strains during CM contractions.
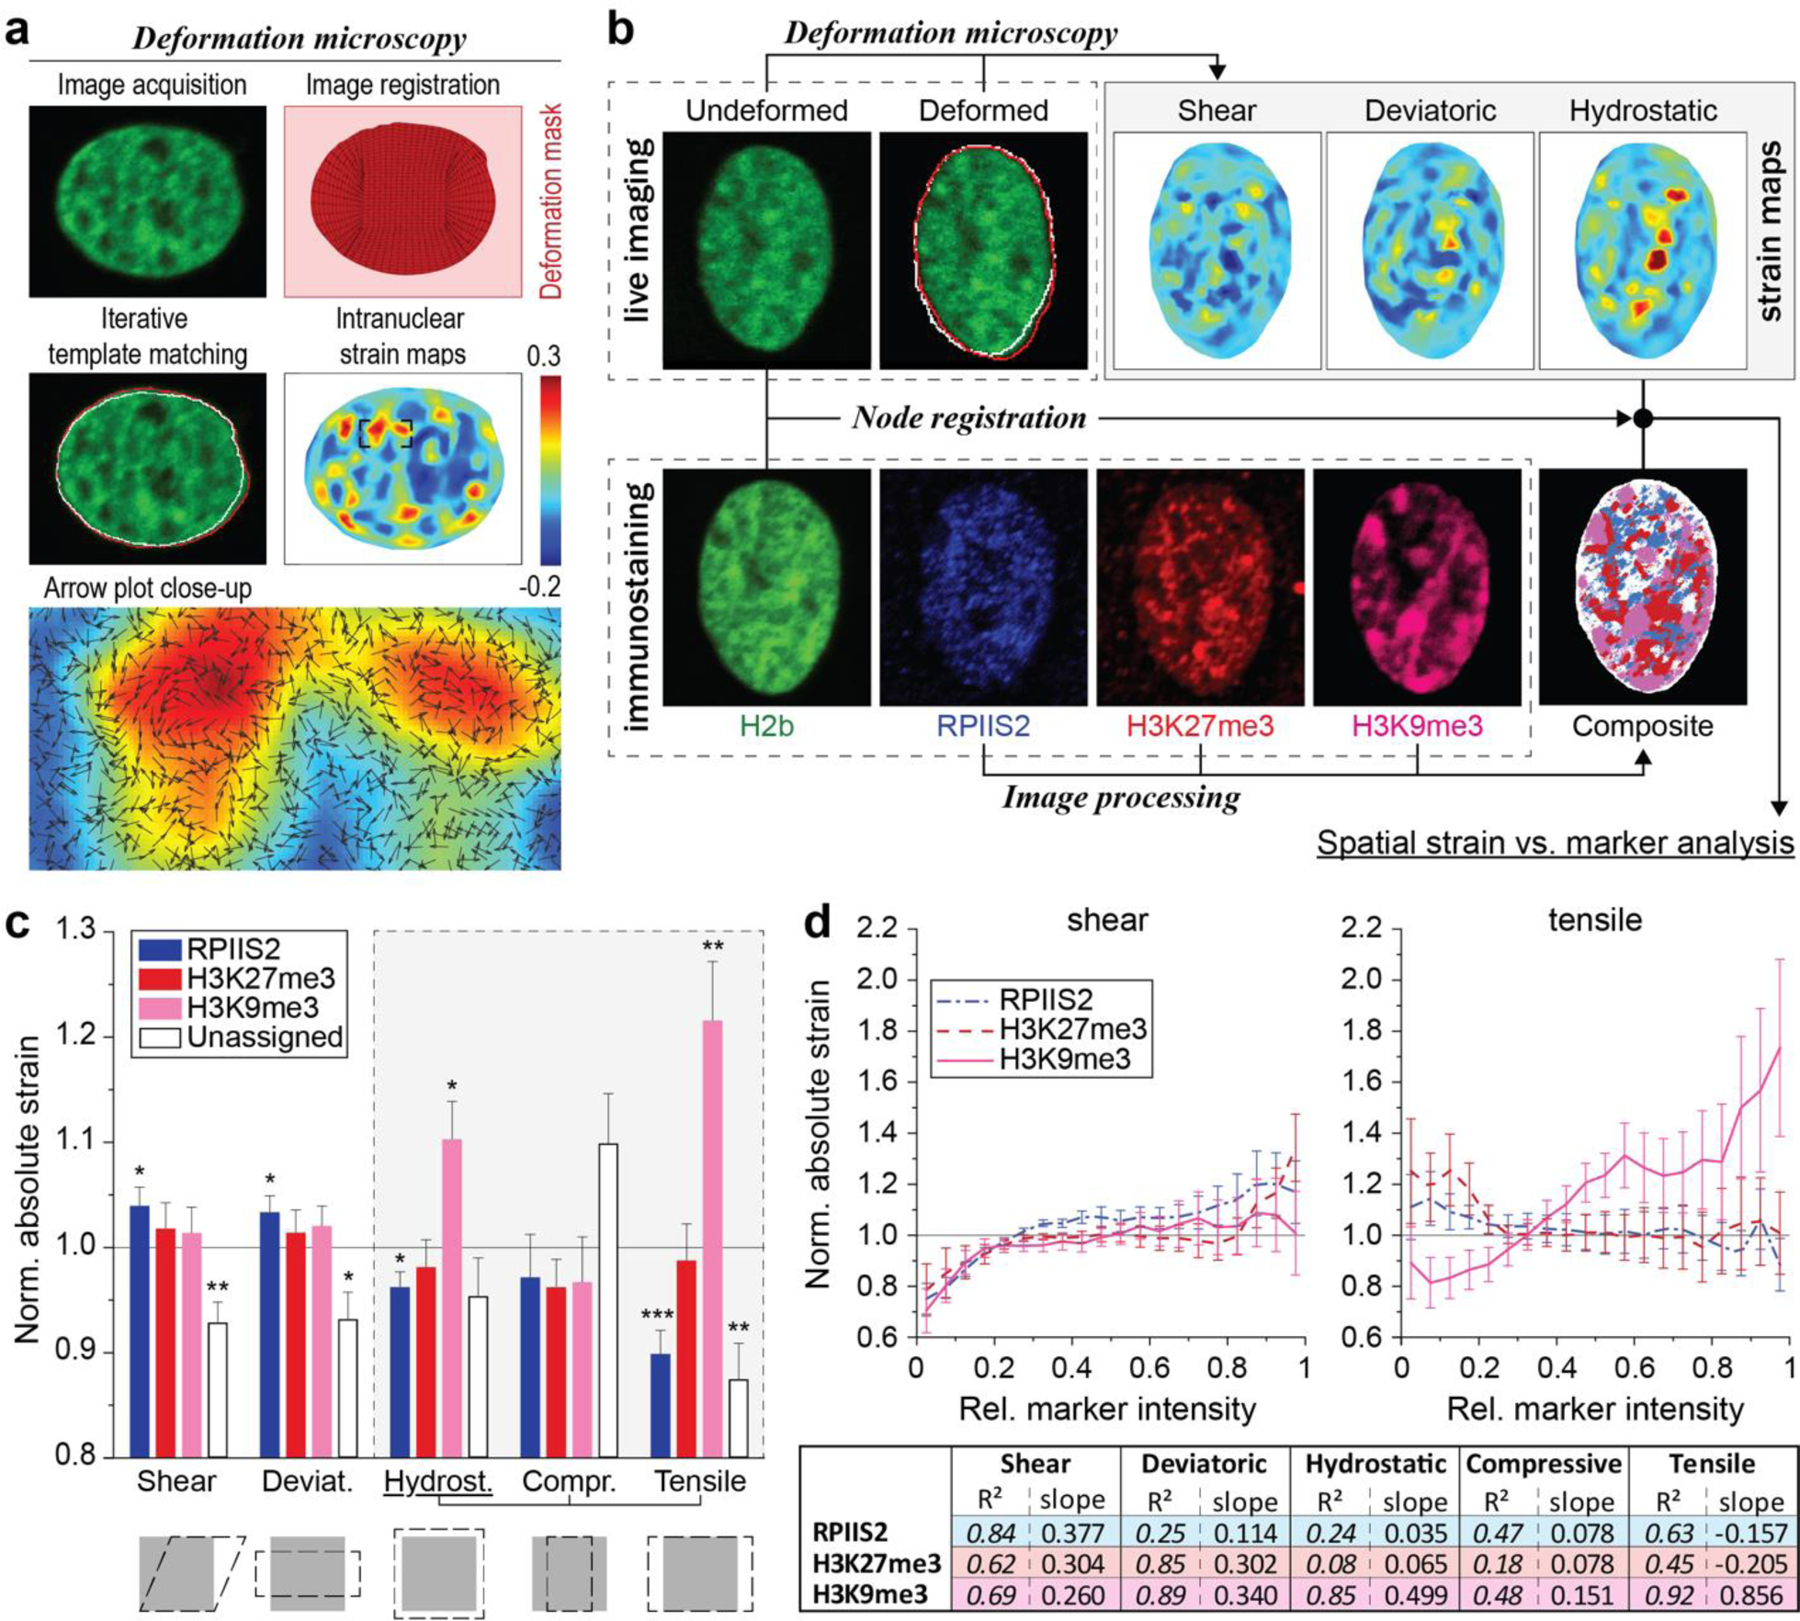
a) Illustration of deformation microscopy to generate high-resolution strain maps from image data. Image series of H2b-eGFP CM nuclei plated on soft (13kPa) PDMS were acquired during contraction. Frames of undeformed nuclei during diastolic resting (white outline) were iteratively registered and warped to match nuclear image frames during peak contraction (red outline). Arrow plot shows a close-up of the resulting intranuclear strain map for hydrostatic strains. b) Flowchart of spatial strain vs. marker analysis using deformation microscopy. Image series of CM nuclei were recorded on day two to calculate intranuclear strain maps. After, CMs were stained for H3K9me3, H3K27me3 or actively transcribed chromatin (RPIIS2), relocated and imaged again. Spatial nodes between both datasets were registered via the common H2b channel and strain occupancy for each marker was analyzed. c) Composite analysis of nuclear strains over chromatin assigned to one marker or none of the markers (unassigned, white areas in composite image). Strains were normalized to the average of each nucleus. H3K9me3-marked chromatin showed above average association with tensile hydrostatic strain. Bottom figures show visual representations of strain types (see also Extended Fig. 9e). SEM; n=20 from 5 exp.; T-test (HM=1): * p<0.05, ** p<0.01, *** p<0.001. d) Continuous analysis of intranuclear strains over chromatin marker intensities. Top: Strain vs. intensity plot for shear and tensile hydrostatic strain (see Extended Fig. 9 for other strains). Bottom: Linear regression summary of strain vs. intensity plots. Highest R2 and steepest slope were observed for tensile hydrostatic strains over H3K9me3 intensities. Error=SEM.
None of the chromatin markers investigated showed an increased association with either shear and deviatoric strain (Fig. 7c). However, H3K9me3-rich nuclear areas experienced above average absolute hydrostatic strains, which is of significance because strains related to changes in volume are expected to be the dominant during cardiac contraction (see Extended Fig. 8e for a visual explanation of strain types). More strikingly, subdividing hydrostatic strain values into tensile (positive) and compressive (negative) revealed that this trend arose from tensile strains alone as no significant difference was observed for compressive hydrostatic strains between any of the investigated chromatin features. In contrast, transcribed chromatin regions (RPIIS2) showed lower absolute hydrostatic strain, a trend that was again augmented for tensile hydrostatic strain. No significant difference was observed for H3K27me3 for any of the strains investigated (p>0.177). Linear regression analysis of chromatin marker intensities over intranuclear strains further showed the highest degree of correlation and the highest slope for tensile strains over H3K9me3-intensities (Fig. 7d and Extended Fig. 8a). Analysis of intranuclear strains over the distance to the nucleus center showed that strains generally declined towards the periphery, excluding the possibility that H3K9me3-marked chromatin and hydrostatic strains simply coincide at the nuclear border (Extended Fig. 8b-d).
Moreover, analysis of marker intensities over their angle with respect to the nuclear center revealed that H3K9me3 localization peaked within ±30° in the direction of nuclear translation; however, only in nuclei with a tensile loading mode (Extended Fig. 9). In contrast, nuclei with a shortened major axis during contraction showed diminished H3K9me3 occupancy at the angle of nuclear translation while H3K27me3 and RPIIS2 showed no observable trend for any loading mode.
LINC Complex Disruption Impacts Reorganization and Colocalization of H3K9me3 in Embryonic CMs
CM nuclei are connected to myofibrils via LINC complexes13,14, which are crucial for nuclear mechanotransduction15 and cardiac development13,17,18. Our results suggested that tensile strains transferred via the cytoskeleton might be important to cue the reorganization of H3K9me3-modified chromatin. To provide further evidence for this, we aimed to disrupted LINC complex connections in embryonic CMs by overexpressing a truncated nesprin-3 protein, Δsyne-K3, which contained the transmembrane and KASH (Klarsicht, ANC-1, Syne Homology) domain but lacked cytoskeleton binding domains (Fig. 8a). Because KASH domains are conserved between nesprins, this construct competes with all nesprin isoforms for SUN connections55–57, while the control vector (Δsyne-CTL) lacked the KASH domain needed for LINC complex integration. Both vectors also expressed fluorescently tagged α-actinin 2 (Actn2) to identify infected cells and measure contractility as mentioned above. Cardiac cultures were plated on soft PDMS and infected on day one of culture. After 24 hours, CMs that successfully integrated Δsyne-K3 showed diminished levels of nesprin-1 at the nuclear border and disorganized myofibrils, particularly around the nucleus (Fig. 8b, Extended Fig. 10, Extended Videos 1-3), further highlighting the role of LINC complexes in myofibril formation58. Contractility was also reduced in decoupled CMs (Extended Fig. 6c). However, reduction of bulk linear strains and translational movements of nuclei were more pronounced after infection with the decoupling vector (Extended Fig. 6e), compared to plating on stiff substrates.
Fig. 8: LINC complex disruption alters H3K9me3 peripheral enrichment and actin colocalization.
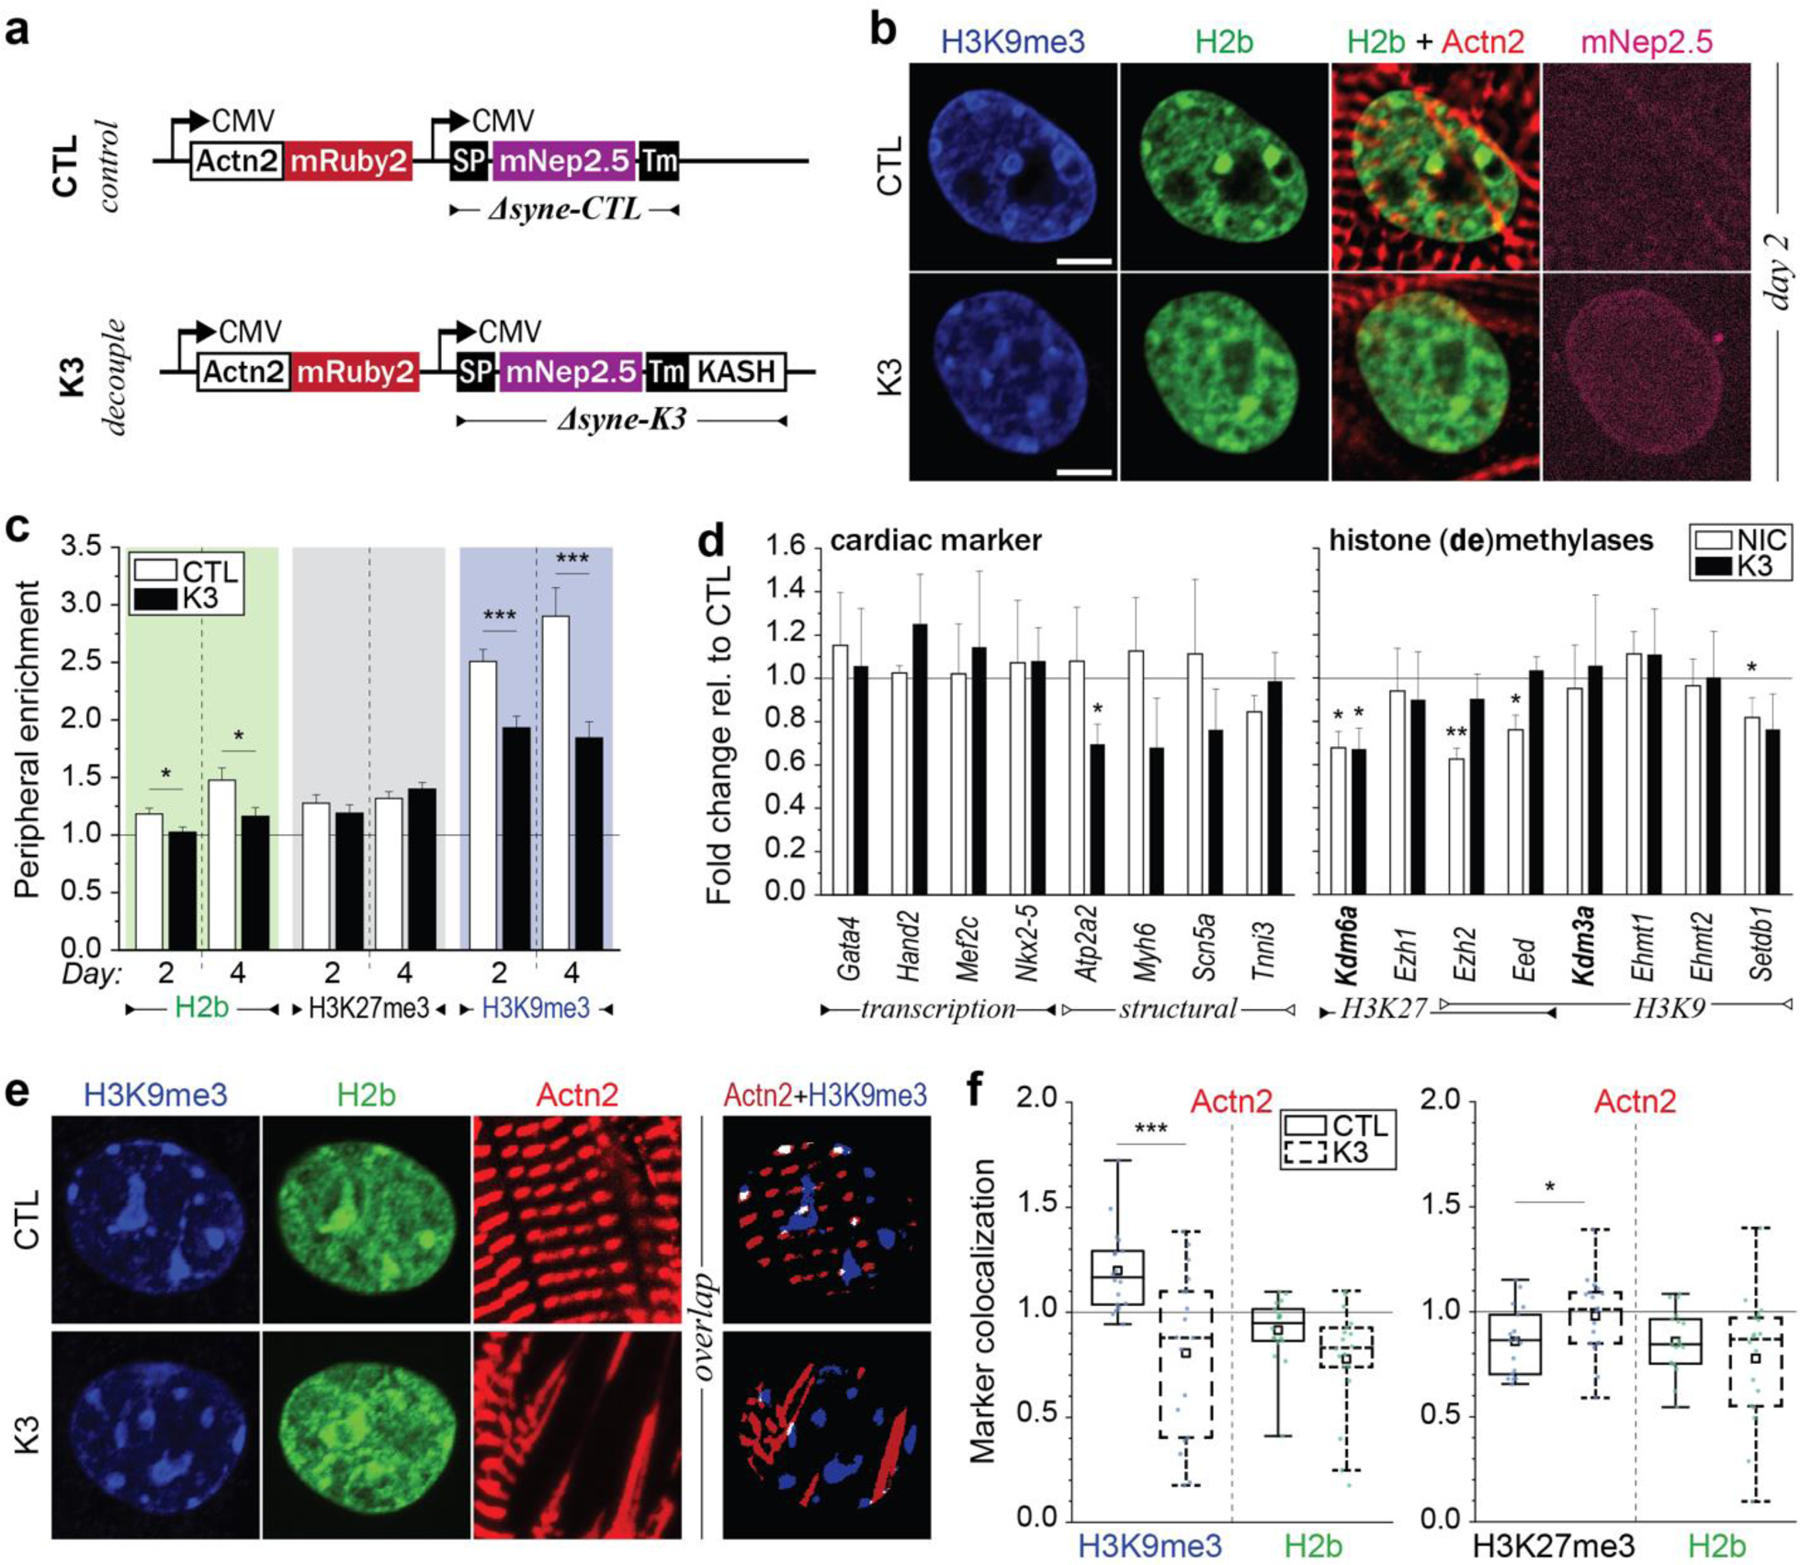
a) Illustration of adenoviral vectors for LINC complex disruption. The decoupling vector (K3) expressed a truncated nesprin-3 composed of the transmembrane (TM) and the KASH domain tagged with mNeptune2.5. The control vector (CTL) lacked the KASH domain necessary for LINC complexes integration. b) CMs were infected with either vector on day one and stained for H3K9me3 (shown) or H3K27me3 (Extended Fig. 11) on day two or day four. The K3 construct integrated successfully into the outer nuclear membrane of infected CMs (mNep2.5) while no distinct localization was observed for the control vector. Scale=5 µm. c) Decoupled cells (K3) showed abolished enrichment of overall and H3K9me3-marked chromatin compared to infected control cells (CTL). SEM; n=35 from 3 exp.; T-test: * p<0.05, *** p<0.001. d) Gene expression analysis of decoupled (K3) or non-infected control cells (NIC) compared to infected control cells (CTL). Expression of structural, but not transcriptional, cardiac genes was reduced in decoupled cells. SD; n=4; T-test: * p<0.05, ** p<0.01. e) CMs on soft (13kPa) PDMS were infected with K3 or CTL on day one and stained for H3K9me3 or H3K27me3 on day four. Colocalization of H3K9me3 with α-actinin 2 containing Z-disks (Actn2) was abrogated after LINC complex disruption while colocalization of H3K27me3 was increased. n=18 from 3 exp.; T-test: * p<0.05, *** p<0.001.
Enrichment towards the nuclear border was significantly impaired for overall (H2b) and H3K9me3-modified chromatin in decoupled CMs (K3) compared to control cells (Fig. 8c and Extended Fig. 11), while no distinct difference was observed for the peripheral accumulation of H3K27me3-marked chromatin. RT-qPCR analysis revealed that gene expression of H3K9 and H3K27 histone (de)methylases was largely unchanged in decoupled cells, compared to infected control cells, except for the downregulation of H3K27 demethylase Kdm6a (Fig. 8d). Decoupling also did not affect the expression of cardiac-specific transcription factors, while structural cardiac markers were partially downregulated. The expression of epigenetic enzymes was partially altered in non-infected control cells (NIC) compared to infected control cells, indicating that adenoviruses may affect the expression of epigenetic enzymes as previously reported59.
Marker colocalization of H3K9me3-marked chromatin with the Z-disk protein α-actinin 2 (Actn2) was significantly decreased (below chance) after decoupling (Fig. 8e-f, Extended Fig. 12). In contrast, coincidence scores of H3K27me3 with Actn2 were slightly increased after decoupling, again highlighting the inverse relationship of H3K9me3 and H3K27me3 in CM development. No significant difference in overlap of overall chromatin and Actn2 was observed in either decoupled or control cells. These findings support the hypothesis that deformation of the nuclear membrane may guide the peripheral reorganization of chromatin in CMs, as the observed association of H3K9me3-marked chromatin with myofibrils was lost after LINC complex disruption.
Suppressing H3K9 Methylation Abrogates Chromatin Reorganization and Cardiac Gene Transcription
Since the exposure to stiff substrates and the decoupling of the LINC complex led to prominent reorganization of H3K9me3, we examined the biological significance of H3K9me3 to provide a mechanistic insight into the role of nuclear architecture. We cultured cardiac cells from a mouse model with an inducible histone H3.3 lysine-to-methionine mutant (H3K9M), which acts as a global dominant negative inhibitor of H3K9 trimethylation (Extended Fig. 13a)60–62. As controls, we used mice that inducible expressed wild-type H3.3 (H3WT) as well as previously analyzed H2b-eGFP mice.
After four days in culture on soft PDMS, peripheral enrichment of H3K9me3-marked chromatin was abrogated in H3K9M CMs compared to H3WT and H2b-eGFP (Fig. 9a-c). Overall chromatin reorganization towards the nuclear periphery was also abrogated in H3K9M CMs. Note that DAPI was used as overall chromatin stain in H3K9M and H3WT CMs, which might explain the reduced enrichment score of H3WT compared to H2b-eGFP. In contrast to H2b-eGFP mice, both H3K9M and H3WT CMs showed no enrichment of H3K27me3.
Fig. 9: Suppressing H3K9 methylation via expression of H3K9M mutant histones abrogates chromatin reorganization and decreases expression of cardiac developmental genes.
Cardiac cells were isolated from mouse embryos expressing either mutated H3.3 (H3K9M), which suppressed H3K9me3, or wildtype H3.3 (H3WT) as a control, and were cultured for four days on soft PDMS. a-c) Analysis of peripheral enrichment showed that reorganization towards the nuclear envelope of overall (DAPI) and H3K9me3-marked chromatin was abrogated in CMs from H3K9M compared to H3WT. Data from H2b-eGFP mice is shown for comparison (same as Fig. 3d). SEM; n=66 from 3 exp.; 1W-ANOVA: * p<0.05, ** p<0.01. d) Total RNA was collected at day four. RNAseq analysis between H3K9M and H3WT revealed multiple GO-terms related to cardiac development, all of which were downregulated. In contrast, GO-terms related to cardiac structural genes were upregulated. Adjusted p-values of GO-terms are shown on the right.
To further assess functional significance of H3K9 trimethylation in cardiac development, we performed comparative RNAseq analysis between H3K9M and H3WT CMs after four days in culture. Functional annotation of significantly altered genes showed that GO-terms related to cardiac development and structure were among the top 10 up and downregulated (Extended Fig. 13b). In total we found 16 terms related to cardiac development, with associated genes that were conjointly downregulated (Fig. 9d). Interestingly, GO terms related to cardiac structural gene expression showed the opposite effect, with their associated genes upregulated. This indicated that mechanisms related to H3K9me3 might work primarily to determine cell fate rather than structural needs of the cell.
H3K9 Trimethylation Controls Gene Transcription Globally, not Locally
Lastly, we were interested whether trimethylation of H3K9 acts locally to alter gene expression. For that, we compared our H3K9M and H3WT RNAseq data with a ChIPseq datasets of day 16.5 embryonic mouse hearts to extract the locations of H3K9me3 heterochromatin domains. Overall gene expression of both H3K9M and H3WT decreased with proximity to H3K9m3 marks (Extended Fig. 14a), as expected. However, comparing gene expression between H3K9M to H3WT showed that, while variance increased, there was no trend in up- or downregulation even for genes in close proximity of H3K9me3 domains (<= 1kb). This is consistent with the notion that H3K9me3 contributes to transcriptional regulation indirectly, through spatial reorganization as shown in this study and others60.
DISCUSSION
We showed that CMs establish a cell-type specific nuclear architecture during development which is characterized by a relocation of chromatin from the interior to the nuclear periphery. Our findings suggest that tensile strains transferred from myofibrils to the nucleus via LINC complex connections guide the rearrangement of epigenetically suppressed chromatin to the nuclear periphery. Stiff environments, which decreased contractility and nuclear deformation, or LINC complexes disruption abrogated the reorganization of chromatin in embryonic CMs. We observed opposing trends for the relocation of H3K9me3 and H3K27me3-modified chromatin. Peripheral enrichment of H3K9me3 proceeded that of overall chromatin in embryonic CMs, while early relocation of H3K27me3 was indicative for the formation of a non-contractile cardiac fibroblast cell-type. Suppression of H3K9 trimethylation also abrogated chromatin reorganization and reduced gene expression related to cardiac development, demonstrating the functional role of H3K9me3 in CM maturation.
Taken together, our results provide further support for a link between nuclear architecture and cell differentiation and suggest that environmental cues can influence cell fate by affecting the reorganization of epigenetically modified chromatin through nuclear mechanosensation pathways (Fig. 10). This work therefore connects previously observed nexuses between mechanical properties of cell environments, cell fate, and the 3D organization of the nucleus into one conceptual framework that suggests a role for nuclear mechanosensation in guiding and stabilizing cell fate through spatial chromatin organization. Our observations in mouse models and human disease states further highlighted that mechanical environments remain important in adults to maintain the established chromatin organizations. Changes in chromatin organization were indicative of functional decline of the heart and may therefore have potential diagnostic value.
Fig. 10. Summary of chromatin reorganization and epigenetic regulation during cardiac development and disease.
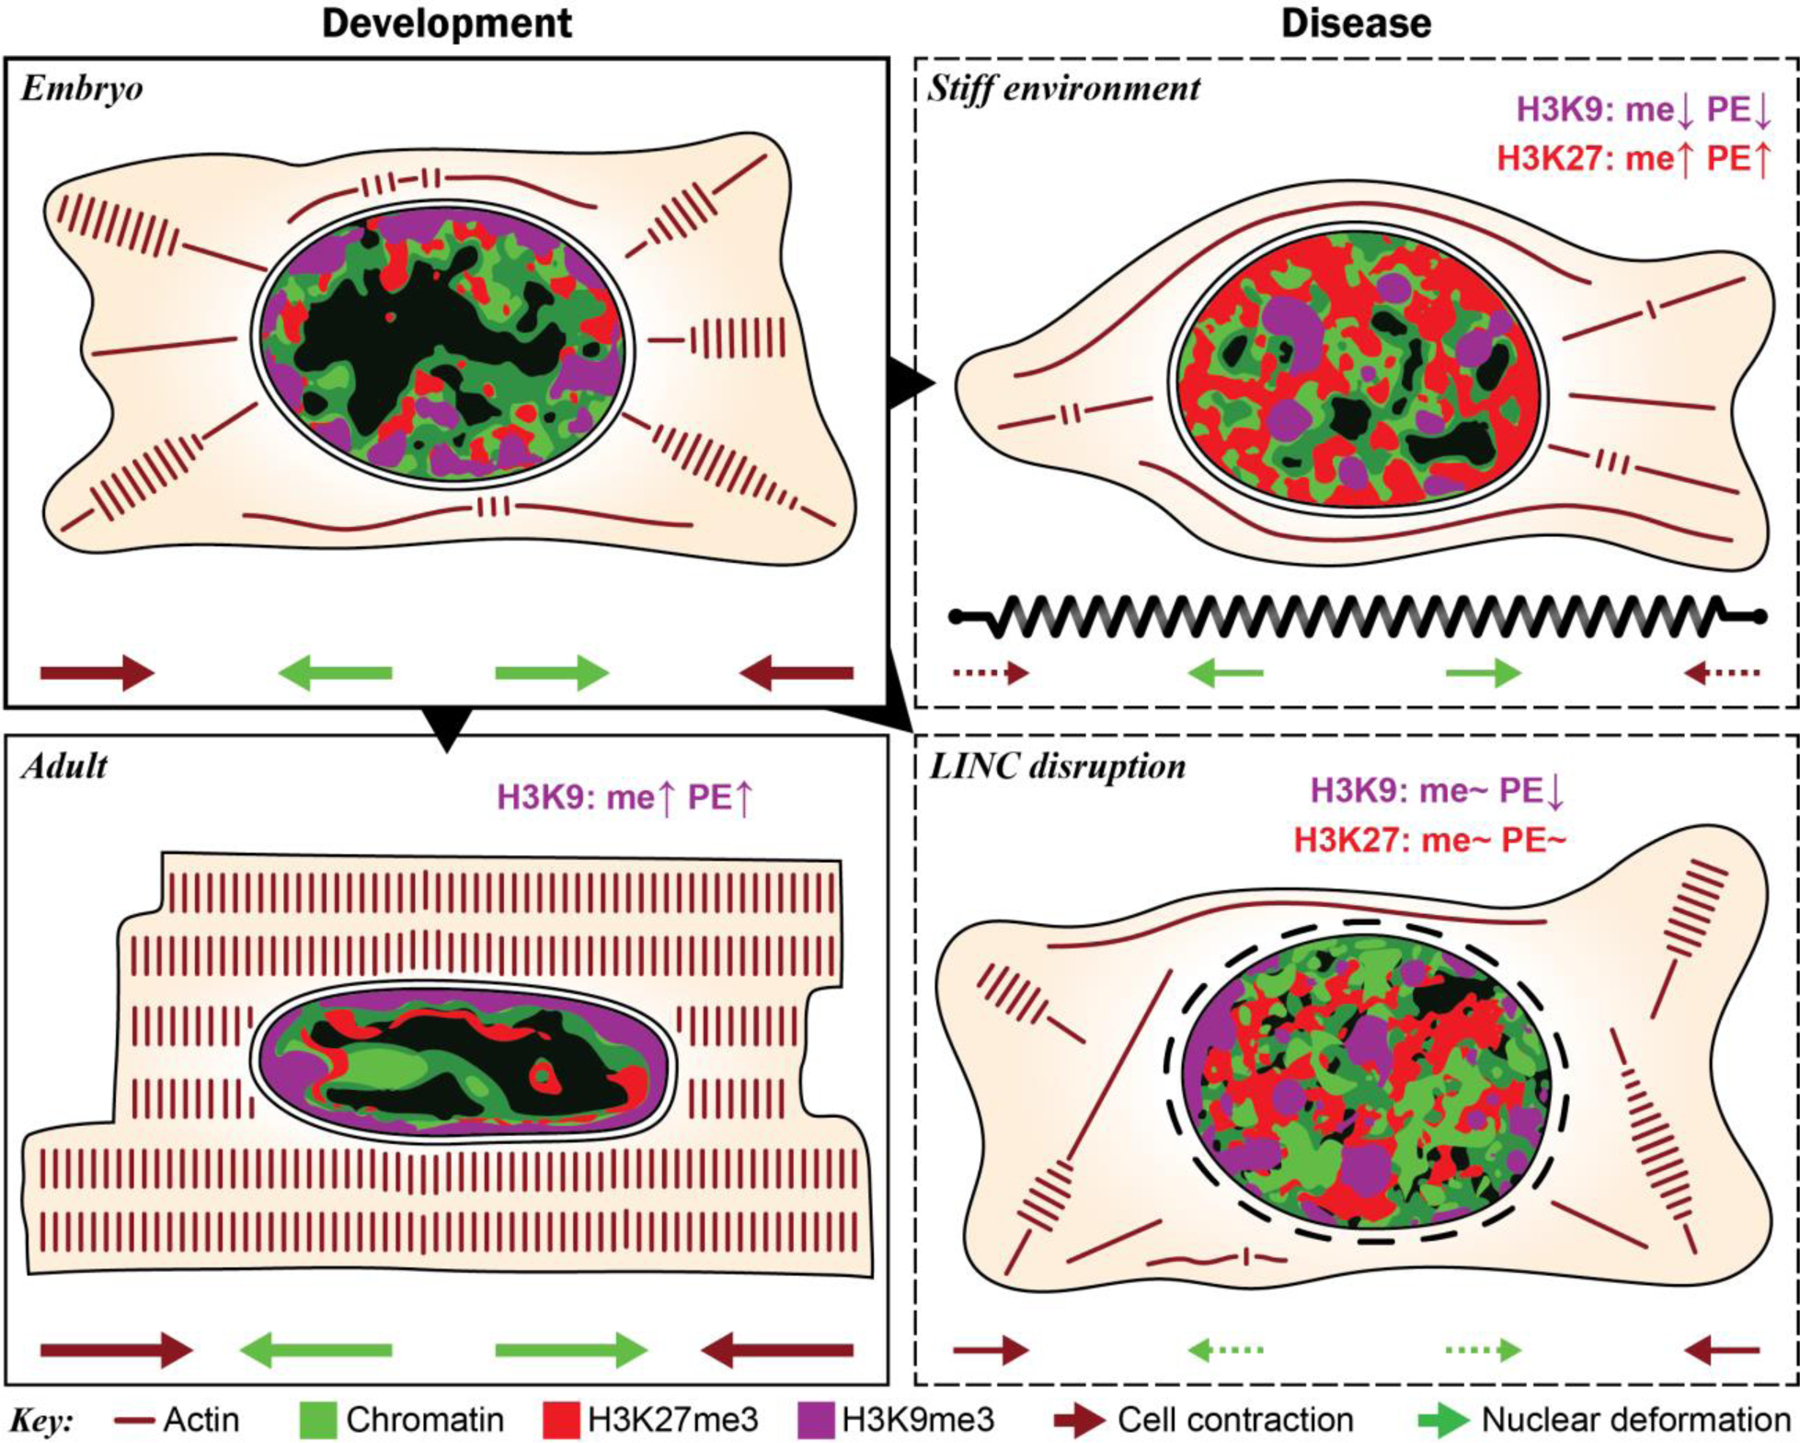
During development, myofibril-mediated cell contraction and subsequent nuclear deformation of embryonic CMs leads to increased H3K9 trimethylation (me) and peripheral enrichment (PE) of H3K9me3-modified chromatin. This presumably stabilizes cardiac gene expression by anchoring suppressed non-cardiac genes to the periphery to prevent reactivation. Stiffening of the cardiac micro-environments inhibits cell contraction and nuclear deformation resulting in increased trimethylation and peripheral enrichment of H3K27 instead of H3K9. Abrogation of nuclear strain transfer through disruption of LINC complexes inhibited chromatin reorganization while regulation of methylation remained largely unchanged, suggesting that nuclear mechanosensation primarily affects chromatin reorganization.
Potential Roles of Chromatin Organization in CMs
The observed reorganization of H3K9me3-marked chromatin during CM differentiation could function to stabilize differential gene expression by segregating repressed non-cardiac genes to areas of low activity, like the nuclear envelope63, to prevent accidental reactivation. In this study, RNAseq and PCR gene expression analysis revealed that H3K9 methylases Ehmt1, Ehmt2, and Setdb1 were particularly downregulated on stiff substrates together with cardiac differentiation markers. Recent studies have also shown that the expression of Ehmt1/2 was decreased in the heart of hypertrophic rats and that the reactivation of cardiac fetal genes such as Myh7, Nppa, and Nppb was associated with the loss of H3K9 methylation at those genes4. Furthermore, inhibition of Ehmt1/2 was sufficient to induce cardiac hypertrophy while stabilization of Ehmt1/2 expression counteracted effects of hypertrophy. Similarly, targeted deletion of H3K9 demethylase Kdm4a in the heart led to attenuated cardiac hypotrophy in mice5. Here we observed that H3K9me3-marked chromatin was located towards the nuclear center in adult CMs of hypertrophic mice and human patients suffering from cardiomyopathy, supporting the hypothesis that peripheral segregation of chromatin stabilizes its suppression (see Fig. 5). Interestingly, mechanical decoupling of CM nuclei through LINC complex disruption only minorly affected the expression of H3K9 (de)methylating enzymes or cardiac transcription factors. It is likely that CMs integrate mechanical signals from different pathways to achieve reliable and robust cell differentiation. One such candidate, identified here via RNAseq and validated through western blot analysis, was p130Cas (see Extended Fig 2e). This mechanosensitive focal adhesion protein49 is found within the sarcomeric Z-disk lattice in CMs50, hence making it a suitable candidate to sense substrate stiffness and influence epigenetic regulation via Rap1 and MAPK signaling (see Extended Fig. 2d). One study also showed that p130Cas knockout mice die in utero due to abnormal heart growth, further linking p130Cas to cardiac development64.
In addition to stabilizing cardiac gene transcription, the CM nuclear architecture may also have a structural function as has been reported for other types of cells25,26,65. The particularly strong accumulation of heterochromatin at the nuclear border could play a protective role as heterochromatin has been shown to increase nuclear rigidity independent of lamins66. Chromatin void cavities could provide a protective environment for gene transcription in cells that must endure high and constant cyclic mechanical stresses. This is supported by our observation that nuclear areas of actively transcribed chromatin experienced lower (tensile) hydrostatic strains (see Fig. 7).
Potential Role of Nuclear Mechanosensation in CMs
The role of nuclear mechanotransduction has long been debated. While it has been shown that LINC complexes are involved in mechanosensitive gene regulation67, no distinct mechanism has been reported so far. Our experiments support the hypothesis that nuclear strains transferred from myofibrils via LINC complexes may guide the reorganization of H3K9me3-modified chromatin in CMs. In contrast, non-contractile cells were associated with the reorganization of H3K27me3-marked chromatin instead. CMs may use nuclear deformation as a feedback for differentiation by consolidating the suppression of H3K9me3-marked non-cardiac genes through peripheral segregation as described above. This mechanism would be beneficial during development as it ensures that only CMs with high contractility mature, while others become fibroblasts or undergo apoptosis. Neurons are known to use similar activity-based mechanisms during development in which their initial state of differentiation is reinforced through functional fidelity68. Further investigation will show whether this nuclear-feedback is used by other load-bearing cells as well.
Potential Mechanisms of Mechanosensitive Chromatin Reorganization
How nuclear strains could guide chromatin rearrangement is unclear. One possible mechanism could involve the differential expression and/or stretch activation of nuclear envelope transmembrane proteins (NET) which could anchor modified chromatin to the nuclear envelope. NETs have been shown to be tissue specific and can recognize epigenetic modification of chromatin21,69,70. In this study we observed that emerin associates with H3K9me-marked chromatin on soft substrates, but not on stiff substrates (see Fig. 6). Emerin becomes phosphorylated in response to stretch15 and, in epidermal stem cells, emerin has been shown to relocate to the nuclear membrane in response to force52. However, this force-driven enrichment of emerin resulted in the dissociation of H3K9me3-marked chromatin and an increase in H3K27 trimethylation, which is inverse to our findings. It appears therefore, that similar force-induced mechanisms may control different chromatin arrangements in different cell types.
Nuclear myosins could also play a role to drive chromatin reorganization. For example, nuclear myosin 1 (NM1) has been shown to be necessary for chromatin relocation in response to serum activation71 and DNA damage72. After transport, NET proteins could anchor chromatin to the nuclear envelope. Motor proteins remain poorly characterized though, and more research is needed to understand their role in nuclear architecture.
The strict association of H3K9me3 with tensile, but not compressive, hydrostatic strains indicated the involvement of stretch-activation. In addition to emerin and other NETs, LINC complexes could play a decisive role in shaping nuclear architecture. It has been argued that LINC complexes are the nuclear analog to stretch-sensitive focal-adhesions at the cell membrane73, and research on isolated nuclei has shown that LINC complexes are necessary for stretch-induced nuclear mechanotransduction15. We observed that the disruption of the LINC complex alters chromatin architecture and decreases the colocalization of the z-disks with the nucleus in CMs (see Fig. 8) similar to how transmembrane actin nuclear (TAN) lines influence nuclear orientation, thus demonstrating the importance of the LINC complex to anchor the cytoskeleton and organize the nucleus74. Stretch-activation could ultimately control motor-protein activity and/or the recruitment of NETs to guide chromatin reorganization using mechanisms analogous to the formation of focal adhesions73.
Overall, we observed the nuclei of differentiated CMs exhibit a distinct architecture of epigenetically marked chromatin. Altered nuclear deformation through exposure to either stiff substrates or diseases states resulted in loss in the distinct chromatin architecture, highlighted by H3K9me3 reorganization. Our findings link how mechanical cues guide chromatin reorganization to establish a differentiated and matured phenotype.
METHODS
Substrate Fabrication
To mimic native and stiffened mechanical environments of adult cardiac tissue29,30,75, cell culture dishes were coated with soft or stiff polydimethylsiloxane (PDMS, Sylgard®527, Dow Corning) by using different mixing ratios (component A:B): 1:1 (E=12.7 ± 5.0 kPa) and 1:4 (E=139.7 ± 16.2 kPa). To enable live imaging at high magnification using a 100× objective, PDMS was deposited as thin layer (~100 µm) in gridded imaging dishes (µ-Dish 35 mm high Grid-500, ibidi). PDMS coated dishes were degassed under vacuum for 30 min, cured for 1h at 80°C, ozone-activated via corona arc-discharge (30s) and coated with reduced growth factor basement membrane matrix (Geltrex®, Gibco) for 1h at 37°C to provide attachment sites similar to the cardiac basement membrane. PDMS stiffness was determined via AFM using a spherical borosilicate glass tip (diameter=10 µm, stiffness=0.85 N/m), and Young’s modulus E was calculated using a Hertz contact model76. Cells were also cultured on cell culture dishes coated with Geltrex basement membrane matrix but without PDMS coating to represent traditional experiment using tissue culture plastic (TCP).
Cardiac Cell Isolation and Culture
B6.Cg-Tg (HIST1H2BB/EGFP) 1Pa/J mice (Stock No: 006069), referred to as H2b-eGFP mice, were obtained from Jackson Laboratory. All animal procedures were performed following Institutional Animal Care and Use Committee approval. Embryonic mice hearts were harvested 18.5 days post conception. Hearts were minced and incubated in a digestive mix for 30 min at 37°C. Digestive mix contained 2 mg/ml Papain (P4762, Sigma), 500 µg/ml Liberase TM (05401119001, Roche), 5 mM L-Cysteine (C6852, Sigma) and 10 µg/ml DNase-I (D4263, Sigma). Cardiac cells were isolated through gentle trituration using a 1 ml pipette and cells were cultured on prepared substrates in DMEM-F12 Advanced (Gibco) containing 10% fetal bovine serum (Gibco), 1% penicillin-streptomycin (Gibco) and 25 mM HEPES (Gibco) at a density of 50,000 cells/cm2. Samples were incubated at 37°C and 5% CO277. Cultures were washed in medium 24 hours after plating to remove any debris. Half medium changes were performed on Day 2 in culture.
For H3K9M and H3WT studies, male mice carrying the transgene were bred to C57BL/6 (Jackson Laboratory) females. Embryonic hearts were harvested on day 18.5 post conception. Tissue digestion and culture conditions were maintained the same as stated for the H2b-eGFP cardiac cultures. On Day 0, 1, and 2, cells were induced with 2µg/ml doxycycline (Sigma).
RNAseq Analysis
Total RNA was extracted from cardiac cultures after 4 days on either soft or stiff PDMS (n=4) using the AurumTM Total RNA Mini Kit (Bio-Rad Laboratories). Libraries were constructed by the Purdue Genomics Core Facilities according to standard protocols using TruSeq Stranded mRNA Library Prep Kit (Illumina). Samples were run on a HiSeq 2500 (Illumina) with 200 bp paired-end reads. The filtered Illumina reads were pre-processed and mapped by the Purdue Bioinformatics Core. Sequence quality was assessed using FastQC (v0.11.2) for all samples and quality trimming was done using FASTX toolkit (v0.0.13.2) to remove bases with less than Phred33 score of 30 and resulting reads of at least 50 bases were retained. The quality trimmed reads were mapped against the bowtie2-indexed reference genome downloaded from Ensembl using Tophat (v2.0.14) with default parameters. RNAseq data can be obtained from the GEO database (GSE109405).
Histone subfamily classifications were done using HistoneDB 2.0 (https://www.ncbi.nlm.nih.gov/research/HistoneDB2.0/). Pathways with enriched differential gene expression (p<0.2, FPKM>1) were screened using the KEGG database via the functional annotation tool DAVID (https://david.ncifcrf.gov/). Analyses of functionally grouped networks was performed using the ClueGO (v2.5.0) app on the Cytoscape (v3.6.0) software tool. Genes associated with the GO term histone modification (GO:0016570) were obtained from AmiGO 2 (http://amigo.geneontology.org/amigo) and differentially expressed genes (p<0.2) in this ontology were used to screen for child GO terms using AmiGO’s term enrichment tool (v1.8).
For the analysis of H3K9M and H3WT mice (n=3), total RNA was sequenced at the Genomics Shared Resource Facility at the UC Anschutz Medical Campus and reads were mapped using hisat2 v2.1.078 and custom parameters to the UCSC mouse genome release mm10. Reads were summarized to genes annotated by UCSC using featureCounts v1.6.279. Count data was further analyzed in R 3.6 using DESeq280 to call differentially expressed genes and clusterProfiler81 for the gene set enrichment analysis of Gene Ontology pathways. To compare the local impact of H3K9 trimethylation and changes in gene expression, our data was compared to publicly available ChIP-seq datasets from day 16.5 embryo’s heart from the model organism encyclopedia of dna elements (modEncode)82 using in-house scripts based on DeepTools83 and the bamTools and bedTools suite. RNAseq data can be obtained from the GEO database (GSE178674).
RT-qPCR Analysis
Total RNA was extracted from cardiac cultures after 4 days on either soft or stiff PDMS (n=4) using the AurumTM Total RNA Mini Kit. RNA was reverse transcribed into cDNA via iScriptTM Reverse Transcription Supermix and real-time quantitative PCR was performed with SsoAdvancedTM Universal SYBR® Green Supermix in a CFX96 Touch™ thermocycler (all kits and devices from Bio-Rad Laboratories) using 10 ng of cDNA as input. Primers were custom designed using NCBI primer blast, cross-confirmed in Ensembl gene database and synthesized by IdtDNA. Primers span at least one exon-exon junction. Relative expression change was calculated using the ΔΔCt method. All data was normalized to the reference genes Gapdh and ActB as established in previous heart studies84,85. Primer sequences are listed in Extended Table 4.
Immunofluorescence Staining
Cells were fixed in 4% ice-cold PFA for 10min, permeabilized with 1% Triton-X100 in PBS for 15 min and blocked with 10%NGS, 1% BSA in 0.1% PBT (0.1% Tween-20 in PBS) for 60 min. For digitonin experiments, cells were permeabilized in 0.003% digitonin (D141, Sigma) in PBS. Primary incubation was performed at 4°C overnight in 0.1% PBT containing 1% BSA. Secondary incubation was performed in primary incubation buffer for 45 min (RT) at a dilution of 1:500. Actin was counterstained with Phalloidin conjugated to either Texas Red-X for embryonic tissues and marker co-localization in vitro studies (Life Technologies), Alexa Flour 488 for cardiac sections of hypertrophic mice (Life Technologies) or CF405 for all other in vitro cultures (Biotium). Primary antibodies: H3K9me3 (ab8898, Abcam, 1:800), H3K27me3 (ab6002, Abcam, 1:200), RNA polymerase II CTD repeat YSPTSPS phospho S2 (ab24758, Abcam, 1:400), nesprin-1 (ab24742, Abcam, 1:500), DAPI (Invitrogen, 1:1000), and Emerin (30853S, CST,1:250).
Tissue Sectioning and Staining
After harvest, tissues were washed in PBS and fixed in 4% PFA at 4°C overnight. Tissues were washed again in PBS, embedded in 6% agarose and sectioned into 100 µm thin slices using a vibratome (VT1000 S, Leica). Tissue sections were further immunostained as described above.
Analysis of Chromatin Marker Occupancy
Image stacks of immunostained nuclei were recorded on a Nikon A1R confocal microscope using a 60× oil immersion objective. A custom MATLAB code was used to calculate the intensity of each chromatin marker with respect to distance of the nuclear border. Briefly, the H2b-eGFP image stack was used to determine the nuclear border and the nuclear center for each nucleus. For each pixel, the distance to the nuclear center was calculated and histogram-normalized image intensities for each marker channel were collected. Nuclear center distances were normalized to the maximum distance of each corresponding center trajectory resulting in a normalized center distance of 0 for the center and 1 for the nuclear periphery for any nuclear geometry. Normalized nuclear center distances were then binned in 0.01 steps (100 bins total) and marker intensities for pixels in the same bin were averaged for each nucleus. MATLAB code is available from the corresponding author upon request.
Hypertrophic Animal Model
Female, 12 weeks old C57BL/6J mice (Jackson Laboratory) were surgically implanted with a mini-osmotic pump (ALZET Model 2004, DURECT Corporation) to deliver either saline (n=5) or AngII (n=4) at a rate of 0.28 μL/h for 28 days. For the AngII group, the AngII powder was dissolved in saline to provide a 1000 ng/kg/min infusion rate. Mice were monitored at baseline and again on day 28 post-surgery using a high resolution, small animal ultrasound imaging system (Vevo2100 Imaging System, FUJIFILM VisualSonics) to assess cardiac size and function86. After 28 days, mice were euthanized, hearts harvested, and the left ventricles were cut along the transverse plane. Tissue sectioning and staining was performed as described above. All animal procedures were approved by the Institutional Animal Care and Use Committee.
Small Animal Ultrasound Imaging
A high resolution, small animal in vivo ultrasound imaging system was used to assess cardiac size and function at baseline and again on day 28 post-surgery. Briefly, anesthetized mice (1–3% isoflurane) were positioned supine on a heated stage. Body temperature was monitored using a rectal probe, while cardiac and respiratory rates were monitored using stage electrodes. Hair on the thoracic region was removed with depilatory cream and ultrasound gel was applied. A linear array transducer (MS550D) was used to view both the long and short axes of the heart. Two-dimensional cine loops in brightness mode (B-mode) and motion mode (M-mode) were collected. In addition, high temporal resolution cine loops were acquired using ECG-gated Kilohertz Visualization (EKV). These images were analyzed with Vevo2100 software (FUJIFILM VisualSonics) to determine ejection fraction and fractional shortening.
Human Cardiac Tissue Acquisition and Immunostaining
All human tissue acquisition, processing and analysis was approved by the Institutional Review Boards at the University of Pennsylvania, the Gift-of-Life Donor Program (Philadelphia, PA) and the University of Colorado Boulder. As previously described87, failing human hearts with non-ischemic cardiomyopathy were procured at the time of orthotropic heart transplantation at the Hospital of the University of Pennsylvania. Non-failing hearts were obtained at the time of organ donation from cadaveric donors. In all cases, hearts were arrested in situ using ice-cold cardioplegia solution and transported on wet ice. Thin, transmural myocardial samples were dissected from the mid left ventricular free wall below the papillary muscle. Tissues were immersed in 4% paraformaldehyde within 4 hours of cardiectomy. All patients were sex- (male, Caucasian) and age- (44–69 years) matched (see also Extended Table 6). Fixed tissue blocks dehydrated, and embedded in paraffin wax according to the standard workflow of the Hospital of the University of Pennsylvania88. Once embedded in paraffin, the tissue was sectioned and mounted for histochemical or immunofluorescence staining. For histochemical staining, each sample was rehydrated, stained with hematoxylin and eosin (H&E) and Masson’s trichrome, and dehydrated for imaging. For immunofluorescence staining, samples were rehydrated and an antigen retrieval was performed in a citrate buffer (ab93678, abcam) at 95ºC for 20 mins. Next, the tissue was permeabilized with 1% Triton-X100 in PBS for 15 min and blocked with a commercial protein block (ab64226 abcam) for 5 mins and subsequently with 10% NGS, 1% BSA in PBS for 30 mins. Primary incubation with the H3K27me3 antibody (C36B11, Cell Signaling Technology) was performed overnight at 4ºC at a dilution of 1:100 in TBS. Secondary antibody incubation (ab150077, abcam) was performed for 1.5 hours at a dilution of 1:150 in TBS with 1% BSA. Next, staining of H3K9me3 was performed with CF640 conjugated H3K9me3 antibody (92258, Biotium and ab8898, abcam) at a dilution of 1µg in 400 µL of TBS overnight at 4ºC. Actin and nuclei were counterstained with Phalloidin conjugated to Texas Red-X (Life Technologies, 1:400) and DAPI (Invitrogen, 1:1000), respectively.
Adenovirus Generation and Transduction
Adenoviral vectors for LINC disruption experiments were generated as described before89 using the AdEasy vector system. The decoupling and control construct were assembled via Gibson cloning using NEBuilder® HiFi DNA Assembly Master Mix (New England Biolabs). The decoupling construct contained the C-terminal end of the nesprin-3 gene (Syne3) including the transmembrane (Tm) and the KASH domain. The N-terminus was replaced by a far-red fluorescence protein (mNeptune2.5) for visualization and a signal peptide (SP, from Tor1a) for membrane integration. The control construct was identical to the decoupling construct but lacked the KASH domain. AdEasy plasmids were a gift from Leslie Leinwand. pcDNA3-mNeptune2.5 and pcDNA3-mRuby2 were a gift from Michael Lin (Addgene, #51310 and #40260)90. Embryonic cardiac cells were infected at day one with 100×MOI, as determined by plaque assay, and further analyzed at day two or day four as described above. Plasmid maps and stab cultures of adenoviral transfer plasmids can be obtained from Addgene (CTL: #122243 and K3: #122242).
Nuclear Bulk Linear Strain and Translation
CMs cultured on soft PDMS, stiff PDMS or TCP or infected with K3 or CTL on day one on soft PDMS and image series of nuclei (6.4 fps) were recorded during contraction on day two or four using an inverted epi-fluorescence microscope (Nikon Ti-Eclipse) with a 100× oil immersion objective (0.16 µm/pix) and an iXonEM+ EMCCD camera (Andor). A custom MATLAB code was written that tracked nuclear outlines during image series. Bulk linear strain was calculated as the average of the differential length of major and minor axis while translation was determined via centroid tracking. For each nucleus, the results of four contraction cycles were averaged for one data point. MATLAB code is available from the corresponding author upon request.
Sarcomere Shortening Analysis
CMs cultured on soft or stiff PDMS were infected with K3 or CTL on day one and image series (6.4 fps) of myofibril contractions were recorded on day two using an inverted epi-fluorescence microscope (Nikon Ti-Eclipse) with a 100× oil immersion objective (0.16 µm/pix) and an EMCCD camera (iXonEM+, Andor) via expression of α-actinin 2-mRuby2 (Videos 1-3). A custom written MATLAB code was used to quantify the length of different sarcomere features before and during contraction from α-actinin 2 fluorescence intensity profiles stretching 15–20µm and containing 8–12 α-actinin 2-rich Z-disks (Extended Fig. 6a). Overall sarcomere lengths were determined as the distance between neighboring peaks. Data points between peaks were interpolated (cubic) to achieve sub-pixel resolution and the mid-intensity between a maximum (peak) and a minimum (valley) was used to separate the Z-disks from A-bands for each segment (Extended Fig. 6b). Values along one intensity profile were averaged and the difference in length before and during contraction for each sarcomere feature was calculated. A total of 25 intensity profiles were analyzed for each substrate. MATLAB code is available from the corresponding author upon request.
Marker Co-Localization Analysis
Cardiac cultures were immunostained after four days on soft PDMS and image z-stacks were acquired on a Nikon A1R confocal microscope using a 60× oil immersion objective. In vitro, myofibrils primarily intersected with nuclei on the basal side (Extended Fig. 8). A custom MATLAB code was used to calculate marker co-localization scores for basal nuclear z-slices. For that, marker channels were binarized (0 or 1) using accumulated histogram thresholding with cut-off values of 90% for actin and α-actinin 2, 95% for H2b, and 85% for H3K9me3 and H3K27me3 to achieve equal representation of true pixels (=1) amongst channels. A marker co-localization score for any marker pair was calculated as the percentage of overlapping pixels (number of pixels that are true for both channels divided by total number of pixels in the nucleus) divided by the probability that positive pixels overlap by chance (independent probability): co-localization score = p(A∩B) / [p(A) × p(B)] with A {marker channel 1=true} and B {marker channel 2=true}. MATLAB code is available from the corresponding author upon request.
Spatial Intranuclear Strain and Chromatin Marker Analysis
After two days on soft PDMS, image series (7.2 fps) of nuclear deformation during CM contractions were recorded on a Nikon A1R confocal microscope using a 60× oil immersion objective (0.14 µm/pix) via the expression of H2b-eGFP. Nuclear frames during diastolic rest and during peak contraction were used as template and target, respectively, to generate high-resolution intranuclear strain maps via deformation microscopy developed previously53,54. The location of each cell was recorded through the use of gridded imaging dishes (µ-Dish 35 mm high Grid-500, ibidi). After live imaging, cells were fixed, immunostained for chromatin markers, relocated and image color stacks were recorded again on a confocal microscope. To compensate for changes in nuclear morphology during fixation, intranuclear strain maps and chromatin marker maps were aligned via the registration function of the deformation microscopy algorithm using the common H2b channel in both datasets and marker channels were interpolated (cubic) to match strain resolution.
A custom written MATLAB code was used to analyze nuclear strains over chromatin marker intensities. For non-continuous analysis (Fig. 9c), marker channels were binarized using accumulative histogram thresholding with a cut-off value of 75% and strain values for true marker pixels were averaged. A composite map was generated by assigning pixels to the marker with the highest normalized intensity value, if multiple channels were true, or labeled as unassigned if no channel was true.
For angular analysis, the angle of each pixel with respect to the nuclear center was obtained with the angle of nuclear translation during contraction set to 0°. Nuclear translation angle was determined as the angle of the trajectory that connected the nuclear centers before (resting) and during CM contraction (Extended Fig. 10). Pixels were binned in 1° steps and marker intensities for each channel were averaged for each bin. Areas represent SEM between cells. MATLAB codes are available from the corresponding author upon request.
Western Blot Analysis
After four days on soft or stiff PDMS substrates, cardiac cells were lysed in tris-triton buffer, 100mM NaCl, 10mM Tris, 1mM EGTA, 1mM EDTA, 1% Triton-X 100, 10% Glycerol, 0.1% SDS, 0.5% deoxycholate, 1X Phosphotase/Protease Inhibitor (all Sigma-Aldrich). Protein concentrations were determined using Bradford Assay Kit 1 (Bio-Rad) and 30µg of protein were loaded onto 8% SDS-Page Gels (Thermo Scientific), transferred to PVDF membranes (EMD Millipore) and immunodetected using an ECL substrate kit (Life Technologies) and a PXi imaging system (Syngene). Densitometric quantification was performed using ImageJ (v1.50e). Primary antibodies: p130Cas (13846, CST, 1:1000), phospho-p130Cas Tyr410 (4011, CST, 1:1000) and Gapdh (5174, CST, 1:1000). Secondary antibody: Anti-HRP (7074P2, CST, 1:1000).
For H3K9M and H3WT experiments, cells grown in culture for four days were prepared for western blotting by nuclear isolation. Cells were incubated in nuclear isolation buffer, containing 50 mM Tris-HCl pH 8, 15 mM NaCl, 60 mM KCl, 5 mM MgCl2, 1 mM CaCl2, 250 mM sucrose, 1 mM dithiothreitol, 0.6% IGEPAL, 1x protease inhibitor (all from Sigma-Aldrich), before pelleting and washing with nuclear isolation buffer one time. Next, cells were lysed in RIPA buffer containing 50 mM Tris-HCL (pH 8), 150 mM NaCl, 0.1% SDS, 0.5% sodium deoxycholate, 1% Triton X-100 and 1 mM EDTA, 1x protease inhibitor (all from Sigma-Aldrich) and 0.01 U µl–1 benzonase (Novagen). The lysates were then sonicated (Bioruptor Pico sonicator, Diagenode) and cleared with centrifugation to remove cell debris. The supernatant was boiled together with Laemmli sample buffer, containing 100 mg ml–1 SDS, 250 mM Tris pH 6.8, 1 mg ml–1 bromophenol blue and 50% glycerol (all from Sigma-Aldrich), and loaded into 4–20% mini-Protean TGX precast protein gels (Bio-Rad). Protein was transferred to PVDF membranes (Bio-Rad) and blocked for 1 h. Primary antibodies: H3 (Abcam, 1791, 1:10,000); H3K9me3 (Abcam, 8898, 1:1,000). Secondary antibody: Goat, anti-rabbit-HRP-conjugated (Invitrogen, PI31460, 1:2,000). Proteins were detected using Immobilon western chemiluminescent HRP substrate (Millipore).
Statistical Analysis
One-way (1W) or two-way (2W) ANOVA with Tukey’s Honestly Significant Difference post hoc test or two-tailed t-test analysis was performed to evaluate statistical significance using JMP Pro12 software (SAS Institute). Displayed error (SD=standard deviation, SEM=standard error of the mean), number of individual data points (n), number of independent experiments (exp., if different from n), hypothetical population mean (HM, for single sample t-test), significances and statistical tests used are indicated in the figure captions. Boxplots are shown with all data points overlaid, a square representing the mean and whiskers indicating the data span under the exclusion of outliers (coefficient=3).
Extended Data
Extended Fig. 1: Determining the ratio of contractile CMs to non-contractile cells in embryonic cardiac cultures on substrates with different stiffness.
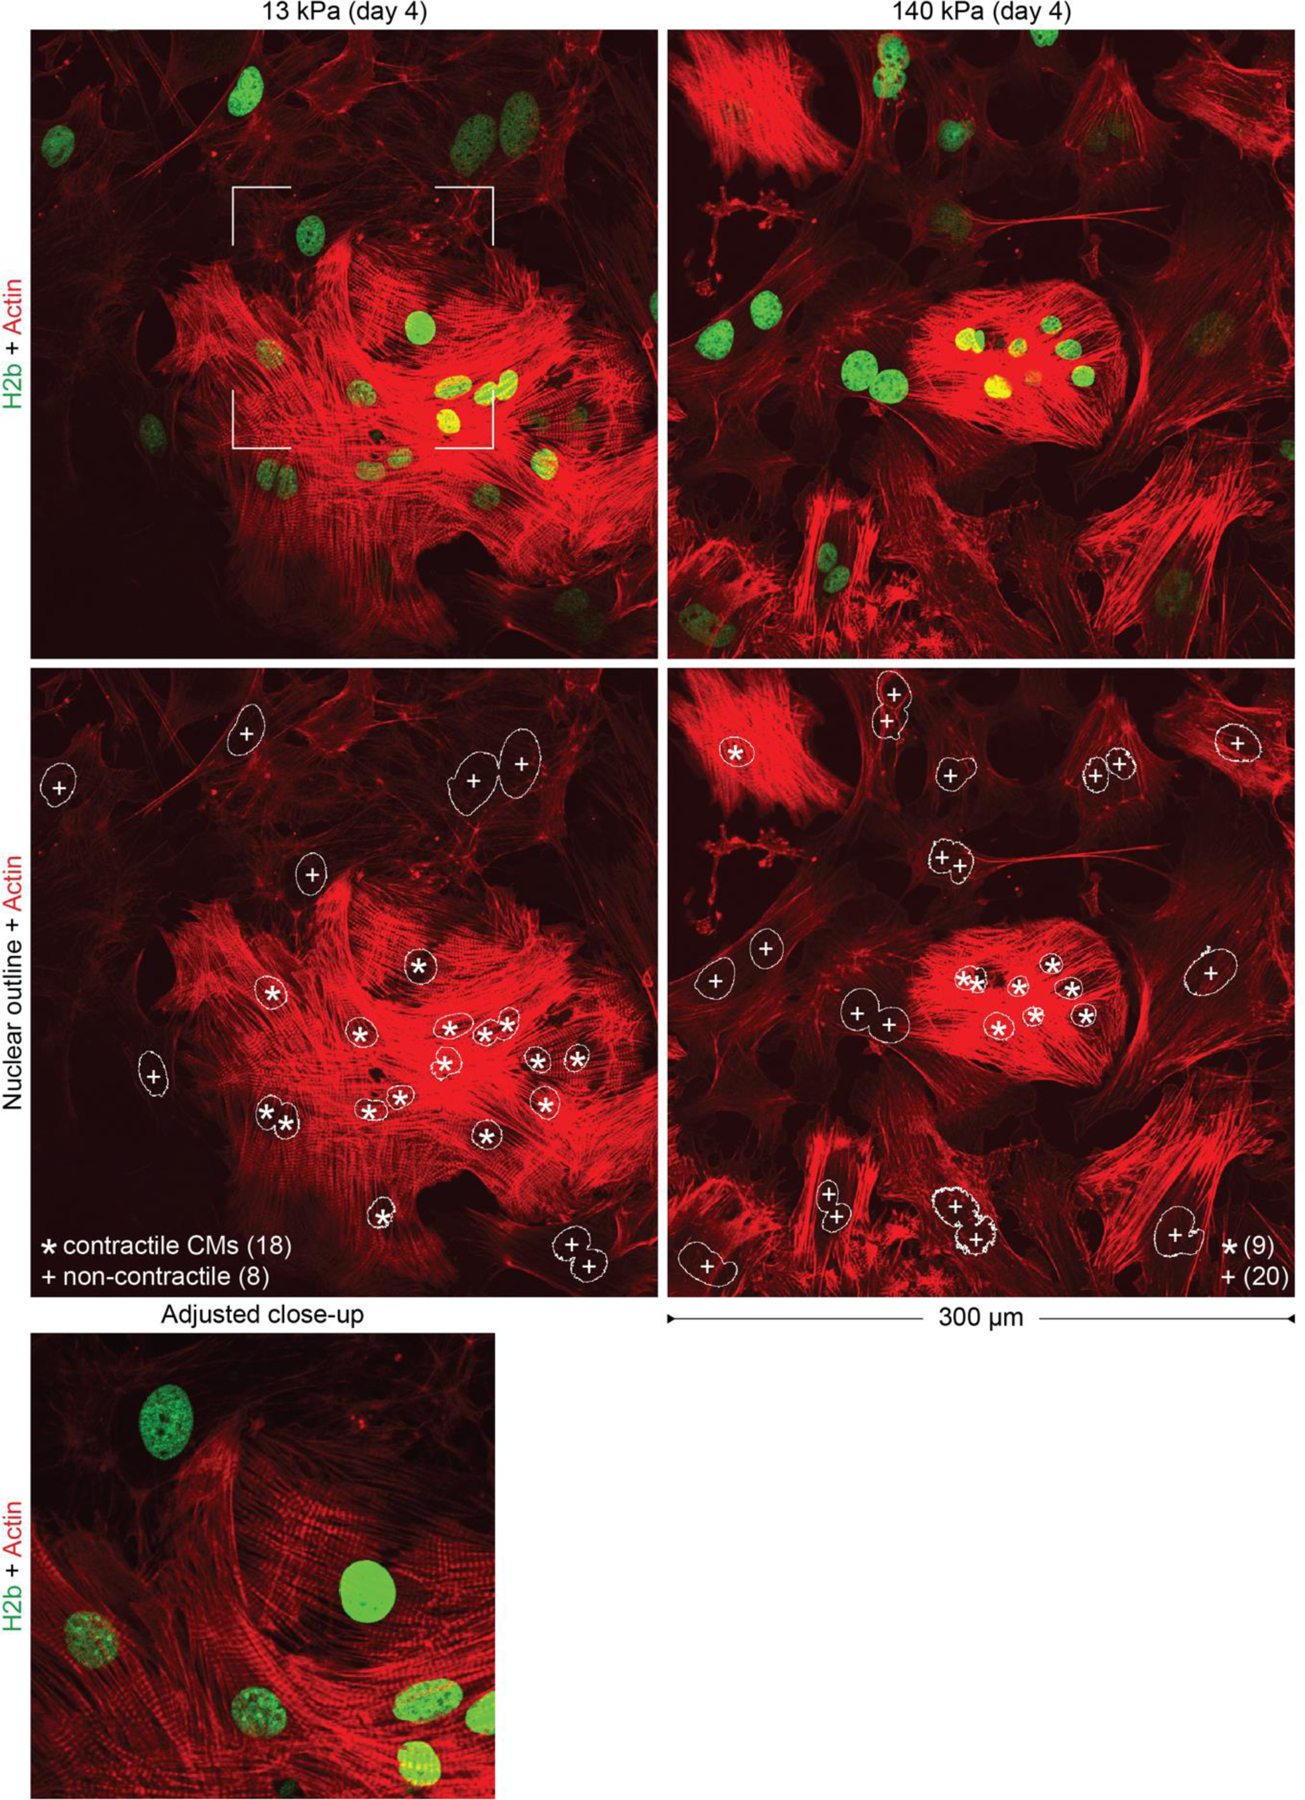
Embryonic cardiac cells were isolated from (E)18.5 H2b-eGFP embryo hearts and cultured on soft (13 kPa) or stiff (140 kPa) PDMS. After two or four days, cultures were stained for actin and images of 300×300 µm2 areas were acquired. Using cell nuclei as reference, cells with clearly formed striated myofibrils were counted as contractile CM (*) or otherwise as non-contractile cells (+). Close-up shows the area indicated by a rectangle in the upper-left frame with adjusted intensity settings to accentuate myofibril striations.
Extended Fig. 2. Stiff substrates reduce synchronization of calcium signaling, alter cell-ECM interaction pathways and inhibit stretch-activation of p130Cas in embryonic CMs.
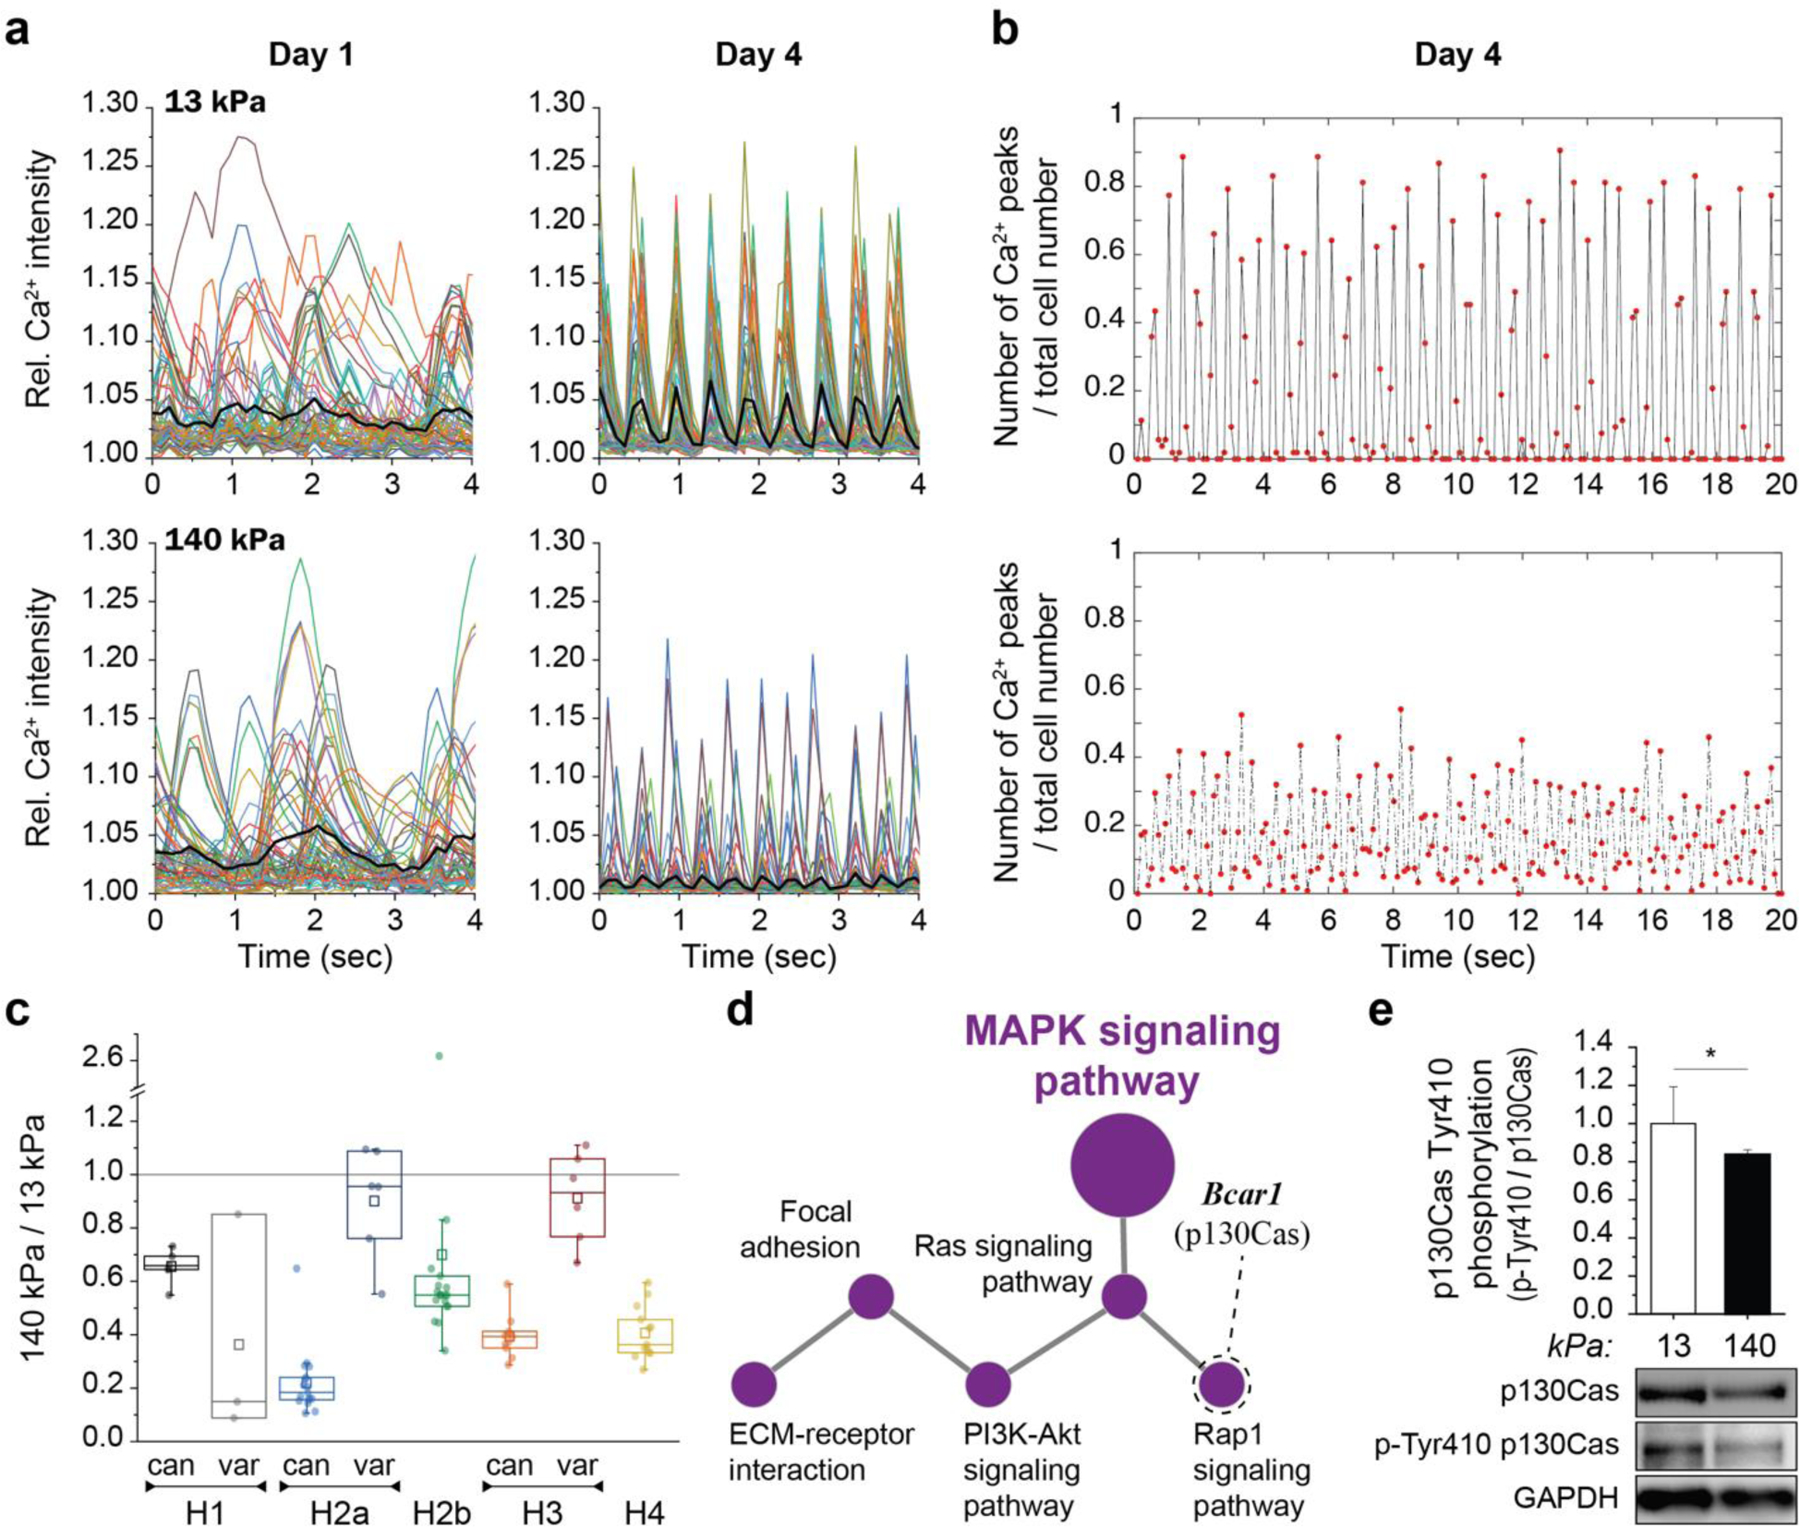
a) Embryonic CMs (day E18.5) from H2b-eGFP mice were plated on either soft (13 kPa) or stiff (140 kPa) PDMS substrates for up to four days. At each day, a sample was stained with Fluo4 AM to record Ca2+ activity as a proxy for CM contractility. b) Synchronicity was calculated as the average of the relative number of cells that beat together over a 20 second time window. c) Detailed analysis of histone family expression from RNAseq data of CMs plated on soft or stiff PDMS for four days (relative RPKM). d) Network analysis of global gene expression change revealed alterations in MAPK signaling and associated pathways that play a role in cell-substrate interaction. Rap1 signaling included the downregulation Bcar1 coding for p130Cas, a mechanosensitive protein located within the Z-disk lattice in CMs. e) Western blot analysis showed a reduction of stretch-induced tyrosine-410 phosphorylation of p130Cas on stiff PDMS compared to soft. SD; n=3; T-test: * p<0.05.
Extended Fig. 3. Contractile CMs and non-contractile cells show differences in the positioning of H3K9 trimethylated chromatin in vitro.
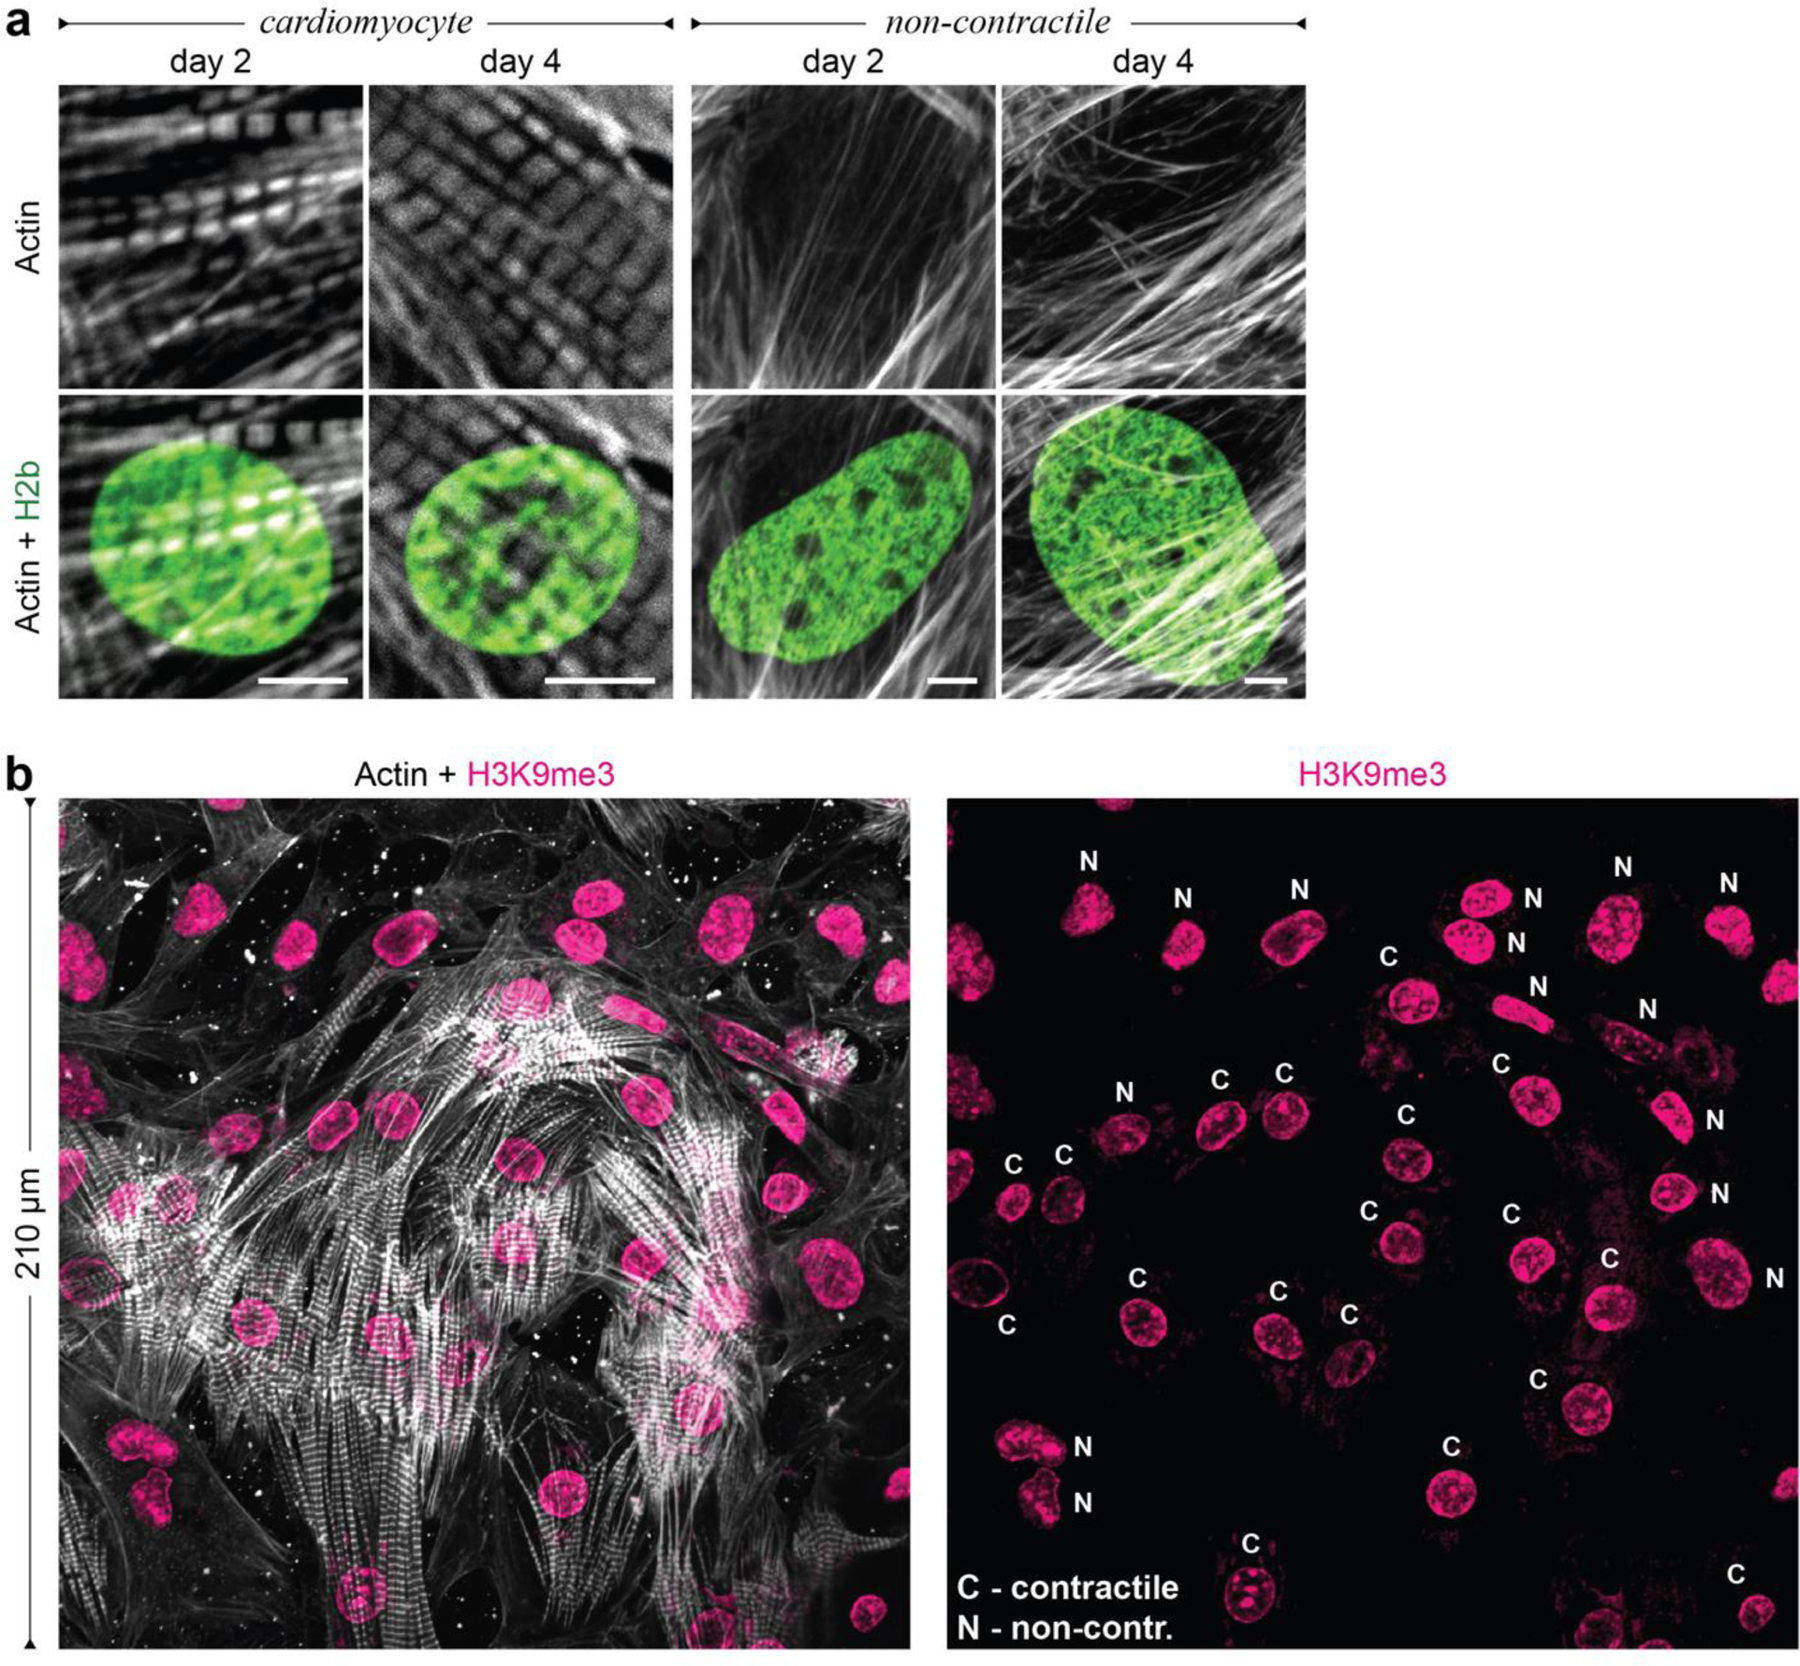
Embryonic cardiac cells were isolated from (E)18.5 H2b-eGFP embryo hearts and cultured on soft (13 kPa) PDMS substrates. a) Actin staining corresponding to the data from Fig. 3b to distinguish contractile CMs from non-contractile cells (NCC) via the formation of myofibrils; scales=5 µm. b) After two days in culture, contractile CMs (C) with clearly formed myofibrils showed enrichment of H3K9me3-marked chromatin at the nuclear border while actin-fiber forming NCCs (N) showed a more homogenous distribution throughout the nuclear interior.
Extended Fig. 4. Effect of stiff mechanical environments on chromatin organization in non-contractile cells in vitro.
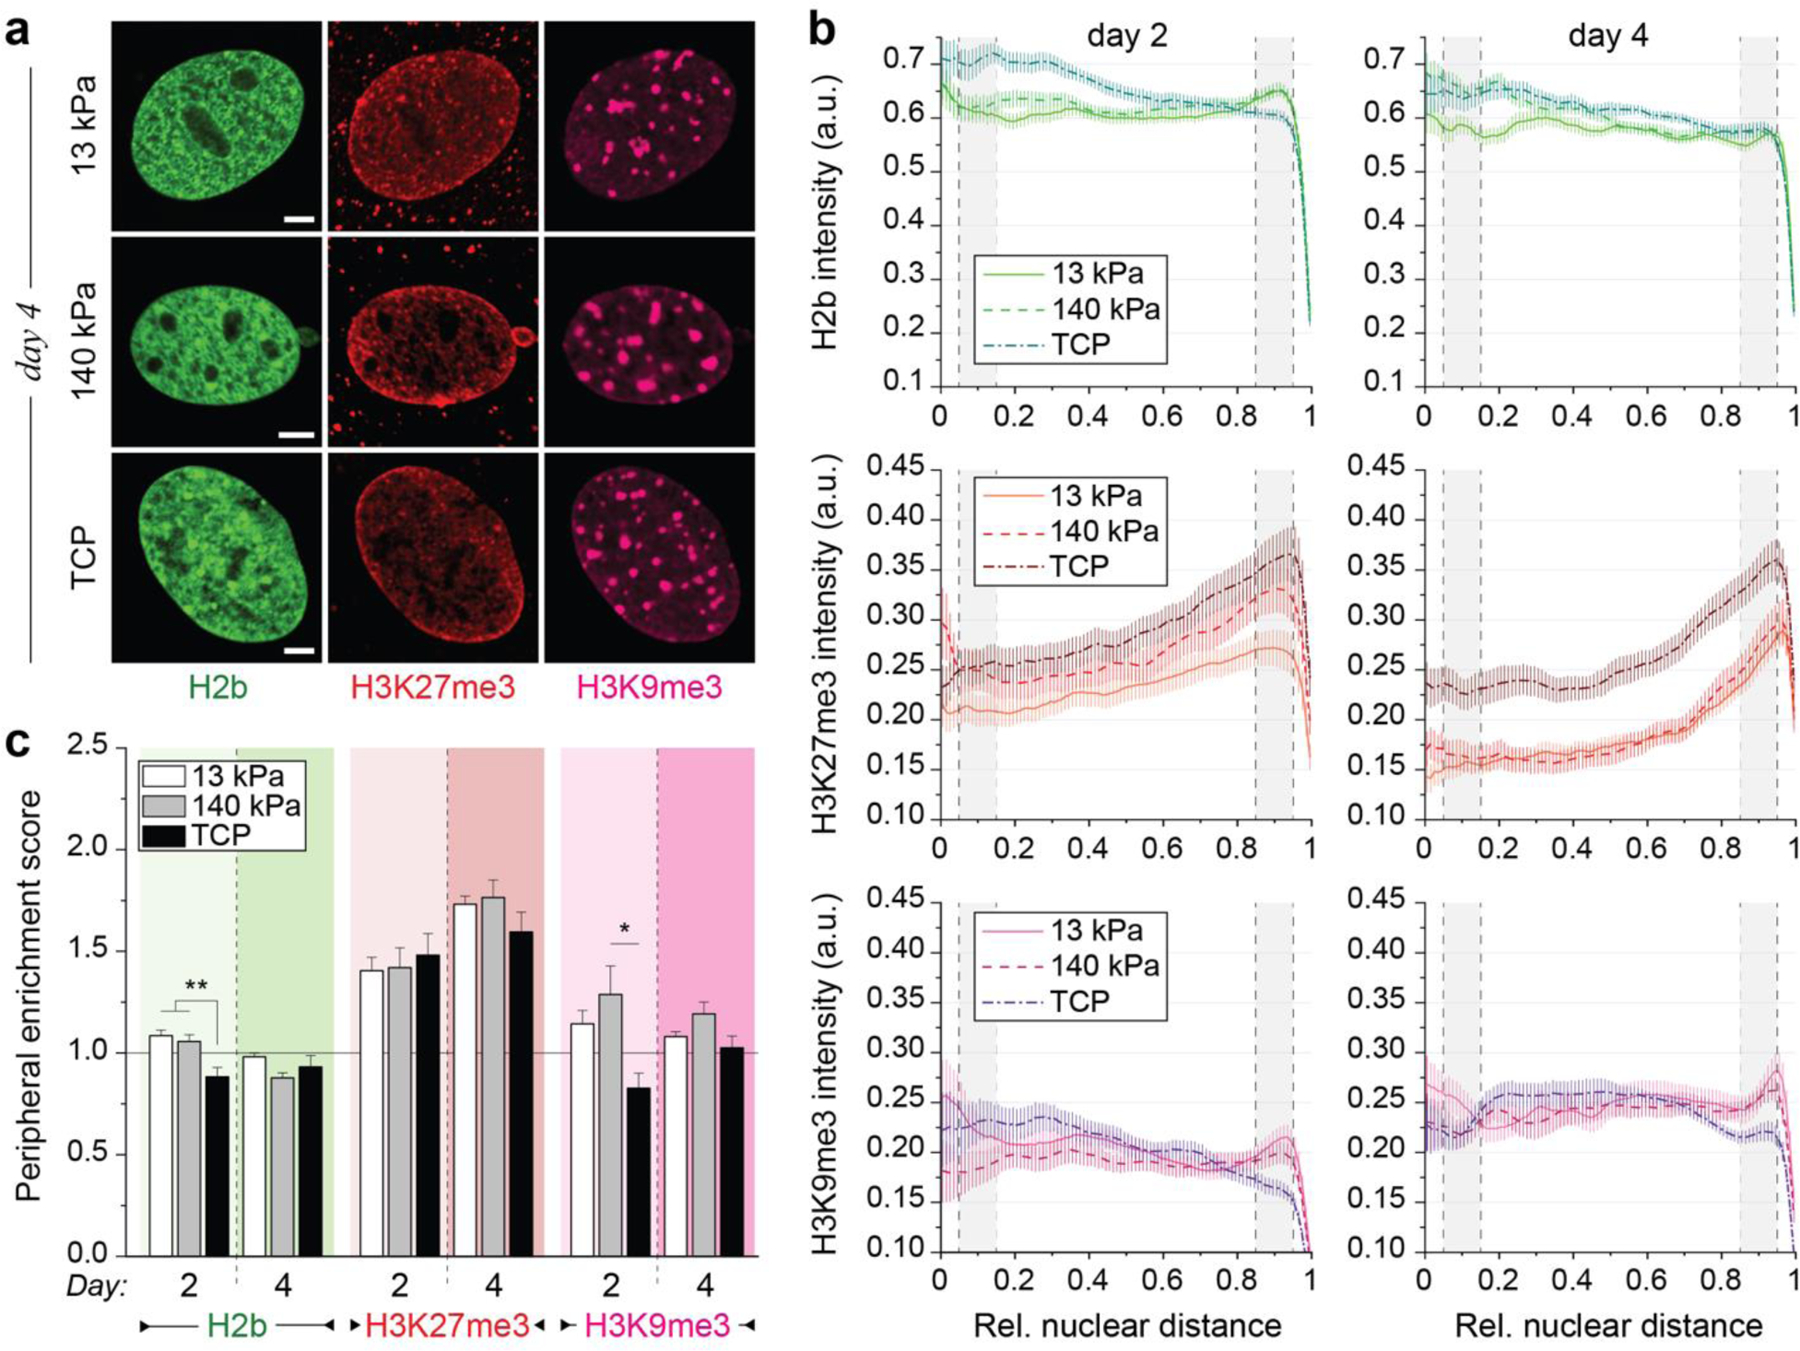
a) Embryonic cardiac cells were isolated from (E)18.5 H2b-eGFP embryo hearts and cultured on either soft (13 kPa) PDMS, stiff (140 kPa) PDMS or TCP for two or four days after which cells were stained for H3K27me3 and H3K9me3 as well as actin to distinguish non-contractile cells (NCCs) from CMs. Scales=5 µm. b) NCC nuclei were evaluated for peripheral enrichment (0=center, 1=periphery) of overall chromatin (H2b) or epigenetically marked chromatin. Gray areas indicate center and peripheral bin; SEM; n≥30 from 3 exp. c) Enrichment scores for each chromatin marker were calculated as the quotient of intensity of the peripheral bin (0.85–0.95) divided by the center bin (0.05–0.15). Substrate stiffness only minorly affected chromatin organization and enrichment of overall and H3K9me3-marked chromatin remained low while enrichment of H3K27me3-modified chromatin remained high throughout the four-day culture period. SEM; n≥30 from 3 exp.; 1W-ANOVA: * p<0.05, ** p<0.01.
Extended Fig. 5. Histology and additional correlation data for human cardiomyopathy patients.
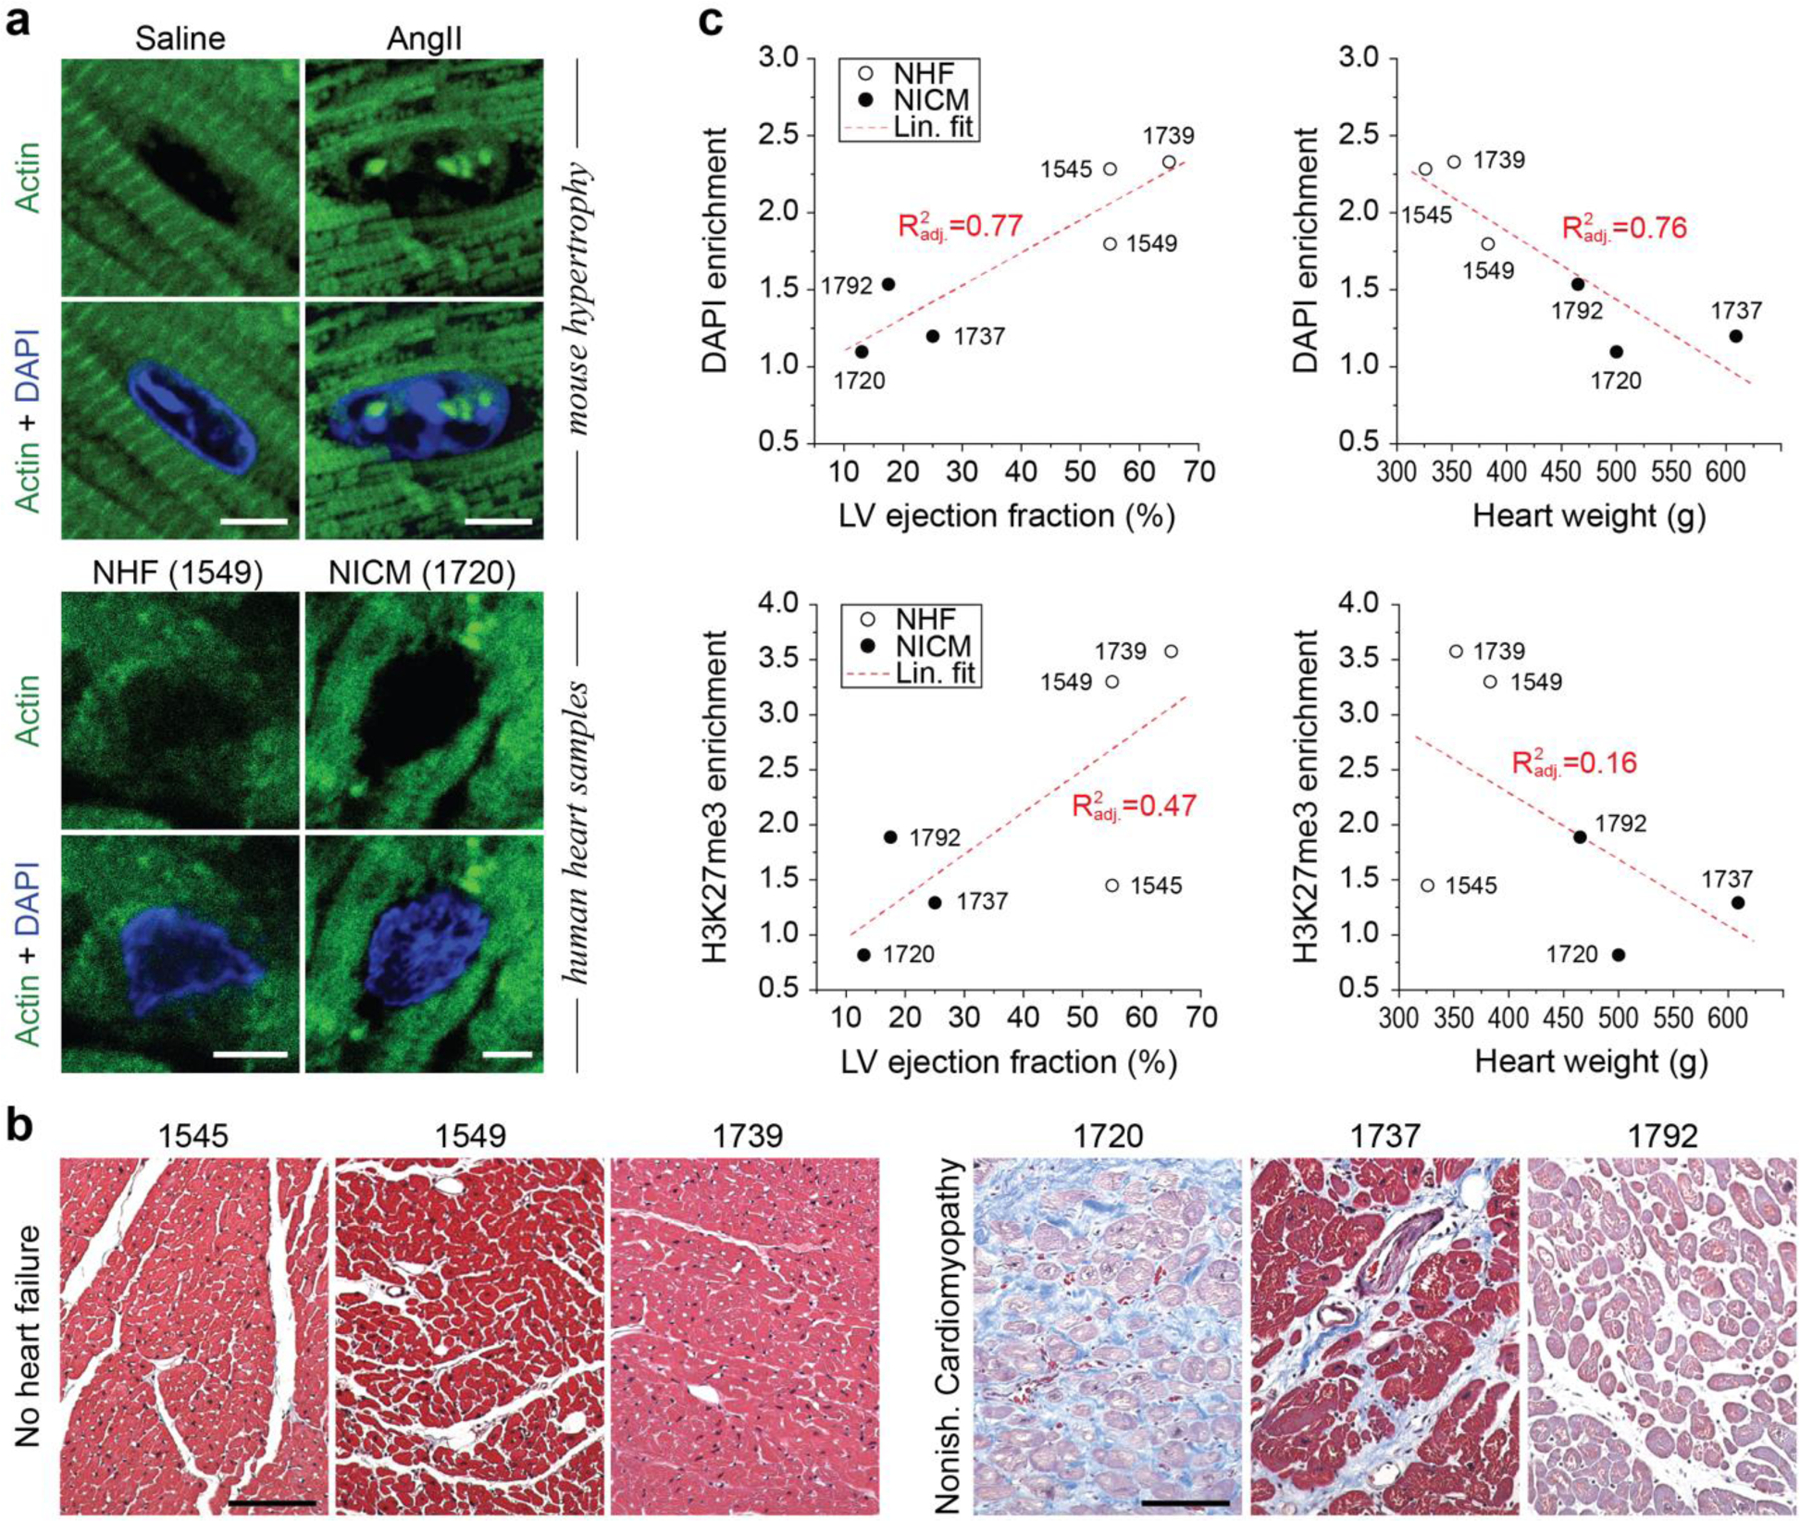
a) Actin staining corresponding to the data from Fig. 5b for hypertrophic mice and Fig. 5g for human patients. Scales=5 µm. b) Masson’s trichrome staining of transmural cardiac tissue samples from human patients. Muscle tissue shown in red while collagen stains blue. Patients with nonischemic cardiomyopathy (NICM) show increased collagen deposition. Scales=100 µm c) Peripheral enrichment scores of DAPI and H3K27me3 were correlated with indicators of cardiac health. R2adj.=adjusted correlation coefficient.
Extended Fig. 6: Stiff substrates reduce myofibril contractility in embryonic CMs.
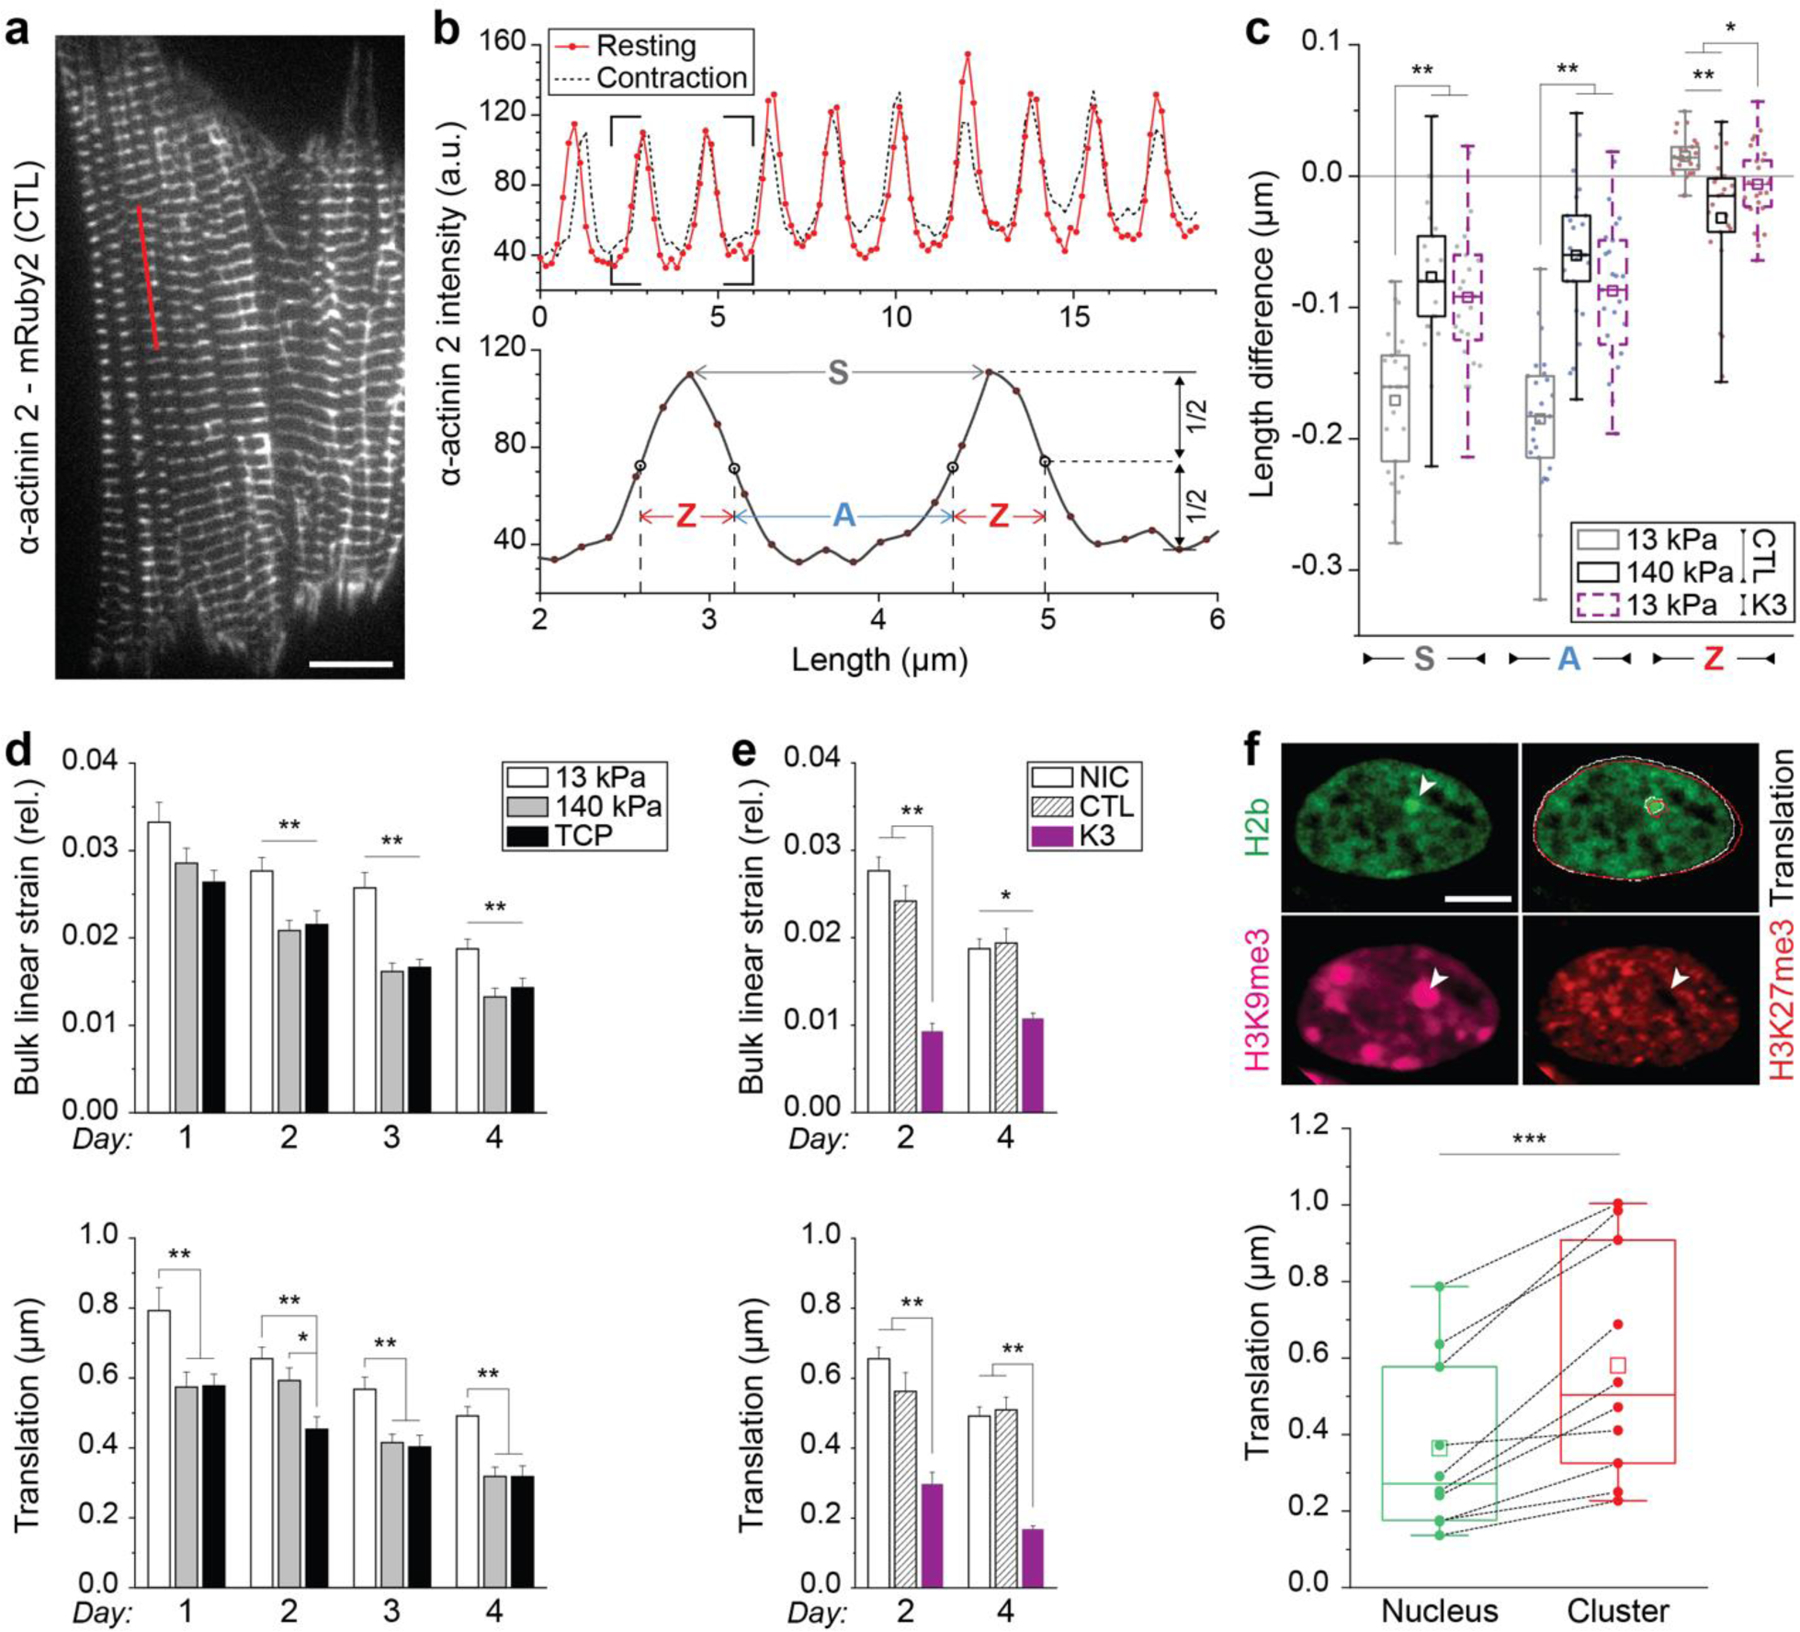
a) CMs were infected with the adenoviral decoupling vector K3 (see Fig. 6a) or control vector CTL (shown) on day one and image series of myofibril contraction were recorded on day two via fluorescently tagged α-actinin 2. See also Videos 1-3. Scale=10 µm. b) Top: α-actinin 2 intensity profile, as indicated by a red line in c), before (resting) and during contraction. Bottom: Close-up of two intensity peaks. Analysis of intensity profiles was used to determine the difference in length of overall sarcomeres (S), A-bands (A) and Z-disks (Z) during contraction. c) Control infected CMs on stiff PDMS (140 kPa, CTL) and decoupled CMs on soft PDMS (13 kPa, K3) showed inhibited contraction as overall sarcomere and A-band shortening as well as Z-disk extension was abrogated compared to control infected CMs on soft PDMS (13 kPa, CTL); n=25 from 5 exp.; 1W-ANOVA: * p<0.05, ** p<0.01. d) Image series of CM nuclei cultured on either soft (13 kPa) PDMS, stiff (140 kPa) PDMS or TCP were recorded during contraction and bulk linear strain and translational movement of nuclei were determined over four days. Nuclei of CMs cultured on soft substrates showed higher bulk linear strain and translational movement compared to stiff PDMS and TCP; SEM; n>44 from 4 exp.; 1W-ANOVA: * p<0.05, ** p<0.01. e) Bulk linear strain and translational movement of CM nuclei were determined after LINC disruption on day two (24h post infection) and day four. Decoupled nuclei (K3, n=32) showed lower bulk linear strain and translational movement compared to cells infected with the control vector (CTL, n=32) or non-infected control cells (NIC, n=67); SEM; from 4 exp.; 1W-ANOVA: * p<0.05, ** p>0.01. f) Image stacks of beating CM nuclei were recorded on day two after which cells were stained for H3K9me3 and H3K27me3. Analysis of the translational movement of the nucleus and of dense, H3K9me3-rich heterochromatin clusters showed, that movement was higher for intra-nuclear heterochromatin than bulk movement of their respective nuclei during contractions. White and red outlines indicate nuclear and cluster boundary during rest and peak contraction, respectively; n=10 from 3 exp.; T-test: *** p<0.001; scale=5 µm.
Extended Fig. 7: Colocalization of chromatin markers with myofibrils in CMs and emerin localization in the outer nuclear membrane.
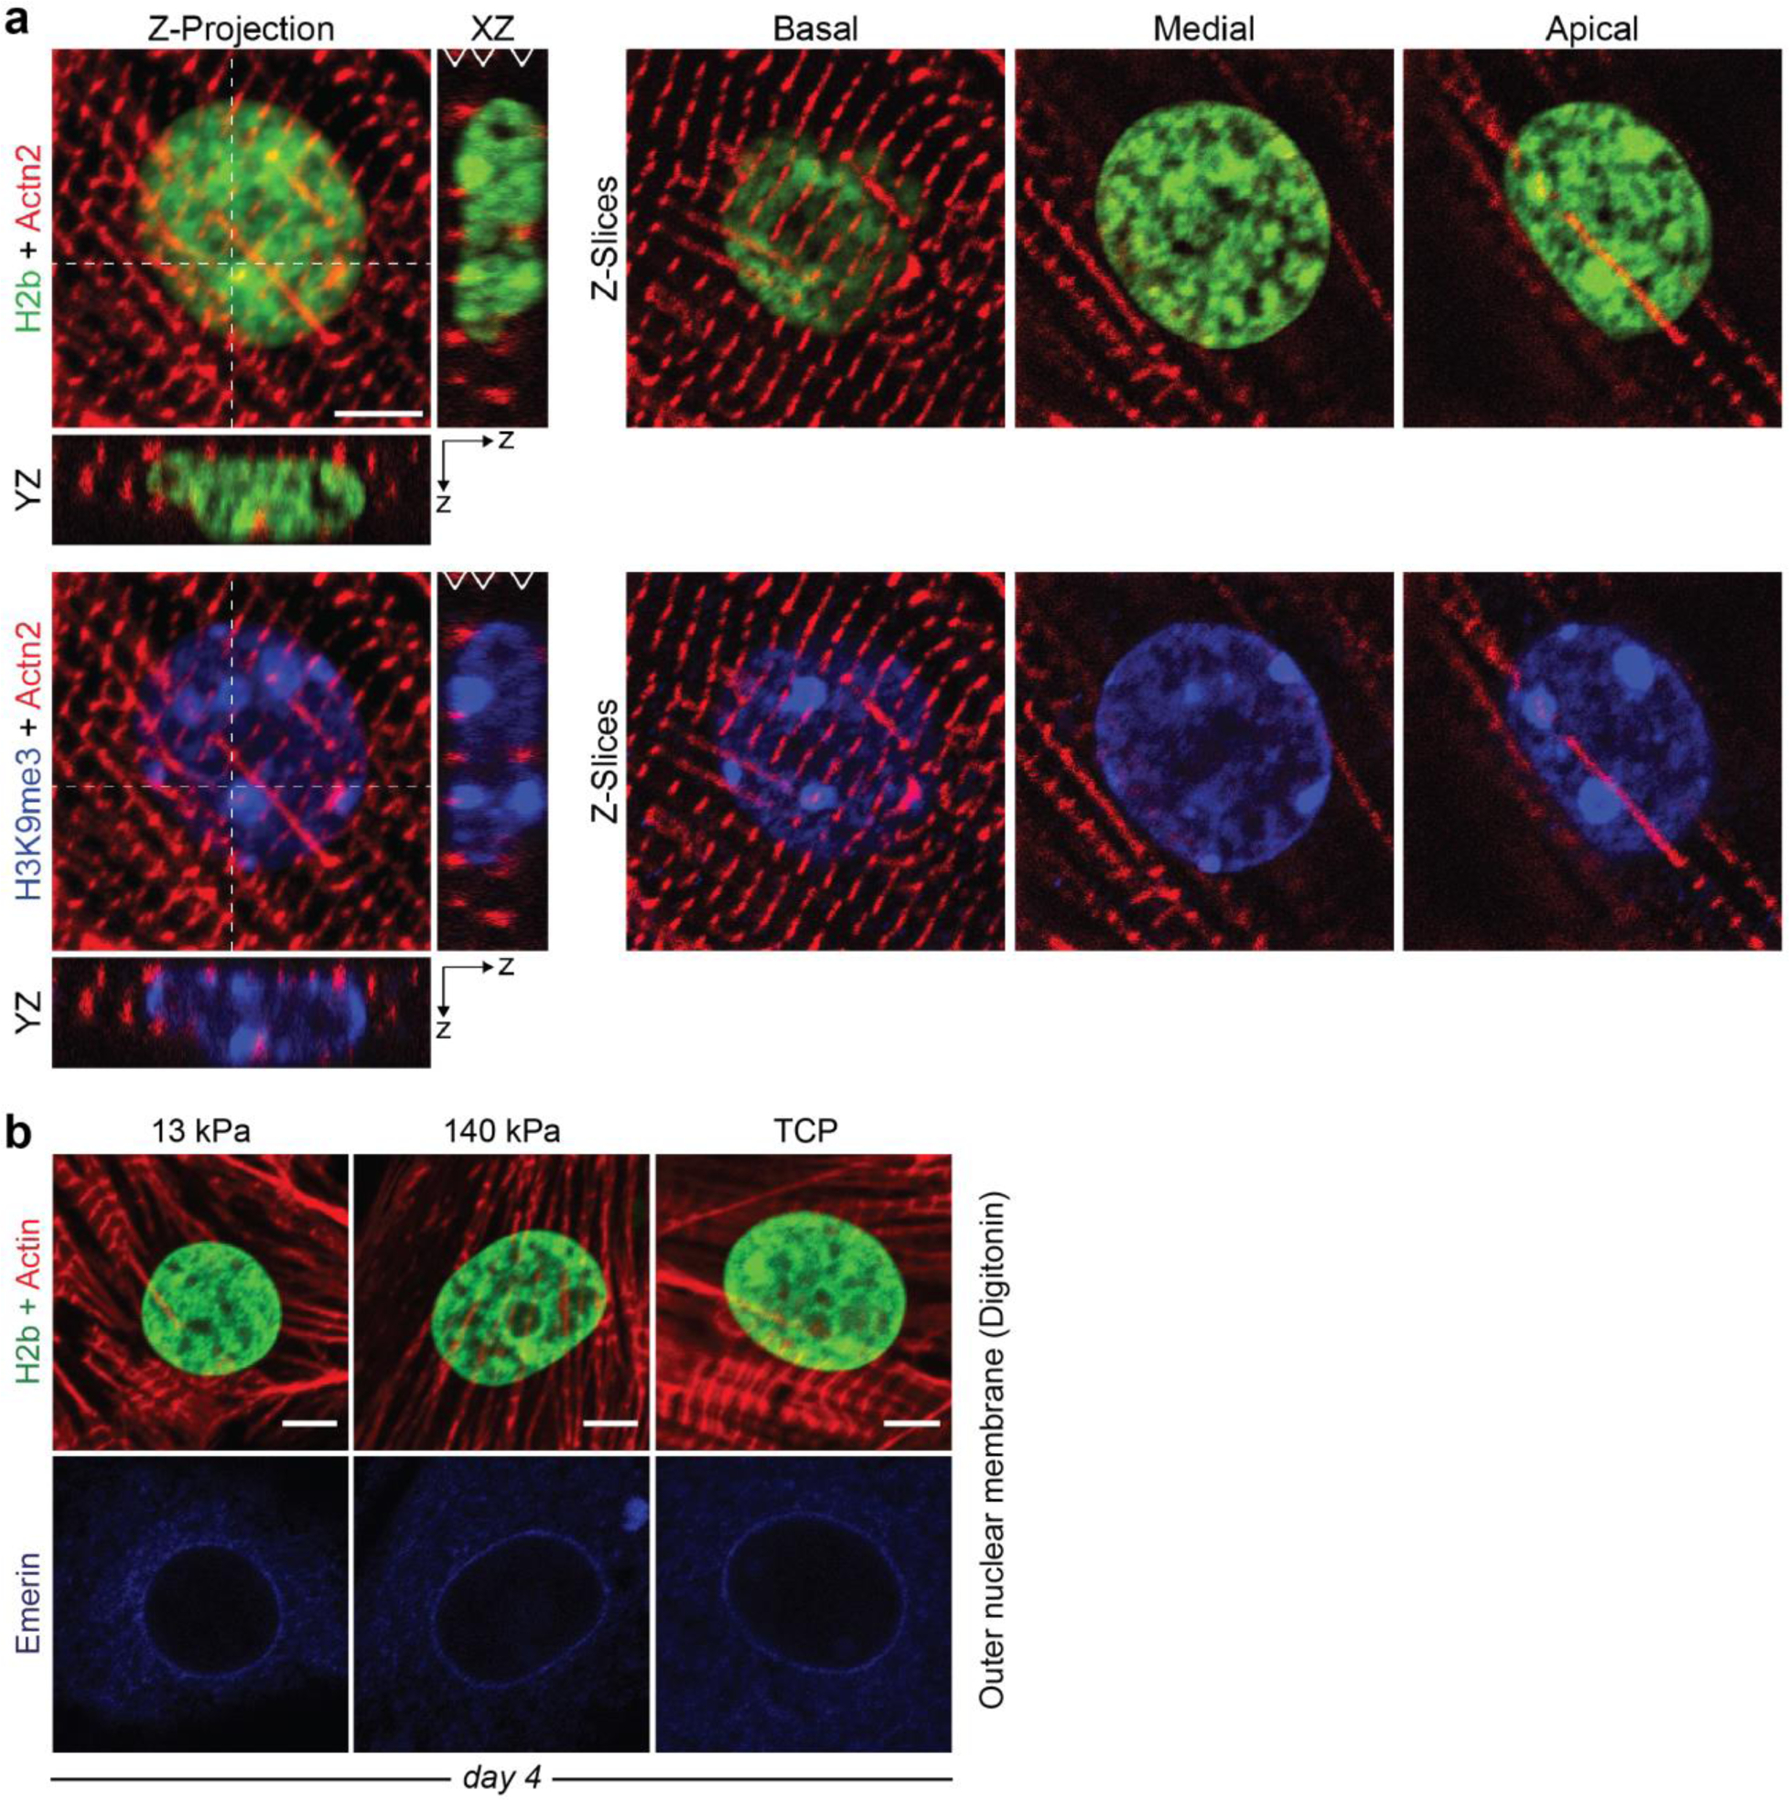
a) Embryonic cardiac cells from day 18.5 H2b-eGFP mice were cultured for four days after which they were stained for different markers and z-stacks were recorded on a confocal microscope. Left: Z-projection as well as XZ and YZ slices along white dashed lines for a CTL infected CM. Right: Panels show representative z-slices at different z-positions (basal, medial, apical) indicated by white arrows in the XZ projection. Basal z-slices were used for marker overlap analysis. b) After four days in culture soft (13 kPa) or stiff (140 kPa) PDMS or TCP, CMs were stained for emerin using digitonin to selectively permeabilize the cell membrane but not the nuclear membrane. Emerin localization at the outer nuclear membrane was similar for all substrates; scales=5 µm.
Extended Fig. 8: Extended analysis of intranuclear strains during CM contraction.
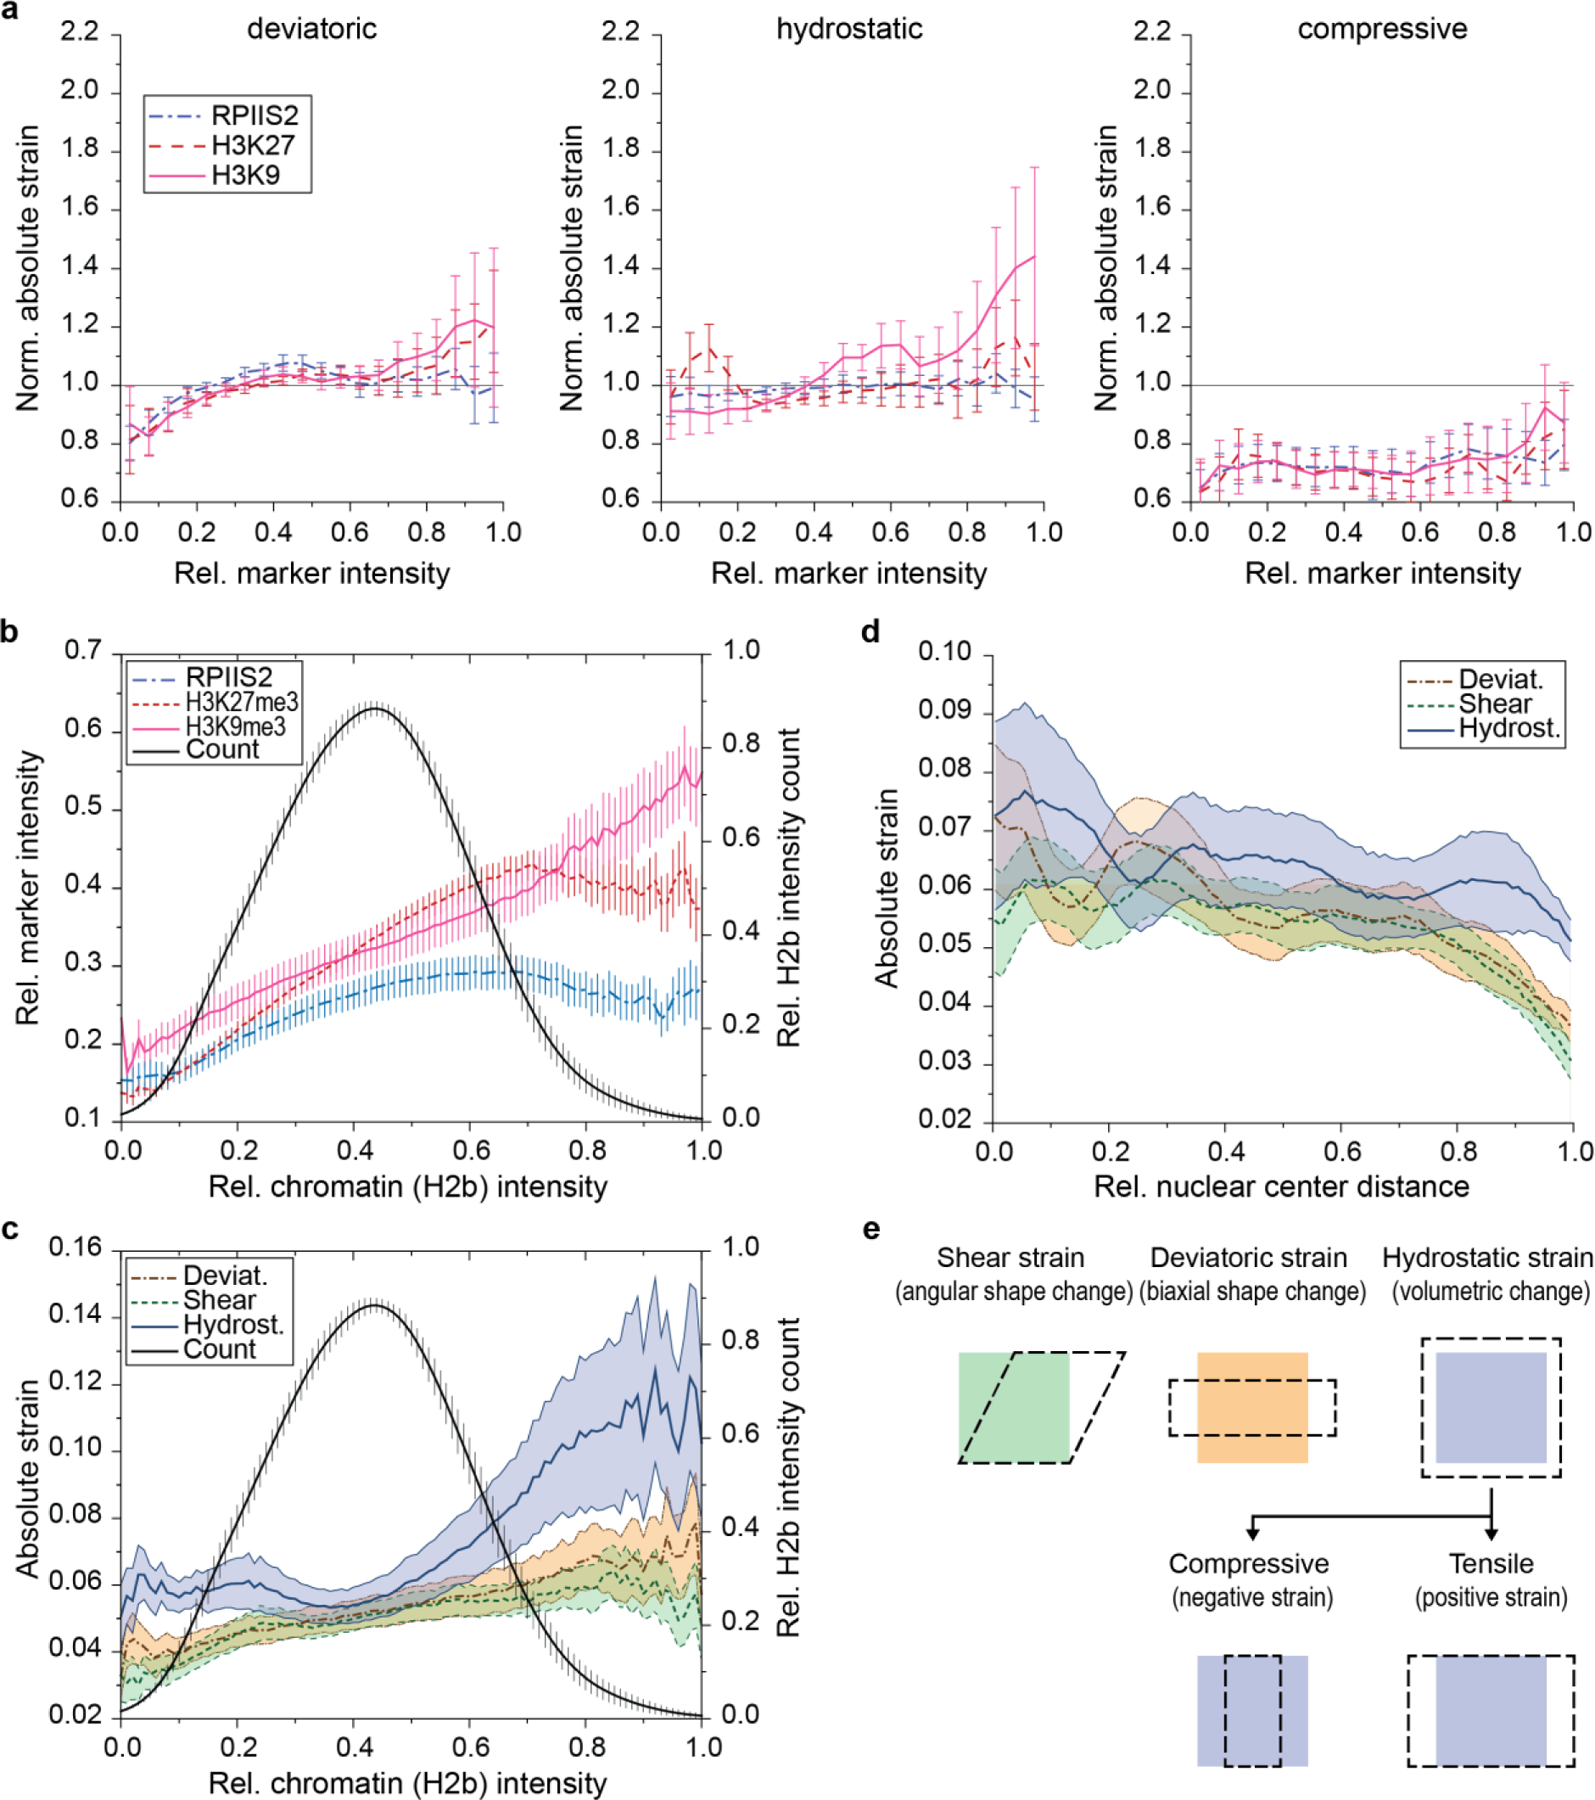
Embryonic CMs were cultured on soft (13 kPa) PDMS for two days. Intranuclear strain maps of CM nuclei during contraction were generated via deformation microscopy after which cells were stained for H3K9me3, H3K27me3 or actively transcribed chromatin (RPIIS2) and strain occupancy for chromatin markers was analyzed (see Fig. 7). a) Intranuclear strains were analyzed over chromatin marker intensities. b, c) Intranuclear strains and chromatin marker intensities were analyzed independent of each other with respect to chromatin density as judged by H2b intensity. Chromatin density distribution (histogram) is represented as relative count on the right y-axis. Hydrostatic strains are lowest around medium chromatin density (density histogram peak) and increases for denser chromatin which is primarily occupied by H3K9me3 modifications. SEM; n=20 from 5 exp. d) Intranuclear strains were analyzed over distance to the nuclear center. Strains declined towards the nuclear border, excluding the possibility of increased strain association of H3K9me3-marked chromatin due to its proximity to the periphery. e) Visual representation of different strain types.
Extended Fig. 9: H3K9 trimethylated chromatin occupancy peaks in the direction of contraction in nuclei with tensile loading mode.
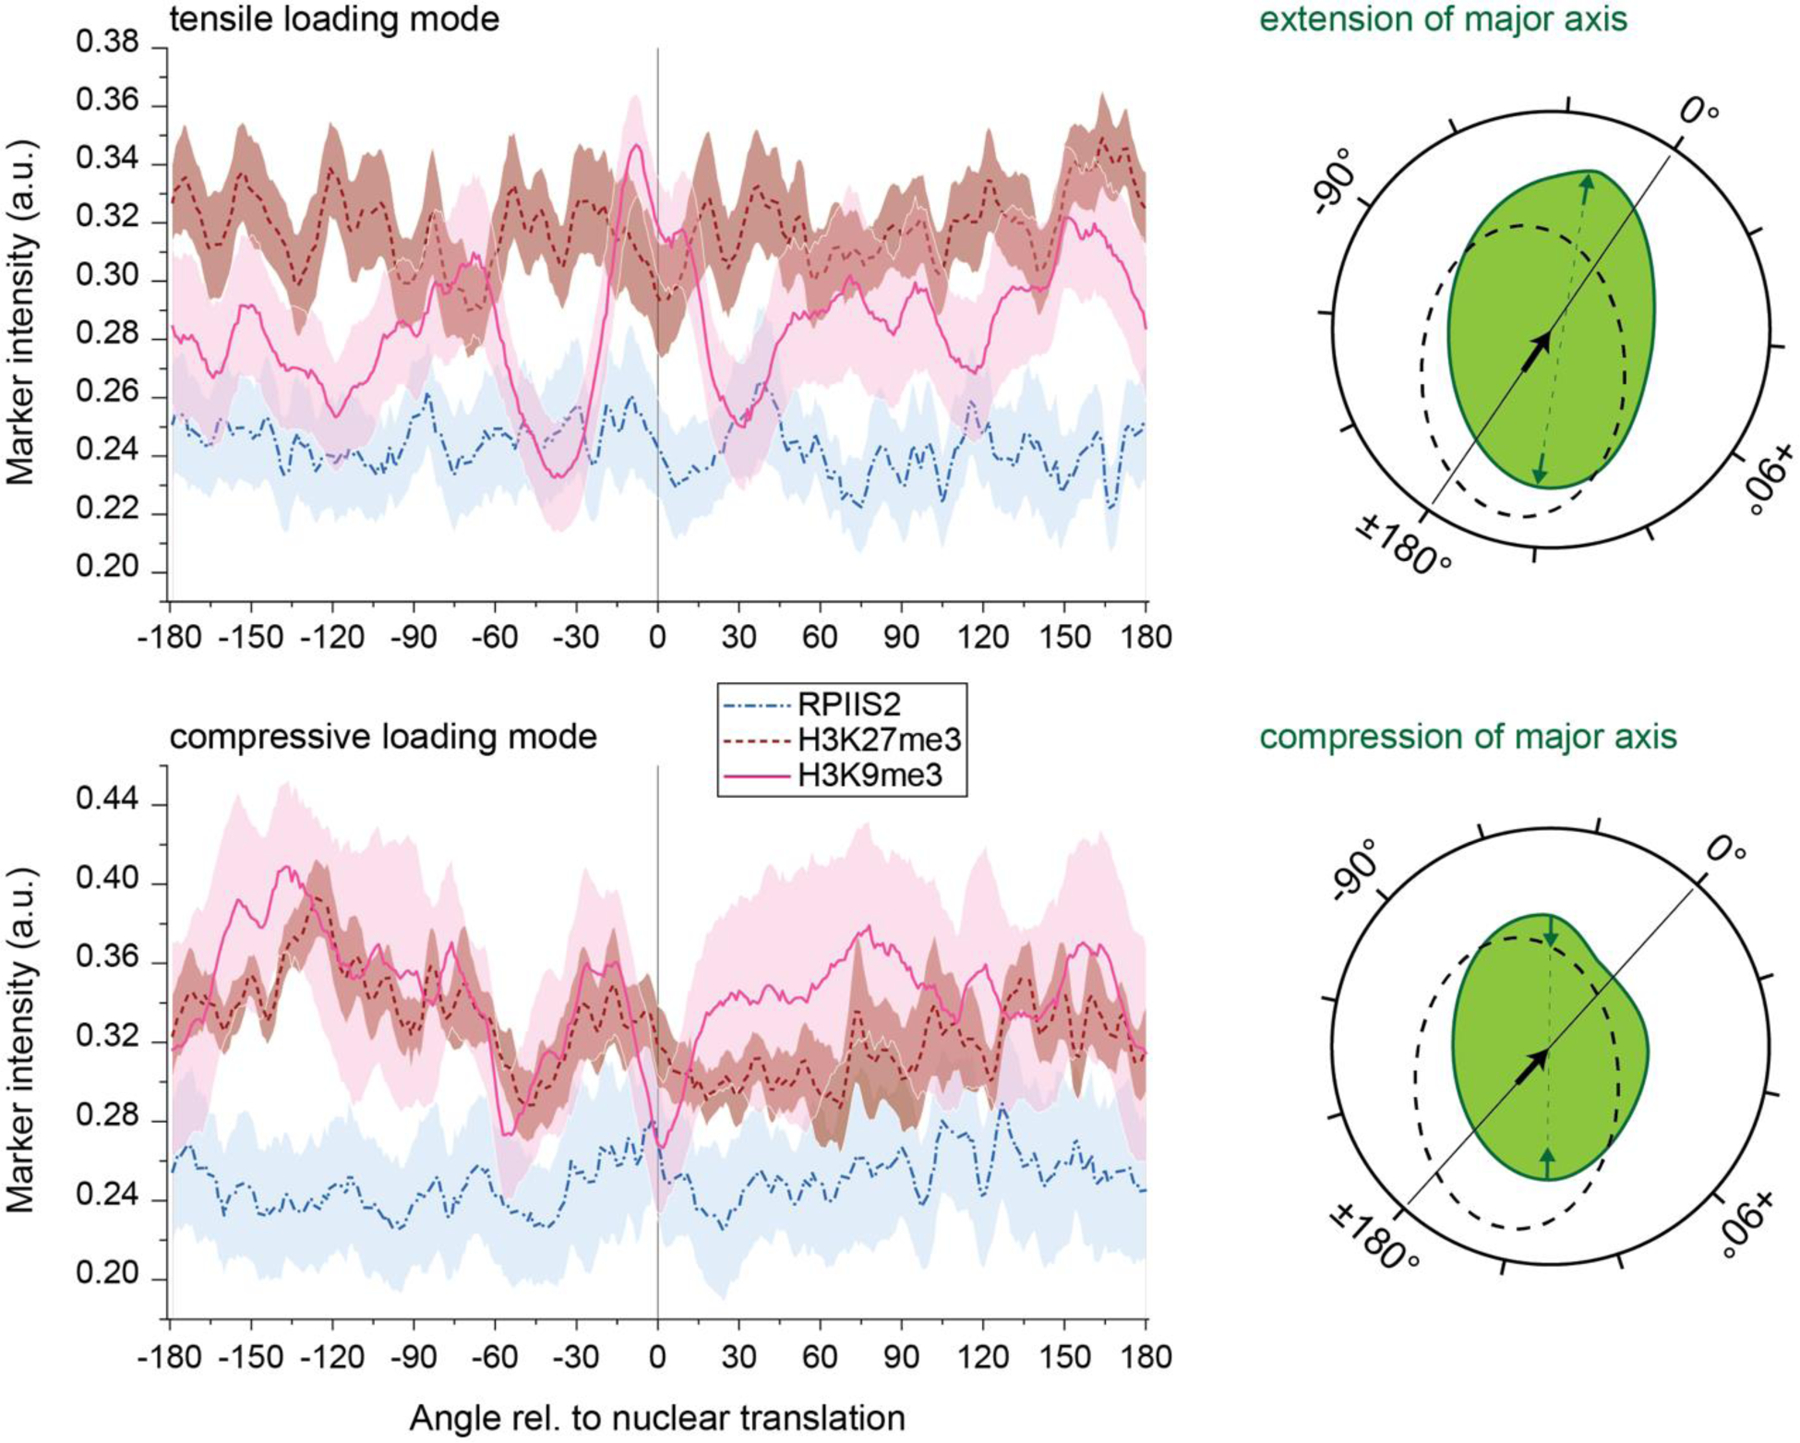
Embryonic CMs were cultured on soft (13 kPa) PDMS for two days after which image stacks of CM nuclei were recorded during contractions to determine the direction of nuclear translation. Cells were then stained for chromatin markers H3K9me3, H3K27me3 or actively transcribed chromatin (RPIIS2). Chromatin marker occupancy was calculated with respect to the angle of the nuclear center with the angle of nuclear translation set to 0°. Cells with extended major axis during contraction (tensile loading mode, n=20, same as intranuclear analysis) showed a distinct peak of H3K9me3 intensity ±30° around the direction of translation while a decline in H3K9me3 intensity was observed for cells with shortened major axis (compressive loading mode, n=8). Right side provides a graphic illustration of angular analysis showing nuclear outlines during resting phase (doted black) and peak contraction (solid green). The black arrow indicates the direction of translation, which defines the 0° point, and green arrows demonstrate extension or compression of the nuclear major axis used to determine the loading mode of cells; areas=SEM; from 5 exp.
Extended Fig. 10: LINC complex disruption in CMs.
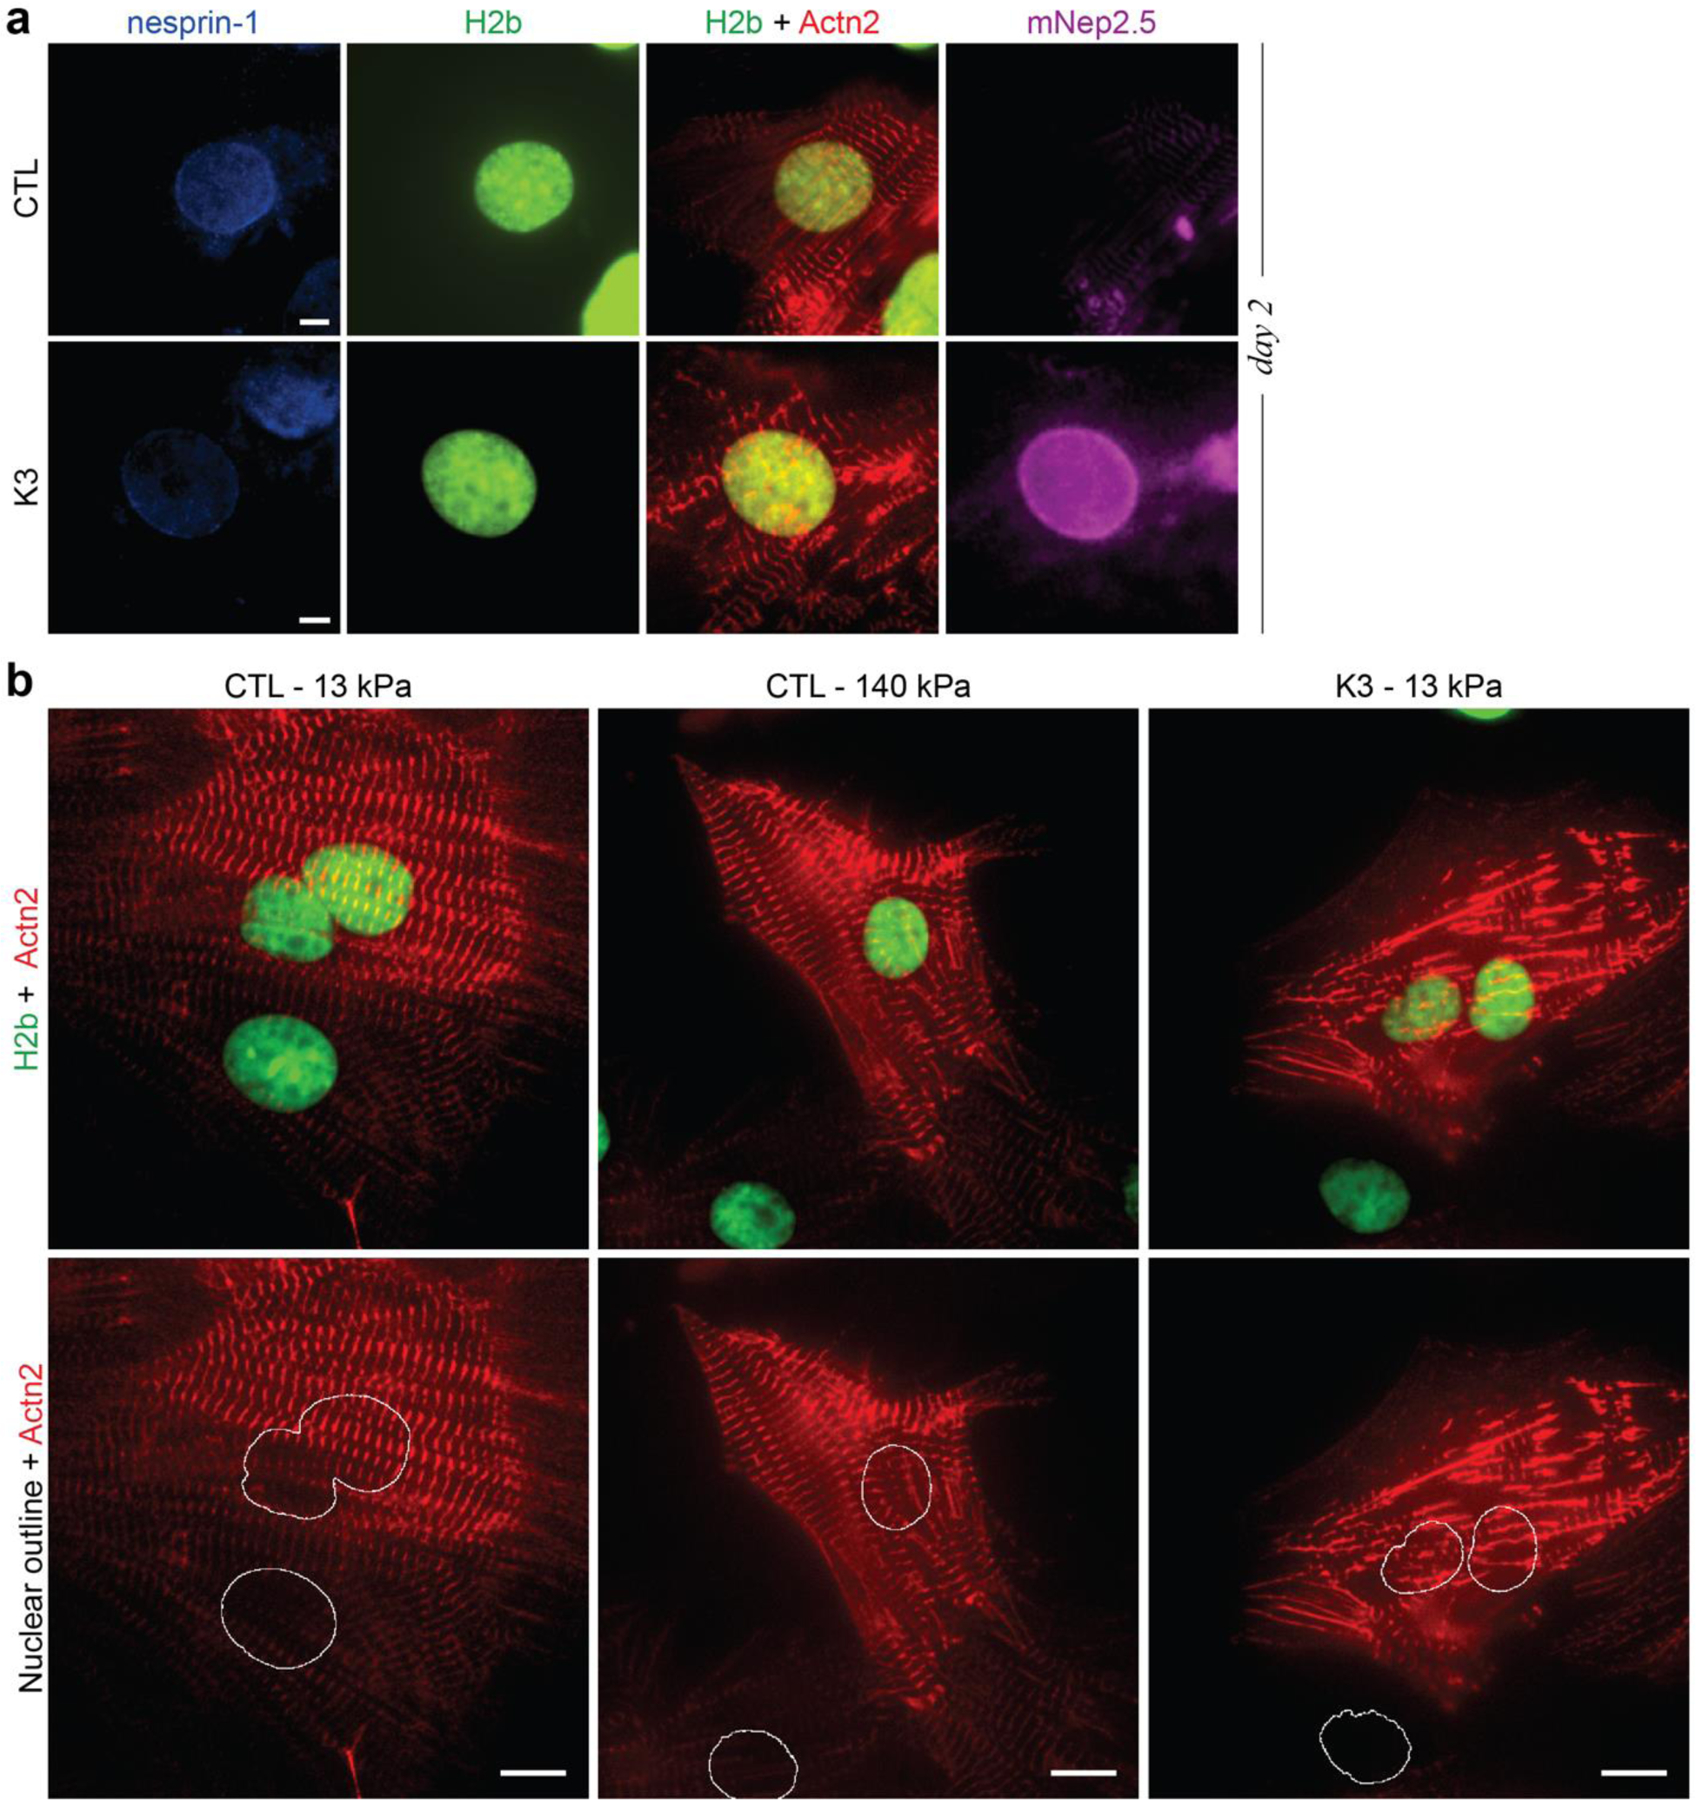
a) On day one of culture (24h after seeding), CMs were infected with an adenoviral vector that disrupted LINC connections (K3) or a control vector (CTL). 24h post infection, CMs were fixed and stained for nesprin-1 after which widefield images were acquired. The decoupling vector showed successful integration of the truncated nesprin construct (mNep2.5) into the outer nuclear membrane while no distinct localization was observed for the control vector. Decoupled cells showed disrupted myofibril formation, particularly around the nucleus, and diminished presence of nesprin-1 at the nuclear membrane; scales=5 µm. b) Images of infected cells plated on either soft (13 kPa) or stiff (140 kPa) PDMS. Decoupled cells show disrupted sarcomere fibers, particularly around the nucleus. Cells correspond to Extended Videos 1-3; scales=10 µm.
Extended Fig. 11: LINC complex disruption in CMs.
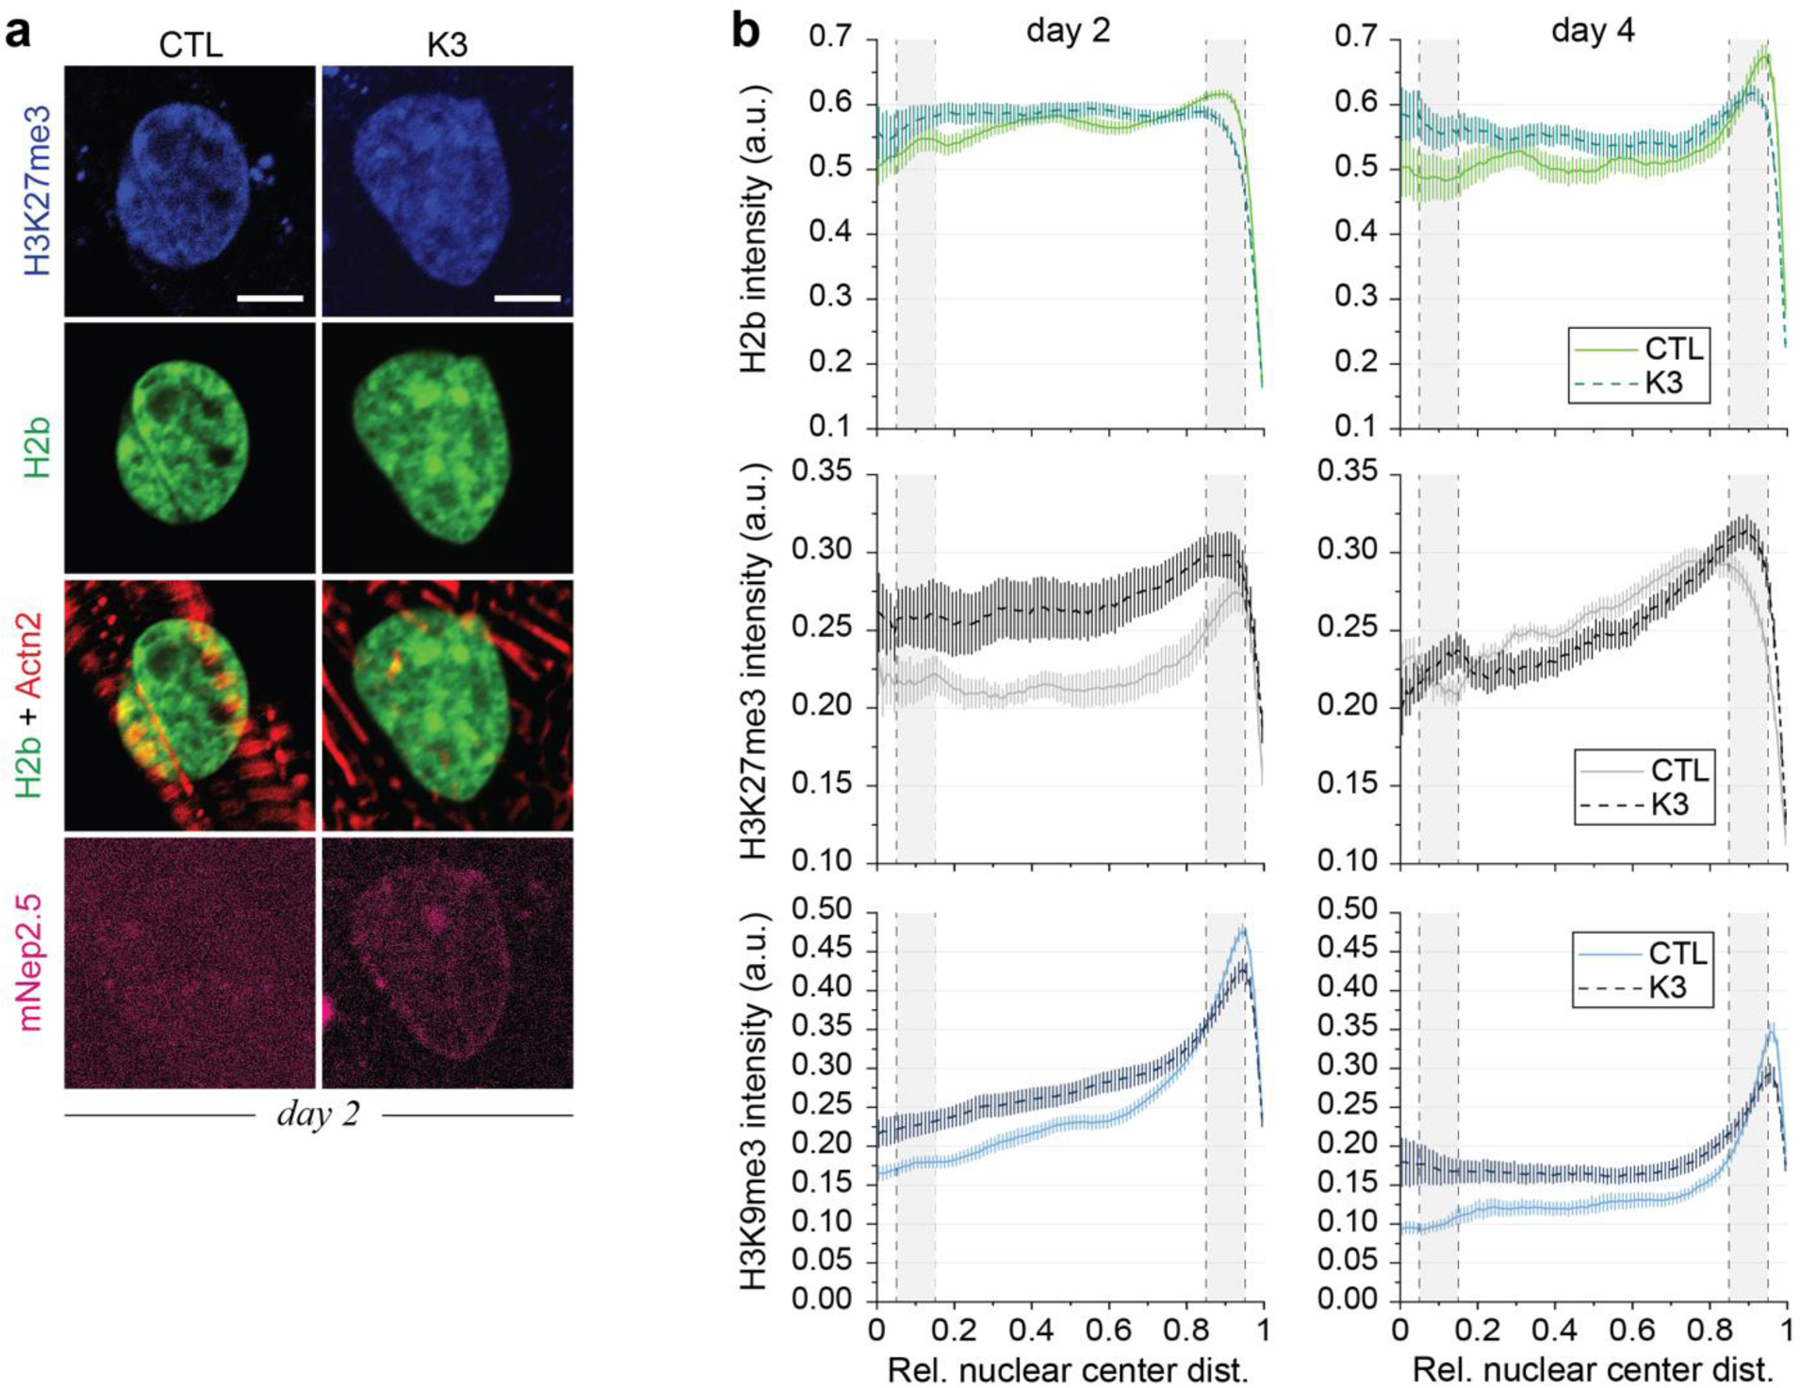
Embryonic cardiac cells were isolated and cultured on soft (13 kPa) PDMS. CMs were infected at day 1 and stained for actin and H3K27me3 on day two (shown) and day four. Decoupled cells (K3) showed abolished enrichment of overall and H3K9me3-marked chromatin compared to infected control cells (CTL) while H3K27me3-marked chromatin was similarly enriched (see also Fig. 6); scales=5 µm.
Extended Fig. 12. Colocalization of chromatin markers after LINC disruption.
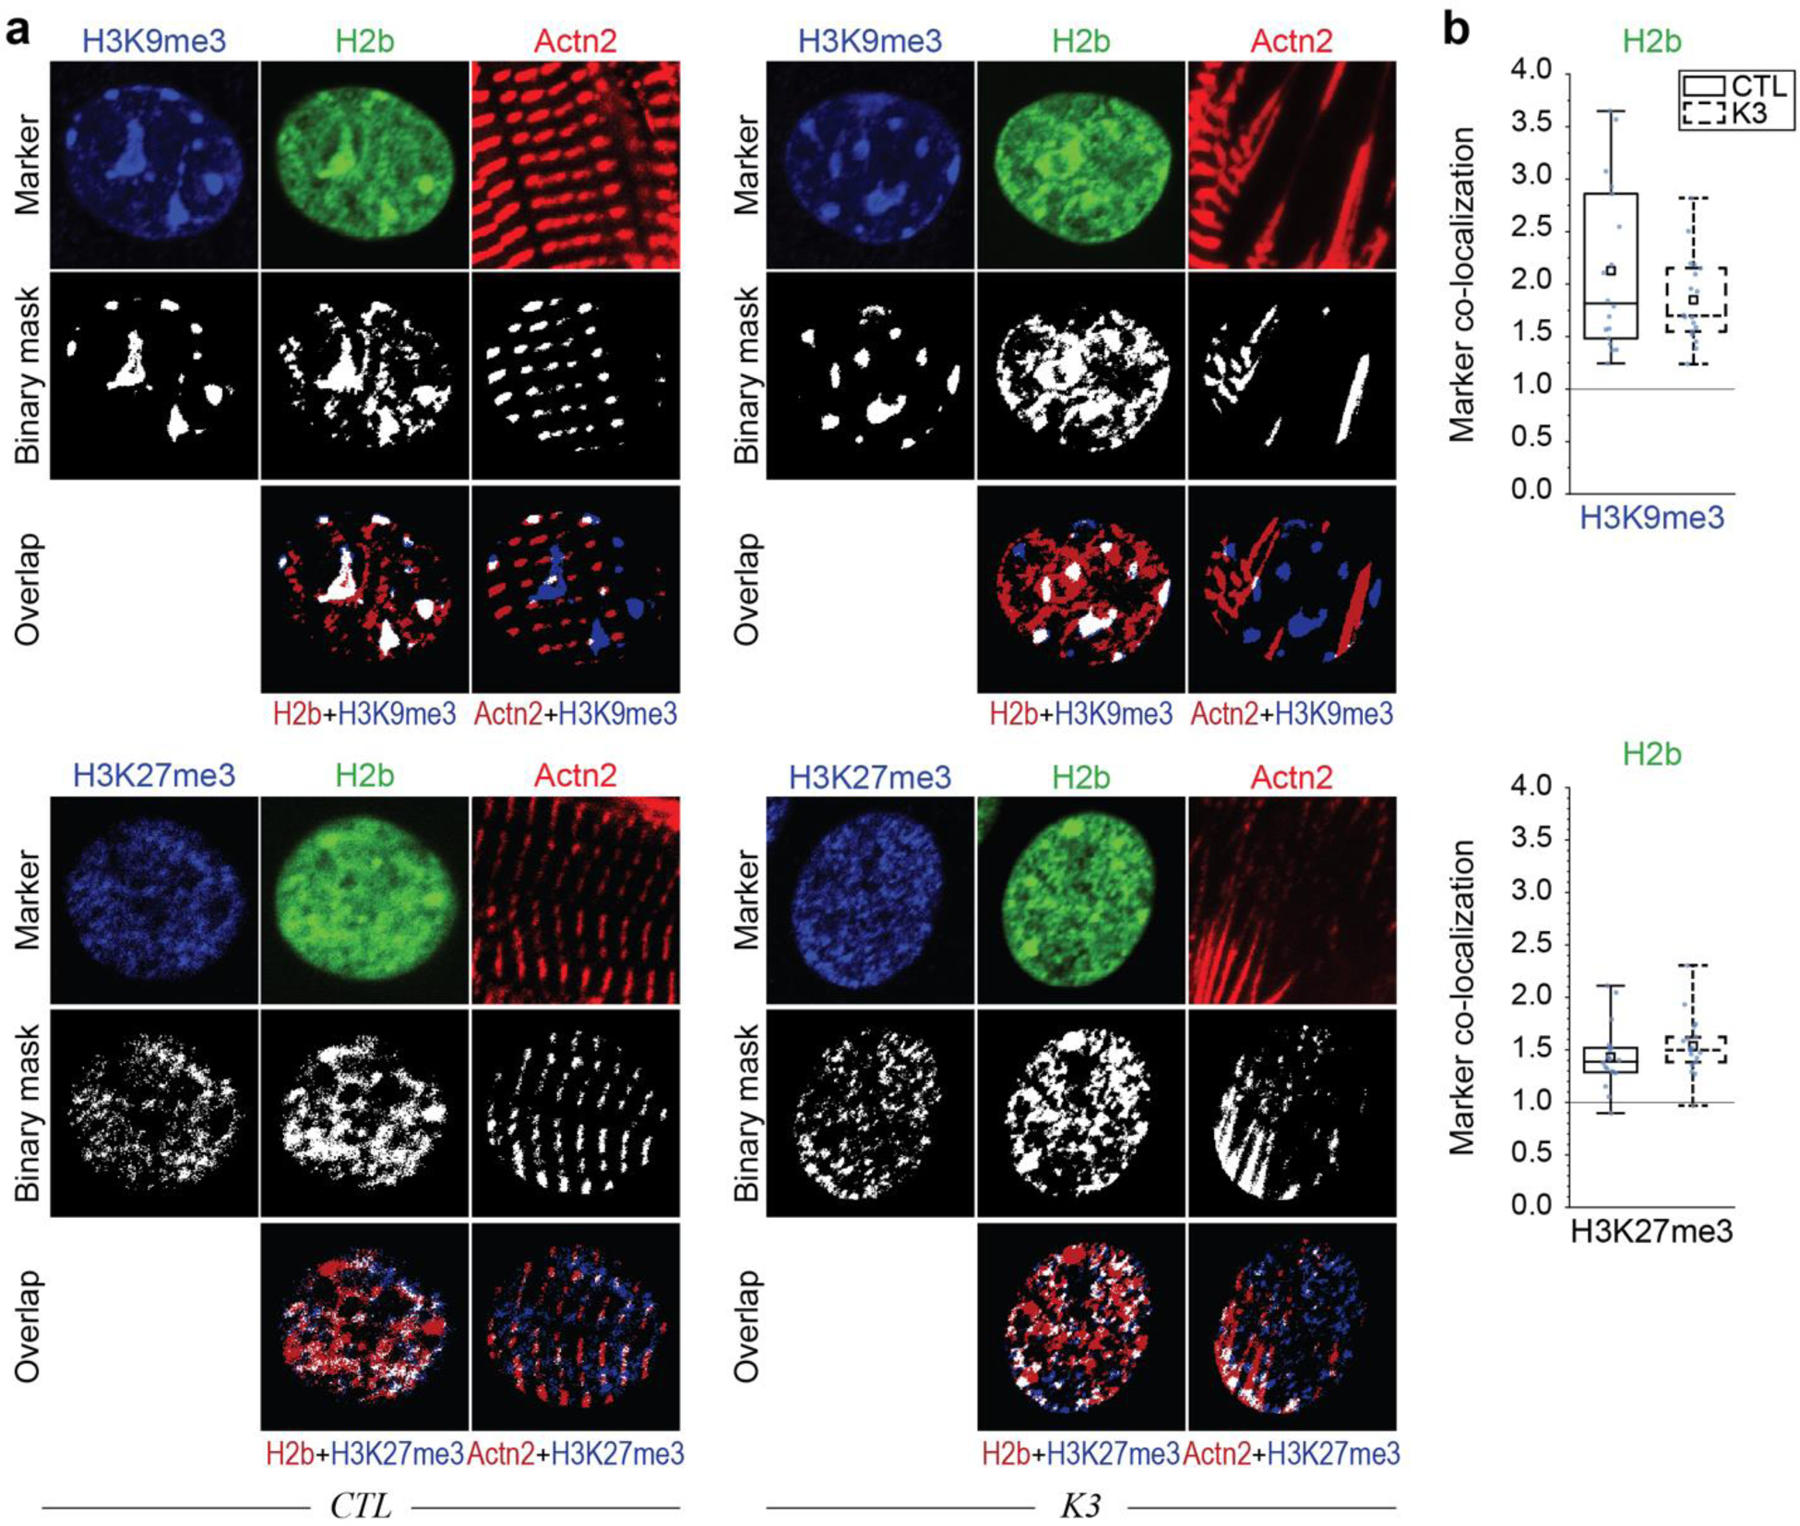
a) Embryonic cardiac cells were isolated and cultured on soft (13 kPa) PDMS. CMs were infected with the LINC decoupling vector (K3) or control construct (CTL) on day one and stained for H3K9me3 or H3K27me3 on day four to analyze marker overlap (see Fig. 8). b) Colocalization of H3K9me3 and H3K27me3 with overall chromatin did not change after LINC disruption.
Extended Fig. 13: Inducible expression of H3.3 K-to-M mutant inhibits H3K9 trimethylation and changes cardiac gene expression.
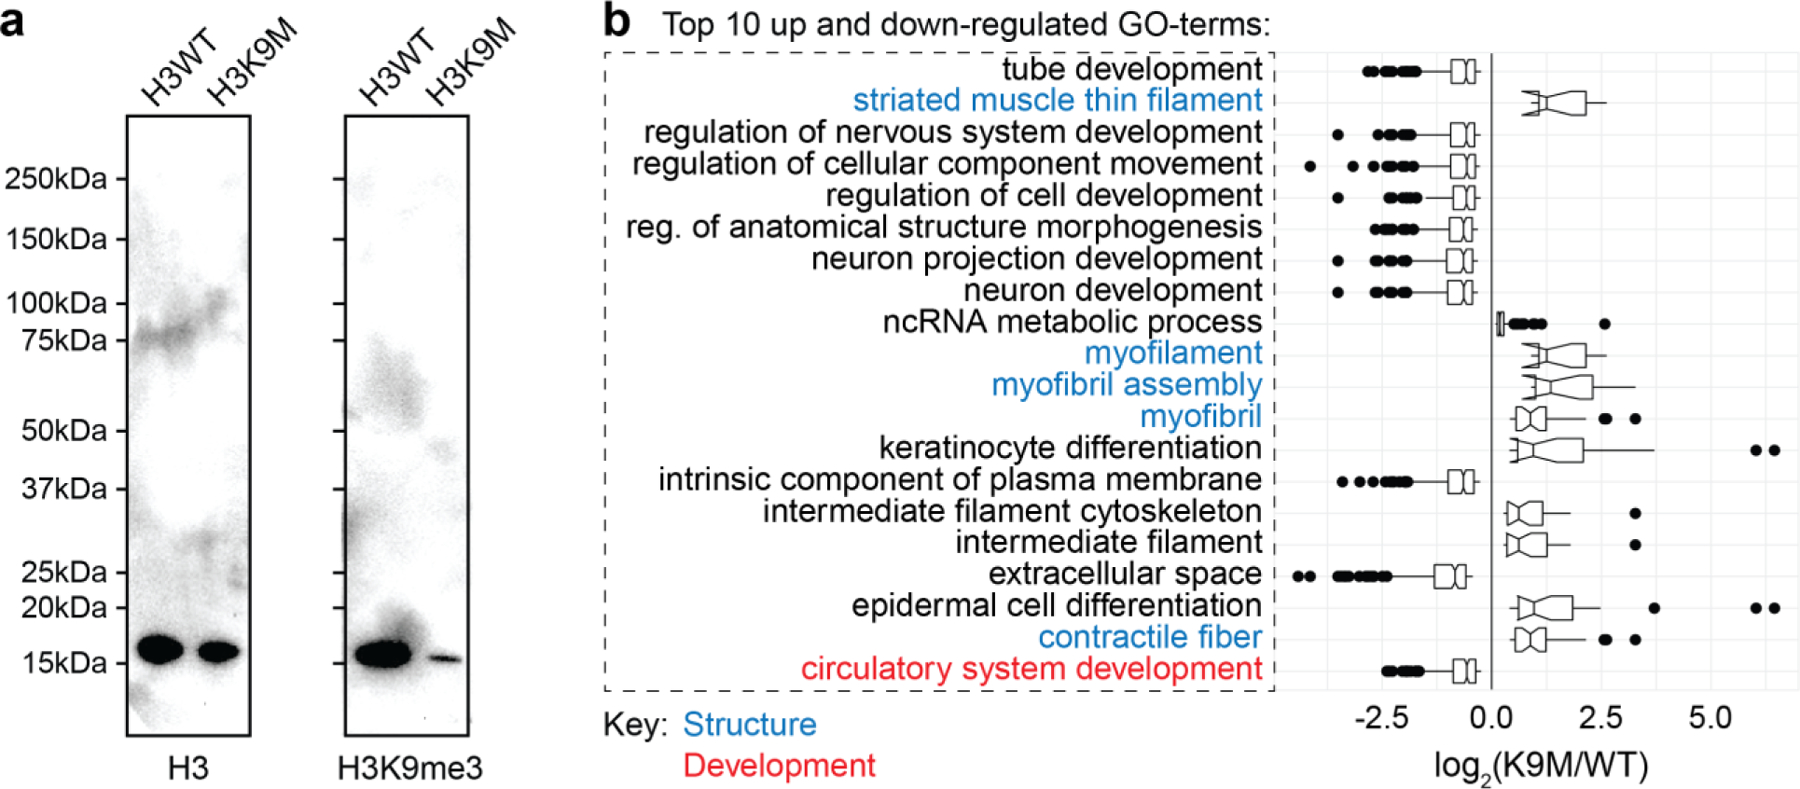
a) Embryonic cardiac cells from H3K9M and H3WT mice were isolated and cultured on soft (13 kPa) PDMS. CMs were induced using 2 µg/ml doxycycline, harvested on day four, and subjected to Western blot analysis for H3K9me3 or H3 as a loading control. b) Functional annotation for top genes differentially regulated between H3K9M and H3WT cells, which show a phenotype consistent with CM development.
Extended Fig. 14: H3K9me3 effects gene expression globally, but not locally.
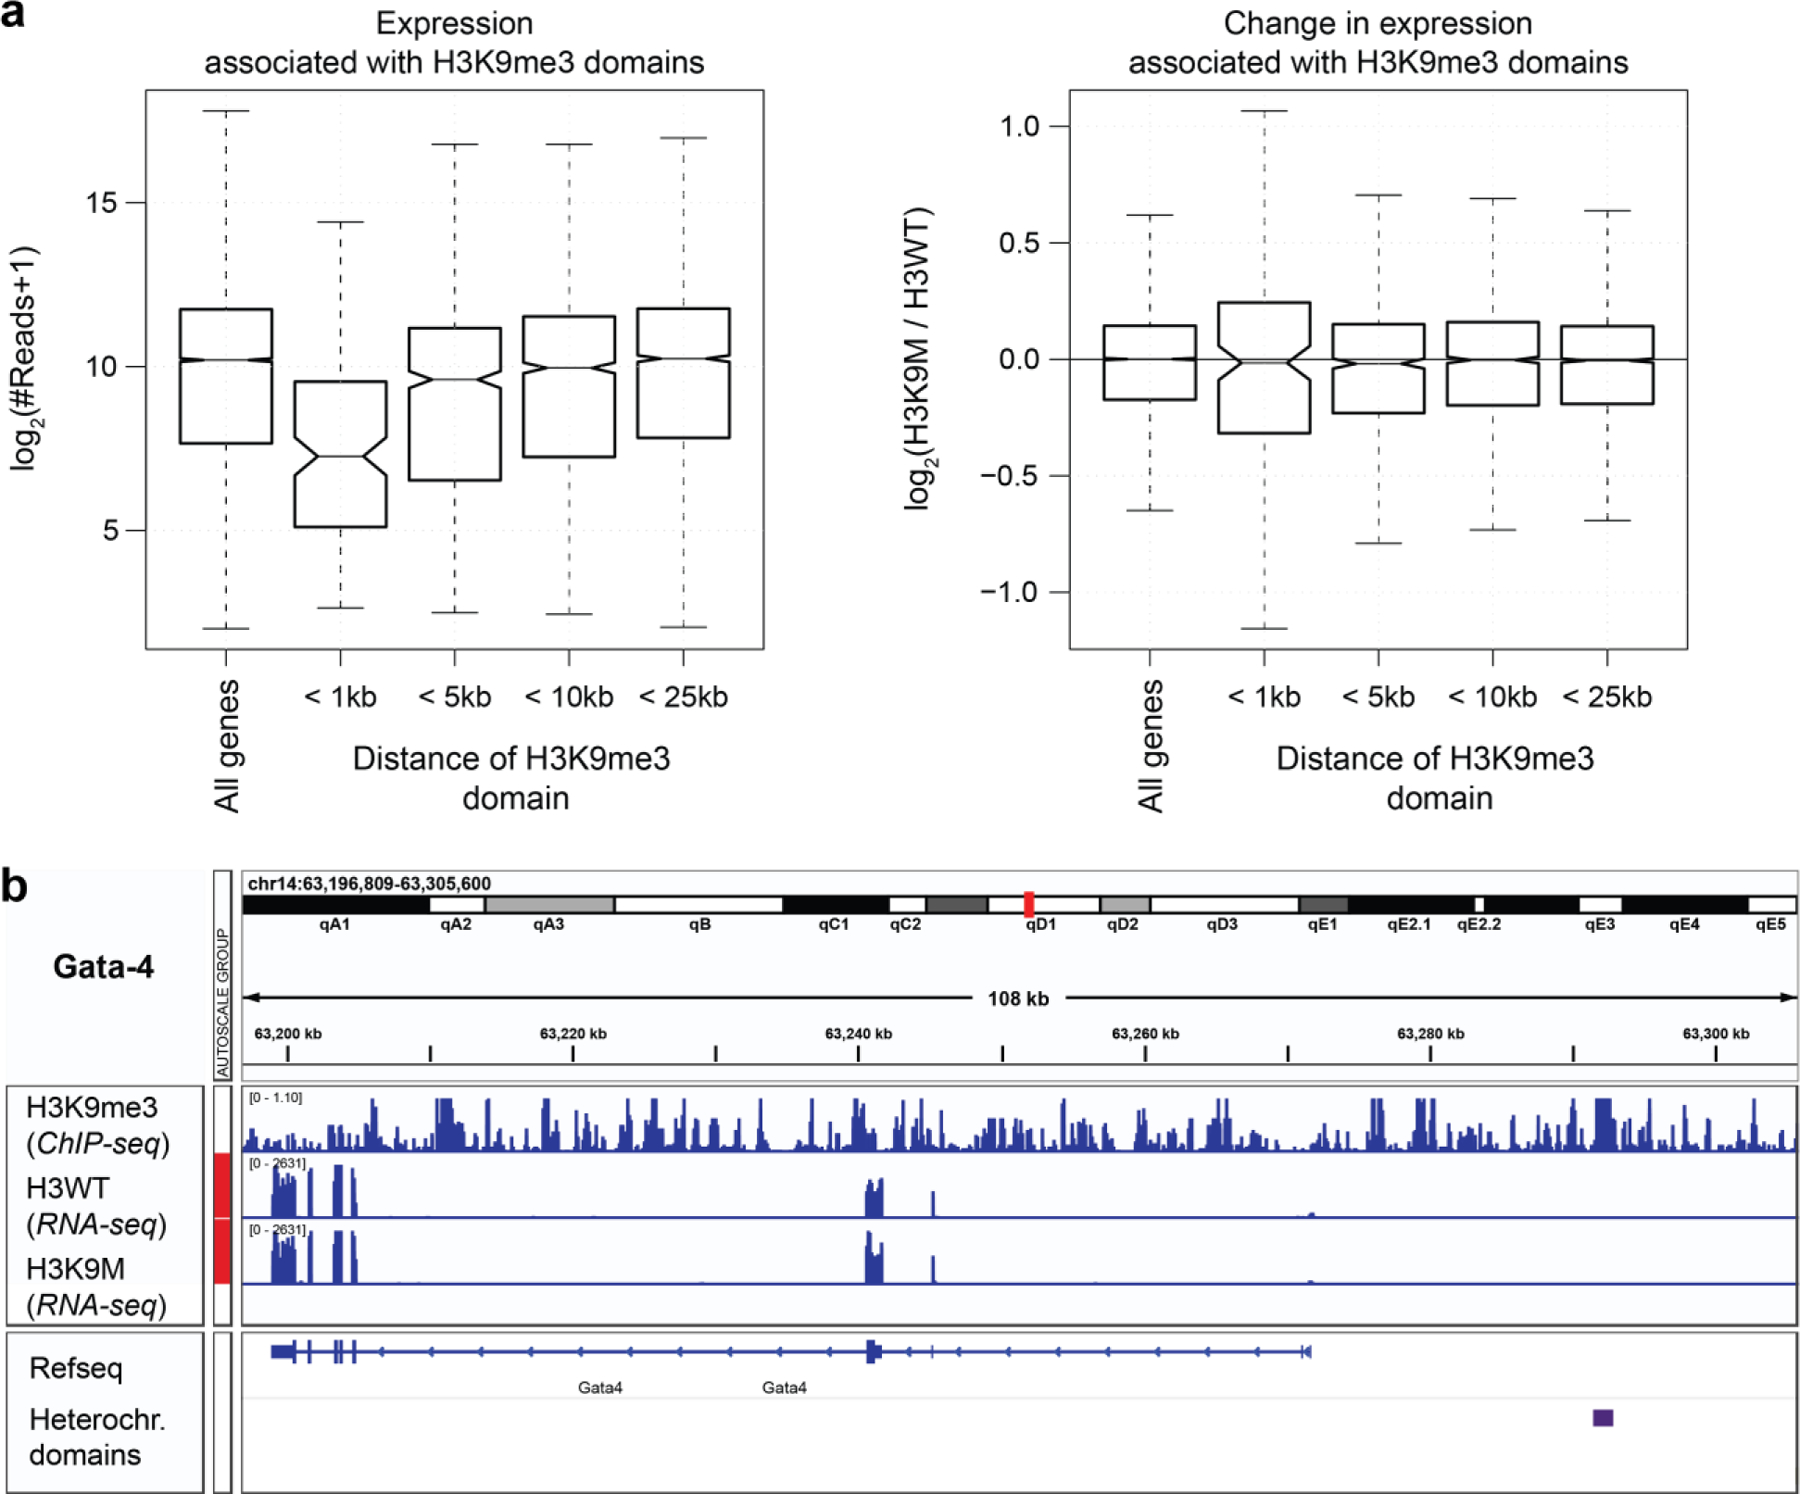
a) RNAseq data of CMs from H3K9M and H3WT was analyzed with respect to their distance to H3K9me3 heterochromatin domains, using a ChIPseq dataset of 16.5-day mouse embryo hearts from modEncode. Left: The combined expression of H3K9M and H3WT showed a general decrease of gene expression with proximity to heterochromatin domains. Right: Relative expression in H3K9me3 suppressed H3K9M mice, compared to H3WT, showed no direction of expression change, only higher variance. b) Example of a single gene track for Nkx2.5. Repressive polycomb domains are shown in purple (ReprPC). Although there is a repressive polycomb domain near the TSS of this gene of interest there is no significant upregulation of the level of gene expression according to our RNA-seq data.
Extended Table 1. Expression of histone variants in cardiac cultures on cultured on soft or stiff substrates.
Embryonic cardiac cells were plated on soft (13 kPa) or stiff (140 kPa) PDMS for four days after which total RNA was harvested to perform RNAseq analysis. Averaged expression (FPKM: Fragments Per Kilobase of transcript per Million mapped reads) for each substrate group, as well as fold changes and p-values between substrates, of previously annotated mouse histone variants91 are shown; * indicates canonical (generic) H1 variants.
| Gene | Ensembl ID | Family | Variant | FPKM 13 kPa | FPKM 140 kPa | Fold Change | p-Value |
|---|---|---|---|---|---|---|---|
| Hist1h1a | ENSMUSG00000049539 | H1 | H1.1* | 32.92 | 22.83 | 0.694 | 0.595 |
| Hist1h1c | ENSMUSG00000036181 | H1 | H1.2* | 75.57 | 55.23 | 0.731 | 0.413 |
| Hist1h1d | ENSMUSG00000052565 | H1 | H1.3* | 65.25 | 35.79 | 0.549 | 0.350 |
| Hist1h1e | ENSMUSG00000051627 | H1 | H1.4* | 66.10 | 43.53 | 0.658 | 0.386 |
| Hist1h1b | ENSMUSG00000058773 | H1 | H1.5* | 41.15 | 26.51 | 0.644 | 0.531 |
| H1f0 | ENSMUSG00000096210 | H1 | H1.0 | 60.85 | 51.81 | 0.851 | 0.015 |
| H1fx | ENSMUSG00000044927 | H1 | H1.X | 0.14 | 0.01 | 0.088 | 0.239 |
| Gm6970 | ENSMUSG00000091230 | H1 | H1.11 | 0.43 | 0.06 | 0.150 | 0.306 |
| Hist1h1t | ENSMUSG00000036211 | H1 | TS H1.6 | 0 | 0.80 | - | - |
| H1fnt | ENSMUSG00000048077 | H1 | TS H1.7 | 0 | 0 | - | - |
| H1foo | ENSMUSG00000042279 | H1 | OO H1.8 | 0 | 0 | - | - |
| Hils1 | ENSMUSG00000038994 | H1 | TS H1.9 | 0 | 0 | - | - |
| Hist1h2ab | ENSMUSG00000061615 | H2A | canonical | 14.08 | 3.38 | 0.240 | 0.335 |
| Hist1h2ac | ENSMUSG00000069270 | H2A | canonical | 7.33 | 1.20 | 0.163 | 0.286 |
| Hist1h2ad | ENSMUSG00000071478 | H2A | canonical | 5.11 | 1.05 | 0.205 | 0.370 |
| Hist1h2ae | ENSMUSG00000069272 | H2A | canonical | 4.83 | 0.77 | 0.160 | 0.314 |
| Hist1h2ag | ENSMUSG00000069301 | H2A | canonical | 6.01 | 1.27 | 0.211 | 0.379 |
| Hist1h2ai | ENSMUSG00000071516 | H2A | canonical | 5.27 | 0.80 | 0.153 | 0.312 |
| Hist1h2an | ENSMUSG00000069309 | H2A | canonical | 3.65 | 0.41 | 0.112 | 0.330 |
| Hist1h2ao | ENSMUSG00000094248 | H2A | canonical | 6.25 | 1.15 | 0.184 | 0.356 |
| Hist1h2ap | ENSMUSG00000094777 | H2A | canonical | 6.26 | 1.05 | 0.169 | 0.351 |
| Hist1h2af | ENSMUSG00000061991 | H2A | canonical | 3.94 | 0.92 | 0.234 | 0.286 |
| Hist1h2ah | ENSMUSG00000069302 | H2A | canonical | 4.99 | 0.78 | 0.156 | 0.314 |
| Hist1h2ak | ENSMUSG00000063021 | H2A | canonical | 14.40 | 1.52 | 0.106 | 0.274 |
| Hist1h2al | ENSMUSG00000091383 | H2A | canonical | 0.38 | 0.07 | 0.194 | 0.143 |
| Hist2h2aa1 | ENSMUSG00000064220 | H2A | canonical | 37.72 | 10.72 | 0.284 | 0.314 |
| Hist2h2aa2 | ENSMUSG00000063954 | H2A | canonical | 44.72 | 13.15 | 0.294 | 0.322 |
| Hist2h2ab | ENSMUSG00000063689 | H2A | canonical | 1.31 | 0.19 | 0.144 | 0.212 |
| Hist2h2ac | ENSMUSG00000068855 | H2A | canonical | 16.41 | 4.61 | 0.281 | 0.243 |
| Hist3h2a | ENSMUSG00000078851 | H2A | canonical | 8.28 | 5.36 | 0.648 | 0.151 |
| H2afj | ENSMUSG00000060032 | H2A | H2A.J | 3.03 | 2.30 | 0.761 | 0.445 |
| H2afx | ENSMUSG00000049932 | H2A | H2A.X | 8.63 | 4.77 | 0.553 | 0.416 |
| H2afz | ENSMUSG00000037894 | H2A | H2A.Z | 69.22 | 75.76 | 1.094 | 0.638 |
| H2afv | ENSMUSG00000041126 | H2A | H2A.Z | 12.45 | 11.91 | 0.956 | 0.741 |
| H2afy | ENSMUSG00000015937 | H2A | macro H2A | 22.42 | 24.38 | 1.087 | 0.603 |
| H2afy2 | ENSMUSG00000020086 | H2A | macro H2A | 9.54 | 9.11 | 0.954 | 0.735 |
| H2afy3 | ENSMUSG00000101167 | H2A | macro H2A.3 | 0 | 0 | - | - |
| Hist1h2aa | ENSMUSG00000060081 | H2A | TS H2A.1 | 0 | 0 | - | - |
| H2al1a | ENSMUSG00000100626 | H2A | H2A.L | 0 | 0 | - | - |
| H2al1c | ENSMUSG00000096097 | H2A | H2A.L | 0 | 0 | - | - |
| H2al1d | ENSMUSG00000094904 | H2A | H2A.L | 0 | 0 | - | - |
| H2al1f | ENSMUSG00000095655 | H2A | H2A.L | 0 | 0 | - | - |
| H2al1g | ENSMUSG00000095662 | H2A | H2A.L | 0 | 0 | - | - |
| H2al1h | ENSMUSG00000099443 | H2A | H2A.L | 0 | 0 | - | - |
| H2al1i | ENSMUSG00000095445 | H2A | H2A.L | 0 | 0 | - | - |
| H2al1b | ENSMUSG00000101819 | H2A | H2A.L | 0 | 0 | - | - |
| H2al1e | ENSMUSG00000095413 | H2A | H2A.L | 0 | 0 | - | - |
| H2al1j | ENSMUSG00000069038 | H2A | H2A.L | 0 | 0 | - | - |
| H2al1k | ENSMUSG00000100448 | H2A | H2A.L | 0 | 0 | - | - |
| H2al1m | ENSMUSG00000100200 | H2A | H2A.L | 0.21 | 0 | - | - |
| H2al1n | ENSMUSG00000078346 | H2A | H2A.L | 0 | 0 | - | - |
| H2al1o | ENSMUSG00000061065 | H2A | H2A.L | 0 | 0 | - | - |
| H2afb1 | ENSMUSG00000062651 | H2A | H2A.L | 0 | 0 | - | - |
| H2al2b | ENSMUSG00000095573 | H2A | H2A.L | 0 | 0 | - | - |
| H2al2c | ENSMUSG00000094881 | H2A | H2A.L | 0 | 0 | - | - |
| Hypm | ENSMUSG00000040456 | H2A | H2A.P | 0 | 0 | - | - |
| H2afb2 | ENSMUSG00000082482 | H2A | H2A.B | 0 | 0 | - | - |
| H2afb3 | ENSMUSG00000083616 | H2A | H2A.B | 0 | 0 | - | - |
| Gm14920 | ENSMUSG00000067441 | H2A | H2A.B | 0 | 0 | - | - |
| Hist1h2bb | ENSMUSG00000075031 | H2B | canonical | 58.66 | 31.09 | 0.530 | 0.330 |
| Hist1h2bc | ENSMUSG00000018102 | H2B | canonical | 75.02 | 62.26 | 0.830 | 0.547 |
| Hist1h2be | ENSMUSG00000047246 | H2B | canonical | 8.78 | 4.93 | 0.561 | 0.402 |
| Hist1h2bg | ENSMUSG00000058385 | H2B | canonical | 54.19 | 29.79 | 0.550 | 0.522 |
| Hist1h2bf | ENSMUSG00000069268 | H2B | canonical | 12.99 | 7.59 | 0.584 | 0.482 |
| Hist1h2bj | ENSMUSG00000069300 | H2B | canonical | 31.22 | 10.63 | 0.341 | 0.386 |
| Hist1h2bl | ENSMUSG00000094338 | H2B | canonical | 25.52 | 14.71 | 0.577 | 0.506 |
| Hist1h2bn | ENSMUSG00000095217 | H2B | canonical | 58.33 | 31.99 | 0.548 | 0.460 |
| Hist1h2bq | ENSMUSG00000069307 | H2B | canonical | 6.30 | 3.45 | 0.548 | 0.404 |
| Hist1h2br | ENSMUSG00000069303 | H2B | canonical | 11.13 | 5.64 | 0.507 | 0.343 |
| Hist1h2bq | ENSMUSG00000069307 | H2B | canonical | 6.30 | 3.45 | 0.548 | 0.404 |
| Hist1h2br | ENSMUSG00000069303 | H2B | canonical | 11.13 | 5.64 | 0.507 | 0.343 |
| Hist1h2bh | ENSMUSG00000064168 | H2B | canonical | 21.22 | 9.45 | 0.445 | 0.396 |
| Hist1h2bk | ENSMUSG00000062727 | H2B | canonical | 44.56 | 20.03 | 0.450 | 0.345 |
| Hist1h2bm | ENSMUSG00000096807 | H2B | canonical | 32.08 | 19.90 | 0.620 | 0.483 |
| Hist1h2bp | ENSMUSG00000069308 | H2B | canonical | 7.24 | 3.81 | 0.526 | 0.264 |
| Hist2h2be | ENSMUSG00000068854 | H2B | canonical | 0.83 | 2.17 | 2.617 | 0.019 |
| Hist3h2ba | ENSMUSG00000056895 | H2B | canonical | 1.47 | 0.95 | 0.647 | 0.615 |
| Hist3h2bb | ENSMUSG00000080712 | H2B | canonical | 1.66 | 2.26 | 1.357 | 0.517 |
| Hist1h2ba | ENSMUSG00000050799 | H2B | sperm H2B | 0.72 | 0.47 | 0.647 | 0.489 |
| Hist2h2bb | ENSMUSG00000105827 | H2B | canonical | 0 | 0 | - | - |
| 1700024p04rik | ENSMUSG00000045022 | H2B | subH2B | 0 | 0 | - | - |
| H2bfm | ENSMUSG00000048155 | H2B | H2B.W | 0 | 0 | - | - |
| Hist1h3a | ENSMUSG00000069265 | H3 | canonical | 13.94 | 5.18 | 0.372 | 0.384 |
| Hist1h3g | ENSMUSG00000099517 | H3 | canonical | 16.82 | 5.27 | 0.313 | 0.279 |
| Hist1h3h | ENSMUSG00000101355 | H3 | canonical | 21.59 | 6.20 | 0.287 | 0.226 |
| Hist1h3i | ENSMUSG00000101972 | H3 | canonical | 39.53 | 23.30 | 0.589 | 0.537 |
| Hist1h3b | ENSMUSG00000069267 | H3 | canonical | 24.57 | 9.76 | 0.397 | 0.341 |
| Hist1h3c | ENSMUSG00000069310 | H3 | canonical | 24.95 | 10.08 | 0.404 | 0.227 |
| Hist1h3d | ENSMUSG00000099583 | H3 | canonical | 17.60 | 7.91 | 0.449 | 0.425 |
| Hist1h3e | ENSMUSG00000069273 | H3 | canonical | 8.85 | 3.48 | 0.393 | 0.241 |
| Hist1h3f | ENSMUSG00000100210 | H3 | canonical | 11.10 | 4.05 | 0.365 | 0.307 |
| Hist2h3b | ENSMUSG00000074403 | H3 | canonical | 9.61 | 3.37 | 0.350 | 0.377 |
| Hist2h3c2 | ENSMUSG00000081058 | H3 | canonical | 3.32 | 1.37 | 0.412 | 0.401 |
| H3f3a | ENSMUSG00000060743 | H3 | H3.3 | 95.66 | 94.39 | 0.987 | 0.937 |
| H3f3b | ENSMUSG00000016559 | H3 | H3.3 | 122.89 | 130.10 | 1.059 | 0.780 |
| Gm6421 | ENSMUSG00000094518 | H3 | H3.3 | 15.72 | 10.54 | 0.670 | 0.322 |
| Gm10257 | ENSMUSG00000096789 | H3 | H3.3 | 7.37 | 5.66 | 0.767 | 0.488 |
| Cenpa | ENSMUSG00000029177 | H3 | cenH3 | 19.08 | 21.18 | 1.110 | 0.468 |
| H3f3c | ENSMUSG00000082029 | H3 | H3.5 | 116.29 | 102.04 | 0.877 | 0.287 |
| Hist2h3c1 | ENSMUSG00000093769 | H3 | canonical | 0 | 0 | - | - |
| Gm12260 | ENSMUSG00000080152 | H3 | TS H3.4 | 0 | 0 | - | - |
| Hist1h4a | ENSMUSG00000060093 | H4 | canonical | 34.85 | 11.56 | 0.332 | 0.379 |
| Hist1h4b | ENSMUSG00000069266 | H4 | canonical | 47.65 | 12.84 | 0.269 | 0.247 |
| Hist1h4c | ENSMUSG00000060678 | H4 | canonical | 102.01 | 32.57 | 0.319 | 0.291 |
| Hist1h4d | ENSMUSG00000061482 | H4 | canonical | 124.40 | 41.41 | 0.333 | 0.284 |
| Hist1h4f | ENSMUSG00000069274 | H4 | canonical | 82.80 | 37.85 | 0.457 | 0.317 |
| Hist1h4h | ENSMUSG00000060981 | H4 | canonical | 52.11 | 18.08 | 0.347 | 0.171 |
| Hist1h4i | ENSMUSG00000060639 | H4 | canonical | 4.51 | 2.49 | 0.553 | 0.234 |
| Hist1h4j | ENSMUSG00000067455 | H4 | canonical | 9.82 | 3.45 | 0.351 | 0.310 |
| Hist1h4k | ENSMUSG00000064288 | H4 | canonical | 42.69 | 21.68 | 0.508 | 0.387 |
| Hist1h4m | ENSMUSG00000069306 | H4 | canonical | 77.49 | 32.80 | 0.423 | 0.327 |
| Hist1h4n | ENSMUSG00000069305 | H4 | canonical | 65.29 | 27.97 | 0.428 | 0.340 |
| Hist2h4 | ENSMUSG00000091405 | H4 | canonical | 5.75 | 3.42 | 0.595 | 0.446 |
| Hist4h4 | ENSMUSG00000096010 | H4 | canonical | 2.34 | 0.85 | 0.363 | 0.139 |
Extended Table 2. KEGG pathway analysis of differentially expressed genes from cardiac cultures plated on soft or stiff PDMS substrates.
Global gene expression data from RNAseq analysis was used to screen for pathways with enriched differential gene expression (p<0.2, FPKM>1) using the KEGG database via DAVID. Listed are pathway terms involved in signal transduction cascades, the number of differentially expressed genes, the percentage of differentially expressed genes compared to the total number of genes associated with that pathway as well as p-values and corrected p-value Benjamini-scores obtained via the Benjamini-Hochberg procedure.
| Term | Genes# | % total | p-value | Benjamini |
|---|---|---|---|---|
| Signaling pathways regulating pluripotency of stem cells | 29 | 1.2 | 0.0002 | 0.0650 |
| Rap1 signaling pathway | 35 | 1.4 | 0.0050 | 0.2100 |
| Toll-like receptor signaling pathway | 20 | 0.8 | 0.0055 | 0.1800 |
| TNF signaling pathway | 20 | 0.8 | 0.0120 | 0.3000 |
| MAPK signaling pathway | 37 | 1.5 | 0.0210 | 0.2800 |
| PI3K-Akt signaling pathway | 48 | 2 | 0.0270 | 0.3200 |
| Adrenergic signaling in cardiomyocytes | 24 | 1 | 0.0280 | 0.3100 |
| HIF-1 signaling pathway | 18 | 0.7 | 0.0310 | 0.3300 |
| Cholinergic synapse | 19 | 0.8 | 0.0340 | 0.3500 |
| cGMP-PKG signaling pathway | 26 | 1.1 | 0.0370 | 0.3300 |
| Insulin resistance | 18 | 0.7 | 0.0500 | 0.3600 |
| AMPK signaling pathway | 20 | 0.8 | 0.0520 | 0.3700 |
| ErbB signaling pathway | 15 | 0.6 | 0.0530 | 0.3700 |
| ECM-receptor interaction | 15 | 0.6 | 0.0580 | 0.3700 |
| Neurotrophin signaling pathway | 19 | 0.8 | 0.0650 | 0.3800 |
| Estrogen signaling pathway | 16 | 0.7 | 0.0670 | 0.3800 |
| Wnt signaling pathway | 21 | 0.9 | 0.0750 | 0.4000 |
| VEGF signaling pathway | 11 | 0.4 | 0.0770 | 0.4000 |
| Hippo signaling pathway | 22 | 0.9 | 0.0820 | 0.4100 |
| Jak-STAT signaling pathway | 21 | 0.9 | 0.0930 | 0.4300 |
| Calcium signaling pathway | 25 | 1 | 0.0960 | 0.4300 |
Extended Table 3. Substrate specificity of differentially expressed histone methylating genes.
List of differentially expressed (p<0.2) genes between soft and stiff PDMS, as determined by RNAseq, with the GO term association histone methylation (GO:0016571). Shown are substrate specificities for mono (1), di (2), tri (3) or any methylation of the respective target histone residue as obtained from either UniProt or AmiGO database. H3K9 residues were amongst the most prevalent substrates.
| Gene | Ensembl ID | Substrate specificity | Source | FC | p-value |
|---|---|---|---|---|---|
| Ehmt1 | ENSMUSG00000036893 | H3K9me1/2 | UniProt | 0.847 | 0.0185 |
| Paxbp1 | ENSMUSG00000022974 | H3K4me2/3 | UniProt | 0.751 | 0.0666 |
| Pwp1 | ENSMUSG00000001785 | H3K20me3 | AmiGO | 0.860 | 0.0797 |
| Setdb1 | ENSMUSG00000015697 | H3K9me3 | UniProt | 0.823 | 0.0830 |
| Rtf1 | ENSMUSG00000027304 | H3K4me3 | UniProt | 1.127 | 0.1119 |
| Setd1a | ENSMUSG00000042308 | H3K4me | UniProt | 0.670 | 0.1190 |
| Setd1b | ENSMUSG00000038384 | H3K4me | UniProt | 0.193 | 0.1573 |
| Eed | ENSMUSG00000030619 | H3K9me, H3K27me | UniProt | 0.719 | 0.1687 |
| Arid4b | ENSMUSG00000039219 | H3K9me3, H3K20me3 | AmiGO | 1.158 | 0.1881 |
Extended Table 4.
PCR primers for gene expression analysis.
| Gene | Forward | Reverse |
|---|---|---|
| Gapdh | TGTCAAGCTCATTTCCTGGTATG | GGGATAGGGCCTCTCTTGCT |
| ActB | GATCAAGATCATTGCTCCTCCTG | AGGGTGTAAAACGCAGCTCA |
| Gata4 | CTCCATGTCCCAGACATTCAGT | GATGCATAGCCTTGTGGGGA |
| Hand2 | CACCAGCTACATCGCCTACC | TCTCATTCAGCTCTTTCTTCCTCT |
| Mef2c | ACCTCCCAGCTTTGAGATGC | CCATCAGACCGCCTGTGTTA |
| Nkx2–5 | ATTTTACCCGGGAGCCTACG | CAGCGCGCACAGCTCTTTT |
| Atp2a2 | CCGGCTGAAGAAGGAAAAACC | CCACGATTGCATTGGCTACC |
| Myh6 | CTCTGGATTGGTCTCCCAGC | GTCATTCTGTCACTCAAACTCTGG |
| Scn5a | ATATGTTGAGTACACCTTCACCGC | CGATCACACTGAAGTCTAGCCA |
| Tnni3 | CGTTCTGAGGACTCGTTGCC | TTAAACTTGCCACGGAGGTCA |
| Kdm6a | TGGAAACGTGCCTTACCTGC | TGAAGCCCCTGAGTGGAGTT |
| Eed | TGGGCGATTTGATTACAGCCA | GGGTCAGTGTTGTGCATTTGG |
| Ezh1 | TGGATATAGCAAGTCCCCCA | ACATACAGAGCCTTTGCTCCC |
| Ezh2 | TCCATGCAACACCCAACACATA | ACTCCTTAGCTCCCTCCAGAT |
| Kdm3a | CAGGACAACTGGGACTTGGAG | CCACACACACCTTCAAGTCTTTC |
| Ehmt1 | GCTAAGGGAAGATACACCTATGGC | CACTCTGTTGGTGCCTTCCT |
| Ehmt2 | GAACTCTGGTAGCCTGTCCG | GCTCATCCACAGAGTACGCA |
| Setdb1 | CATACAGCAGCGCAAGAAGC | AGTTAGTCACTTCCCTGGATGC |
Extended Table 5. Characteristics and ultrasound measurements of hypertrophic mice model.
Mice received angiotensin II (AngII, n=4) for 28 days to induce hypertrophy or saline (n=5) as a control. Ultrasound measure were taken at the start (day 0) and end (day 28) of the treatment. Data is shown as mean with standard deviation.
| Day 0 | Day 28 | |||
|---|---|---|---|---|
| Saline | AngII | Saline | AngII | |
| Mouse weight (g) | 20.64 ± 0.90 | 20.775 ± 0.71 | 24.92 ± 1.36 | 24.10 ± 1.15 |
| Wall thickness (mm) | 0.939 ± 0.045 | 0.965 ± 0.051 | 0.946 ± 0.060 | 1.053 ± 0.166 |
| LV Mass (mg) | 112.80 ± 10.49 | 101.67 ± 6.71 | 123.75 ± 13.34 | 154.02 ± 30.37 |
| Ejection fraction (%) | 71.01 ± 4.60 | 73.66 ± 3.52 | 69.91 ± 2.95 | 50.51 ± 5.59 |
| Fractional shortening (%) | 19.06 ± 5.72 | 16.14 ± 3.95 | 17.67 ± 6.50 | 7.99 ± 3.66 |
Extended Table 6.
Characteristics and physiological parameters of human patients.
| No heart failure | Nonischemic cardiomyopathy | ||||||
|---|---|---|---|---|---|---|---|
| ID # | 1549 | 1545 | 1739 | 1720 | 1792 | 1737 | p-value |
| AGE | 49 | 44 | 52 | 44 | 66 | 69 | 0.285 |
| Weight (kg) | 104 | 89 | 90 | 110 | 65 | 120 | 0.839 |
| Height (cm) | 180.3 | 182.9 | 175 | 185 | 168 | 183 | 0.909 |
| BMI | 31.0 | 26.6 | 29.4 | 32.1 | 23.0 | 35.8 | 0.824 |
| Physiology | |||||||
| Left Ventricle Mass (g) | 213 | 246 | 213 | 280 | 290 | 383 | 0.092 |
| Heart Weight (g) | 383 | 326 | 352 | 500 | 465 | 609 | 0.045 |
| LV/Ht (%) | 55.6 | 75.5 | 60.5 | 56.0 | 62.4 | 62.9 | 0.193 |
| LV ejection fraction (%) | 55 | 55 | 65 | 13 | 17.5 | 25 | 0.001 |
| Creatinine (mg/dL) | 2.1 | 1.1 | 0.72 | 1.17 | 1.42 | 1.31 | 0.989 |
| Enrichment | |||||||
| DAPI | 1.80 | 2.28 | 2.33 | 1.10 | 1.54 | 1.20 | 0.018 |
| H3K27me3 | 3.30 | 1.45 | 3.58 | 0.82 | 1.89 | 1.29 | 0.151 |
| H3K9me3 | 2.18 | 1.92 | 2.70 | 0.77 | 0.99 | 1.08 | 0.018 |
Extended Table 7. Differentially expressed nuclear membrane genes.
List of differentially expressed (p<0.2) genes between cardiac cells plated on soft and stiff PDMS, as determined by RNAseq, with the GO term association nuclear membrane (GO:0031965). Location further refers to the association with child the GO terms inner nuclear membrane (GO:0005637) and outer nuclear membrane (GO:0005640) or no association (na).
| Gene | Ensembl ID | Location | FC | p-value |
|---|---|---|---|---|
| Emd | ENSMUSG00000001964 | Inner + Outer | −0.218 | 0.020 |
| Nup35 | ENSMUSG00000026999 | na | −1.032 | 0.024 |
| Lemd3 | ENSMUSG00000048661 | Inner | 0.569 | 0.034 |
| Rap1gap2 | ENSMUSG00000038807 | na | −0.330 | 0.054 |
| Gtf3c3 | ENSMUSG00000041303 | na | 0.575 | 0.060 |
| Unc50 | ENSMUSG00000026111 | Inner | 0.452 | 0.067 |
| Tent4a | ENSMUSG00000034575 | na | 0.178 | 0.076 |
| Creb3l4 | ENSMUSG00000027938 | na | 1.539 | 0.091 |
| Aaas | ENSMUSG00000036678 | na | −0.248 | 0.093 |
| Adra1b | ENSMUSG00000050541 | na | −0.917 | 0.095 |
| Phf8 | ENSMUSG00000041229 | na | −0.434 | 0.096 |
| Mcm3ap | ENSMUSG00000001150 | na | 0.485 | 0.099 |
| Grk5 | ENSMUSG00000003228 | na | 0.342 | 0.103 |
| Plrg1 | ENSMUSG00000027998 | na | 0.316 | 0.116 |
| Taf3 | ENSMUSG00000025782 | na | 0.779 | 0.119 |
| Nup153 | ENSMUSG00000021374 | na | 0.239 | 0.136 |
| Tmc8 | ENSMUSG00000050106 | na | −1.632 | 0.140 |
| Kcnh3 | ENSMUSG00000037579 | Inner + Outer | −1.511 | 0.141 |
| Dpy19l3 | ENSMUSG00000043671 | Inner | −0.361 | 0.148 |
| Nup155 | ENSMUSG00000022142 | na | 0.441 | 0.149 |
| Tmem97 | ENSMUSG00000037278 | na | 0.305 | 0.156 |
| Pelo | ENSMUSG00000042275 | Inner + Outer | −0.466 | 0.158 |
| Tfpt | ENSMUSG00000006335 | na | −0.690 | 0.165 |
| Apc | ENSMUSG00000005871 | na | 0.185 | 0.175 |
| Prkg2 | ENSMUSG00000029334 | na | 0.787 | 0.193 |
| Mad2l1bp | ENSMUSG00000034509 | na | −0.506 | 0.198 |
Supplementary Material
Video 1: CMs from H2b-eGFP mice were plated on 13 kPa PDMS substrates and infected with the adenoviral control vector CTL (see Fig. 6a) on day one. Image series of myofibril contractions were recorded on day two via fluorescently tagged α-actinin 2 using an inverted widefield microscope.
Video 2: CMs from H2b-eGPP mice were plated on 140 kPa PDMS substrates and infected with the adenoviral control vector CTL (see Fig. 6a) on day one. Image series of myofibril contraction were recorded on day two via fluorescently tagged α-actinin 2 using an inverted widefield microscope.
Video 3: CMs from H2b-eGFP mice plated on 13 kPa PDMS substrates and infected with the adenoviral decoupling vector K3 (see Fig. 6a) on day one. Image series of myofibril contraction were recorded on day two via fluorescently tagged α-actinin 2 using an inverted widefield microscope.
ACKNOWLEDGEMENTS
We are grateful to Leslie Leinwand and Stephen J. Langer for providing materials and technical assistance for the generation of adenoviruses. We thank Nancy Emery for biostatistical support and Michael Rafuse for technical assistance regarding tissue sectioning. We would also like to thank the Genomics Shared Resource Facility at the UC Anschutz Medical Campus and the Purdue Genomics Core Facilities for library preparation and RNA sequencing of our samples. This work was supported in part by grants to C.P.N.: NIH R01 AR063712, NIH R21 AR066230, and NSF CMMI CAREER 1349735. This work is additionally supported by NIH T32 GM065103 (S.E.S.).
Footnotes
DECLARATION OF INTERESTS
The authors declare no competing interests.
REFERENCES
- 1.Engler AJ, Sen S, Sweeney HL & Discher DE Matrix elasticity directs stem cell lineage specification. Cell 126, 677–89 (2006). [DOI] [PubMed] [Google Scholar]
- 2.Phillip JM, Aifuwa I, Walston J & Wirtz D The Mechanobiology of Aging. Annu. Rev. Biomed. Eng 17, 113–141 (2015). [DOI] [PMC free article] [PubMed] [Google Scholar]
- 3.Lampi MC & Reinhart-King CA Targeting extracellular matrix stiffness to attenuate disease: From molecular mechanisms to clinical trials. Sci. Transl. Med 10, eaao0475 (2018). [DOI] [PubMed] [Google Scholar]
- 4.Thienpont B et al. The H3K9 dimethyltransferases EHMT1/2 protect against pathological cardiac hypertrophy. J. Clin. Invest 127, 335–348 (2017). [DOI] [PMC free article] [PubMed] [Google Scholar]
- 5.Zhang QJ et al. The histone trimethyllysine demethylase JMJD2A promotes cardiac hypertrophy in response to hypertrophic stimuli in mice. J. Clin. Invest 121, 2447–2456 (2011). [DOI] [PMC free article] [PubMed] [Google Scholar]
- 6.Swift J et al. Nuclear lamin-A scales with tissue stiffness and enhances matrix-directed differentiation. Science 341, 1240104 (2013). [DOI] [PMC free article] [PubMed] [Google Scholar]
- 7.Fedorchak GR, Kaminski A & Lammerding J Cellular mechanosensing: Getting to the nucleus of it all. Prog. Biophys. Mol. Biol (2014) doi: 10.1016/j.pbiomolbio.2014.06.009. [DOI] [PMC free article] [PubMed]
- 8.Heo S-J et al. Differentiation alters stem cell nuclear architecture, mechanics, and mechano-sensitivity. Elife 5, (2016). [DOI] [PMC free article] [PubMed] [Google Scholar]
- 9.Uzer G et al. Cell mechanosensitivity to extremely low-magnitude signals is enabled by a LINCed nucleus. Stem Cells 33, 2063–2076 (2015). [DOI] [PMC free article] [PubMed] [Google Scholar]
- 10.Spagnol ST, Armiger TJ & Dahl KN Mechanobiology of Chromatin and the Nuclear Interior. Cell. Mol. Bioeng 9, 268–276 (2016). [DOI] [PMC free article] [PubMed] [Google Scholar]
- 11.Crisp M et al. Coupling of the nucleus and cytoplasm: Role of the LINC complex. J. Cell Biol 172, 41–53 (2006). [DOI] [PMC free article] [PubMed] [Google Scholar]
- 12.Apel ED, Lewis RM, Grady RM & Sanes JR Syne-1, a dystrophin- and Klarsicht-related protein associated with synaptic nuclei at the neuromuscular junction. J. Biol. Chem 275, 31986–95 (2000). [DOI] [PubMed] [Google Scholar]
- 13.Zhang Q, Ragnauth C, Greener MJ, Shanahan CM & Roberts RG The nesprins are giant actin-binding proteins, orthologous to Drosophila melanogaster muscle protein MSP-300. Genomics 80, 473–81 (2002). [PubMed] [Google Scholar]
- 14.Zhang Q et al. Nesprin-2 is a multi-isomeric protein that binds lamin and emerin at the nuclear envelope and forms a subcellular network in skeletal muscle. J. Cell Sci 118, 673–687 (2005). [DOI] [PubMed] [Google Scholar]
- 15.Guilluy C et al. Isolated nuclei adapt to force and reveal a mechanotransduction pathway in the nucleus. Nat. Cell Biol 16, 376–381 (2014). [DOI] [PMC free article] [PubMed] [Google Scholar]
- 16.Davidson PM & Lammerding J Broken nuclei - lamins, nuclear mechanics, and disease. Trends Cell Biol 24, 247–256 (2013). [DOI] [PMC free article] [PubMed] [Google Scholar]
- 17.Puckelwartz MJ et al. Nesprin-1 mutations in human and murine cardiomyopathy. J. Mol. Cell. Cardiol 48, 600–8 (2010). [DOI] [PMC free article] [PubMed] [Google Scholar]
- 18.Banerjee I et al. Targeted ablation of nesprin 1 and nesprin 2 from murine myocardium results in cardiomyopathy, altered nuclear morphology and inhibition of the biomechanical gene response. PLoS Genet 10, e1004114 (2014). [DOI] [PMC free article] [PubMed] [Google Scholar]
- 19.Hug CB & Vaquerizas JM The Birth of the 3D Genome during Early Embryonic Development. Trends Genet 34, 903–914 (2018). [DOI] [PubMed] [Google Scholar]
- 20.Solovei I et al. LBR and lamin A/C sequentially tether peripheral heterochromatin and inversely regulate differentiation. Cell 152, 584–98 (2013). [DOI] [PubMed] [Google Scholar]
- 21.de Las Heras JI et al. Tissue specificity in the nuclear envelope supports its functional complexity. Nucleus 4, 460–77 (2014). [DOI] [PMC free article] [PubMed] [Google Scholar]
- 22.Joffe B, Leonhardt H & Solovei I Differentiation and large scale spatial organization of the genome. Curr. Opin. Genet. Dev 20, 562–9 (2010). [DOI] [PubMed] [Google Scholar]
- 23.Parada LA, McQueen PG & Misteli T Tissue-specific spatial organization of genomes. Genome Biol 5, R44 (2004). [DOI] [PMC free article] [PubMed] [Google Scholar]
- 24.Dekker J et al. The 4D nucleome project. Nature 549, 219–226 (2017). [DOI] [PMC free article] [PubMed] [Google Scholar]
- 25.Pombo A & Dillon N Three-dimensional genome architecture: players and mechanisms. Nat. Rev. Mol. Cell Biol 16, 245–57 (2015). [DOI] [PubMed] [Google Scholar]
- 26.Olins AL & Olins DE Cytoskeletal influences on nuclear shape in granulocytic HL-60 cells. BMC Cell Biol 5, 30 (2004). [DOI] [PMC free article] [PubMed] [Google Scholar]
- 27.Kim SH et al. Spatial genome organization during T-cell differentiation. Cytogenet. Genome Res 105, 292–301 (2004). [DOI] [PubMed] [Google Scholar]
- 28.Solovei I et al. Nuclear architecture of rod photoreceptor cells adapts to vision in mammalian evolution. Cell 137, 356–68 (2009). [DOI] [PubMed] [Google Scholar]
- 29.Engler AJ et al. Myotubes differentiate optimally on substrates with tissue-like stiffness: Pathological implications for soft or stiff microenvironments. J. Cell Biol 166, 877–887 (2004). [DOI] [PMC free article] [PubMed] [Google Scholar]
- 30.Jacot JG, McCulloch AD & Omens JH Substrate stiffness affects the functional maturation of neonatal rat ventricular myocytes. Biophys. J 95, 3479–87 (2008). [DOI] [PMC free article] [PubMed] [Google Scholar]
- 31.Yahalom-Ronen Y, Rajchman D, Sarig R, Geiger B & Tzahor E Reduced matrix rigidity promotes neonatal cardiomyocyte dedifferentiation, proliferation and clonal expansion. Elife 4, (2015). [DOI] [PMC free article] [PubMed] [Google Scholar]
- 32.Barnes JM, Przybyla L & Weaver VM Tissue mechanics regulate brain development, homeostasis and disease. J. Cell Sci 130, 71–82 (2017). [DOI] [PMC free article] [PubMed] [Google Scholar]
- 33.Porrello ER et al. miR-15 Family Regulates Postnatal Mitotic Arrest of Cardiomyocytes. Circ. Res 109, 670–679 (2011). [DOI] [PMC free article] [PubMed] [Google Scholar]
- 34.Young JL, Kretchmer K, Ondeck MG, Zambon AC & Engler AJ Mechanosensitive kinases regulate stiffness-induced cardiomyocyte maturation. Sci. Rep 4, 6425 (2014). [DOI] [PMC free article] [PubMed] [Google Scholar]
- 35.Sreejit P, Kumar S & Verma RS An improved protocol for primary culture of cardiomyocyte from neonatal mice. Vitr. Cell. Dev. Biol. - Anim 44, 45–50 (2008). [DOI] [PubMed] [Google Scholar]
- 36.Terme J-M et al. Histone H1 variants are differentially expressed and incorporated into chromatin during differentiation and reprogramming to pluripotency. J. Biol. Chem 286, 35347–57 (2011). [DOI] [PMC free article] [PubMed] [Google Scholar]
- 37.Barrero MJ, Sese B, Martí M & Izpisua Belmonte JC Macro histone variants are critical for the differentiation of human pluripotent cells. J. Biol. Chem 288, 16110–6 (2013). [DOI] [PMC free article] [PubMed] [Google Scholar]
- 38.Xia W & Jiao J Histone variant H3.3 orchestrates neural stem cell differentiation in the developing brain. Cell Death Differ 24, 1548–1563 (2017). [DOI] [PMC free article] [PubMed] [Google Scholar]
- 39.Valenzuela N et al. Cardiomyocyte-specific conditional knockout of the histone chaperone HIRA in mice results in hypertrophy, sarcolemmal damage and focal replacement fibrosis. Dis. Model. Mech 9, 335–45 (2016). [DOI] [PMC free article] [PubMed] [Google Scholar]
- 40.Rose BA, Force T & Wang Y Mitogen-activated protein kinase signaling in the heart: angels versus demons in a heart-breaking tale. Physiol. Rev 90, 1507–46 (2010). [DOI] [PMC free article] [PubMed] [Google Scholar]
- 41.Riccio A Dynamic epigenetic regulation in neurons: enzymes, stimuli and signaling pathways. Nat. Neurosci 13, 1330–7 (2010). [DOI] [PubMed] [Google Scholar]
- 42.Hogan MS, Parfitt DE, Zepeda-Mendoza CJ, Shen MM & Spector DL Transient pairing of homologous Oct4 alleles accompanies the onset of embryonic stem cell differentiation. Cell Stem Cell 16, 275–288 (2015). [DOI] [PMC free article] [PubMed] [Google Scholar]
- 43.Filion GJ et al. Systematic protein location mapping reveals five principal chromatin types in Drosophila cells. Cell 143, 212–24 (2010). [DOI] [PMC free article] [PubMed] [Google Scholar]
- 44.Mysliwiec MR et al. Jarid2 (Jumonji, AT rich interactive domain 2) regulates NOTCH1 expression via histone modification in the developing heart. J. Biol. Chem 287, 1235–1241 (2012). [DOI] [PMC free article] [PubMed] [Google Scholar]
- 45.Dal-Pra S, Hodgkinson CP, Mirotsou M, Kirste I & Dzau VJ Demethylation of H3K27 Is Essential for the Induction of Direct Cardiac Reprogramming by MIR Combo. Circ. Res 120, 1403–1413 (2017). [DOI] [PMC free article] [PubMed] [Google Scholar]
- 46.Bluemke DA et al. The Relationship of Left Ventricular Mass and Geometry to Incident Cardiovascular Events. The MESA (Multi-Ethnic Study of Atherosclerosis) Study. J. Am. Coll. Cardiol 52, 2148–2155 (2008). [DOI] [PMC free article] [PubMed] [Google Scholar]
- 47.Brumback LC et al. Body size adjustments for left ventricular mass by cardiovascular magnetic resonance and their impact on left ventricular hypertrophy classification. Int. J. Cardiovasc. Imaging 26, 459–468 (2010). [DOI] [PMC free article] [PubMed] [Google Scholar]
- 48.Akimoto T et al. Skeletal muscle adaptation in response to mechanical stress in p130cas −/− mice. Am. J. Physiol. Physiol 304, C541–C547 (2013). [DOI] [PubMed] [Google Scholar]
- 49.Sawada Y et al. Force Sensing by Mechanical Extension of the Src Family Kinase Substrate p130Cas. Cell 127, 1015–1026 (2006). [DOI] [PMC free article] [PubMed] [Google Scholar]
- 50.Kovacic-Milivojević B, Damsky CC, Gardner DG & Ilić D Requirements for the localization of p130 Cas to Z-lines in cardiac myocytes. Cell. Mol. Biol. Lett 7, 323–9 (2002). [PubMed] [Google Scholar]
- 51.Ni Z et al. P-TEFb is critical for the maturation of RNA polymerase II into productive elongation in vivo. Mol. Cell. Biol 28, 1161–70 (2008). [DOI] [PMC free article] [PubMed] [Google Scholar]
- 52.Le HQ et al. Mechanical regulation of transcription controls Polycomb-mediated gene silencing during lineage commitment. Nat. Cell Biol 18, 864–875 (2016). [DOI] [PubMed] [Google Scholar]
- 53.Ghosh S et al. Deformation Microscopy for Dynamic Intracellular and Intranuclear Mapping of Mechanics with High Spatiotemporal Resolution. Cell Rep 27, 1607–1620.e4 (2019). [DOI] [PMC free article] [PubMed] [Google Scholar]
- 54.Henderson JT, Shannon G, Veress AI & Neu CP Direct measurement of intranuclear strain distributions and RNA synthesis in single cells embedded within native tissue. Biophys. J 105, 2252–61 (2013). [DOI] [PMC free article] [PubMed] [Google Scholar]
- 55.Lu W et al. Nesprin interchain associations control nuclear size. Cell. Mol. Life Sci 69, 3493–3509 (2012). [DOI] [PMC free article] [PubMed] [Google Scholar]
- 56.Grady RM, Starr D. a, Ackerman GL, Sanes JR & Han M Syne proteins anchor muscle nuclei at the neuromuscular junction. Proc. Natl. Acad. Sci. U. S. A 102, 4359–4364 (2005). [DOI] [PMC free article] [PubMed] [Google Scholar]
- 57.Iyer KV, Pulford S, Mogilner A & Shivashankar GV Mechanical activation of cells induces chromatin remodeling preceding MKL nuclear transport. Biophys. J 103, 1416–1428 (2012). [DOI] [PMC free article] [PubMed] [Google Scholar]
- 58.Auld AL & Folker ES Nucleus-dependent sarcomere assembly is mediated by the LINC complex. Mol. Biol. Cell 27, 2351–2359 (2016). [DOI] [PMC free article] [PubMed] [Google Scholar]
- 59.Balakrishnan L & Milavetz B Epigenetic Regulation of Viral Biological Processes. Viruses 9, (2017). [DOI] [PMC free article] [PubMed] [Google Scholar]
- 60.Brumbaugh J et al. Inducible histone K-to-M mutations are dynamic tools to probe the physiological role of site-specific histone methylation in vitro and in vivo. Nat. Cell Biol 21, 1449–1461 (2019). [DOI] [PMC free article] [PubMed] [Google Scholar]
- 61.Lewis PW et al. Inhibition of PRC2 activity by a gain-of-function H3 mutation found in pediatric glioblastoma. Science (80-. ) 340, 857–861 (2013). [DOI] [PMC free article] [PubMed] [Google Scholar]
- 62.Herz HM et al. Histone H3 lysine-to-methionine mutants as a paradigm to study chromatin signaling. Science (80-. ) 345, 1065–1070 (2014). [DOI] [PMC free article] [PubMed] [Google Scholar]
- 63.Sexton T, Schober H, Fraser P & Gasser SM Gene regulation through nuclear organization. Nat. Struct. Mol. Biol 14, 1049–55 (2007). [DOI] [PubMed] [Google Scholar]
- 64.Honda H et al. Cardiovascular anomaly, impaired actin bundling and resistance to Src- induced transformation in mice lacking p130(Cas). Nat. Genet 19, 361–365 (1998). [DOI] [PubMed] [Google Scholar]
- 65.Queisser G, Wiegert S & Bading H Structural dynamics of the cell nucleus: basis for morphology modulation of nuclear calcium signaling and gene transcription. Nucleus 2, 98–104 (2011). [DOI] [PMC free article] [PubMed] [Google Scholar]
- 66.Stephens AD et al. Chromatin histone modifications and rigidity affect nuclear morphology independent of lamins. Mol. Biol. Cell 29, 220–233 (2018). [DOI] [PMC free article] [PubMed] [Google Scholar]
- 67.Alam SG et al. The mammalian LINC complex regulates genome transcriptional responses to substrate rigidity. Sci. Rep 6, 38063 (2016). [DOI] [PMC free article] [PubMed] [Google Scholar]
- 68.Spitzer NC Electrical activity in early neuronal development. Nature 444, 707–712 (2006). [DOI] [PubMed] [Google Scholar]
- 69.Wilkie GS et al. Several Novel Nuclear Envelope Transmembrane Proteins Identified in Skeletal Muscle Have Cytoskeletal Associations. Mol. Cell. Proteomics 10, M110.003129 (2011). [DOI] [PMC free article] [PubMed] [Google Scholar]
- 70.Zuleger N et al. Specific nuclear envelope transmembrane proteins can promote the location of chromosomes to and from the nuclear periphery. Genome Biol 14, R14 (2013). [DOI] [PMC free article] [PubMed] [Google Scholar]
- 71.Mehta IS, Amira M, Harvey AJ & Bridger JM Rapid chromosome territory relocation by nuclear motor activity in response to serum removal in primary human fibroblasts. Genome Biol 11, R5 (2010). [DOI] [PMC free article] [PubMed] [Google Scholar]
- 72.Kulashreshtha M, Mehta IS, Kumar P & Rao BJ Chromosome territory relocation during DNA repair requires nuclear myosin 1 recruitment to chromatin mediated by ϒ-H2AX signaling. Nucleic Acids Res 44, 8272–91 (2016). [DOI] [PMC free article] [PubMed] [Google Scholar]
- 73.Aureille J, Belaadi N & Guilluy C Mechanotransduction via the nuclear envelope: a distant reflection of the cell surface. Curr. Opin. Cell Biol 44, 59–67 (2017). [DOI] [PubMed] [Google Scholar]
- 74.Hoffman LM et al. Mechanical stress triggers nuclear remodeling and the formation of transmembrane actin nuclear lines with associated nuclear pore complexes. Mol. Biol. Cell 31, 1774–1787 (2020). [DOI] [PMC free article] [PubMed] [Google Scholar]
- 75.Pasqualini FS et al. Traction force microscopy of engineered cardiac tissues. PLoS One 13, e0194706 (2018). [DOI] [PMC free article] [PubMed] [Google Scholar]
- 76.Xu X, Li Z, Cai L, Calve S & Neu CP Mapping the Nonreciprocal Micromechanics of Individual Cells and the Surrounding Matrix Within Living Tissues. Sci. Rep 6, 24272 (2016). [DOI] [PMC free article] [PubMed] [Google Scholar]
- 77.Worke LJ et al. Densification of Type I Collagen Matrices as a Model for Cardiac Fibrosis. Adv. Healthc. Mater 6, (2017). [DOI] [PMC free article] [PubMed] [Google Scholar]
- 78.Kim D, Paggi JM, Park C, Bennett C & Salzberg SL Graph-based genome alignment and genotyping with HISAT2 and HISAT-genotype. Nat. Biotechnol 37, 907–915 (2019). [DOI] [PMC free article] [PubMed] [Google Scholar]
- 79.Liao Y, Smyth GK & Shi W FeatureCounts: An efficient general purpose program for assigning sequence reads to genomic features. Bioinformatics 30, 923–930 (2014). [DOI] [PubMed] [Google Scholar]
- 80.Love MI, Huber W & Anders S Moderated estimation of fold change and dispersion for RNA-seq data with DESeq2. Genome Biol 15, (2014). [DOI] [PMC free article] [PubMed] [Google Scholar]
- 81.Yu G, Wang LG, Han Y & He QY ClusterProfiler: An R package for comparing biological themes among gene clusters. Omi. A J. Integr. Biol 16, 284–287 (2012). [DOI] [PMC free article] [PubMed] [Google Scholar]
- 82.Gorkin DU et al. An atlas of dynamic chromatin landscapes in mouse fetal development. Nature 583, 744–751 (2020). [DOI] [PMC free article] [PubMed] [Google Scholar]
- 83.Ramírez F, Dündar F, Diehl S, Grüning BA & Manke T DeepTools: A flexible platform for exploring deep-sequencing data. Nucleic Acids Res 42, (2014). [DOI] [PMC free article] [PubMed] [Google Scholar]
- 84.Li Q et al. Selection of reference genes for normalization of quantitative polymerase chain reaction data in mouse models of heart failure. Mol. Med. Rep 11, 393–9 (2015). [DOI] [PubMed] [Google Scholar]
- 85.Martino A et al. Selection of reference genes for normalization of real-time PCR data in minipig heart failure model and evaluation of TNF-α mRNA expression. J. Biotechnol 153, 92–9 (2011). [DOI] [PubMed] [Google Scholar]
- 86.Pereyra AS et al. Loss of cardiac carnitine palmitoyltransferase 2 results in rapamycin-resistant, acetylation-independent hypertrophy. J. Biol. Chem 292, 18443–18456 (2017). [DOI] [PMC free article] [PubMed] [Google Scholar]
- 87.Chen CY et al. Suppression of detyrosinated microtubules improves cardiomyocyte function in human heart failure. Nat. Med 24, 1225–1233 (2018). [DOI] [PMC free article] [PubMed] [Google Scholar]
- 88.Peyster EG et al. In Situ Immune Profiling of Heart Transplant Biopsies Improves Diagnostic Accuracy and Rejection Risk Stratification. JACC Basic to Transl. Sci 5, 328–340 (2020). [DOI] [PMC free article] [PubMed] [Google Scholar]
- 89.Pugach EK, Blenck CL, Dragavon JM, Langer SJ & Leinwand LA Estrogen receptor profiling and activity in cardiac myocytes. Mol. Cell. Endocrinol 431, 62–70 (2016). [DOI] [PMC free article] [PubMed] [Google Scholar]
- 90.Chu J et al. Non-invasive intravital imaging of cellular differentiation with a bright red-excitable fluorescent protein. Nat. Methods 11, 572–578 (2014). [DOI] [PMC free article] [PubMed] [Google Scholar]
- 91.Kennani S. El et al. MS_HistoneDB, a manually curated resource for proteomic analysis of human and mouse histones. Epigenetics Chromatin 10, 2 (2017). [DOI] [PMC free article] [PubMed] [Google Scholar]
Associated Data
This section collects any data citations, data availability statements, or supplementary materials included in this article.
Supplementary Materials
Video 1: CMs from H2b-eGFP mice were plated on 13 kPa PDMS substrates and infected with the adenoviral control vector CTL (see Fig. 6a) on day one. Image series of myofibril contractions were recorded on day two via fluorescently tagged α-actinin 2 using an inverted widefield microscope.
Video 2: CMs from H2b-eGPP mice were plated on 140 kPa PDMS substrates and infected with the adenoviral control vector CTL (see Fig. 6a) on day one. Image series of myofibril contraction were recorded on day two via fluorescently tagged α-actinin 2 using an inverted widefield microscope.
Video 3: CMs from H2b-eGFP mice plated on 13 kPa PDMS substrates and infected with the adenoviral decoupling vector K3 (see Fig. 6a) on day one. Image series of myofibril contraction were recorded on day two via fluorescently tagged α-actinin 2 using an inverted widefield microscope.


