

Abstract
By producing a first-of-its-kind, decadal-scale wildfire plume rise climatology in the Western U.S. and Canada, we identify trends toward enhanced plume top heights, aerosol loading aloft, and near-surface smoke injection throughout the American West. Positive and significant plume trends suggest a growing impact of Western US wildfires on air quality at the local to continental scales and support the notion that wildfires may have an increasing impact on regional climate. Overlap of identified trends with regions of increasing wildfire emissions and burn severity suggests a link to climate driven trends toward enhanced wildfire activity. Further, time series of plume activity point to a possible acceleration of trends over recent years, such that the future impacts to air quality and regional climate may exceed those suggested by a linear fit to the multi-decadal data. These findings have significant implications for human health and exacerbate concern for the climate–wildfire connection.
Subject terms: Atmospheric science, Climate change, Environmental impact
Introduction
Aerosols emitted by wildfires1 affect both air quality and climate. Aerosol particulate matter with an aerodynamic diameter less than 2.5-microns (PM2.5) has been linked to enhanced population level mortality2,3 and increased instances of respiratory illness4–7. Relative to PM2.5 from non-fire sources (e.g., industrial emissions), mounting evidence suggests that wildfire emitted PM2.5 may be more toxic5,8, therefore posing a greater risk to human health. In terms of climate, aerosol loading from wildfires has a direct radiative impact in the form of absorption and scattering of incoming solar radiation by black carbon9,10 and organic aerosols11, respectively. Additionally, wildfire emitted aerosols generate indirect radiative effects by altering cloud microphysics12,13.
Over recent decades, Western US wildfire activity has become increasingly intense, with many mountainous regions demonstrating increases in annual fire area burned14–16, annual fire area burned at high-severity14, the number of large wildfires16, wildfire emissions of aerosol17, and in some cases high-altitude burning18. Similarly, portions of British Columbia demonstrate increases in wildfire emissions17. This shift in wildfire activity has been, in part, attributed to a changing climate, with strong links drawn to increasing temperatures and aridity14,18–21, reduced summertime precipitation22, and a declining snowpack23,24. Significant increases in extreme fire weather across the Western US over the years 1979–2020 have been attributed to increases in the vapor pressure deficit, decreases in relative humidity, and the dependence of these aforementioned shifts on increasing temperatures21. Wildfire activity in the Klamath Mountains/North Coast and Sierra Nevada regions of California, which are large contributors to wildfire activity at the scale of the Western US, has been linked to warming temperatures and increased atmospheric aridity20. Similarly, increases in high altitude burning across the Sierra Nevada, Middle Rockies, and Southern Rockies have also been attributed to drier conditions and warmer temperatures18. Global climate models indicate 2 °C of warming by the year 2050 would continue to exacerbate wildfire activity25, thereby increasing the air quality and climate impacts of large wildfires. Given the legacy of fire suppression in Western US forests, it is reasonable to expect these impacts to be further amplified26.
Wildfire plume rise, a result of buoyancy produced by combustion-derived heating, determines the altitude at which wildfire emitted aerosols are injected into the atmosphere, modulating the air quality and climate impacts of a given wildfire. The plume injection height often dictates the transport pathway of wildfire smoke. For smoke injections of equal mass, penetrative injections above the planetary boundary layer (PBL) enhance the potential for air quality impacts at regional to continental distances from the fire due to the efficiency of long-range transport and the potential for subsequent boundary layer entrainment27–29. Conversely, injections confined to the PBL pose a greater risk to local air quality as they are less vertically diluted30. Similarly, aerosol injection aloft is associated with a greater potential for climate forcing by wildfire aerosols, given the longer residence times31,32, reduced attenuation of incoming solar radiation at altitude9,29, and temperature dependence of radiative emissions from the smoke plume33. Further, the radiative effects of aerosol-cloud interactions are sensitive to the injection altitude of black carbon34. In extreme cases, deep pyro-convection may inject aerosols directly into the stratosphere35,36, producing a stratospheric aerosol mass that is comparable to a moderate volcanic eruption37. Injection of wildfire emitted aerosols above the tropopause is linked to positive top-of-the-atmosphere radiative forcing at the hemispheric scale38, reductions in surface temperature39,40, reductions in stratospheric ozone41, and disruptions of atmospheric circulations in the lower stratosphere42,43.
The heights of wildfire smoke plumes are a complex function of the wildfire heat flux, fire geometry, and the ambient meteorological profile44. While a weak correlation exists between the fire intensity and plume top height30,45, atmospheric stability acts to limit the buoyant plume rise30,46 by inducing plume injection/smoke detrainment. As the plume rises, environmental eddies entrain cold air into the plume, diluting the vertical momentum and therefore limiting the plume top height47. The effects of dynamic entrainment, produced by a strong horizontal wind47, result in a bent-over plume structure48. Furthermore, latent heat release offers a means to fuel additional plume rise, highlighting the importance of moist layers and moist convection to plume top height30. As testament to the role of moist convection, the inverted-V sounding, in which a moist layer sits atop a relatively deep and dry surface layer, has been positively linked to pyrocumulonimbus (deep pyro-convection; pyroCb) development and instances of stratospheric aerosol injection33.
Despite remaining uncertainties as to the exact governing equations of the wildfire plume rise and its expression in a modeling framework44, climate driven trends toward enhanced wildfire activity14–24 and related degradation of Western US air quality17,49,50 highlight the need for investigation into the evolving state of wildfire aerosol injection and the associated vertical mass distribution. At present, the temporal and spatial limitations of satellite sampling by space-borne sensors—i.e., the Multi-angle Imaging SpectroRadiaometer (MISR) and Cloud-Aerosol Lidar with Orthogonal Polarization (CALIOP)—prohibit a purely observational investigation of this topic. Plume top heights observed by MISR, which is limited to making observations during the late morning, indicate that the fraction of plumes penetrating above the PBL is highly sensitive to the definition of plume top. When the plume injection height is defined as the median MISR retrieved height for all pixels in a given plume, a mere 4–18% of North American plumes penetrate above the PBL30,51,52. However, when the plume injection height is defined as the maximum retrieved height for an individual plume, 48% of North American plumes are found to exceed the PBL45. Further, plume penetration above the PBL is complicated by the presence of diurnal cycles in fire intensity and lower atmospheric instability. When applied to global plume activity, the Freitas et al.47,53 plume rise model depicts a diurnal cycle in which ~ 25% of plumes penetrate above the PBL during morning hours, while the late afternoon maximum in fire intensity54,55 and enhanced lower atmospheric instability correspond to a value of ~ 53%56. Due to limited plume top observations and uncertainties surrounding plume rise modeling44,45,57, even less is known about the vertical distribution of detrained aerosol mass below the plume top. Observations from 20 controlled burns in the US Southeast suggest that the majority of plumes are either vertically well mixed or preferentially inject emissions aloft58. Coupled atmospheric—fire spread modelling, 3 -dimensional plume rise modeling, and detrained particle trajectory modeling suggest a tendency for plumes to deliver a majority of their aerosol mass toward the plume top47,59,60, while existing parameterizations for chemical transport modeling range from parabolic and Gaussian distributions to a constant dilution throughout the depth of the PBL44,47,57.
Given limitations in previous observational and modeling approaches, investigation into the evolving vertical distribution of wildfire injected aerosol mass requires a plume rise modeling framework that simulates both the plume top height and the vertical mass distribution in a manner supported by the limited observations and relevant theory. Application of such a framework to simulation of one-dimensional wildfire plumes at the regional-decadal scale may provide the sample size necessary for meaningful statistical analyses in the context of model uncertainty. Here we seek to generate a physics-based wildfire plume rise climatology that (i) leverages satellite burned area data, wildfire emissions, and atmospheric modeling outputs to provide regional scale understanding of plume activity beyond the limited satellite sampling, (ii) combines information on plume entrainment and mass conservation to estimate the vertical smoke detrainment profile of individual plumes, and (iii) when linked to wildfire PM2.5 emissions, allows the first estimate of how the vertical distribution of wildfire aerosol may evolve under climate driven trends toward increasingly intense wildfire activity.
Results
We use the Freitas et al.47,53 plume rise model (hereafter abbreviated as “F2010”, see “Freitas et al. plume rise model” section in “Methods” section), and an entrainment–mass conservation approach (see “Entrainment–mass conservation” section in “Methods” section) to estimate the vertical mass distribution of detrained smoke. Thus, we construct a plume rise climatology of ~ 4.6 million plumes occurring within the Western US and Western Canada during the months of August and September for the years 2003–2020. Model outputs are combined with PM2.5 emissions from the Quick Fire Emissions Dataset (QFED)61 and are considered in the context of PBL heights adopted from the Stochastic Time-Inverted Lagrangian Transport model (STILT; see “PBL estimates from STILT” section in “Methods” section)62,63. Linear regression and hinge fitting analyses (two-piece linear regressions, see “Trend analyses” section in “Methods” section) are used for insight into the trend of wildfire plume top heights and the vertical distribution of wildfire injected aerosol mass at the ecoregion scale. Ecoregions featuring prominently within the results are labeled in Fig. 1, with their corresponding number of simulated plumes per year presented in Table S1. Model evaluation is performed via comparison to the MISR plume heights dataset64. Emphasis is placed on August and September plumes given previously-identified wildfire emissions trends17 and the computational/storage expense of generating regional-decadal scale model inputs.
Figure 1.

(a) Results for linear regressions trend analyses (2003–2020) of the maximum August–September plume top height for Western US ecoregions and Canadian ecoprovinces based on ~ 4.6 million plumes. (b) Same as (a), but for the PM2.5 flux-weighted average plume top height. Only trends significant at p < 0.1 are displayed, with a crosshatch overlaid on trends with p < 0.05. Ecoregions relevant to the results presented within this manuscript are labelled. Given the similarity of trends presented in (b) for the Sierra Nevada, Central California Foothills and Coastal Mountains, and Klamath Mountains/California High North Coast Range ecoregions, a visual distinction may be made by viewing Fig. 2. Complete mappings of United States level 3 ecoregions66 and Canadian ecoprovinces67 are available from the United States Environmental Protection Agency and the Government of Canada.
Results of trend analyses should be considered within the context of potentially large uncertainties. Model inputs characterizing the wildfire heat flux and active burn area are influenced by satellite spatial resolution, the ability of clouds to obscure satellite observations, the assumption of a constant heat release per unit biomass burned, and the imperfect synthesis of burned area and heat release datasets (“Wildfire inputs” section). Further, though the model framework captures the core of the MISR observed plume top height distribution, there is evidence of a systemic underestimation of the frequency of the tallest plume tops, likely impacting the presented trend analyses.
Trends in plume top height and aerosol mass injection
Ecoregion scale analyses within the Western US and Canada indicate that wildfire plume top heights are increasing throughout much of the mountainous Western US between the years of 2003 and 2020. In terms of the maximum plume top height during the months of August and September, we find trends as large as ~ 230 m per year in the Sierra Nevada ecoregion and trends in excess of 100 m per year in the Southern Rockies, Eastern Cascades, Arizona—New Mexico Mountains, and the Wasatch—Uinta ecoregions (Fig. 1a). If performed for the 5, 10, 30, or 100 largest plume top heights per year in each ecoregion, robust trends toward enhanced plume top heights persist in the Sierra Nevada and Eastern Cascades. Trend analyses considering the PM2.5 flux (kg PM2.5 emitted within the plume per second)—weighted average plume top height (Fig. 1b) further support the growth of plume top heights for the strongest emitting fires across much of the Western US, including notable trends in the mountain adjacent Colorado Plateau and Mojave Basin and Range ecoregions (> 30 m/year). While statistically insignificant, hinge fits (see “Trend analyses” section in “Methods” section) to the data suggest an acceleration of flux-weighted average plume top trends from ~ 2018 to 2020, highlighting the unprecedented nature of recent Western US wildfire activity relative to 2003—mid-2010s. In the Klamath Mountains, Sierra Nevada, and Southern Rockies, we find hinge fit trends (2017/2018–2020) of 99.0, 201.2, and 256.1 m/year, respectively, representing enhancements by a factor of 9–15 relative to results from linear regression (2003–2020). The presence of positive, significant (p < 0.1), and potentially accelerating trends throughout much of the mountainous Pacific Northwest and California, as well as the Southern Rockies, overlaps with previously identified potential wildfire emissions “hotspots”17.
We further undertake an examination of trends in the most extreme fire activity, as represented by pyrocumulonimbus (pyroCb) formation, defined by especially tall plumes with a plume top temperature < − 38 °C (the homogenous freezing temperature for liquid water) being leveraged as a pyroCb proxy65. We find the possibility of increasingly frequent pyroCb activity within the Colorado Plateau (~ 0.12 pyroCb hours/year). Although trends for other ecoregions and the Western US/Canada as a whole are statistically insignificant, this climatology finds the first occurrence of pyroCb development in 6 ecoregions between 2017 and 2020, demonstrating an acceleration in recent years. These ecoregions include the Colorado Plateau, Southern Rockies, Sierra Nevada, Wasatch-Uinta, Mojave Basin and Range, and Northwestern Great Plains. Hinge fits further support the possibility of a recent uptick in pyroCb activity, with hinged trends (p > 0.1; 2018–2020) of 2.72, 2.15, and 0.43 pyroCb hours/year for the Colorado Plateau, Southern Rockies, and Sierra Nevada, respectively. A comparison of simulated pyroCb activity for 2013 to the observational inventory of pyroCb activity constructed by Peterson et al.65 indicates that this model framework reasonably captured the pyroCb formation above the Pony/Elk and Beaver Creek fires in Idaho, while failing to reflect the observed pyroCb activity above the Rim fire in California. Should pyroCb trends present greater clarity over the coming years, this result would support the growing concerns surrounding pyroCb induced warming of the stratosphere38,39.
An examination of aerosol mass injection indicates trends toward enhanced injection aloft throughout much of the Western US. Trends in aerosol mass injection above or within the PBL (see “PBL estimates from STILT” section in “Methods” section) largely follow total emissions trends (Fig. 2), highlighting wildfire activity in the Klamath Mountains and the Sierra Nevada. This result is noteworthy given the evidence for climate driven enhancements, via atmospheric aridity, to wildfire activity in these regions18–21. When limiting timeseries to 2003–2019 (a rather quiet fire year in the Western US), trend analyses further support the presence of positive and significant trends across numerous ecoregions (p < 0.1; p < 0.05—above the PBL in the Sierra Nevada and for all trends in the Klamath Mountains), bolstering confidence in this result given the effect of extreme 2020 values (Fig. 3) on trends fitted to 2003–2020. Altitude-based thresholds highlight significant injection trends up to 7 km altitude for the Sierra Nevada, Southern Rockies, Colorado Plateau, and Arizona—New Mexico mountains (Fig. 4i). A diurnal breakdown of the aforementioned PBL injection trends, based on a 3-h rolling window, indicates that trends are most robust near 18:00 local time (Fig. S1), a result that corresponds to the late afternoon maximum in wildfire activity54,55 and the expectation of midday PBL growth. The relevance of enhanced injection above the PBL and at altitudes from 1 to 8 km (Fig. 4) to climate impacts is drawn from recognition of the importance of altitude to extending the aerosol atmospheric lifetime29,31,32, enhancing the direct radiative effects of an absorbing aerosol layer29,68, and expanding the potential for impact on cloud processes. Recent aircraft-based observations indicate the ability of smoke aerosols to suppress downwind precipitation by acting as a source of cloud condensation nuclei, lowering the average cloud droplet size and staving off initiation of collision-coalescence12. Further, enhanced aerosol injection aloft increases the potential for regional-continental scale smoke transport. Thus, Western US and Canadian wildfires will have increasing potential to deteriorate air quality and visibility across much of North America69. Concurrent trends toward enhanced aerosol injection within the PBL (Fig. 2b) contribute to elevated risks of wildfire deteriorated air quality at the local scale, a feature of these results that is particularly concerning given a growing Western US population70. Hinge fit analyses of aerosol mass injections amplify concern for the potential climate and air quality impacts of Western US wildfires, as results depict the possibility of an emergent acceleration of trends relative to linear trends spanning 2003–2020 (Fig. 3, Fig. S2). While currently statistically insignificant, hinge fit results point toward the possibility of future Western US wildfire impacts to air quality and climate that are in excess of those suggested by a linear fit to 2003–2020. This possible acceleration of trends is in accordance with the extraordinarily large 2020 fire season71, and we strongly suspect analysis of the 2021 fire season would lend additional support.
Figure 2.
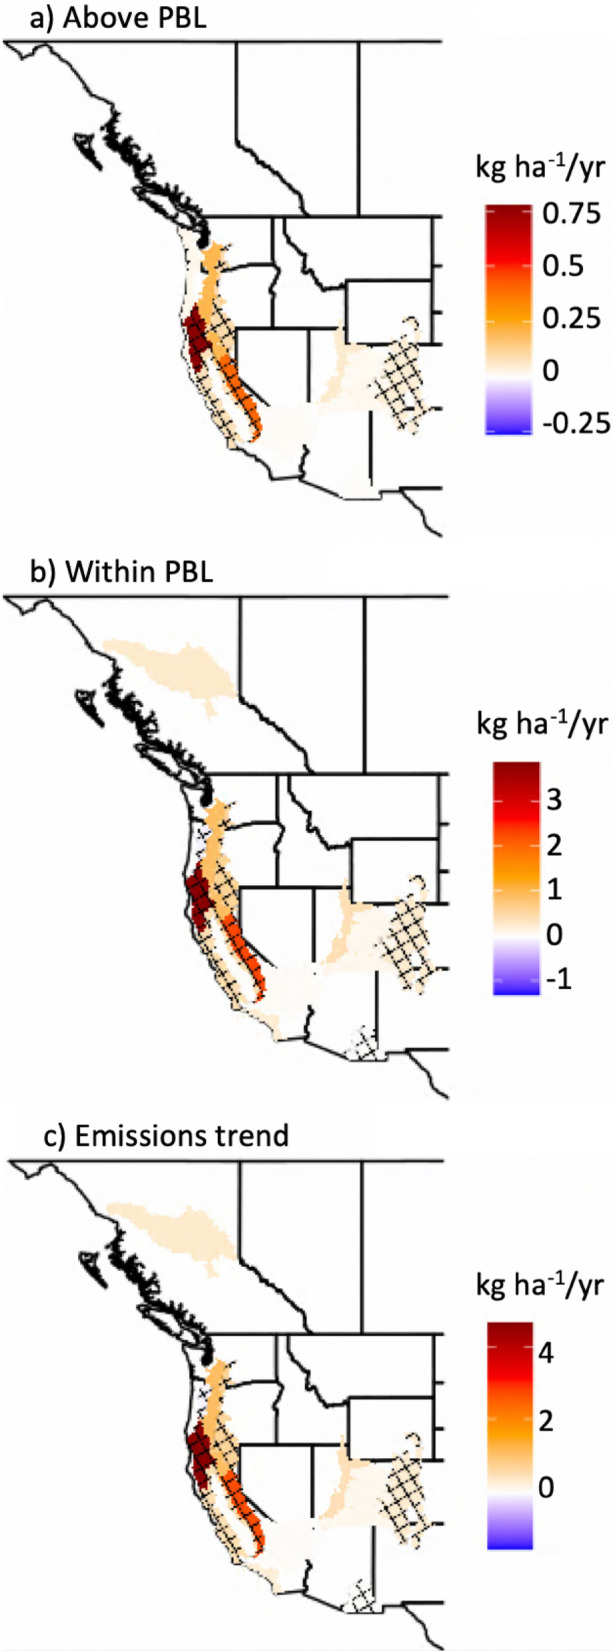
Results for trend analyses of the PM2.5 mass (a) injected above the PBL, (b) injected within the PBL, and (c) emitted by wildfires for Western US ecoregions and Canadian ecoprovinces during August and September of 2003–2020 based on ~ 4.6 million simulated plume rises. Only trends significant at p < 0.1 are displayed, with a crosshatch overlaid on trends with p < 0.05. Note the differences in the ranges represented by the color bars in (a–c).
Figure 3.
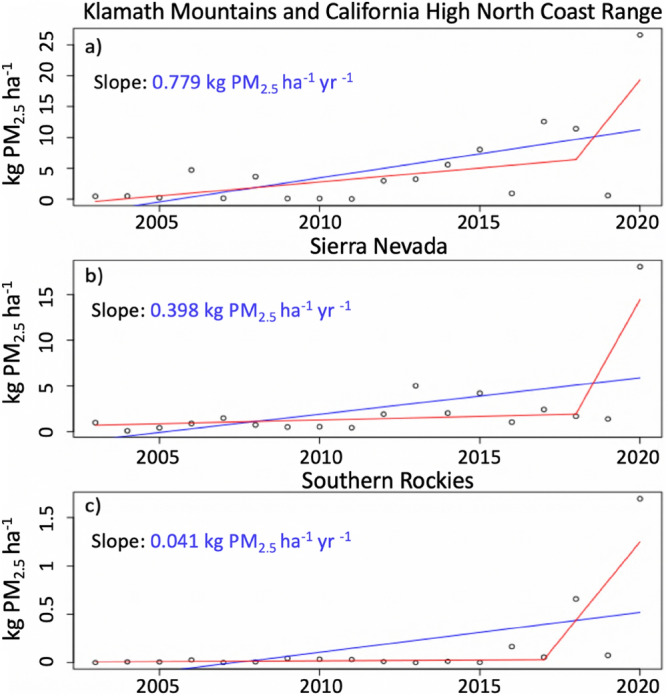
Results of linear (blue) and hinge fit (red) trend analyses for the PM2.5 mass injected above the PBL within the (a) Klamath Mountains and California High North Coast Range, (b) Sierra Nevada, and (c) Southern Rockies ecoregions. The slope associated with linear trends is listed in blue.
Figure 4.

Trends in the PM2.5 mass injected above (a) 1 km, (b) 2 km, (c) 3 km, (d) 4 km, (e) 5 km, (f) 6 km, (g) 7 km, and (h) 8 km, by wildfires during the months of August and September of the years 2003–2020. N-values indicate the number of plumes out of the original ~ 4.6 million that remain above the threshold altitude. Only trends significant at p < 0.1 are displayed, with a crosshatch overlaid on trends with p < 0.05. Note the differences in the ranges represented by the color bars.
Investigation into the evolution of above PBL emissions as a fraction of total wildfire injected aerosol reveals significant trends toward a growing percentage of emitted mass being injected above the PBL across the Sierra Nevada, Southern Rockies, and Northern Rockies ecoregions. We hypothesize that climate driven trends toward enhanced wildfire activity are responsible for increasing high altitude smoke injections, particularly across the Sierra Nevada and Southern Rockies. Warming enabled trends toward increased high altitude burning throughout the Sierra Nevada and portions of the Rockies18 suggest a possible explanation for trends toward preferential smoke injection above the PBL.
Evaluation against MISR observed plume top heights
Despite the uncertainties associated with generating a regional-decadal scale plume rise climatology (~ 4.6 million plumes), and those inherent to the current state of plume rise modeling44, we find that the modeled plumes evaluate well against MISR observed plume top heights when considering the context of previous evaluation efforts45,56,72. In an aggregate sense, we see that the distribution of model-derived plume top heights occurring during the late morning MISR overpass window captures much of the distribution of MISR observed plumes (Fig. 5a). While there is a systematic under-estimation of the proportion of high-altitude plumes, this result is in line with prior analyses employing the F2010 model45 and is a current reality of the challenges facing physics-based plume top estimates. We find that this model-derived climatology captures the range of MISR observed plume tops, though the numerous high-altitude plumes are proportionally less frequent than what is seen in the observations. As a caveat to this underestimation, it should be noted that the MISR datasets preferentially samples and digitizes larger plumes51.
Figure 5.

(a) A comparison of the distribution of MISR-observed and Freitas-modeled wildfire plume top heights occurring over the Western US and Canada during the months of August and September. (b) A map depicting the locations of the MISR-observed plumes used for validation, with color coding used to indicate whether a collocated plume from the modeled climatology agrees within the range of MISR uncertainty. These plumes represent the years 2008–2011 and 2017–2018, reflecting the limited temporal coverage of the MISR plume tops dataset.
On a plume-by-plume basis, we find a standard deviation of modeled plume top heights from MISR observations of 46.9 m for 425 sets of reasonably collocated plumes (within 30 min and 4 km). Of these 425 sets of collocated plumes, we see that 47.8% of modeled plume tops fall within the ± 500 m observational uncertainty of MISR and that there is little geographic clustering of model uncertainty (Fig. 5b), therefore suggesting consistency of model results across ecoregions. Prior analyses considering smaller spatial and/or temporal domains have reported up to 64% of modeled plume top heights falling within the MISR observational uncertainty56,72.
With relevance to above/within PBL injections, 41.4% (176 plumes) of the 425 sets of collocated plumes are found to straddle the PBL, with the modeled plume top above the PBL and the observed plume top within the PBL, or vice versa. In 71% of such cases, the modeled plume top exceeded the PBL, with PBL heights averaging 77.9% of the modeled plume top heights. In terms of the climatological average of the modeled vertical distribution of smoke below plume top, ~ 78% of the PM2.5 associated with these modeled plumes is being injected within the PBL. Given that the MISR observed plume top for these cases was contained within the PBL, this equates to an average model underestimate of the PM2.5 injected within the PBL of ~ 22% for such cases. Similarly, if it is assumed that the smoke is distributed evenly throughout a MISR observed plume and that the retrieved plume top heights should follow a normal distribution for any individual plume, an average of ~ 77% of the injected PM2.5 is contained within the PBL for the 29% of cases in which the MISR observation exceeded the PBL and the modeled plume top did not. Based on the findings of Val Martin et al.51, this assumption of a normal distribution for MISR retrieved heights is reasonable in many cases, though a lognormal distribution is likely more common. As such, it is reasonable to expect that > 77% of the PM2.5 associated with these MISR observed plumes is retained within the PBL, enhancing the agreement with modeled injections. Overall, this analysis supports the idea of largely cancelling over/underestimation of PM2.5 injection relative to the PBL, though given the greater frequency of modeled plume tops exceeding the PBL when MISR observations do not, it appears likely that the net effect is a modest overestimation of above PBL PM2.5 injection.
Discussion
We find that trends toward enhanced wildfire activity correspond to elevated wildfire plume top heights and aerosol injection aloft for the majority of mountainous ecoregions across the Western US. August–September plume top maxima (Fig. 1a) and PM2.5 flux-weighted average plume tops (Fig. 1b) exhibit statistically significant increasing trends across many Western U.S. ecoregions. These trends were collocated with increases in wildfire emissions (Fig. 2c), most notably across the Sierra Nevada ecoregion. Recast in terms of the aerosol mass injected, we find that the spatial variability of injection trends above and within the PBL (Fig. 2a,b) is largely explained by variability in wildfire emissions trends, albeit the Sierra Nevada and portions of the Rockies demonstrate a shift towards preferential smoke injections above the PBL. We hypothesize that the Sierra Nevada and Southern Rockies are exhibiting trends toward a greater fraction of smoke being emitted above the PBL due to climate enabled enhancements in high altitude burning18,73. Furthermore, there is a potentially emergent acceleration of flux-weighted average plume top, aerosol mass injection, and pyroCb trends over recent years (2017/2018–2020). Enhanced high-altitude injections of smoke aerosol mass (Fig. 4) suggests evolution of the vertical distribution of wildfire emitted aerosols in response to increasingly intense wildfire activity. In light of the climate change—wildfire connection across the Western US14–24, we suspect a causal chain that, in part, implicates climate change in elevated wildfire plume top heights and enhanced aerosol injection aloft.
Given the link between aerosol injection altitude and the corresponding air quality impacts, our findings suggest that wildfire activity in the Western US presents a growing risk in terms of long-range smoke transport and air quality degradation. Concurrent upward trends in the mass of biomass burning aerosols injected above and within the PBL present a threat to human health across local to continental scales. Recent wildfire activity stands testament to this, with the 2020 fire season likely producing thousands of smoke-related deaths71, and satellite imagery suggesting continental scale smoke transport akin to the documented presence of Western US/Canadian wildfire smoke in New York City in August of 201874.
From a climate perspective, these results point to Western US wildfire activity as becoming increasingly relevant to regional climate. Injection of a greater aerosol mass at higher altitudes, potentially into the upper troposphere—lower stratosphere, corresponds to an enhanced direct radiative effect given longer atmospheric lifetimes and increased absorption efficacy9,29,31,32,68. While less understood, there are also potential indirect effects related to aerosol-cloud microphysical interactions12,13,34. Though speculative, the potential for wildfire-derived aerosols to act as cloud condensation nuclei13 and stave off initiation of rainfall12,13 is further cause for concern given the risk of a positive feedback on wildfire activity.
As caveats to the results presented within this study, we note that due to the multi-decadal timeframe considered and the associated computational cost, the model framework neglects the possibility of multi-core plume updrafts within an active fire75, as well as fire-atmosphere and aerosol-PBL feedbacks that can alter the PBL height and aerosol mass fraction contained within the PBL76–78. Additionally, we do acknowledge that vegetation type produces variability in the heat release per unit dry matter burned by wildfires. However, this heat release remains relatively constant between 16 and 22 MJ/kg as shown in pervious literature79. Furthermore, the F2010 model exhibits relatively low sensitivity to heat flux inputs53. Therefore, we suspect that the assumed heat release constant of 18.6 MJ/kg has not skewed the results presented here.
While the questions addressed herein provide a critical initial view of how the vertical distribution of wildfire emitted aerosols has evolved over the Western US and Canada over the past two decades, the presented hinge fit results suggest that this topic will need to be revisited in future studies. Further development of wildfire plume rise modeling and the inclusion of additional years of data should provide for an improved understanding of trends in wildfire aerosol injection. Furthermore, given global variability in wildfire activity80, it is apparent that investigation into plume height trends at the global scale would better elucidate the potential climate impacts of increasingly intense wildfire activity14–18. Such an investigation would be particularly valuable should plume height trends be considered within a radiative modelling framework. An expanded understanding of the evolving vertical distribution of wildfire emitted aerosols would hold direct relevance to air-quality and climate change projections, expression of wildfire emissions in near-field modeling efforts, and the accuracy of aerosol layer height assumptions required for satellite retrievals of absorbing aerosols.
Methods
Data
The spatial information, temporal information, and usage of datasets included in this study are presented in Table 1. Individual dataset descriptions can be found in Supplemental Information (SI) Sect. S2.
Table 1.
A description of the data products used.
| Product name | Spatial info | Temporal info | Usage |
|---|---|---|---|
| QFED PM2.5 emissions | 0.1°, CONUS/CA | Daily, 2003–2020 | Heat flux derivation, PM2.5 injections |
| MCD64A1 version 6 | 500 m, CONUS/CA | Daily, 2003–2020 | Active burn area |
| GFED 4.1 s | 0.25°, CONUS/CA | 2003–2020 | Temporal downscaling |
| MISR plume heights (MINX v.4) | 1.1 km horizontal resolution, 500 m vertical uncertainty | Late morning overpass, 2008–2011, 2017–2018 | Model evaluation |
| TDL U.S. and Canada Surface Hourly Observations81 | 1258 sites, CONUS/CA | Hourly, 2003–2020 | Surface WRF evaluation |
| Rawinsonde data82 | 24 sites, CONUS/CA | 00/12 UTC, 2003–2020 | Upper air WRF evaluation |
| Climate Forecast System (Reanalysis & v2)83 | 0.5°, 40 vertical levels | 6-h, 2003–2020 | WRF initial and boundary conditions |
| USGS land use types | ~ 1 km | Static | WRF input |
The spatial and temporal information reflects the regions and years used in this study. Geographic acronyms: Continental United States (CONUS), Canada (CA).
*All datasets subset to West of − 100° E longitude.
Models
Freitas et al. plume rise model
The F2010 model is a 1-dimensional, physics-based model that relies on the vertical momentum equation, the first law of thermodynamics, and mass continuity for water phases. Processes related to lateral and dynamic entrainment are also parameterized within this model. The F2010 model estimates the wildfire plume top height as a function of wildfire heat flux density, active burn area, and environmental conditions ingested from an atmospheric transport model. By iteratively solving for a steady state plume rise solution, the F2010 model is able to approximate the plume top height and a thermodynamic profile of the final plume at 100 m vertical resolution. The plume top height is defined as the altitude at which the plume is neutrally buoyant, and is approximated as a vertical velocity < 1 m/s. Entrainment coefficients, output as part of the thermodynamic profile, can be used to estimate the vertical profile of aerosol detrainment below plume top when it is assumed that mass is conserved within the column for a steady state solution.
While uncertainties remain in the model, F2010 was selected for its adherence to a physical basis and its ability to account for latent heat release by cloud microphysical processes47,53. Empirical plume rise schemes neglecting latent heat release through condensation and freezing are thus at a disadvantage relative to F2010. Evaluating the performance of the F2010 model is difficult given limited observations and the relatively poor constraint on wildfire heat flux and active burn area inputs. A breakdown of errors due to input uncertainty relative to the model structure is unknown at this time. In an evaluation of the F2010 model against MISR plume top observations, Val Martin et al.45 take a range of approaches to model input, ultimately finding a maximum correlation strength to the observations of ~ 0.3 and a consistent underestimation of the dynamic range of plume top heights. Ke et al.56 noted that 64% of their simulations using the F2010 model generated plume top heights within the MISR uncertainty of ± 500 m, a result comparable to the 63% value associated with a similar evaluation of the Sofiev et al.72 plume rise formulation. In this study, given the number of plumes to be modelled (~ 4.6 million), explicit simulation of individual wildfire plumes using a coupled atmosphere—fire spread model (e.g. WRF-Sfire)84 was not computationally feasible.
For this study, we supplied the F2010 model with environmental conditions from nested Weather Research and Forecasting (WRF)85 model output, and wildfire inputs generated through a combination of wildfire PM2.5 emissions estimates61, burned area estimates (MCD64A1)86, and sub-daily temporal downscaling profiles based on satellite active fire detections54,80.
WRF—atmospheric inputs
The environmental condition inputs to the F2010 model were supplied by a regional-decadal scale WRF simulation. For this study, we used an updated version of the Freitas model described and evaluated by Mallia et al.57, which can ingest WRF input files directly. The WRF simulations generated for this study used a nested domain setup where a 4 km resolution domain covered most of the Western US and was nested within a 12 km resolution domain covering western North America (Fig. S3). WRF simulations were reinitialized weekly using initial and boundary conditions from the Climate Forecast System Reanalysis83. The physical parameterizations used in these WRF simulations can be found in SI Sect. S3 and were based on configurations recommended by Mallia et al.87. Simulated plume top heights were not sensitive to the resolution of WRF domains as seen in the sensitivity analysis carried out in SI Sect. S3.
To evaluate the performance of these WRF simulations for surface winds, temperature, and humidity, we used METSTAT, a software package designed to evaluate meteorological inputs to air quality models88. Using METSTAT, WRF gridded variables were interpolated to the locations of surface meteorological observations from 1258 sites in the TDL U.S. and Canada Surface Hourly Observations dataset81 to assess the performance of our WRF model simulations. We calculate the bias and root mean square error (RMSE) for surface wind speed, wind direction, temperature, and humidity (Table 2). When compared to benchmark values89, the WRF meteorology generated here outperforms the suggested benchmarks for surface wind speed bias, wind speed RMSE, wind direction bias, temperature bias, and humidity bias. Emery et al.89 do not present RMSE benchmarks for surface wind direction, temperature, or humidity. The bias and RMSE of surface WRF variables compare favorably to those presented in related work by Mallia et al.87, though given overlap with the WRF setup used by Mallia et al.87, this likely owes to greater averaging of model errors over space and time.
Table 2.
Bias and root mean square error (RMSE) values associated with evaluation of the generated WRF meteorology (domain1) against surface observations and observations aloft.
| Variable | Bias | RMSE |
|---|---|---|
| Surface temperature (K) | 0.098 | 0.732 |
| Potential temperature aloft (K) | −0.011 | 2.33 |
| Surface wind speed (m/s) | −0.314 | 0.372 |
| Wind speed aloft (m/s) | −1.510 | 4.442 |
| Surface wind direction (deg.) | 2.666 | 4.453 |
| Wind direction aloft (deg.) | −5.098 | 65.206 |
| Specific humidity (g/kg) | −0.235 | 0.511 |
The upper-air evaluation of WRF wind speed, wind direction, and potential temperature was carried out using data from rawinsonde launches at 24 sites throughout the Western US and Canada82. For each balloon launch, the vertical profiles of U, V, and potential temperature were extracted from the corresponding 12 km WRF grid cell at the time of the balloon launch. Horizontal winds simulated by WRF were then converted to wind speeds and wind directions, while vertical profiles of rawinsonde data were interpolated by pressure to match WRF vertical levels. To focus the evaluation on simulated upper air values and to avoid the effects of greater turbulence within the PBL, evaluation was limited to vertical levels situated above the simulated PBL height. Furthermore, our evaluation was only performed for rawinsonde observations at which the balloon had been advected less than 4 km from the original launch site. This 4 km limit was selected to balance between the need for ample observations to evaluate WRF output and the fact that the quality of the evaluation would be degraded when using observations of a balloon advected into adjacent WRF grid cells. The bias and RMSE of wind speed, wind direction, and potential temperature were calculated (Table 2).
Wildfire inputs
Gridded QFED PM2.5 emissions (0.1° resolution)61 are provided at daily resolution for four biome types (extratropical forests, grasslands, savannahs, and tropical forests) and were converted to a heat flux dataset using PM2.5 emissions factors (PM2.5 emitted/kg dry matter burned)90 and assuming that the heat release per unit dry matter burned is 18.6 MJ/kg57,91. This conversion is depicted in Eq. (1), where is the gridded heat flux, and and are the gridded PM2.5 flux and emission factor associated with biome type , respectively.
| 1 |
Heat flux datasets were then overlaid with daily burned area polygons from Moderate Resolution Imaging Spectroradiometer (MODIS) collection 6 to identify probable linkages between wildfire heat flux and satellite observed burned area. Since QFED emissions are based on MODIS observed thermal hotspots (MOD14A1/MYD14A1 product), the literature suggests an expectation of collocated burned area and wildfire heat fluxes within a ± 8 day window (algorithm nominal uncertainty92), with the majority of collocations occurring within ± 1 day86,93. Given this temporal window, we linked wildfire heat fluxes to burned area polygons using three complementary approaches that account for the temporal uncertainty in wildfire burned area observations and the idea of a directional fire spread. Specifics regarding this process are provided in SI Sect. S4, with the relevant methods depicted within a detailed visual (Fig. S5).
After developing relationships between gridded heat fluxes and burned area, we assumed that each cluster of continuous burned area polygons would produce its own plume. Within a given QFED grid cell, daily heat fluxes were then attributed to each intersecting cluster of burned area polygons based on the fraction of the total burned area within the QFED grid cell comprised by the burned area cluster. Burned area clusters intersecting multiple grid cells with non-zero heat fluxes were linked to heat fluxes from each grid cell based on the area of overlap within that grid cell. Ultimately, the heat flux value attributed to each burned area cluster was divided by the area of that cluster to estimate the heat flux density.
In total, 78% of the MODIS burned area was paired with a gridded heat flux, with this value increasing to 89% when considering only burned area polygons that intersect a grid cell with non-zero heat flux within the ± 8 day window. Similarly, 91% of QFED derived heat fluxes were linked to burned area polygons. Possible explanations for the imperfect collocation of heat fluxes and MODIS burned area polygons could stem from clouds obscuring satellite observation and differences between the spatial resolution of the MCD64A1 burned area product and the MOD14A1 thermal hotspot product used by QFED. Generally, years characterized by greater wildfire activity present greater collocation of heat fluxes and burned area (Table S2). We hypothesize that this relationship is the result of resolution limitations to observation, such that more intense wildfire activity is more readily observed by both the MCD64A1 and MOD14A1 products, increasing the odds of collocated observations.
Temporal downscaling from daily to 3-h emissions and burned area was performed using diurnal cycles of wildfire activity based on gridded (0.25° resolution) and monthly aggregated satellite active fire detections provided by the Global Fire Emissions Database (GFED)54,80. For each set of plume inputs, the centroid of the associated burned area cluster was referenced to the GFED grid, and the relevant diurnal cycle was applied to both the heat flux and active burn area (such that the heat flux density remained unchanged). The resultant values were assumed to apply to each hour within the 3-h window, meaning additional plume top/thermodynamic variability within any 3-h downscaling window would strictly be a result of varied meteorological conditions.
Entrainment–mass conservation
To estimate the vertical distribution of smoke detrainment below plume top, thermodynamic F2010 outputs for each plume were subject to vertical level-by-level mass conservation calculations following Eq. (2), where is the mass of in plume air detrained from vertical level , is the mass of environmental air entrained into the plume at vertical level , and the remaining terms characterize the vertical flux of mass into the layer from the layer below and the vertical flux of mass out of the layer to the layer above, respectively (left-to-right). The vertical mass flux between any two layers was taken to be a product of their mean density (), mean vertical velocity (), and mean plume horizontal area (), ideally characterizing the interface between layers. At the plume top, it was assumed that the vertical flux to the above layer is zero, such that any remaining vertical mass transport is redirected as detrainment within the uppermost layer.
| 2 |
To express level-by-level detrainment values in terms of a vertical distribution of wildfire emitted aerosol, vertical profiles of detrainment were linearly interpolated from 100 m vertical resolution to 10 m vertical resolution, and then normalized. For interpolation, it is assumed that the detrainment at the surface and plume top boundaries is equal to 0. Resultant profiles effectively describe the fraction of total plume aerosol emissions that are injected at each 10 m vertical level.
PBL estimates from STILT
STILT calculates the PBL height using a modified Richardson number method that is applicable under stable, neutral, and unstable conditions62,94. Here, STILT is used to estimate the PBL height relevant to each modeled plume rise by initializing a model receptor on the centroid of the active burn area at the time of the plume rise. PBL heights are then extracted from the STILT output and linked with the plume climatology, allowing identification of penetrative plumes and quantification of the aerosol mass injected above the PBL. Meteorological inputs to STILT are sourced from the nested WRF simulations described above.
Trend analyses
Trend analyses aimed at understanding the evolution of plume top heights and the vertical distribution of wildfire generated aerosol mass, were performed for US level 3 ecoregions66 and Canadian ecoprovinces67. For each ecoregion/ecoprovince West of − 100° E, the annual maximum plume top height, the PM2.5 flux-weighted average plume top height, the PM2.5 mass injected relative to threshold altitudes (> 18 km, > PBL, < PBL), and the total emissions were subjected to linear regression. Statistical significance was addressed via 100,000 bootstrapped repetitions. Each linear regression was reapplied to 100,000 resampled versions of the annually aggregated values, allowing replacement of selected samples, to determine if the regression to the actual data was distinguishable from the scatter produced by resampling.
Hinge fitting, or change point analysis, was also used to elucidate potential emergent trend accelerations over recent years. Using the statistical analysis software R95, the “chngpt” package96 was used to fit 2-segmented linear trends to PM2.5 flux-weighted average plume top height, PM2.5 mass injection relative to the PBL, and PM2.5 emissions timeseries. Significant hinge-points were selected using a bootstrapping procedure that identifies the optimal hinge, with an associated p-value based on the quality of model fit. Hinge fitting has previously been used to compute climate normals amidst a changing climate97.
Comparison to MISR plume top heights
MISR derived plume top heights were used to evaluate the performance of the F2010 model by comparing the distribution of modeled and observed plume top heights. Additionally, a plume-by-plume analysis was performed, which considers the deviation between modelled and observed plume tops in the context of instrument uncertainty. From the archived plumes maintained as part of the MISR Plume Heights Project 2, we found 480 plumes with a quality flag of “good” or “fair” within western North America (Fig. 5b). These observed plumes characterize the years 2008–2011 and 2017–2018. Using bin widths of 250 m, we developed a histogram comparing these 480 observed plumes to the model-derived late morning plumes (corresponding to MISR overpass times) spanning the same years (251,262 plumes; Fig. 3a). Distribution level comparisons between F2010 model output and MISR observations have previously identified a strong sensitivity to model inputs and a tendency for the model to underestimate the range of observed plume top heights45.
On a plume-by-plume scale, we found 425 MISR observed plumes within 30-min and 4 km of a model-derived plume. A cutoff distance of 4 km was used to compromise between the importance of local meteorology to plume top heights and the uncertainty in plume location as a result of using burned area centroids to denote plume locations. In cases when hourly resolution model outputs result in a plume top estimate both before and after the MISR overpass time, modeled plume top heights are temporally interpolated to the timing of the MISR overpass. Analysis of matched sets of plumes focusses on the standard deviation of modeled plume top heights from their observed counterparts and the fraction of modeled plumes falling within the MISR observational uncertainty.
Supplementary Information
Acknowledgements
The authors are grateful to the University of Utah’s Center for High Performance Computing for computational resources. We are thankful to the NASA Global Modeling and Assimilation Office and NASA Jet Propulsion Laboratory for QFED emissions estimates and MISR observed plume top heights, respectively. In addition, we are thankful to the Climate Data Guide of the National Center for Atmospheric Research, as well as NASA, the Gordon and Betty Moore Foundation, and The Netherlands Organisation for Scientific Research for access to Climate Forecast System Reanalysis data and for funding GFED, respectively. We appreciate the financial support of the iNterdisciplinary EXchange for Utah Science.
Author contributions
D.V.M. and T.Y.W. designed the study with input from J.C.L. T.Y.W. carried out the data analyses and generated the figures, with input from J.C.L., A.G.H., and D.V.M. T.Y.W. wrote the manuscript, with edits provided by J.C.L., A.G.H., and D.V.M.
Data availability
The model-derived wildfire plume data generated and analyzed during the current study are available from the corresponding author on reasonable request. MISR observed wildfire plume top data are available at the following web address: https://misr.jpl.nasa.gov/getData/accessData/MisrMinxPlumes2/. QFED wildfire emissions estimates, GFED wildfire temporal downscaling datasets, and MCD64A1 wildfire burned area polygons are available from at https://portal.nccs.nasa.gov/datashare/iesa/aerosol/emissions/QFED/v2.5r1/0.1/QFED/, https://globalfiredata.org/pages/data/, and University of Maryland via ftp, respectively.
Competing interests
The authors declare no competing interests.
Footnotes
Publisher's note
Springer Nature remains neutral with regard to jurisdictional claims in published maps and institutional affiliations.
Supplementary Information
The online version contains supplementary material available at 10.1038/s41598-022-16607-3.
References
- 1.Kaulfus AS, Nair U, Jaffe D, Christopher SA, Goodrick S. biomass burning smoke climatology of the United States: Implications for particulate matter air quality. Environ. Sci. Technol. 2017;51:11731–11741. doi: 10.1021/acs.est.7b03292. [DOI] [PubMed] [Google Scholar]
- 2.Xing Y-F, Xu Y-H, Shi M-H, Lain Y-X. The impact of PM2.5 on the human respiratory system. J. Thoracic Dis. 2016;8:E69–E74. doi: 10.3978/j.issn.2072-1439.2016.01.19. [DOI] [PMC free article] [PubMed] [Google Scholar]
- 3.Schwartz J, Dockery DW, Neas LM. Is daily mortality associated specifically with fine particles? J. Air Waste Manage. Assoc. 1996;46:927–939. doi: 10.1080/10473289.1996.10467528. [DOI] [PubMed] [Google Scholar]
- 4.Black C, Tesfaigzi Y, Bassein JA, Miller LA. Wildfire smoke exposure and human health: Significant gaps in research for a growing public health issue. Environ. Toxicol. Pharmacol. 2017;55:186–195. doi: 10.1016/j.etap.2017.08.022. [DOI] [PMC free article] [PubMed] [Google Scholar]
- 5.Liu JC, et al. Wildfire-specific fine particulate matter and risk of hospital admissions in urban and rural counties. Epidemiology. 2017;28:77–85. doi: 10.1097/EDE.0000000000000556. [DOI] [PMC free article] [PubMed] [Google Scholar]
- 6.Haikerwal A, Akram M, Sim MR, Meyer M, Abramson MJ, Dennekamp M. Fine particulate matter (PM2.5) exposure during a prolonged wildfire period and emergency department visits for asthma. Respirology. 2016;21:88–94. doi: 10.1111/resp.12613. [DOI] [PubMed] [Google Scholar]
- 7.Delfino RJ, et al. The relationship of respiratory and cardiovascular hospital admissions to the California wildfires of 2003. Occup. Environ. Med. 2009;66:189–197. doi: 10.1136/oem.2008.041376. [DOI] [PMC free article] [PubMed] [Google Scholar]
- 8.Aguilera R, Corringham T, Gershunov A, Benmarhnia T. Wildfire smoke impacts respiratory health more than fine particles from other sources: Observational evidence from Southern California. Nat. Commun. 2021;12:1493. doi: 10.1038/s41467-021-21708-0. [DOI] [PMC free article] [PubMed] [Google Scholar]
- 9.Ditas J, et al. Strong impact of wildfires on the abundance and aging of black carbon in the lowermost stratosphere. Proc. Natl. Acad. Sci. U.S.A. 2018;115:E11595–E11603. doi: 10.1073/pnas.1806868115. [DOI] [PMC free article] [PubMed] [Google Scholar]
- 10.Jiang Y, Lu Z, Liu X, Qian Y, Zhang K, Wang Y, Yang X-Q. Impacts of global open-fire aerosols on direct radiative, cloud and surface-albedo effects simulated with CAM5. Atmos. Chem. Phys. 2016;16:14805–14824. doi: 10.5194/acp-16-14805-2016. [DOI] [Google Scholar]
- 11.Brown H, et al. Biomass burning aerosols in most climate models are too absorbing. Nat. Commun. 2021;12:277. doi: 10.1038/s41467-020-20482-9. [DOI] [PMC free article] [PubMed] [Google Scholar]
- 12.Twohy TH, et al. Biomass burning smoke and its influence on clouds over the western US. Geophys. Res. Lett. 2021;48:e2021094224. doi: 10.1029/2021GL094224. [DOI] [Google Scholar]
- 13.Grell G, Freitas SR, Stuefer M, Fast J. Inclusion of biomass burning in WRF-Chem: Impact of wildfires on weather forecasts. Atmos. Chem. Phys. 2011;11:5289–5303. doi: 10.5194/acp-11-5289-2011. [DOI] [Google Scholar]
- 14.Parks SA, Abatzoglou JT. Warmer and drier fire seasons contribute to increases in area burned at high severity in western US Forests From 1985 to 2017. Geophys. Res. Lett. 2020;47:e2020GL089858. doi: 10.1029/2020GL089858. [DOI] [Google Scholar]
- 15.Westerling AL. Increasing western US forest wildfire activity: Sensitivity to changes in the timing of spring. Philos. Trans. R. Soc. Lond. B Biol. Sci. 2016;371:20150178. doi: 10.1098/rstb.2015.0178. [DOI] [PMC free article] [PubMed] [Google Scholar]
- 16.Dennison PE, Brewer SC, Arnold JD, Moritz MA. Large wildfire trends in the western United States, 1984–2011. Geophys. Res. Lett. 2014;41:2928–2933. doi: 10.1002/2014GL059576. [DOI] [Google Scholar]
- 17.Wilmot TY, Hallar AG, Lin JC, Mallia DV. Expanding number of Western US urban centers face declining summertime air quality due to enhanced wildland fire activity. Environ. Res. Lett. 2021;16:054036. doi: 10.1088/1748-9326/abf966. [DOI] [Google Scholar]
- 18.Alizadeh MR, Abatzoglou JT, Luce CH, Adamowski JF, Farid A, Sadegh M. Warming enabled upslope advance in western US forest fires. Proc. Natl. Acad. Sci. U.S.A. 2021;118:e2009717118. doi: 10.1073/pnas.2009717118. [DOI] [PMC free article] [PubMed] [Google Scholar]
- 19.Abatzoglou JT, Williams AP. Impact of anthropogenic climate change on wildfire across western US forests. Proc. Natl. Acad. Sci. U.S.A. 2016;113:11770–11775. doi: 10.1073/pnas.1607171113. [DOI] [PMC free article] [PubMed] [Google Scholar]
- 20.Williams AP, et al. Observed impacts of anthropogenic climate change on wildfire in California. Earth’s Future. 2019;7:892–910. doi: 10.1029/2019EF001210. [DOI] [Google Scholar]
- 21.Jain P, Castellanos-Acuna D, Coogan SCP, Abatzoglou JT, Flannigan MD. Observed increases in extreme fire weather driven by atmospheric humidity and temperature. Nat. Clim. Change. 2021;12:63. doi: 10.1038/s41558-021-01224-1. [DOI] [Google Scholar]
- 22.Holden ZA, et al. Decreasing fire season precipitation increased recent western US forest wildfire activity. Proc. Natl. Acad. Sci. U.S.A. 2018;115:E8349–E8357. doi: 10.1073/pnas.1802316115. [DOI] [PMC free article] [PubMed] [Google Scholar]
- 23.Kitzberger T, Falk DA, Westerling AL, Swetnam TW. Direct and indirect climate controls predict heterogeneous early-mid 21st century wildfire burned area across western and boreal North America. PLoS ONE. 2017;12:e0188486. doi: 10.1371/journal.pone.0188486. [DOI] [PMC free article] [PubMed] [Google Scholar]
- 24.Mote PW, Li S, Lettenmaier DP, Xiao M, Engel R. Dramatic declines in snowpack in the western US. NPJ Clim. Atmos. Sci. 2018;1:2. doi: 10.1038/s41612-018-0012-1. [DOI] [Google Scholar]
- 25.Spracklen DV, Mickley LJ, Logan JA, Hudman RC, Yevich R, Flannigan MD, Westerling A. Impacts of climate change from 2000 to 2050 on wildfire activity and carbonaceous aerosol concentrations in the western United States. J. Geophys. Res. 2009;114:D20301. doi: 10.1029/2008JD010966. [DOI] [Google Scholar]
- 26.Mell WE, Manzello SL, Maranghides A, Butry D, Rehm RG. The wildland–urban interface fire problem—Current approaches and research needs. Int. J. Wildl. Fire. 2010;19:238–251. doi: 10.1071/WF07131. [DOI] [Google Scholar]
- 27.Hung W-T, et al. The impacts of transported wildfire smoke aerosols on surface air quality in New York State: A case study in summer 2018. Atmos. Environ. 2020;227:117415. doi: 10.1016/j.atmosenv.2020.117415. [DOI] [Google Scholar]
- 28.Val Martin M, Heald CL, Ford B, Prenni AJ, Wiedinmyer C. A decadal satellite analysis of the origins and impacts of smoke in Colorado. Atmos. Chem. Phys. 2013;13:7429–7439. doi: 10.5194/acp-13-7429-2013. [DOI] [Google Scholar]
- 29.Liu D, He C, Schwarz JP, Wang X. Lifecycle of light-absorbing carbonaceous aerosols in the atmosphere. Npj Clim. Atmos. Sci. 2020;3:40. doi: 10.1038/s41612-020-00145-8. [DOI] [Google Scholar]
- 30.Val Martin M, Logan JA, Kahn RA, Leung F-Y, Nelson DL, Diner DJ. Smoke injection heights from fires in North America: Analysis of 5 years of satellite observations. Atmos. Chem. Phys. 2010;10:1491–1510. doi: 10.5194/acp-10-1491-2010. [DOI] [Google Scholar]
- 31.Jaffe DA, O’Neill SM, Larkin NK, Holder AL, Peterson DL, Halofsky JE, Rappold AG. Wildfire and prescribed burning impacts on air quality in the United States. J. Air Waste Manage. Assoc. 2020;70:583–615. doi: 10.1080/10962247.2020.1749731. [DOI] [PMC free article] [PubMed] [Google Scholar]
- 32.Bond TC, et al. Bounding the role of black carbon in the climate system: A scientific assessment. J. Geophys. Res. Atmos. 2013;118:5380–5552. doi: 10.1002/jgrd.50171. [DOI] [Google Scholar]
- 33.Peterson DA, Hyer EJ, Campbell JR, Solbrig JE, Fromm MD. A conceptual model for development of intense Pyrocumulonimbus in western North America. Mon. Weather Rev. 2017;145:2235–2255. doi: 10.1175/MWR-D-16-0232.1. [DOI] [Google Scholar]
- 34.Ban-Weiss GA, Cao L, Bala G, Caldeira K. Dependence of climate forcing and response on the altitude of black carbon aerosols. Clim. Dyn. 2012;38:897–911. doi: 10.1007/s00382-011-1052-y. [DOI] [Google Scholar]
- 35.Fromm M, Torres O, Diner D, Lindsey D, Vant Hull B, Servranckx R, Shettle EP, Li Z. Stratospheric impact of the Chisholm pyrocumulonimbus eruption: 1. Earth-viewing satellite perspective. J. Geophys. Res. Atmos. 2008;113:D08202. [Google Scholar]
- 36.Fromm M, et al. Stratospheric impact of the Chisholm pyrocumulonimbus eruption: 2. Vertical profile perspective. J. Geophys. Res. Atmos. 2008;113:D08203. [Google Scholar]
- 37.Peterson DA, et al. Australia’s Black Summer pyrocumulonimbus super outbreak reveals potential for increasingly extreme stratospheric smoke events. Npj Clim. Atmos. Sci. 2021;4:38. doi: 10.1038/s41612-021-00192-9. [DOI] [Google Scholar]
- 38.Christian K, Wang J, Ge C, Peterson D, Hyer E, Yorks J, McGill M. Radiative forcing and stratospheric warming of pyrocumulonimbus smoke aerosols: First modeling results with multisensor (EPIC, CALIPSO, and CATS) views from space. Geophys. Res. Lett. 2019;46:10061–10071. doi: 10.1029/2019GL082360. [DOI] [Google Scholar]
- 39.Das S, Colarco PR, Oman LD, Taha G, Torres O. The long-term transport and radiative impacts of the 2017 British Columbia pyrocumulonimbus smoke aerosols in the stratosphere. Atmos. Chem. Phys. 2021;21:12069–12090. doi: 10.5194/acp-21-12069-2021. [DOI] [Google Scholar]
- 40.D’Angelo G, Guimond S, Reisner J, Peterson DA, Dubey M. Contrasting stratospheric smoke mass and lifetime from 2017 Canadian and 2019/2020 Australian megafires: Global simulations and satellite observations. J. Geophys. Res. Atmos. 2022;127:e2021JD036249. doi: 10.1029/2021JD036249. [DOI] [Google Scholar]
- 41.Yu P, et al. Black carbon lofts wildfire smoke high into the stratosphere to form a persistent plume. Science. 2019;365:587–590. doi: 10.1126/science.aax1748. [DOI] [PubMed] [Google Scholar]
- 42.Peterson DA, et al. Wildfire-driven thunderstorms cause a volcano-like stratospheric injection of smoke. Npj Clim. Atmos. Sci. 2018;1:30. doi: 10.1038/s41612-018-0039-3. [DOI] [PMC free article] [PubMed] [Google Scholar]
- 43.Khaykin S, et al. The 2019/20 Australian wildfires generated a persistent smoke-charged vortex rising up to 35 km altitude. Commun. Earth Environ. 2020;1:22. doi: 10.1038/s43247-020-00022-5. [DOI] [Google Scholar]
- 44.Paugam R, Wooster M, Freitas S, Val Martin M. A review of approaches to estimate wildfire plume injection height within large-scale atmospheric chemical transport models. Atmos. Chem. Phys. 2016;16:907–925. doi: 10.5194/acp-16-907-2016. [DOI] [Google Scholar]
- 45.Val Martin M, Kahn RA, Logan JA, Paugam R, Wooster M, Ichoku C. Space-based observational constraints for 1-D fire smoke plume-rise models. J. Geophys. Res. 2012;117:D22204. [Google Scholar]
- 46.Clements CB, Lareau NP, Kingsmill DE, Bowers CL, Camacho CP, Bagley R, Davis B. The rapid deployments to wildfires experiment (RaDFIRE): Observations from the fire zone. Bull. Am. Met. Soc. 2018;99:2539–2559. doi: 10.1175/BAMS-D-17-0230.1. [DOI] [Google Scholar]
- 47.Freitas SR, Longo KM, Trentmann J, Latham D. Technical Note: Sensitivity of 1-D smoke plume rise models to the inclusion of environmental wind drag. Atmos. Chem. Phys. 2010;10:585–594. doi: 10.5194/acp-10-585-2010. [DOI] [Google Scholar]
- 48.Briggs GA. “Plume Rise Predictions” in Lectures on Air Pollution and Environmental Impact Analysis. Springer; 1982. pp. 59–111. [Google Scholar]
- 49.O’Dell K, Ford B, Fischer EV, Pierce JR. Contribution of wildland-fire smoke to US PM2.5 and its influence on recent trends. Environ. Sci. Technol. 2019;53:1797–1804. doi: 10.1021/acs.est.8b05430. [DOI] [PubMed] [Google Scholar]
- 50.McClure CD, Jaffe DA. US particulate matter air quality improves except in wildfire-prone areas. Proc. Natl. Acad. Sci. U.S.A. 2018;115:7901–7906. doi: 10.1073/pnas.1804353115. [DOI] [PMC free article] [PubMed] [Google Scholar]
- 51.Val Martin M, Kahn RA, Tosca MG. A global analysis of wildfire smoke injection heights derived from space-based multi-angle imaging. Remote Sens. 2018;10:1609. doi: 10.3390/rs10101609. [DOI] [Google Scholar]
- 52.Kahn RA, Chen Y, Nelson DL, Leung F-Y, Diner DJ, Logan JA. Wildfire smoke injection heights: Two perspectives from space. Geophys. Res. Lett. 2008;35:L04809. doi: 10.1029/2007GL032165. [DOI] [Google Scholar]
- 53.Freitas SR, et al. Including the sub-grid scale plume rise of vegetation fires in low resolution atmospheric transport models. Atmos. Chem. Phys. 2007;7:3385–3398. doi: 10.5194/acp-7-3385-2007. [DOI] [Google Scholar]
- 54.Mu M, et al. Daily and 3-hourly variability in global fire emissions and consequences for atmospheric model predictions of carbon monoxide. J. Geophys. Res. 2011;116:D24303. [Google Scholar]
- 55.Giglio L, Csiszar I, Justice CO. Global distribution and seasonality of active fires as observed with the Terra and aqua moderate resolution imaging spectroradiometer (MODIS) sensors. J. Geophys. Res. Biogeosci. 2006;111:G02016. doi: 10.1029/2005JG000142. [DOI] [Google Scholar]
- 56.Ke Z, Wang Y, Song Y, Liu Y. Global wildfire plume-rise data set and parameterizations for climate model applications. J. Geophys. Res. Atmos. 2021;126:e2020JD033085. doi: 10.1029/2020JD033085. [DOI] [Google Scholar]
- 57.Mallia DV, Kochanski AK, Urbanski SP, Lin JC. Optimizing smoke and plume rise modeling approaches at local scales. Atmosphere. 2018;9:166. doi: 10.3390/atmos9050166. [DOI] [Google Scholar]
- 58.Liu Y, Goodrick SL, Achtemeier GL, Forbus K, Combs D. Smoke plume height measurement of prescribed burns in the south-eastern United States. Int. J. Wildl. Fire. 2012;22:130–147. doi: 10.1071/WF11072. [DOI] [Google Scholar]
- 59.Moisseeva N, Stull R. Wildfire smoke-plume rise: A simple energy balance parameterization. Atmos. Chem. Phys. 2021;21:1407–1425. doi: 10.5194/acp-21-1407-2021. [DOI] [Google Scholar]
- 60.Achtemeier GL, Goodrick SA, Liu Y, Garcia-Menendez F, Hu Y, Odman MT. Modeling smoke plume-rise and dispersion from southern united states prescribed burns with daysmoke. Atmosphere. 2011;2:358–388. doi: 10.3390/atmos2030358. [DOI] [Google Scholar]
- 61.Darmenov, A. & da Silva, A. M. The Quick Fire Emissions Dataset (QFED) Documentation of versions 2.1, 2.2, and 2.4, Vol. 32, 183 (NASA TM-2013-104606, 2013).
- 62.Lin JC, Gerbig C, Wofsy SC, Andrews AE, Daube BC, Davis KJ, Grainger CA. A near-field tool for simulating the upstream influence of atmospheric observations: The stochastic time-inverted Lagrangian transport (STILT) model. J. Geophys. Res. 2003;108:4493. [Google Scholar]
- 63.Fasoli B, Lin JC, Bowling DR, Mitchell L, Mendoza D. Simulating atmospheric tracer concentrations for spatially distributed receptors: Updates to the stochastic time-inverted Lagrangian transport model's R interface (STILT-R version 2) Geosci. Model Dev. 2018;11:2813–2824. doi: 10.5194/gmd-11-2813-2018. [DOI] [Google Scholar]
- 64.Kahn RA, Li W-H, Moroney C, Diner DJ, Martonchik JV, Fishbein E. Aerosol source plume physical characteristics from space-based multiangle imaging. J. Geophys. Res. 2007;112:D11205. doi: 10.1029/2006JD007647. [DOI] [Google Scholar]
- 65.Peterson DA, Fromm MD, Solbrig JE, Hyer EJ, Surratt ML, Campbell JR. detection and inventory of intense pyroconvection in Western North America using GOES-15 daytime infrared data. J. Appl. Meteorol. Climatol. 2017;56:471–493. doi: 10.1175/JAMC-D-16-0226.1. [DOI] [Google Scholar]
- 66.US EPA. Level III and IV Ecoregions of the Continental United States. www.epa.gov/eco-research/level-iii-and-iv-ecoregions-continental-united-states. Accessed 1 Aug 2020
- 67.Government of Canada. Terrestrial Ecoprovinces of Canada. https://open.canada.ca/data/en/dataset/98fa7335-fbfe-4289-9a0e-d6bf3874b424. Accessed 1 Oct 2020.
- 68.Torres O, Bhartia PK, Herman JR, Ahmad Z, Gleason J. Derivation of aerosol properties from satellite measurements of backscattered ultraviolet radiation: Theoretical basis. J. Geophys. Res. Atmos. 1998;103:17099–17110. doi: 10.1029/98JD00900. [DOI] [Google Scholar]
- 69.Brey SJ, Ruminski M, Atwood SA, Fischer EV. Connecting smoke plumes to sources using hazard mapping system (HMS) smoke and fire location data over North America. Atmos. Chem. Phys. 2018;18:1745–1761. doi: 10.5194/acp-18-1745-2018. [DOI] [Google Scholar]
- 70.US Census Bureau. United States Summary: 2010. US Census Bureau. https://www.census.gov/prod/cen2010/cph-2-1.pdf (2012) (Accessed 4 October 2021).
- 71.Higuera PE, Abatzoglou JT. Record-setting climate enabled the extraordinary 2020 fire season in the western United States. Glob. Change Biol. 2020;27:1–2. doi: 10.1111/gcb.15388. [DOI] [PubMed] [Google Scholar]
- 72.Sofiev M, Ermakova T, Vankevich R. Evaluation of the smoke-injection height from wild-land fires using remote-sensing data. Atmos. Chem. Phys. 2012;12:1995–2006. doi: 10.5194/acp-12-1995-2012. [DOI] [Google Scholar]
- 73.Schwartz MW, et al. Increasing elevation of fire in the Sierra Nevada and implications for forest change. Ecosphere. 2015;6:121. doi: 10.1890/ES15-00003.1. [DOI] [Google Scholar]
- 74.Wu Y, et al. Synergistic aircraft and ground observations of transported wildfire smoke and its impact on air quality in New York City during the summer 2018 LISTOS campaign. Sci. Total Environ. 2021;773:145030. doi: 10.1016/j.scitotenv.2021.145030. [DOI] [PubMed] [Google Scholar]
- 75.Achtemeier GL, Goodrick SA, Liu Y. Modeling multiple-core updraft plume rise for an aerial ignition prescribed burn by coupling daysmoke with a cellular automata fire model. Atmosphere. 2012;3:352–376. doi: 10.3390/atmos3030352. [DOI] [Google Scholar]
- 76.Li Z, et al. Aerosol and boundary-layer interactions and impact on air quality. Natl. Sci. Rev. 2017;4:810–833. doi: 10.1093/nsr/nwx117. [DOI] [Google Scholar]
- 77.Loría-Salazar SM, et al. Evaluation of novel NASA MODerate Resolution Imaging Spectroradiometer and Visible Infrared Imaging Radiometer Suite aerosol products and assessment of smoke height boundary layer ratio during extreme smoke events in the western USA. J. Geophys. Res. Atmos. 2021;126:e2020JD034180. doi: 10.1029/2020JD034180. [DOI] [Google Scholar]
- 78.Kochanski AK, Mallia DV, Fearon MG, Mandel J, Souri AH, Brown T. Modeling wildfire smoke feedback mechanisms using a coupled fire-atmosphere model with a radiatively active aerosol scheme. J. Geophys. Res. Atmos. 2019;124:9099–9116. doi: 10.1029/2019JD030558. [DOI] [Google Scholar]
- 79.Wooster MJ, Roberts G, Perry GLW, Kaufman YJ. Retrieval of biomass combustion rates and totals from fire radiative power observations: FRP derivation and calibration relationships between biomass consumption and fire radiative energy release. J. Goephys. Res. Atmos. 2005;110:D24311. doi: 10.1029/2005JD006318. [DOI] [Google Scholar]
- 80.van der Werf GR, et al. Global fire emissions estimates during 1997–2016. Earth Syst. Sci. Data. 2017;9:697–720. doi: 10.5194/essd-9-697-2017. [DOI] [Google Scholar]
- 81.Meteorological Development Laboratory/Office of Science and Technology/National Weather Service/NOAA/U.S. Department of Commerce. Updated half-yearly. TDL U.S. and Canada Surface Hourly Observations. (Research Data Archive at the National Center for Atmospheric Research, Computational and Information Systems Laboratory, 1987).
- 82.Iowa Environmental Mesonet. Rawinsonde (RAOB) Data Archive, Iowa State University [Data Files]. https://mesonet.agron.iastate.edu/archive/raob/ (2021).
- 83.Saha S, et al. The NCEP climate forecast system version 2. J. Clim. 2014;27:2185–2208. doi: 10.1175/JCLI-D-12-00823.1. [DOI] [Google Scholar]
- 84.Mandel J, Beezley JD, Kochanski AK. Coupled atmosphere-wildland fire modeling with WRF 3.3 and SFIRE 2011. Geosci. Model Dev. 2011;4:591–610. doi: 10.5194/gmd-4-591-2011. [DOI] [Google Scholar]
- 85.Skamarock, W. C. et al. A description of the advanced research WRF version 3. NCAR Technical Note. NCAR TN-475, 125 (2008).
- 86.Giglio L, Boschetti L, Roy DP, Humber ML, Justice CO. The Collection 6 MODIS burned area mapping algorithm and product. Remote Sens. Environ. 2018;217:72–85. doi: 10.1016/j.rse.2018.08.005. [DOI] [PMC free article] [PubMed] [Google Scholar]
- 87.Mallia DV, Lin JC, Urbanski S, Ehleringer J, Nehrkorn T. Impacts of upwind wildfire emissions on CO, CO2, and PM2.5 concentrations in Salt Lake City, Utah. J. Geophys. Res. Atmos. 2015;120:147–166. doi: 10.1002/2014JD022472. [DOI] [Google Scholar]
- 88.Ramboll . METSTAT Meteorological Model Statistical Evaluation Package. Ramboll; 2013. [Google Scholar]
- 89.Emery, C. A., Tai, E. & Yarwood, G. Enhanced Meteorological Modeling and Performance Evaluation for Two Texas Ozone Episodes. Prepared for the Texas Natural Resource Conservation Commission, by ENVIRON International Corporation, Novato, CA (2001).
- 90.Andreae MO, Merlet P. Emission of trace gases and aerosols from biomass burning. Glob. Biogeochem. Cycles. 2001;15:955–966. doi: 10.1029/2000GB001382. [DOI] [Google Scholar]
- 91.Susott RA, De Groot WF, Shafizadeh F. Heat content of natural fuels. J. Fire Flammabl. 1975;6:311–325. [Google Scholar]
- 92.Roy DP, Jin Y, Lewis PE, Justice CO. Prototyping a global algorithm for systematic fire-affected area mapping using MODIS time series data. Remote Sens. Environ. 2005;97:137–162. doi: 10.1016/j.rse.2005.04.007. [DOI] [Google Scholar]
- 93.Boschetti L, Roy DP, Justice CO, Giglio L. Global assessment of the temporal reporting accuracy and precision of the MODIS burned area product. Int. J. Wildl. Fire. 2010;19:705–709. doi: 10.1071/WF09138. [DOI] [Google Scholar]
- 94.Vogelezang DHP, Holtslag AAM. Evaluation and model impacts of alternative boundary-layer height formulations. Bound.-Layer Meteorol. 1996;81:245–269. doi: 10.1007/BF02430331. [DOI] [Google Scholar]
- 95.R Core Team. R: A Language and Environment for Statistical Computing. (R Foundation for Statistical Computing. https://www.R-project.org/ (2021). Accessed 1 Sep 2021.
- 96.Fong Y, Huang Y, Gilbert PB, Permar SR. chngpt: Threshold regression model estimation and inference. BMC Bioinform. 2017;18:454. doi: 10.1186/s12859-017-1863-x. [DOI] [PMC free article] [PubMed] [Google Scholar]
- 97.Livezey RE, Vinnikov KY, Timofeyeva MM, Tinker R, van den Dool HM. Estimation and extrapolation of climate normals and climatic trends. J. Appl. Meteorol. Climatol. 2007;46:1759–1776. doi: 10.1175/2007JAMC1666.1. [DOI] [Google Scholar]
Associated Data
This section collects any data citations, data availability statements, or supplementary materials included in this article.
Supplementary Materials
Data Availability Statement
The model-derived wildfire plume data generated and analyzed during the current study are available from the corresponding author on reasonable request. MISR observed wildfire plume top data are available at the following web address: https://misr.jpl.nasa.gov/getData/accessData/MisrMinxPlumes2/. QFED wildfire emissions estimates, GFED wildfire temporal downscaling datasets, and MCD64A1 wildfire burned area polygons are available from at https://portal.nccs.nasa.gov/datashare/iesa/aerosol/emissions/QFED/v2.5r1/0.1/QFED/, https://globalfiredata.org/pages/data/, and University of Maryland via ftp, respectively.