Abstract
A novel Zn (II) organic framework comprising 2-phenyl benzimidazole (ZPBIF-1) was synthesized by using a solvothermal method. The characterization of the synthesized MOF was performed utilizing XRD, SEM, FT-IR, 1H-NMR, 13C-NMR, MS, XPS, TG/DTA, and N2 sorption analysis. ZPBIF-1 was successfully utilized to remove Acid red 88, Basic Violet 14, Basic Blue 54, and Congo red dyes in aqueous solutions. In this study, some parameters, including adsorbent dosage, initial dye concentration, contact time, temperature, and pH, were examined. To evaluate the experimental data, Freundlich, Langmuir, Temkin, and Dubinin-Radushkevich isotherm models were used. In this case, Langmuir is the most suitable model. Several kinetic models, including First-order, pseudo-first-order, second-order, and Pseudo-second-order kinetic models, Elovich's, and Weber's intraparticle diffusion models, were utilized to comprehend the detailed adsorption process. According to the pseudo-second-order kinetic model, dye sorption kinetics is best described. In addition, thermodynamic parameters like enthalpy (ΔH°), Gibbs free energy (ΔG°), and entropy (ΔS°) were also achieved and analyzed. The experimental studies thus suggest that Zn (II) metal–organic framework based on 2-phenyl benzimidazole could be a promising candidate for eliminating dyes from aqueous solution. Hence, the experimental studies suggest that a Zn (II) metal–organic framework based on 2-phenylbenzimidazole could be a promising candidate for eliminating dyes from aqueous solution. The maximum adsorption capacity of ZPBIF-1 was 1666.66, 1250, 1000, and 1250 mg/g for Acid red 88, Basic violet 14, Basic blue 54, and Congo red dyes, respectively. Furthermore, this method was used to remove contaminant dyes from textile wastewater, and an acceptable result was obtained.
Subject terms: Environmental sciences, Chemistry, Materials science, Nanoscience and technology
Introduction
Colored chemicals are symbolized by dyes in several industries, such as leather, textiles, paper, and plastic. Due to dye consumption and production, as well as difficulty removing dyes during coagulation procedures, colored wastewater is produced directly. In general, most dyes are synthetic and contain aromatic rings1, making them carcinogenic and mutagenic, not biodegradable, and inert if discharged into waste streams. Potentially, they can have acute or chronic effects on organisms exposed to them. Sunlight is also absorbed or reflected by water-soluble dyes inhibiting the bacteria growth. Furthermore, they are visible and lead to esthetic pollution even at low concentrations2. Thus it is significantly essential to remove the color from aquatic systems3,4.
Many methods for removing dyes from wastewater have been developed, including adsorption, chemical precipitation, oxidation, and photocatalytic degradation5–10. Among them, the adsorption technique is simple to apply and offers considerable advantages in this regard. Adsorption is a method for removing a wide range of compounds from industrial wastewater. In most cases, adsorption is employed for removing low levels of non-degradable organic compounds from groundwater, drinking water preparation, processing water, or as a tertiary cleanse after biological water treatment. During adsorption, molecules in a liquid bond with those on a solid surface, and since adsorbents have a large surface area, they are suitable for adsorption11. In fact, it can be used with almost any dye or dye combination without requiring any pretreatment or equipment. Furthermore, adsorption procedures are economical since they can be performed under favorable conditions, decreasing the actual cost of the adsorbent, which can be chosen accordingly12,13. Surface area, short adsorption times, high adsorption capacity, and an environmentally friendly and economically efficient production process is the primary properties of a suitable adsorbent14,15.
Recently, as a new class of porous crystalline materials, metal–organic frameworks (MOFs) have been used for a variety of applications such as chemical separation (such as carbon capture as a global challenge), gas (green gases, hydrogen, and methane) storage, catalysis, sensors, drug delivery and storage, membranes, and the removal of hazardous wastes (like heavy metals, dyes, nitrogen, and sulfur-comprising compounds)16–25. MOFs with the porous structures are one of the most promising groups of novel materials for adsorbing hazardous compounds from the liquid phases, such as sulfur and nitrogen compounds from non-aqueous and aqueous media26,27.
As part of our continuing efforts toward the development of green chemistry and the removal of organic pollutants28,29, a novel Zn (II) organic framework based on 2-phenyl benzimidazole (ZPBIF-1) was synthesized and characterized via Fourier transform infrared (FT-IR), scanning electron microscope (SEM), X-ray diffraction (XRD), nuclear magnetic resonated (1H-NMR, 13C-NMR), mass spectrometry (MS), X-ray photoelectron spectroscopy (XPS), and thermogravimetric differential thermal analyses (TG/DTA).
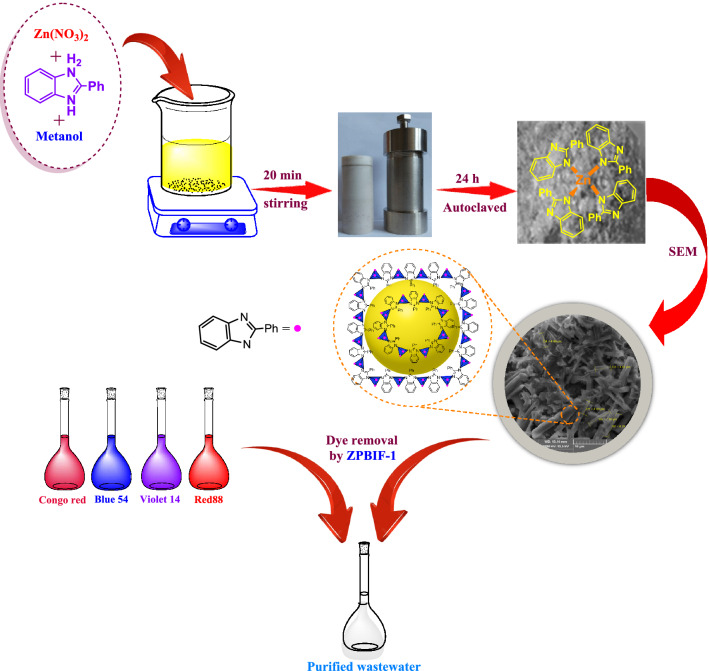
The objective of this work was to assess the applicability of novel MOF (ZPBIF-1) for the removal of four different categories of dyes from aqueous solution with a variety of experimental conditions (initial dye concentration temperature, contact time, pH, and adsorbent dose). Extensive studies of isotherms, kinetics, thermodynamics, and equilibrium were carried out to determine this adsorbent's performance on acid red 88, basic Violet 14, basic Blue 54, and Congo red dyes (The structures of dyes are provided in Supplementary file 5). Lastly, the adsorption mechanism of these dyes on the ZPBIF-1 surface was adequately discussed. The high efficiency and simplicity of the ZPBIF-1 preparation method, its effectiveness, reusability, and high adsorption capacity, make its industrial use very promising (Fig. 1).
Figure 1.
Preparation of ZPBIF-1 metal organic-framework.
Materials and methods
Materials
Zinc nitrate hexahydrate (Zn(NO3)2·6H2O 98%), methanol, 2-phenyl benzimidazole, sodium hydroxide, hydrochloric acid, and chloroform were purchased from Merck Company. All chemicals were commercially available in analytical grade and were utilized without further purification. All selected dyes including Acid red 88 (C. I. No: 1658-56-6), Basic Violet 14 (C. I. No: 632-99-5). Basic Blue 54 (C. I. No: 15000-59-6) and Congo red (CR) (C. I. No: 573-58-0) were obtained from Nordex international, D.Z.E Dye Company in the UK. The natural textile wastewater, including orange and red Bemacron SER-DL, was collected from the Farizad Textile Dying Factory in Varamin, Iran.
Apparatus
The FT–IR spectra were recorded on the Tensor 27 Burker spectrophotometer in 500–4000/cm. 1H NMR and 13C NMR spectra recorded on a on Bruker 250 MHz spectrometer with DMSO-d6 as a solvent. The crystalline nature of ZPBIF-1 was analyzed by X-ray diffraction at room temperature with Co Kα radiation (model X’Pert PRO MPD, Panalytical, Made in the Netherland). The X-ray photoelectron spectroscopy (XPS) was conducted on the Bes Tec (USA) using Mg radiation. A Netzsch Thermoanalyze (Mettler Toledo, Swiss) was used for thermogravimetric analysis (TGA) with a heating rate of 50 ml/min in air. A combination of electrospray ionization mass spectrometry (ESI–MS) (5975C, Agilent Technologies, USA) was applied. The morphologies and elemental analysis were assessed by a scanning electron microscope SEM (Mira III, TeScan, Czech Republic) supplied with energy dispersive X-ray analysis (EDXA). The concentration level of remaining COD and BOD in wastewater sample was determined by the Standard Methods, using a USA-HACH spectrophotometer and Lutron DO meter. The UV–Vis spectrophotometer (Cary 60, Agilent Technologies USA) was utilized to determine the concentrations of the organic dyes at wavelengths of 497, 583, 497, and 559 nm, respectively. The specific surface area of samples was determined with Brunauer–Emmett–Teller (BET) method using the adsorption–desorption isotherms at 77 K (BEL, Belsorp mini II, Made in Japan).
Preparation of ZPBIF-1
Typically, A mixture of zinc nitrate hexahydrate (Zn(NO3)2·6H2O) (3.02 mmol, 0.9 g) and 2-phenyl benzimidazole (1.54 mmol, 0.3 g) was dissolved in methanol (35 mL), then autoclaved. Teflon-lined stainless steel (autoclave) was heated for 24 h at 90 °C in a programmable oven and cooled at room temperature at 0.4 °C/min. After the addition of chloroform to yellow liquid, the colorless polyhedral crystals of ZPBIF-1 were formed that were washed with methanol, then dried under vacuum for 6 h at 50 °C to give the desired product in 95% yield.
Adsorption experiments
The optimal conditions and influencing parameters for dye removal by ZPBIF-1 were investigated in the adsorption procedure. The Optimum adsorbent quantity was determined by combining different amounts of ZPBIF-1 (0.001–0.01 g) with dye solution (10 mL) for 20 min at 25 °C, with an initial dye concentration of 20 mg/L, and pH = 2–8 under continuous stirring at 400 rpm. A pH adjustment was achieved by adding sodium hydroxide (0.1 N) or hydrochloric acid (0.1 N) to the dye solution before combining it with the adsorbent. The effects of initial dye concentration (10–800 mg/L) were investigated using 0.008 g adsorbent at pH = 2 and 25–65 °C for 20 min. UV–Vis spectrophotometers were used to measure dye solution concentrations and adsorption. The dye solution concentration followed by adsorption was analyzed employing a UV–Vis spectrophotometer. Afterward, the amounts of dye adsorbed at different times (qt, mg/g) and dyes' removal efficiency were determined as follows:
| 1 |
| 2 |
which, Ce, C0, and Ct (mg/L) were the equilibrium concentration, initial concentration, and concentration at different times, respectively. V was the volume of dye solution, and m (g) was the mass of ZPBIF-1. As part of the kinetic studies and optimization of adsorption capacity, the adsorbent dosage (0.01, 0.02, 0.06, 0.08, and 1 g/L) and dyes concentration (10–800 mg/L) were selected. The same procedure was repeated at 308, 318, and 338 K to assess the effects of temperature on dye adsorption.
Recyclability and stability study
The Efficiency of ZPBIF-1 as a selective dye adsorbent from waste water can be leveraged by its superior recyclability. Recycling was performed on ZPBIF-1 using optimized conditions such as dose of 0.08 g/L, dye concentration of 20 mg/L, pH 2, contact time of 20 min, and agitation rate of 400 rpm. The major recycling procedure can be described as follows: to organic dye-loaded ZPBIF-1 (0.008 g) from the first adsorption experiment, NaOH 0.1 M (10 mL) and ethanol %50 (10 mL) were added and mixed for 20 min. Following filtration and washing with H2O/EtOH, samples were dried and reactivated at 50 °C under vacuum for 60 min and used for reusability studies. UV–Vis spectroscopy was used to check for residual dye traces.
Results and discussion
Characterization of ZPBIF-1
A new zinc metal–organic framework, Tetrakis (2-phenylbenzoimidazol-1-yl) zinc (ZPBIF-1), was synthesized by autoclaving 2-phenyl benzimidazole and Zn (NO3)2 in methanol. The structure of ZPBIF-1 was characterized by FT-IR, 1H-NMR, 13C-NMR, and mass spectral data. The FT-IR spectrum of ZPBIF-1 exhibited the characteristic peaks of Zn moieties at 600/cm and aromatic moieties at 620–826/cm. Also, the stretch absorptions of C=C aromatic appeared in pairs at 1633/cm and 1468/cm. The adsorption band in the regions 1458, 1669, and 759, 1227, 1388 can be assigned to the C–N, C=C stretching and bending vibration, respectively.
Due to the symmetry of this compound, 1H-NMR and 13C-NMR only revealed peaks for one of the four ligands. Therefore, the 1H NMR spectrum of ZPBIF in DMSO showed two doublet-doublet signals (AX system) in δ = 7.51 and 7.80 ppm for CHs-aromatic of benzimidazole ring along with characteristic signals for phenyl group at 2-position of imidazole moiety. The proton-decoupled 13C-NMR spectrum of ZPBIF-1 in DMSO showed 8 distinct signals related to 28 CH and 24 C in agreement with the proposed structure. It showed one distinct resonance for the N–C=N group. Partial assignments of aromatic and imidazole resonances were given in the experimental report.
C52H36N8Zn (838.30), Colorless crystals, yield: 94.76%. IR (KBr) (νmax/cm): 3107, 3062, 1633, 1481, 1388, 1227, 759, 697/cm. 1H NMR (DMSO): δ = 7.51 (8 H, dd, 3J = 6.0, 4J = 3.1, 8 CH), 7.70–7.73 (12 H, m, 12 CHo,p-Ph), 7.80 (8 H, dd, 3J = 6.0, 4 J = 3.1, 8 CH), 8.17–8.20 (8 H, m, 8 CHm-Ph) ppm. 13C NMR (DMSO): δ 114.3 (8 C), 124.7 (4 C), 125.2 (8 CH), 127.6 (8 CHo-Ph), 129.6 (8 CHm-Ph), 132.1 (4 CHp-Ph), 133.5 (8 C), 149.6 (4N–C=N) ppm.
The mass spectra of compound represented molecular ion peak at proper m/z value and the base peak appeared at m/z 194. EI-MS: m/z (%) = 836 (M+, 5), 194 (100), 193 (30), 116 (10), 104 (7), 91 (8), 90 (13), 77 (15). The IR, 1HNMR, 13CNMR, and Mass spectra for Zn (II)-2-phenyl benzimidazole framework (ZPBIF-1) are provided in the Supplementry file 5.
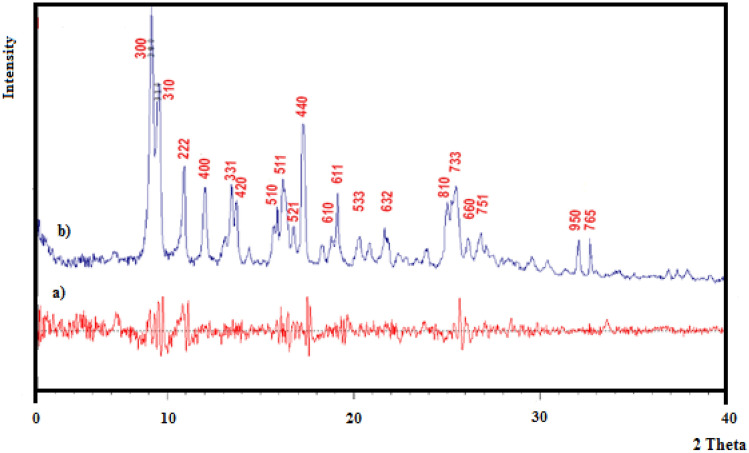
According to the diffraction pattern and comparison with similar composition ZIF-11standard card, it concludes ZPBIF-1 crystals with ideal inner structures had been successfully constructed. The simulated PXRD pattern of ZIF-11 and XRD pattern of Zn(II)-2-phenyl benzimidazole were shown in Fig. 2a,b, respectively. In the Fig. 2b pattern, the crystalline nature of the MOF structure crystallized at cubic crystal system was obtained at 2θ = 9.14, 9.51, 10.86, 11.99, 13.43, 13.69, 15.88, 16.24, 16.76, 17.27, 18.80, 19.10, 20.24, 21.62, 24.99, 25.41, 26.11, 26.75, 32.01, 32.64º at (003), (013), (222), (004), (133), (024), (015), (115), (125), (044), (016), (116), (335), (236), (018), (337), (066), (157), (059), and (567) miller indices, respectively30,31.
Figure 2.
(a) The simulated PXRD pattern of ZIF-11, (b) XRD pattern of Zn (II)-2-phenyl benzimidazole framework (ZPBIF-1). The raw data for this figure is provided in the Supplementary file 1.
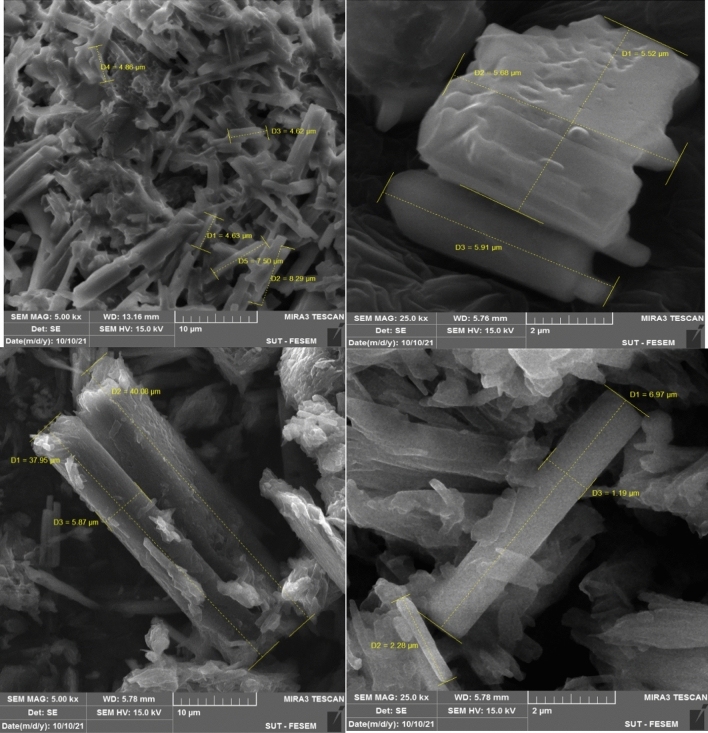
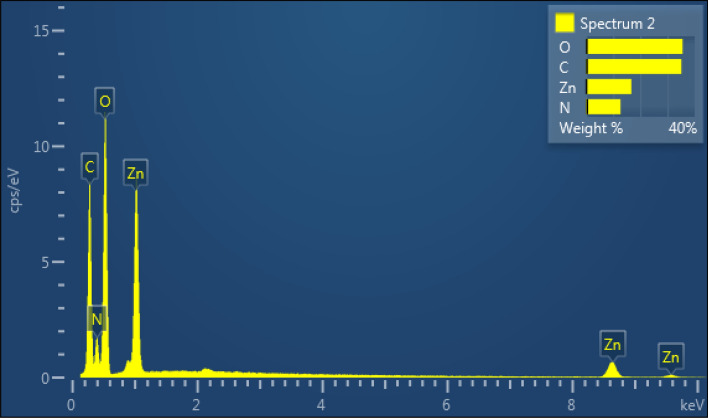
Metal–organic frameworks (MOFs) are hybrid materials comprising organic linkers and metal ions with high porosity and crystallinity. To study the morphologies, SEM images of the ZPBIF-1, investigated at the high magnifications, show regular rods with the hexagonal face (Fig. 3). Furthermore, it suggests the formation of ZPBIF-1 with homogeneous distribution throughout the MOF. The average size of 40.08 ± 4.62 µm, Energy-dispersive X-ray spectroscopy (EDAX) analyses (Fig. 4) of the ZPBI-MOF show C, O, N, and Zn elements 35.06, 12.69, 35.56, 16.69, respectively.
Figure 3.
Scanning electron microscopy images of ZPBIF-1.
Figure 4.
Energy-dispersive X-ray analysis of ZPBI-MOF. The raw data for this figure is provided in the Supplementary file 1.
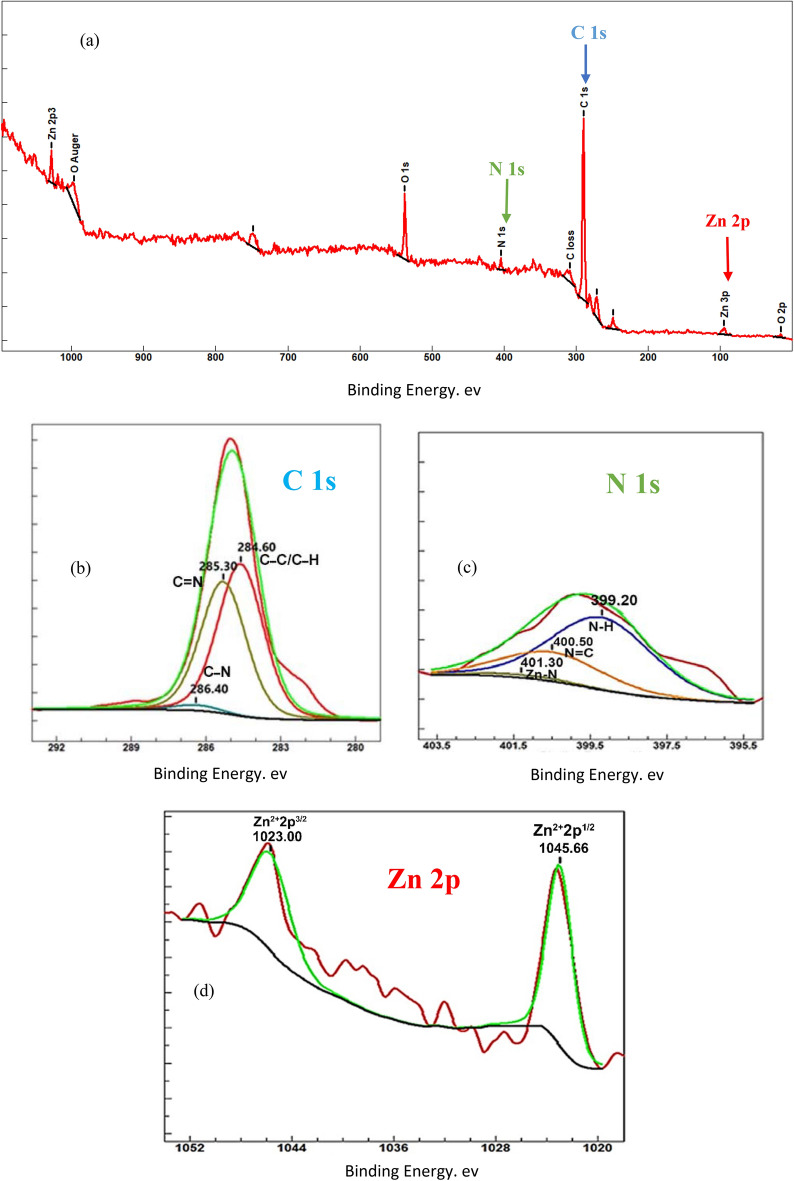
A XPS spectrum of the new MOF was prepared in order to determine its oxidation states and chemical bonds. According to Fig. 5a, the presence of constituted elements (N 1 s, C 1 s, and Zn 2p) was proved. As seen in Fig. 5b, high-resolution XPS of the C 1 s spectrum was explained by three well-fitted curves, as well as their respective binding energies. C–C/C–H (saturated carbons), C=N (unsaturated ring), and C–N bonds cause prominent peaks at 284.60, 285.30, and 286.40 eV. Figure 5c confirms the existence of coordination Zn–N bonds at 401.30 eV. N=C and N–H may be responsible for other curves at 400.50 and 399.29 eV, respectively32,33. Ultimately, the oxidation states of zinc elements: Zn2+ 2p1/2 and Zn2+ 2p3/2 could be proved at notable peaks at 1045.66 and 1023 eV, respectively (Fig. 5d).
Figure 5.
XPS spectra of ZPBI-MOF with full survey (a), C 1 s (b), N 1 s (c), and Zn 2p (d). The raw data for this figure is provided in the Supplementary file 3.
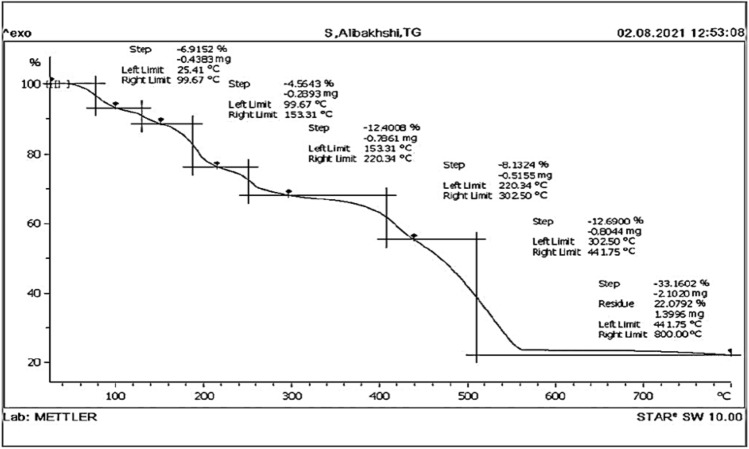
To investigate the thermal stability of the prepared catalyst, derivative TG (DTG) and thermogravimetric analysis (TGA) were carried out. Thermal degradation assessments of solid materials are essential since several applications are based on their thermal stability. The result of the most significant property in the TGA for the ZPBIF-1 was that slight weight loss was found between the temperature range of 100–230 °C, revealing that the ZPBIF-1 was stable up to 400 °C (Fig. 6).
Figure 6.
TGA of ZPBIF-1. The raw data for this figure is provided in the Supplementary file 4.
It was indicated that a sharp weight-loss step of over 33.1602% was found by incrementing the temperature from 302.50 to 800 °C. This reveals the thermal decomposition of the ZPBIF-1 in that temperature range. This result of TGA confirmed the applicability of the ZPBIF-1 across various temperatures. The TG analysis of ZPBIF-1 revealed that the MOF was almost constant up to 400 °C with a bit of mass loss (12%). Then a fast and vast weight loss happened from 302.50 to 800 °C, probably due to the exothermic decomposition of ligand (2-phenyl benzimidazole) in these temperatures.
N2 adsorption–desorption analysis was employed for obtaining total pore volume (Vm) and specific surface area of sample. Langmuir surface area and Vm of the ZPBIF-1 were 370.73 m2/g and 85.176 cm3/g, respectively (The related diagram has been shown in Supplementary file 6).
Adsorption studies
Dye adsorption of Acid Red 88, Basic Violet 14, Basic Blue 54, and Congo red was investigated using ZPBIF-1. Initial dye concentration (20 mg/L) as a function of time (10–60 min) using ZPBIF-1 (0.08 g/L) was studied. It was clear that the ZPBIF-1 was capable of removing 51.7% Acid red 88, 91.7%, Basic violet 14, 99% Basic blue 54, and 97.68% Congo red within 10 min. The removal rate reached 100% within 20 min contact time.
Effect of pH on dye adsorption
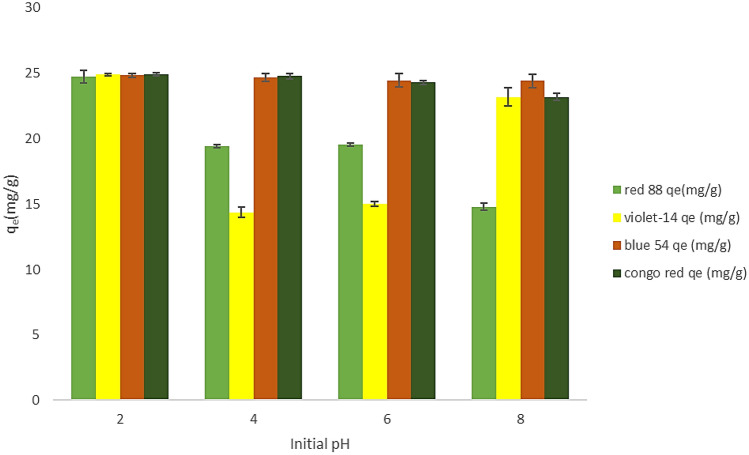
In dye adsorption, pH is crucial since it determines the degree of ionization of the adsorptive molecules and the surface charge of the adsorbent. The impact of initial solution pH on the adsorption capacity of dyes onto the ZPBIF-1 was recognized at various levels (pH = 2–8) at fixed values of critical parameters (adsorbent dosage 0.008 g/10 mL, dye concentration 20 mg/L, and contact time 20 min). According to Fig. 7, the highest adsorption capacity occurred at pH = 2 for all the dyes containing Acid red 88, Basic violet 14, Basic blue 54, and Congo red. As the solution pH increases from 2 to 8, the adsorption capacity qt (mg/g) decreases for Acid red 88 (an anionic dye). For the other dyes, the pH increase does not significantly reduce the adsorption capacity. This may be due to a large number of functional groups in dyes and the different interactions such as hydrogen bonding, dipole–dipole forces between dye and adsorbent34,35.
Figure 7.
Effect of pH value on dye adsorption (Initial dye concentration 20 mg/L, Adsorbent mass 0.08 g/L, contact time 20 min, Tem. 25 °C, Stirring 400 rpm). The raw data for this figure is provided in the Supplementary file 1.
Effects of contact time
The effect of contact time on ZPBIF-1 adsorption capacity and dye removal percentage was evaluated under optimal conditions (adsorbent dosage 0.08 g/L, pH = 2, initial dye concentration 20 mg/L, and 25 °C). In this study, the removal efficiency of all dyes was determined as a function of contact time ranging from 10 to 60 min. Based on the results the percent removal and adsorption capacity of the ZPBIF-1 first increase significantly, then increment at a relatively slow speed with the contact time until equilibrium is reached. The most significant adsorption efficiency was obtained after 20 min of dye contact with ZPBIF-1. It is ascribed to the fact that many vacant surfaces are accessible for adsorption at the beginning. After a while, it becomes harder and harder to find the remaining vacant active sites. Hence, in this study, 20 min was selected as the equilibrium contact time.
Effect of ZPBIF dosage
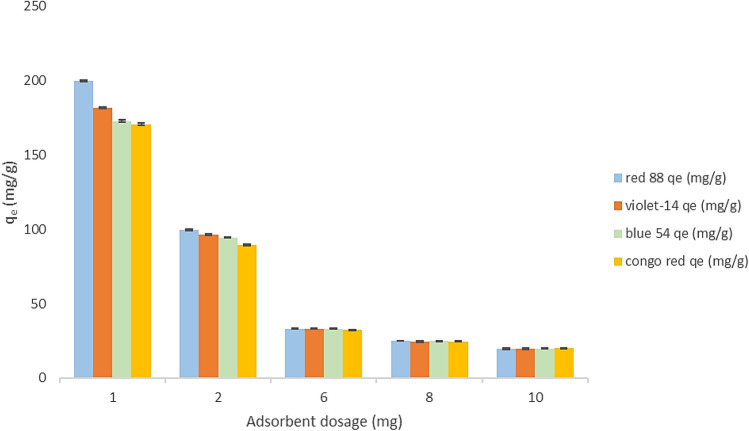
Adsorbent concentration is an essential parameter because it indicates the most adsorbent capacity for an initial dye concentration. The optimal amount of ZPBIF-1 to adsorb dyes was determined by adsorption tests performed using 0.001–1 g/L adsorbent at pH = 2, 25 °C, and initial dye concentration (20 mg/L) for 20 min. Figure 8 shows that 100, 91, 86.8, and 85.87% of Acid red 88, Basic violet 14, Basic blue 54, and Congo red were removed from their aqueous solutions when 0.001 g ZPBIF-1 was used as an initial dosage. The best dosage of ZPBIF-1 found to remove Congo red was 0.008 g, while the dosages for Acid red 88, Basic violet 14, and Basic blue 54 were 0.001, 0.006, and 0.006 g, respectively. By increasing the dosage of ZPBIF-1 by 0.008 g, the removal percentage of all dyes increased and ultimately reached 100% for each dye. Further increase of the adsorbent dosage did not influence the removal of dyes, so the dosage of 0.008 g was selected. Additionally, Fig. 8 discusses the removal rate (R%), which increases with incrementing adsorbent amount until achieving equilibrium. This can be explained by an increase in the adsorbent's specific surface area and the availability of more active sites to adsorb dye. In this study, the removal rate of dyes was 100% at 0.008 g of ZPBIF-1, which was considered the optimal adsorbent dose.
Figure 8.
Effect of adsorbent dose (1–10 mg) on dye adsorption (Initial dye concentration 20 mg/l, Adsorbent mass 0.08 g/L, Contact time 20 min, Tem. 25–65 °C). The raw data for this figure is provided in the Supplementary file 1.
Effect of temperature
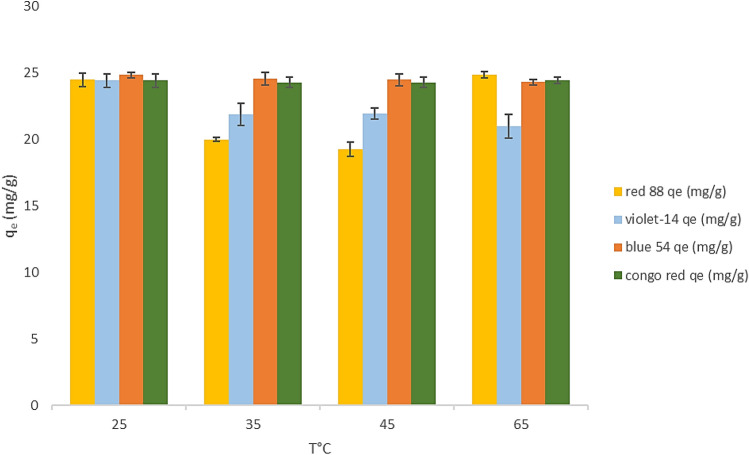
The temperature is the main adsorption parameter that could play an essential role in the adsorption process. The temperature severely affects the solution viscosity and thus the adsorption capacity. Therefore, it is necessary to determine the optimum temperature for the adsorption procedure. At the initial concentration of dye 20 mg/L, the effects of temperature on the adsorption of ZPBIF-1 were investigated under optimal conditions (pH = 2, initial dyes concentrations 20 mg/L, stirring time 20 min). Figure 9 showed removal efficiencies for Acid red 88, Basic violet 14, Basic blue 54, and Congo red as a function of temperature ranging between 298 and 323 K. Also, the effect of temperature (298, 273,313, and 323 K) on the adsorption capacity of dye was represented. It is evident that the increase in temperature negatively impacted the removal of dyes. The optimal temperature for the removal of dyes by the ZPBIF-1 was 25 °C.
Figure 9.
Effect of temperature (25–65 °C) on dye adsorption (Initial dye concentration 20 mg/L, Adsorbent mass 0.08 g/L, contact time 20 min, Stirring 400 rpm). The raw data for this figure is provided in the Supplementary file 1.
Effects of initial dye concentration
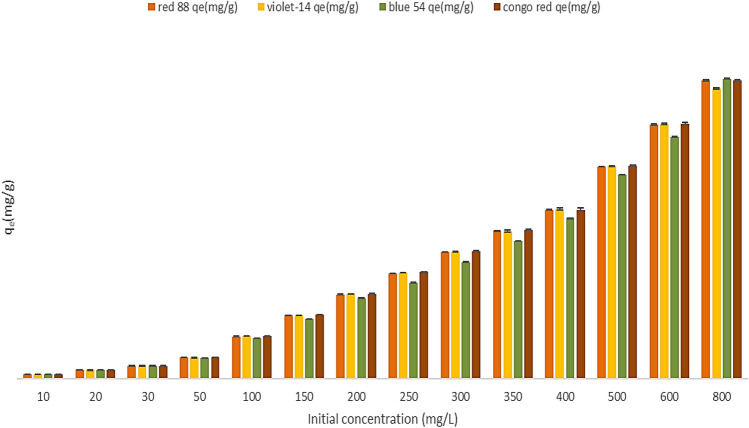
The initial dye concentrations play a critical role in overcoming dye mass transfer resistance between the aqueous and solid phases36. Therefore, increasing initial dye concentrations would increase dye's adsorption capacity. On the other hand, a dye molecule can travel from bulk liquids to the outside surface of adsorbent, indicating that the adsorption of dye onto adsorbent is dependent on the concentration of dye molecules at the time of adsorption. Therefore, at low initial concentrations the percentage removal of dye is greater, but at high initial concentrations it is smaller. In this study, the effects of dye concentration (from 10 to 800 mg/L) on adsorption were investigated at 25–65 °C and 0.08 g/L adsorbent concentration for 20 min. According to Fig. 10, incrementing the concentration of the initial dye from 10 to 800 mg/L, the ZPBIF-1 equilibrium sorption capacities increment from 12.5 to 875, 850, 877.68 and 875 mg/g for Acid red 88, Basic violet 14, Basic blue 54, and Congo red, respectively. Also, the removal efficiency reduced gradually from 100% to 88.75, 85.00, 87.76, and 88.75% with the increasing initial concentration of dyes Acid red 88, Basic Violet 14, Basic Blue 54, and Congo red, respectively.
Figure 10.
Effect of initial concentration (10–800 mg/L) on dye adsorption (Adsorbent mass 0.08 g/L, Contact time 20 min, Tem. 25–65 °C). The raw data for this figure is provided in the Supplementary file 1.
Adsorption isotherms
During the adsorption procedure, equilibrium isotherms were used to determine the relationship between the dyes adsorbed (Qe, mg/g) on ZPBIF-1 and the equilibrium concentration of the solution (Ce, mg/L). The optimal conditions for dye adsorption were an adsorbent dosage of 0.08 g/L, pH = 2, and an equilibrium time of 20 min. Generally, adsorption isotherms present valuable information about surface properties, the tendency of adsorbents, and the adsorption mechanism37. In this study, Langmuir and Freundlich, Temkin, and Dubinin–Radushkevi isotherms were employed to describe the equilibrium of dyes adsorbed by ZPBIF-1. Among them, the Langmuir adsorption isotherm was the most suitable model. According to this model, adsorption occurs within homogeneous sites over the absorbent without any adsorbent transmission through the surface. The Langmuir isotherm equilibrium looks as below38:
| 3 |
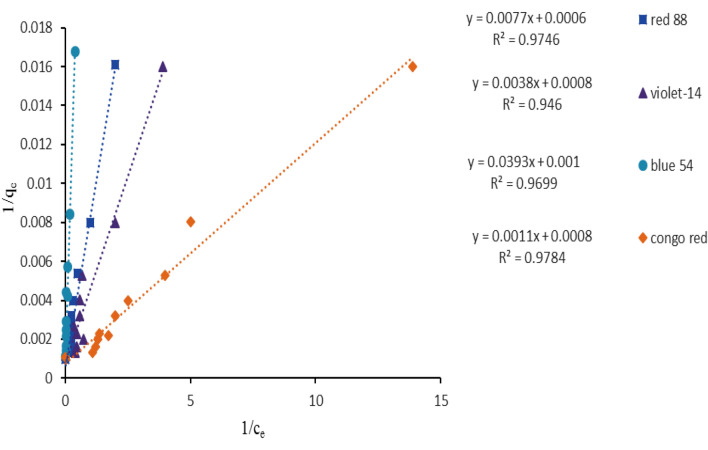
In which, Ce (mg/L) and qe (mg/g) represent the dye concentration in solution and the quantity of dye adsorbed per unit mass of ZPBIF-1 at equilibrium, respectively. Qmax (mg/g) represents the maximum adsorption capacity, as well as b (KL) (L/mg) describes the Langmuir constant for the adsorbent and adsorbate requirements. In the Langmuir model, the isotherm constants (KL, Qmax, and R2) were found through linear plotting of 1/qe against 1/Ce (Fig. 11).
Figure 11.
Linearized Langmuir isotherm for the adsorption of dyes by ZPBIF-1 composites. The raw data for this figure is provided in the Supplementary file 1.
It is indicated that the Langmuir model can acceptably provide the adsorption isotherm data. The Langmuir isotherm’s fundamental features are communicated based on equilibrium parameter (RL) or dimensionless constant separation factor as:
| 4 |
In which C0 (mg/L) is the most effective initial concentration of the adsorbent. The worth of RL demonstrates the kind of the isotherm as linear (RL = 1), unfavorable (RL > 1), irreversible (RL = 0), or favorable (0 < RL < 1). Based on Table 1, all the RL values were between 0 and 1, representing the favorable adsorption of dyes by ZPBIF-1. The utmost monolayer adsorption capacity Qmax was 1666.66, 1250, 1000, and 1250 mg /g for dyes, respectively.
Table 1.
Linearized isotherm coefficients for dye adsorption (Initial dye concentration 50–800 mg/L, Adsorbent mass 0.08 g/L, Contact time 20 min, Tem. 25–65 °C).
| Isotherm models | Isotherm parameters | Acid red 88 | Basic Violet 14 | Basic Blue 54 | Congo red |
|---|---|---|---|---|---|
| Langmuir model | Qm (mg/g) | 1666.66 | 1250 | 1000 | 1250 |
| KL (L/mg) | 0.077 | 0.210 | 0.025 | 0.727 | |
| R2 | 0.9746 | 0.946 | 0.9699 | 0.9784 | |
| Freundlich model | Kf (mg/g) | 169.31 | 240.32 | 34.34 | 364.16 |
| n | 2.02 | 2.59 | 1.32 | 3.00 | |
| R2 | 0.6470 | 0.5473 | 0.9009 | 0.5585 | |
| Tempkin model | KT (L/mg) | 3.22 | 10.56 | 3.13 | 46.17 |
| bT (J/mol) | 17.10 | 18.92 | 11.00 | 20.72 | |
| R2 | 0.6716 | 0.6158 | 0.7809 | 0.6992 | |
| B1 | 164.27 | 130.92 | 225.21 | 119.56 | |
| Dubinin-Radushkevich model | Qs (mg/ g) | 471.11 | 462.66 | 407.15 | 617.20 |
| Kad (mol2/J2) | 0.0000007 | 0.00000009 | 0.000003 | 0.00000006 | |
| E (kJ/mol) | 0.845 | 2.357 | 0.408 | 2.886 | |
| R2 | 0.6784 | 0.6228 | 0.6467 | 0.8624 | |
| Separation factor (RL) | C0 (mg/L) 50–800 | 0.206–0.015 | 0.086–0.005 | 0.444–0.047 | 0.026–0.001 |
The raw data for this table is provided in the Supplementary file 2.
Freundlich isotherm relies on reversible, monolayer, and non-ideal adsorption, which might be accustomed to multiple-layer adsorption on heterogeneous surfaces with disparate affinities and adsorption energy. This model could even be represented as:
| 5 |
1/n and KF are Freundlich constants associated with the adsorption intensity and adsorption capacity per unit concentration, respectively. The n and KF are determined from the slope and axis intercept of the plot (Table 1). The value of n denotes the adsorption favorability. The character of adsorption is favorable when n ˃ 1. Equation (6) can be reset in linear form as:
| 6 |
The linear plot of log qe against log Ce was used to investigate the Freundlich isotherm of dye removal. The value of n in all cases was more significant than 1, indicating calm adsorption. The Temkin isotherm model assumes that the adsorption heat linearly diminished with expanding the coverage of the absorbent surface. One of the properties of this model is a uniform distribution of the binding energy. This isotherm can be written in linear form as37:
| 7 |
in which bT is that the Temkin constant represents the sorption point, (kJ/mol), and KT is the equilibrium binding constant associated with the foremost energy (L/g). T is the temperature (K), and R is the gas constant (8.314 J/mol K). The Temkin isotherm compatibly with dye adsorption data through ZPBIF-1 was investigated by the linear plot of qe against Ce. Table 1 shows the isotherm constants (KT, R2, and BT). These values are but the Langmuir, and Freundlich values reveal that the Temkin isotherm features worse experimental data compared to the other isotherms.
The Dubinin–Radushkevich (DRK) isotherm is used to formulate the adsorption mechanism over a heterogeneous surface with a Gaussian energy distribution39. The empirical form is given by the Eq. (8). The DRK isotherm constant ε is obtained using Eq. (9). The model is mainly used to differentiate between physical and chemical adsorption of metal ions with its mean free energy E per adsorbent molecule as:
| 8 |
| 9 |
| 10 |
here, qe is the amount of adsorbate (mg/g); qs shows the theoretical saturation capacity (mg/g); Kad and BDR are the DRK isotherm constants (mol2/kJ2), and ε is the DRK isotherm constant. The gas constant (8.314 kcal/mol K), adsorbate equilibrium concentration (mg/L), and absolute temperature (K) are represented by R, Ce, and T, respectively.
The parameters of the models' isotherms are shown in Table 1. Based on the correlation coefficients (R2) provided by the isotherm models, the Langmuir isotherm possesses the maximum correlation indicating dye adsorption on a homogeneous surface.
In Table 2, the adsorption capacity of ZPBIF-1 was 1666.66, 1250, 1000, and 1250 mg/g, substantially more signicant than the values reported for most other adsorbents. The superior adsorption properties of ZPBIF-1 are attributed to its unique structure, as described below.
ZPBIF-1 nanoparticles are distributed uniformly. It not only has adsorption sites by Zn, but also provides organic framework sites for adsorption.
It was found that ZPBIF-1 has a much higher surface area than simply agglomerated ZIF-8 nanoparticles
Due to the aromatic rings of the ligands of 2-Phenyl benzimidazole, ZPBIF-1 creates an π–π interaction with dyes.
Table 2.
Comparison of dye adsorption capacities for different adsorbents.
| Adsorbents samples | qmax (mg/g) | Refs. |
|---|---|---|
| Acid red 88 | ||
| Bituminous coal | 26.1 | 40 |
| Activated carbon | 109.0 | 40 |
| Anion exchange membrane | 42.01 | 41 |
| Raw alunite | 20.98 | 42 |
| MNZnFe | 111.1 | 43 |
| ZPBIF-1 | 1666 | This study |
| Basic Violet14 | ||
| Deoiled soya | 12.03 | 44 |
| Bottom ash | 6.39 | 44 |
| Curcuma angustifolia Scales | 208.33 | 45 |
| Calophyllum inophyllum Shells | 1416.43 | 46 |
| Theobroma cacao Shells | 980.39 | 46 |
| ZPBIF-1 | 1250 | This study |
| Congo red | ||
| ZIF-67 | 714.3 | 47 |
| Chitosan hydrogel beads impregnated with cetyl trimethyl ammonium bromide | 352 | 48 |
| Microwave-assisted ZIF-8 | 167 | 49 |
| Activated carbon coffee waste (ACCW) | 90.9 | 50 |
| Activated carbon from java citronella distillation waste | 3.03 | 51 |
| ZPBIF-1 | 1250 | This study |
| Basic Blue 54 | ||
| Sludge biomass | 86.6 | 52 |
| ZPBIF-1 | 1000 | This study |
The higher adsorption capacity of this adsorbent is related additionally to the porous structure, their great specific extent, and more active adsorption sites. It’s concluded that the ZPBIF-1 possesses a relatively higher adsorption capacity representing its feasibility, and applicability as a low-cost, convenient, and effective adsorbent in the adsorption method to urge obviate dyes.
Adsorption kinetics study
The prediction of sorption rate is a key factor in designing batch adsorption procedures, and it is affected by adsorption kinetics. Chemical kinetic models are orientated by the adsorbent's chemical and physical properties, and their assessment is critical to providing insightful information about the factors influencing the reaction speed53. The experimental conditions were conducted at the enhanced points as solution pH = 2, the adsorbent dosage of 0.08 g/L, and initial dye concentrations of 50 and 250 mg/L. Furthermore, six adsorption models were introduced in this study.
First-order reaction model in terms of the solution concentration
Lagergren pseudo-first-order equation in terms of the solid capacity54
Second-order reaction model oriented by the solution concentration
Pseudo-second-order reaction model of Mckay and Ho, in terms of the solid phase sorption
Intra-particle diffusion55
Using Elovich models, the kinetics of dye adsorption over the prepared adsorbents were evaluated
The integrated form of the first-order rate equation in terms of the solution concentration can be stated as:
| 11 |
In Eq. (11), the plot of ln Ct versus time (t) shows the linear plot of the first-order equation.
Using the best-fit line, the coefficient value (R2) was determined (Table 3). The pseudo-first-order kinetic model can be integrated in terms of the solid capacity for sorption analysis as:
| 12 |
Table 3.
Kinetics constants for the adsorption of dyes by ZPBIF-1 (Contact time = 20 min, Tem = 25–65 °C, Adsorbent mass = 0. 08 g/L, Initial concertation 50 and 250 mg/L, Stirring = 400 rpm and pH = 2).
| Acid Red 88 | Basic Violet 14 | Basic blue 54 | Congo red | |||||
|---|---|---|---|---|---|---|---|---|
| Pseudo-first-order model | ||||||||
| C0 (mg/L) | 50 | 250 | 50 | 250 | 50 | 250 | 50 | 250 |
| qe,exp(mg/g) | 61.87 | 307.55 | 62.18 | 310.30 | 59.37 | 281.25 | 62.41 | 311.87 |
| qe,cal (mg/g) | 55.63 | 370.59 | 53.57 | 183.71 | 61.90 | 252.29 | 59.24 | 270.20 |
| K1/(min) | 0.1376 | 0.3894 | 0.1704 | 0.6632 | 0.3614 | 0.2998 | 0.4054 | 0.5918 |
| R2 | 0.9333 | 0.9732 | 0.9160 | 0.9304 | 0.9983 | 0.9845 | 0.9981 | 0.9930 |
| First-order model | ||||||||
| C0 | 64.80 | 185.04 | 61.75 | 107.66 | 34.80 | 183.60 | 36.88 | 102.53 |
| K1 | 0.2066 | 0.2208 | 0.2384 | 0.2548 | 0.1554 | 0.1185 | 0.3401 | 0.3329 |
| R2 | 0.8630 | 0.9301 | 0.888 | 0.7745 | 0.8722 | 0.8470 | 0.9774 | 0.8386 |
| Pseudo-second-order model | ||||||||
| qe,cal (mg/g) | 59.88 | 312.5 | 60.97 | 312.5 | 58.82 | 277.77 | 62.50 | 312.5 |
| K2 (g/min mg) | 0.0228 | 0.0256 | 0.0389 | 0 | 0.0741 | 0.0648 | 0.3657 | 1.024 |
| R2 | 0.9798 | 0.9994 | 0.9926 | 1 | 0.9979 | 0.9999 | 1 | 1 |
| Second-order model | ||||||||
| C0 | 2.94 | 89.28 | 1.44 | 10.39 | 28.01 | 142.85 | 0.42 | 28.32 |
| K2 | 0.0806 | 0.0138 | 0.1575 | 0.029 | 0.0199 | 0.0018 | 0.7185 | 0.1314 |
| R2 | 0.5178 | 0.8610 | 0.5106 | 0.7872 | 0.9682 | 0.9310 | 0.7514 | 0.9737 |
| Intra-particle diffusion model | ||||||||
| Kp (g/min.mg) | 7.6325 | 10.3320 | 4.6708 | 0.0381 | 1.4859 | 6.9672 | 0.6844 | 0.3658 |
| C (mg/g) | 26.29 | 263.53 | 40.30 | 310.13 | 52.95 | 250.35 | 59.45 | 310.42 |
| R2 | 0.8209 | 0.7934 | 0.7896 | 0.9977 | 0.8812 | 0.9930 | 0.8846 | 0.8637 |
| Elovich constants | ||||||||
| R2 | 0.7865 | 0.8273 | 0.7554 | 0.9916 | 0.9063 | 0.9984 | 0.9094 | 0.892 |
| α (mg/g min) | 50.6321840032 |
5,454,780.13 12,788 |
508.2847556925 | ∞ | 169,642,386.81368 | 1,169,223,763.5818 | 3.06752219E + 190 | 1.36661039E + 191 |
| ß (g/mg) | 0.070 | 0.050 | 0.115 | 13.90 | 0.350 | 0.075 | 0.761 | 1.421 |
The raw data for this table is provided in the Supplementary file 2.
Equation (12) represents a linear plot of ln (qe − qt) against time (t), denoting a pseudo-first-order. qt (mg/g) shows the absorption quantity at time t, while ks1 denotes the constant of the equilibrium rate pseudo-first-order kinetic (/min). In the plot of ln (qe − qt) against t, the straight line represents this kinetic model sufficiency presenting an association between the intercept and slope. The model parameters (ks1 and estimated qe) can be determined, respectively. The kinetic constants (ks1, R2, and (qe)Cal.) are represented in Table 3.
Second-order reaction model.
The integrated second-order rate equation is extensively utilized for the adsorption process, which can be represented mathematically as Eq. (13):
| 13 |
It shows that 1/Ct against time (t) is a linear plot, which indicates that the reaction rate is second order.
The pseudo-second-order model adsorption kinetic depends upon the solid adsorption capacity. Moreover, contrary to other models, it can estimate the absorption performance throughout the absorption range. The linear form of the model is:
| 14 |
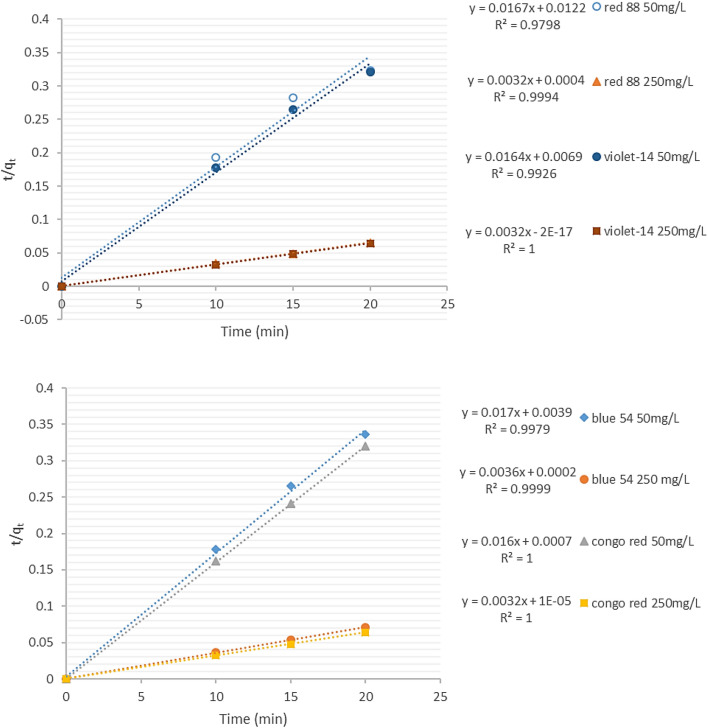
which, qeq and qt represent the numbers of dye adsorbed (mg/g) at equilibrium and time t, respectively; K2 shows the pseudo-second-order kinetic model’s equilibrium rate constant (g/mg/min). Linear plotting t/qt against t was used to investigate the compatibility of pseudo-second-order kinetics on dye removal at various adsorbent dosages from single systems. The value of qeq is obtained from the slope of the t/qt against t in the plot (Fig. 12), and K2 is determined from the initial sorption rate value. Results showed that the adsorption process conformed better to the pseudo-second-order model. There was a linear plot with the highest correlation coefficients in this model (Table 3). Considering the coefficient of the determinant of the value, the pseudo-second-order reaction kinetic model was followed by the adsorption processes well compared to the other three kinetic models.
Figure 12.
Kinetics plot for the adsorption of dyes by ZPBIF-1. The pseudo- second-order model (Contact time = 20 min, Tem = 25–65 °C, Adsorbent mass = 0. 08 g/L, Initial concertation 50 and 250 mg/L, Stirring = 400 rpm and pH = 2).
Adsorption is often a multi-stage process, including transferring aqueous solute molecules to the solid particles' surface, where they penetrate the pores (slower step). The diffusion mechanism is not determined by first and second-order kinetic models. Hence, it is preferred to use the intraparticle diffusion model to evaluate the results of kinetics as follows56:
| 15 |
where Kp (mg/g min1/2) denotes the intraparticle diffusion rate constant, and I is the intercept. The intraparticle diffusion kinetics constants (R2, I, and Kp) attained by linear plotting of qt against t1/2 are presented in Table 3.
Another kinetic model equation in terms of the adsorption capacity is the Elovich equation by Eq. (16)57:
| 16 |
α and β respectively represent the Elovich constants denoting the initial adsorption rate (g/mg min) and the desorption constant (mg/g min). The Elovich constants are attained from the graphs of qt versus ln t (Table 3).
According to the results from Table 3, the Pseudo-second order model is the best fitting model representing the higher correlation coefficient Acid red88, Basic violet14, Basic blue54, and Congo red, R2 = 50 mg/L (0.9798, 0.9926, 0.9979, 1.0), and 250 mg/L (0.9994, 1.0, 0.9999, 1.0) for the adsorption of dyes by ZPBIF-1.
Thermodynamics study and effects of temperature.
Due to the importance of temperature in the adsorption process, its impacts on the adsorption of dyes on ZPBIF-1 were examined at 24, 45, and 65 °C, and pH = 2 and 100 mg/L of initial dye concentration. The thermodynamic parameters such as entropy (ΔS°), Gibbs free energy (ΔG°), and enthalpy (ΔH°) were determined as:
| 16 |
| 17 |
| 18 |
where T represents the temperature in Kelvin, and R is the gas constant (8.314 J/mol K). Kd shows the distribution coefficient determined by Eq. (17). C0 denotes the initial dye concentration in solution (mg/l), m represents the adsorbent mass (g), V is the solution volume, Ce is the equilibrium concentration (mg/l), and Qe is the quantity adsorbed per unit adsorbent mass at equilibrium (mg/g). Entropy (ΔS°) and enthalpy (ΔH°) were computed from the intercept and slope of the Van’t Hoff plot of ln qe/Ce versus 1/T. To calculate the value of Gibbs free energy (ΔG°), Eq. (18) was used (Table 4).
Table 4.
Thermodynamic parameters for the adsorption of dyes on ZPBIF-1.
| ΔS (J/mol K) | ΔH (Kj/mol) | ΔG (Kj/mol) | (k) | (Acid red88) (PPM) |
|---|---|---|---|---|
| 124.37 | 29.09 | − 8.44 | 298 | 100/mg/L |
| − 10.86 | 318 | |||
| − 13.51 | 338 |
| ΔS (J/mol.K) | ΔH (Kj/mol) | ΔG (Kj/mol) | (k) | (Basic Violet 14) (PPM) |
|---|---|---|---|---|
| − 71.20 | − 35.04 | − 13.65 | 298 | 100 mg/L |
| − 10.99 | 318 | |||
| − 10.75 | 338 |
| ΔS (J/mol.K) | ΔH (Kj/mol) | ΔG (Kj/mol) | (k) | (Basic Blue54) (PPM) |
|---|---|---|---|---|
| − 5.63 | − 9.74 | − 7.82 | 298 | 100 mg/L |
| − 7.98 | 318 | |||
| − 7.55 | 338 |
| ΔS (J/mol.K) | ΔH (Kj/mol) | ΔG (Kj/mol) | (k) | (Congo red) (PPM) |
|---|---|---|---|---|
| − 254.04 | − 91.34 | − 15.92 | 298 | 100 mg/L |
| − 5.42 | 318 | |||
| − 5.71 | 338 |
The raw data for this table is provided in the Supplementary file 2.
The negative value of ΔH° represents the exothermic adsorption of Basic Violet14, Basic Blue 54, and Congo red onto ZPBIF-1. Moreover, the negative value of ΔS° suggests the reduction of randomness at the solid-solution interface during the adsorption procedure55. During the procedure, the mobility of dye molecules was increased by increasing the temperature, which caused them to escape from the solid to the liquid phase. Acid red 88 exhibited endothermic properties during its adsorption process, as indicated by its positive value of ΔH°. However, randomness increased at the solid-solution interface, as shown by its positive value of ΔS°. The negative values of Gibb’s free energy ΔG° represent the spontaneous adsorption process for all dyes.
Adsorption mechanism
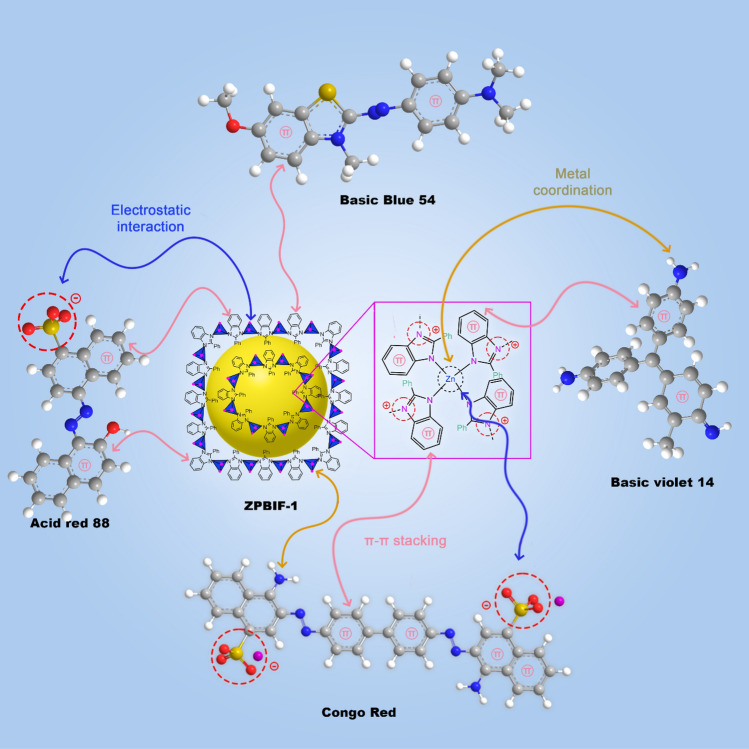
Different interactions are responsible for the adsorption mechanism of organic dyes on the ZPBIF-1 surface. The electrostatic attractions between the positively charged Zn groups occurred on the ZPBIF-1 surface with negatively charged sulfonate (SO3-) groups of Acid red 88 and Congo red dyes. Molecules were readily adsorbed on the positively charged ZPBIF-1, and the open sites within the ZPBIF-1 were simply complexed with NH2. This was probably due to a soft–soft interaction of the metal ions of ZPBIF-1 with the amino groups of the dyes58. Furthermore, there may be an π–π attraction between the dye molecules and phenyl benzimidazole ligands59. In total, three main types of interactions were considered in the adsorption mechanism, including π–π attraction, electrostatic interactions, and metal coordination. The proposed adsorption mechanism was presented as a schematic diagram (Fig. 13).
Figure 13.
Plausible adsorption mechanism of ZPBIF-1 towards organic dyes.
To demonstrate the interactions between dyes and ZPBIF-1, the FTIR spectra of adsorbent before and after adsorption of Congo red were compared. For example, the peak at 1388.78/cm in ZPBIF-1 was indicative of C–N vibration, which changed enormously after adsorption and became a dual peak in 1400–1460/cm. The peaks at 697.63/cm and 750.70/cm in ZPBIF-1 represented Z–N and C=C vibrations were reduced to 650.50/cm and 744.20/cm after adsorption of Congo red. Moreover, the peaks at 1061.54, 1178.78, and 1224.99/cm for S=O in Congo red were changed after adsorption on the ZPBIF-1 surface.
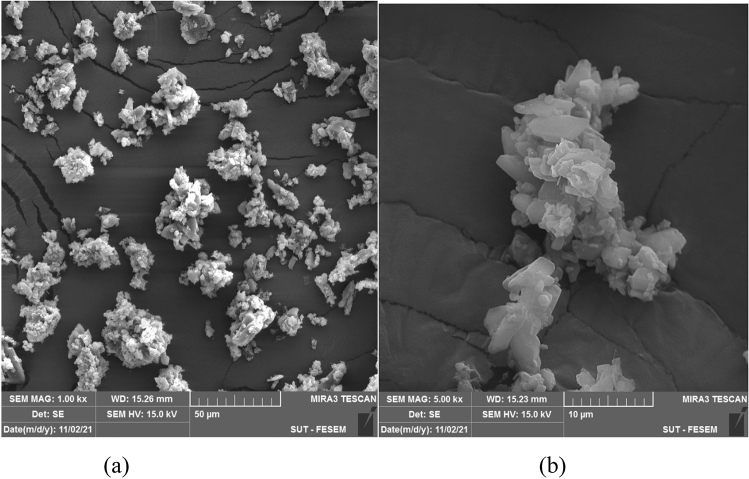
SEM images of ZPBIF-1 after adsorption of Acid red 88 are shown in Fig. 14, which can compare to the unused ZPBIF-1 (Fig. 5). The morphology of the unused ZPBIF-1 showed regular rods with hexagonal faces. However, its surface after adsorption of Acid red 88 dye was morphologically irregular, which is not surprising since the dye molecules adsorbed on the ZPBIF-1 surface caused morphological changes. These results showed that ZPBIF-1 could adsorb Acid red 88 molecules well.
Figure 14.
SEM images of ZPBIF-1 after adsorption of Acid red 88 (a, b).
XRD patterns of ZPBIF-1 composites before and after dye adsorption showed similar peak shapes, revealing the failure of adsorption to alter the crystalline form of ZPBIF-1.
Regeneration and recycling of ZPBIF-1 nanocomposites
In large-scale functional applications, recyclability and stability of adsorbents play an important role in reducing the material cost of water treatment. The practical potential for adsorbents can be evaluated substantially based on their recyclability. Here, the ZPBIF-1 adsorbent was recovered and used in 3 cycles for dye removal. The results of the reusability of ZPBIF-1 are demonstrated in Fig. 15. It should be noted that even after 3 cycles, the percent removal was above 80%.
Figure 15.
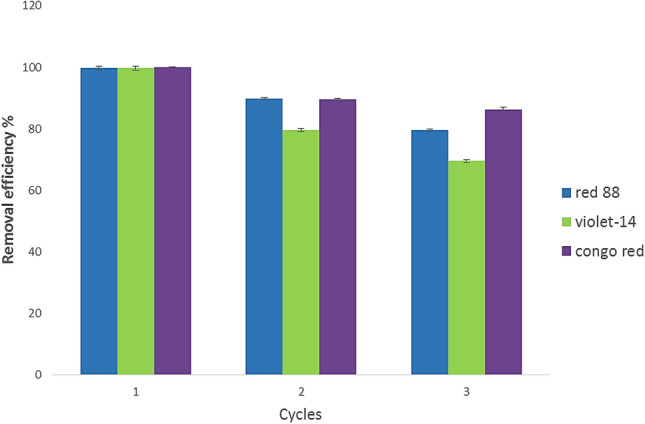
Recyclability study of ZPBIF-1 towards dyes. The raw data for Fig. 14 is provided in the Supplementary file 1.
Removal of dyes from wastewater sample
The applicability of the developed adsorbent was evaluated using a textile wastewater sample. The wastewater sample was filtered using a 0.45-mm pore size membrane filter to remove suspended particulate matter. One solution containing 50 mg/L of acid red 88 in wastewater was prepared as an actual sample. Then, 0.016 g of ZPBIF-1 was added to 100 mL wastewater at pH = 2. The mixed solution was shacked for 20 min. Because of the matrix effect, the tests were performed through the standard addition method, and the initial and final concentrations of the target species (before and after removal with the recommended procedure) were determined. For this aim, four 25 mL volumetric flasks were each filled with 20 mL of wastewater samples. Then, the different amounts of the standard acid red 88 solutions (0, 0.25, 0.5, and 0.75 mL of 1000 mg/L) were added, and the solutions in the flasks were diluted to the mark and mixed well. The amounts of dye in the solution were determined by the UV–Vis spectrophotometry method, and the absorption versus standard concentration was plotted. A simple Linear Least Squares analysis was conducted using the slope and intercept functions of Microsoft Excel. To find the initial concentration of the unknown, the value of X at y = 0 from y = mX + b was calculated. As shown in Table 5, the proposed method could be applied successfully for the removal of acid red 88 from an actual sample of textile wastewater with acceptable efficiency. ZPBIF-1 had a removal efficiency of 92.9% for the real sample.
Table 5.
Removal of Acid Red 88 dye from textile wastewater sample.
| Dye | Initial concentration (mg/L) | Final concentration (mg/L) | % Removal |
|---|---|---|---|
| Acid Red 88 | 50 | 3.55 | 92.9 |
The raw data for this table is provided in the Supplementary file 2.
Biodegradability, as well as biological oxygen demand (COD and BOD), were examined on an actual wastewater sample. The COD level decreased from the initial concentration of 1910–63 mg/L. Similarly, the BOD level gradually reduced from the initial concentration of 810–27 mg/L. Based on the acceptable amounts for irrigation and agricultural uses, 200 and 100 mg/L, respectively, the performance of this adsorbent has been evaluated very well, and the treated effluent can be reused. As a result, during the adsorption process, the organic portion of the dye molecules may be destroyed, decomposed, and even adsorbed.
Conclusion
A new MOF, Tetrakis (2-phenylbenzoimidazol-1-yl) zinc (ZPBIF-1), was successfully synthesized by the solvothermal method. According to the results of response surface methodology-based optimization, the optimal conditions to eliminate Acid red88, Basic violet14, Basic blue54, and Congo red were Co = 20 mg/L, contact time = 20 min , adsorbent dosage = 0.08 g/L, and pH = 2. In comparison with other adsorbents, ZPBIF-1 showed superior adsorption capacity at 1666.66, 1250, 1000, and 1250 mg/g for the above dyes. The adsorption kinetics followed the pseudo-second-order models for all organic dyes. In the meantime, according to the adsorption isotherms, all colors follow the Langmuir model. The exceptional adsorption properties of ZPBIF-1 can be attributed largely to the unique structure and interaction of active functional groups, such as electrostatic interaction, hydrogen bonding, π–π conjugation, and coordination effect of zinc. The thermodynamic parameters showed that adsorption on ZPBIF-1 was spontaneous and thermodynamically favorable. The dye adsorption for Basic violet 14, Basic blue 54, and Congo red by ZPBIF-1 was exothermic, while the dye adsorption for Acid red 88 was endothermic.
ZPBIF-1’s unique properties, such as its high recycling capacity, the number of aromatic rings, high removal efficiency, and maximum adsorption capacities (1666.66–1250 mg/g) make it an effective dye adsorbent that can be used for the removal of dye from wastewater.
Supplementary Information
Acknowledgements
The authors would like to thank the Islamic Azad University of Yadegar-e-Imam Khomeini (RAH) Shahre-Rey branch for giving Grants to carry out the project as mentioned earlier.
Author contributions
S.A. wrote the crude main manuscript and prepared the figures and tables with the assistance of other authors (she is PhD student). A.S.S. wrote title and abstract, edited the main manuscript, prepared graphical abstract and reviwed the other parts of manuscript. Moreover she submitted the manuscript as the corresponding author. S.S. edited the part of “Results and discussion” and reviewed “Adsorption Studies” in the manuscript. M.R. contributed to the experimental section and characterization of ZPBIF-1 in the manuscript. S.S. contributed to the experimental section and reviewed the manuscript overall.
Data availability
All data generated or analyzed during this study are included in this published article and its supplementary information files (Supplementary files 1–6). Requests for material and additional data should be made to the corresponding authors.
Competing interests
The authors declare no competing interests.
Footnotes
Publisher's note
Springer Nature remains neutral with regard to jurisdictional claims in published maps and institutional affiliations.
Supplementary Information
The online version contains supplementary material available at 10.1038/s41598-022-16753-8.
References
- 1.Brown MA, De Vito SC. Predicting azo dye toxicity. Crit. Rev. Environ. Sci. Technol. 1993;23:249–324. doi: 10.1080/10643389309388453. [DOI] [Google Scholar]
- 2.Yu H, Fugetsu B. A novel adsorbent obtained by inserting carbon nanotubes into cavities of diatomite and applications for organic dye elimination from contaminated water. J. Hazard. Mater. 2010;177:138–145. doi: 10.1016/j.jhazmat.2009.12.007. [DOI] [PubMed] [Google Scholar]
- 3.Gregory AR, Elliott J, Kluge P. Ames testing of direct black 38 parallels carcinogenicity testing. J. Appl. Toxicol. 1981;1:308–313. doi: 10.1002/jat.2550010608. [DOI] [PubMed] [Google Scholar]
- 4.McKay G, Otterburn MS, Aga JA. Fuller’s earth and fired clay as adsorbents for dyestuffs. Water. Air. Soil Pollut. 1985;24:307–322. doi: 10.1007/BF00161790. [DOI] [Google Scholar]
- 5.Ghosh S, Dey KP, Naskar MK. Synthesis of nanofiber-like mesoporous γ-Al2O3 toward its adsorption efficiency for Congo red. J. Am. Ceram. Soc. 2013;96:28–31. doi: 10.1111/jace.12084. [DOI] [Google Scholar]
- 6.Maneerung T, et al. Activated carbon derived from carbon residue from biomass gasification and its application for dye adsorption: Kinetics, isotherms and thermodynamic studies. Bioresour. Technol. 2016;200:350–359. doi: 10.1016/j.biortech.2015.10.047. [DOI] [PubMed] [Google Scholar]
- 7.Hajiaghababaei L, et al. Amino ethyl-functionalized SBA-15: A promising adsorbent for anionic and cationic dyes removal. Iran. J. Chem. Chem. Eng. 2017;36:97–108. [Google Scholar]
- 8.Habibi S, et al. Removal of Reactive Black 5 from water using carboxylic acid-grafted SBA-15 nanorods. Desalin. WATER Treat. 2017;95:333–341. doi: 10.5004/dwt.2017.21516. [DOI] [Google Scholar]
- 9.Cheng Z, Zhang L, Guo X, Jiang X, Li T. Adsorption behavior of direct red 80 and congo red onto activated carbon/surfactant: Process optimization, kinetics and equilibrium. Spectrochim. Acta Part A Mol. Biomol. Spectrosc. 2015;137:1126–1143. doi: 10.1016/j.saa.2014.08.138. [DOI] [PubMed] [Google Scholar]
- 10.Dai X, Li X, Zhang M, Xie J, Wang X. Zeolitic imidazole framework/graphene oxide hybrid functionalized poly(lactic acid) electrospun membranes: A promising environmentally friendly water treatment material. ACS Omega. 2018;3:6860–6866. doi: 10.1021/acsomega.8b00792. [DOI] [PMC free article] [PubMed] [Google Scholar]
- 11.Rashed MN. Adsorption technique for the removal of organic pollutants from water and wastewater. Organic pollutants-monitoring, risk and treatment. InTech Open. 2013;7:167–194. [Google Scholar]
- 12.Katheresan V, Kansedo J, Lau SY. Efficiency of various recent wastewater dye removal methods: A review. J. Environ. Chem. Eng. 2018;6:4676–4697. doi: 10.1016/j.jece.2018.06.060. [DOI] [Google Scholar]
- 13.Taj MB, et al. Bioconjugate synthesis, phytochemical analysis, and optical activity of NiFe2O4 nanoparticles for the removal of ciprofloxacin and Congo red from water. Sci. Rep. 2021;11:5439. doi: 10.1038/s41598-021-84983-3. [DOI] [PMC free article] [PubMed] [Google Scholar]
- 14.Van Tran T, et al. Effect of thermolysis condition on characteristics and nonsteroidal anti-inflammatory drugs (NSAIDs) absorbability of Fe-MIL-88B-derived mesoporous carbons. J. Environ. Chem. Eng. 2019;7:103356. doi: 10.1016/j.jece.2019.103356. [DOI] [Google Scholar]
- 15.Van Tran T, et al. Application of Fe-based metal-organic framework and its pyrolysis products for sulfonamide treatment. Environ. Sci. Pollut. Res. 2019;26:28106–28126. doi: 10.1007/s11356-019-06011-2. [DOI] [PubMed] [Google Scholar]
- 16.Zhao X, et al. Synthesis of magnetic metal-organic framework (MOF) for efficient removal of organic dyes from water. Sci. Rep. 2015;5:11849. doi: 10.1038/srep11849. [DOI] [PMC free article] [PubMed] [Google Scholar]
- 17.Xiao B, Yuan Q. Nanoporous metal organic framework materials for hydrogen storage. Particuology. 2009;7:129–140. doi: 10.1016/j.partic.2009.01.006. [DOI] [Google Scholar]
- 18.Langmi HW, Ren J, North B, Mathe M, Bessarabov D. Hydrogen storage in metal-organic frameworks: A review. Electrochim. Acta. 2014;128:368–392. doi: 10.1016/j.electacta.2013.10.190. [DOI] [Google Scholar]
- 19.Karmakar A, Desai AV, Ghosh SK. Ionic metal-organic frameworks (iMOFs): Design principles and applications. Coord. Chem. Rev. 2016;307:313–341. doi: 10.1016/j.ccr.2015.08.007. [DOI] [Google Scholar]
- 20.Kumar P, Deep A, Kim K-H. Metal organic frameworks for sensing applications. TrAC Trends Anal. Chem. 2015;73:39–53. doi: 10.1016/j.trac.2015.04.009. [DOI] [Google Scholar]
- 21.Li B, Chrzanowski M, Zhang Y, Ma S. Applications of metal-organic frameworks featuring multi-functional sites. Coord. Chem. Rev. 2016;307:106–129. doi: 10.1016/j.ccr.2015.05.005. [DOI] [Google Scholar]
- 22.Li W, Zhang Y, Li Q, Zhang G. Metal−organic framework composite membranes: Synthesis and separation applications. Chem. Eng. Sci. 2015;135:232–257. doi: 10.1016/j.ces.2015.04.011. [DOI] [Google Scholar]
- 23.Venna SR, Carreon MA. Metal organic framework membranes for carbon dioxide separation. Chem. Eng. Sci. 2015;124:3–19. doi: 10.1016/j.ces.2014.10.007. [DOI] [Google Scholar]
- 24.Wang L, et al. Metal–organic frameworks for energy storage: Batteries and supercapacitors. Coord. Chem. Rev. 2016;307:361–381. doi: 10.1016/j.ccr.2015.09.002. [DOI] [Google Scholar]
- 25.Tran TV, et al. A five coordination Cu(II) cluster-based MOF and its application in the synthesis of pharmaceuticals: Via sp3 C-H/N-H oxidative coupling. Catal. Sci. Technol. 2017;7:3453–3458. doi: 10.1039/C7CY00882A. [DOI] [Google Scholar]
- 26.Khan NA, Hasan Z, Jhung SH. Adsorptive removal of hazardous materials using metal-organic frameworks (MOFs): A review. J. Hazard. Mater. 2013;244–245:444–456. doi: 10.1016/j.jhazmat.2012.11.011. [DOI] [PubMed] [Google Scholar]
- 27.Hasan Z, Jhung SH. Removal of hazardous organics from water using metal-organic frameworks (MOFs): Plausible mechanisms for selective adsorptions. J. Hazard. Mater. 2015;283:329–339. doi: 10.1016/j.jhazmat.2014.09.046. [DOI] [PubMed] [Google Scholar]
- 28.Shahvelayati AS, Sheshmani S, Siminghad M. Preparation and characterization of SnO nanoflowers with controllable thicknesses using imidazolium-based ionic liquids as green media: Visible light photocatalytic degradation of Acid Blue 19. Mater. Chem. Phys. 2022;278:125442. doi: 10.1016/j.matchemphys.2021.125442. [DOI] [Google Scholar]
- 29.Siminghad M, Sheshmani S, Shahvelayati AS. Application, optimisation and kinetic studies of SnO micro-square in photoinduced decolourisation of Acid Orange 7 and Acid Orange 10 under visible light irradiation. Int. J. Environ. Anal. Chem. 2021;101:473–481. doi: 10.1080/03067319.2019.1668931. [DOI] [Google Scholar]
- 30.Lucero JM, Self TJ, Carreon MA. Synthesis of ZIF-11 crystals by microwave heating. New J. Chem. 2020;44:3562–3565. doi: 10.1039/C9NJ04589A. [DOI] [Google Scholar]
- 31.Park KS, et al. Exceptional chemical and thermal stability of zeolitic imidazolate frameworks. Proc. Natl. Acad. Sci. 2006;103:10186–10191. doi: 10.1073/pnas.0602439103. [DOI] [PMC free article] [PubMed] [Google Scholar]
- 32.Zhang HW, Zhu QQ, Yuan R, He H. Crystal engineering of MOF@COF core–shell composites for ultra-sensitively electrochemical detection. Sensors Actuators B Chem. 2021;329:129144. doi: 10.1016/j.snb.2020.129144. [DOI] [Google Scholar]
- 33.Han ZY, Zhang H, Li HK, Zhu QQ, He H. Ingenious construction of an electrochemical aptasensor based on a Au@COF/GO-NH2composite with excellent detection performance. J. Mater. Chem. C. 2021;9:4576–4582. doi: 10.1039/D1TC00319D. [DOI] [Google Scholar]
- 34.Nguyen DTC, et al. Multifunctional ZnO nanoparticles bio-fabricated from Canna indica L. flowers for seed germination, adsorption, and photocatalytic degradation of organic dyes. J. Hazard. Mater. 2021;420:126586. doi: 10.1016/j.jhazmat.2021.126586. [DOI] [PubMed] [Google Scholar]
- 35.Tran TV, et al. Recyclable Fe3O4@C nanocomposite as potential adsorbent for a wide range of organic dyes and simulated hospital effluents. Environ. Technol. Innov. 2020;20:101122. doi: 10.1016/j.eti.2020.101122. [DOI] [Google Scholar]
- 36.Anbia M, Hariri SA. Removal of methylene blue from aqueous solution using nanoporous SBA-3. Desalination. 2010;261:61–66. doi: 10.1016/j.desal.2010.05.030. [DOI] [Google Scholar]
- 37.Mahmoodi NM, Abdi J, Najafi F. Gemini polymeric nanoarchitecture as a novel adsorbent: Synthesis and dye removal from multicomponent system. J. Colloid Interface Sci. 2013;400:88–96. doi: 10.1016/j.jcis.2013.03.014. [DOI] [PubMed] [Google Scholar]
- 38.Langmuir I. The adsorption of gases on plane surfaces of glass, mica and platinum. J. Am. Chem. Soc. 1918;40:1361–1403. doi: 10.1021/ja02242a004. [DOI] [Google Scholar]
- 39.El Fargani H, et al. Removal of anionic dyes by silica-chitosan composite in single and binary systems: Valorization of shrimp co-product ‘Crangon-Crangon’ and ‘Pandalus Borealis’. J. Mater. Environ. Sci. 2017;8:724–739. [Google Scholar]
- 40.Venkata Mohan S, Sailaja P, Srimurali M, Karthikeyan J. Color removal of monoazo acid dye from aqueous solution by adsorption and chemical coagulation. Environ. Eng. Policy. 1998;1:149–154. doi: 10.1007/s100220050016. [DOI] [Google Scholar]
- 41.Xing T, Kai H, Chen G. Study of adsorption and desorption performance of acid dyes on anion exchange membrane. Color. Technol. 2012;128:295–299. doi: 10.1111/j.1478-4408.2012.00378.x. [DOI] [Google Scholar]
- 42.DarvishiCheshmehSoltani R, Khataee AR, Safari M, Joo SW. Preparation of bio-silica/chitosan nanocomposite for adsorption of a textile dye in aqueous solutions. Int. Biodeterior. Biodegrad. 2013;85:383–391. doi: 10.1016/j.ibiod.2013.09.004. [DOI] [Google Scholar]
- 43.Konicki W, Pełech I, Mijowska E, Jasińska I. Adsorption kinetics of acid dye acid red 88 onto magnetic multi-walled carbon nanotubes-Fe 3 C nanocomposite. Clean: Soil, Air, Water. 2014;42:284–294. [Google Scholar]
- 44.Gupta VK, Mittal A, Gajbe V, Mittal J. Adsorption of basic fuchsin using waste materials—Bottom ash and deoiled soya—As adsorbents. J. Colloid Interface Sci. 2008;319:30–39. doi: 10.1016/j.jcis.2007.09.091. [DOI] [PubMed] [Google Scholar]
- 45.Suresh S, Sugumar RW, Maiyalagan T. A low cost adsorbent prepared from Curcuma angustifolia scales for removal of Basic violet 14 from aqueous solution. Indian J. Chem. Technol. 2014;21:368–378. [Google Scholar]
- 46.Suresh S. Removal of Basic Violet 14 from aqueous solution using sulphuric acid activated materials. Springerplus. 2016;5:633. doi: 10.1186/s40064-016-2294-2. [DOI] [PMC free article] [PubMed] [Google Scholar]
- 47.Thanh Tu NT, et al. Adsorptive removal of Congo red from aqueous solution using zeolitic imidazolate framework-67. J. Environ. Chem. Eng. 2018;6:2269–2280. doi: 10.1016/j.jece.2018.03.031. [DOI] [Google Scholar]
- 48.Chatterjee S, Lee DS, Lee MW, Woo SH. Enhanced adsorption of congo red from aqueous solutions by chitosan hydrogel beads impregnated with cetyl trimethyl ammonium bromide. Bioresour. Technol. 2009;100:2803–2809. doi: 10.1016/j.biortech.2008.12.035. [DOI] [PubMed] [Google Scholar]
- 49.Tran TV, et al. Microwave-assisted solvothermal fabrication of hybrid zeolitic–imidazolate framework (ZIF-8) for optimizing dyes adsorption efficiency using response surface methodology. J. Environ. Chem. Eng. 2020;8:104189. doi: 10.1016/j.jece.2020.104189. [DOI] [Google Scholar]
- 50.Lafi R, Montasser I, Hafiane A. Adsorption of congo red dye from aqueous solutions by prepared activated carbon with oxygen-containing functional groups and its regeneration. Adsorpt. Sci. Technol. 2019;37:160–181. doi: 10.1177/0263617418819227. [DOI] [Google Scholar]
- 51.Saha A, Basak BB, Ponnuchamy M. Performance of activated carbon derived from Cymbopogon winterianus distillation waste for scavenging of aqueous toxic anionic dye Congo red: Comparison with commercial activated carbon. Sep. Sci. Technol. 2020;55:1970–1983. doi: 10.1080/01496395.2019.1620277. [DOI] [Google Scholar]
- 52.Chu H, Chen K. Reuse of activated sludge biomass: I. Removal of basic dyes from wastewater by biomass. Process Biochem. 2002;37:595–600. doi: 10.1016/S0032-9592(01)00234-5. [DOI] [Google Scholar]
- 53.Aksu Z. Application of biosorption for the removal of organic pollutants: A review. Process Biochem. 2005;40:997–1026. doi: 10.1016/j.procbio.2004.04.008. [DOI] [Google Scholar]
- 54.Maji SK, Wang S-W, Liu C-W. Arsenate removal from aqueous media on iron-oxide-coated natural rock (IOCNR): A comprehensive batch study. Desalin. Water Treat. 2013;51:7775–7790. doi: 10.1080/19443994.2013.794551. [DOI] [Google Scholar]
- 55.Ho Y, McKay G. Pseudo-second order model for sorption processes. Process Biochem. 1999;34:451–465. doi: 10.1016/S0032-9592(98)00112-5. [DOI] [Google Scholar]
- 56.Nemr AE. Potential of pomegranate husk carbon for Cr(VI) removal from wastewater: Kinetic and isotherm studies. J. Hazard. Mater. 2009;161:132–141. doi: 10.1016/j.jhazmat.2008.03.093. [DOI] [PubMed] [Google Scholar]
- 57.Ghaedi M, et al. Random forest model for removal of bromophenol blue using activated carbon obtained from Astragalus bisulcatus tree. J. Ind. Eng. Chem. 2014;20:1793–1803. doi: 10.1016/j.jiec.2013.08.033. [DOI] [Google Scholar]
- 58.Ganjali M, et al. Novel method for the fast separation and purification of molybdenum(VI) from fission products of uranium with aminofunctionalized mesoporous molecular sieves (AMMS) modified by dicyclohexyl-18-crown-6 and S-N tetradentate schiff’s base. Anal. Lett. 2005;38:1813–1821. doi: 10.1080/00032710500210626. [DOI] [Google Scholar]
- 59.Fu J, et al. Selective adsorption and separation of organic dyes from aqueous solution on polydopamine microspheres. J. Colloid Interface Sci. 2016;461:292–304. doi: 10.1016/j.jcis.2015.09.017. [DOI] [PubMed] [Google Scholar]
Associated Data
This section collects any data citations, data availability statements, or supplementary materials included in this article.
Supplementary Materials
Data Availability Statement
All data generated or analyzed during this study are included in this published article and its supplementary information files (Supplementary files 1–6). Requests for material and additional data should be made to the corresponding authors.


