Abstract
A quantitative competitive PCR (QC-PCR) assay was developed to detect and quantify Escherichia coli O157:H7 cells. From 103 to 108 CFU of E. coli O157:H7 cells/ml was quantified in broth or skim milk, and cell densities predicted by QC-PCR were highly related to viable cell counts (r2 = 0.99 and 0.93, respectively). QC-PCR has potential for quantitative detection of pathogenic bacteria in foods.
Escherichia coli O157:H7 has been responsible for numerous food-borne illness outbreaks with a variety of foods, including dairy products such as raw milk (A. A. Borczyk, M. A. Karmali, H. Liori, and L. M. Duncan, Letter, Lancet 1:98, 1987; Centers for Disease Control and Prevention, personal communication) and pasteurized milk (P. Upton and J. E. Coia, Letter, Lancet 344:1015, 1994). One of the distinctive virulence factors of E. coli O157:H7 is the production of Shiga-like toxins, which cause symptoms of hemorrhagic colitis and hemolytic uremic syndrome (16). E. coli O157:H7 may produce Shiga-like toxin I (SLT-I) or SLT-II, or both. SLT-II is known to be more toxic for human renal endothelial cells (13) and mice than SLT-I (17). PCR-based detection assays for E. coli O157:H7 provide rapid, sensitive, and specific alternatives to traditional procedures, but they do not provide information on cell density in the suspect foods (12). Quantitative detection of target genes is not feasible by conventional PCR because PCR amplifies the target gene exponentially. Thus, small variations in amplification efficiency lead to dramatic changes in product yields of different DNA targets; further, the amount of product generates plateaus during later stages of the reaction because of consumption of necessary components or the presence of inhibitors (14, 18). These problems can be circumvented by quantitative competitive PCR (QC-PCR).
QC-PCR has been used to detect and determine bacterium numbers for a variety of difficult-to-culture bacteria (3, 11, 15). The method is based on the coamplification of the sequence to be quantified (the target sequence) with a known amount of another sequence (the competitor) which resembles the target. Both sequences amplify with the same primers. These two sequences should ideally be from the same region of DNA in order for the primers to amplify each with equal efficiency but should differ slightly in size to be distinguished by agarose gel electrophoresis. For QC-PCR, a dilution series of three to five PCR reaction mixtures are made, each with a constant (unknown) amount of added target DNA and a known dilution series of competitor DNA. The target and competitor DNA compete for the same primers; when the concentration of each is equivalent, band intensities will be equivalent. The point of equivalence is determined by visual assessment of band intensities or by digital analysis of the gel image and generation of a regression line (10). Quantitation of the gene copy number can be converted to chromosomal equivalents and cell numbers. The objectives of this study were to determine if QC-PCR could be applied to foods and to develop a quantitative PCR assay for detection and enumeration of E. coli O157:H7 cells in broth and skim milk.
Bacterial strains, culture media, and growth conditions.
E. coli O157:H7 strain ATCC 439895 was used. Cells were grown at 37°C in Trypticase soy broth (TSB) (Difco, Detroit, Mich.). Cells were enumerated by pour plate counts of TSB with violet red bile (Difco) overlay incubated at 32°C for 24 h. Prior to the use of pasteurized skim milk in assays, plate counts of TSB with violet red file overlays were conducted with the milk to confirm that it was free of coliforms. Cells were concentrated from broth or milk, and DNA was extracted using the method described by McKillip et al. (7).
Construction of the competitor sequence by composite primer PCR.
A 401-bp fragment of the slt2 A subunit was chosen as the target DNA from the published sequence of slt2 (8). The target was amplified using a 19-bp forward primer (TXAF: TTAAATGGGT ACTGTGCCT) and a 21-bp reverse primer (TXAR: CAGAGTGGTA TAACTGCTGT C), which correspond to bases 180 to 198 and 560 to 580 of the slt2 gene, respectively (Life Technologies, Gaithersburg, Md.). Primers were tested for specificity by using a BLAST sequence alignment. Primers were further confirmed for specificity by PCR of extracted DNA from selected gram-negative (10 containing slt2; 15 without slt2) and gram-positive (10) bacteria. The competitor DNA for QC-PCR was constructed from the 401-bp target sequence by composite primer PCR. A 37-bp composite primer (TXAFI: TTAAATGGGT ACTGTGCCTT CAGGGGACCA CATCGGT) (Life Technologies) was constructed to yield a deleted 275-bp competitor from the slt target DNA as described by Jin et al. (4). Ready Mix REDTaq (Sigma, St. Louis, Mo.), 1 μM each primer (Life Technologies), approximately 0.3 μg of E. coli O157:H7 ATCC 43895 genomic DNA, and nuclease-free water (Life Technologies) were added to a final volume of 50 μl for each reaction mixture. PCR was conducted with a Mastercycler gradient thermal cycler (Eppendorf Scientific, Westbury, N.Y.). A hot start protocol was followed by 1 min at 94°C and 42 cycles of 1 min at 94°C, 1.5 min at 54°C, and 2 min at 72°C, followed by a 7-min extension at 72°C and a final 4°C hold. PCR products were separated by gel electrophoresis, the competitor DNA fragment of 275 bp was excised from the gel, and DNA was extracted using the Concert rapid gel extraction system (Life Technologies). The concentration of the competitor was measured by absorbance at 260 nm on a UV-1201 spectrophotometer (Shimadzu, Kyoto, Japan).
QC-PCR.
Equal volumes (7.5 μl) of target DNA and diluted competitor DNA were used in each QC-PCR reaction mixture. In order to quantify an unknown DNA sample, five or six PCR reactions were conducted in each QC-PCR series. Each QC-PCR reaction mixture contained 25 μl of ReadyMix REDTaq (Sigma), 0.5 μl of Taq DNA polymerase (Sigma; 5 U/μl), 1.5 μl of MgCl2 (Life Technologies; 50 mM), 1.5 μl of each primer (Life Technologies; 0.1 mM), and 1 μl of dimethyl sulfoxide (Aldrich, Milwaukee, Wis.). Nuclease-free water (Sigma) was added to bring the final volume to 50 μl. PCR cycling conditions were the same as for preparation of the competitor DNA (described above). PCR products were separated by gel electrophoresis, and the image was digitally recorded and analyzed using SigmaGel (Jandel Scientific Software, Chicago, Ill.). To correct for differences in the fluorescence of ethidium bromide-stained PCR fragments of different sizes, the intensity of the competitor was multiplied by the ratio of the size of the target sequence (401 bp) to the size of the competitor sequence (275 bp) (9). For determination of target copy numbers, the log10 of the ratio of the fluorescence intensities of the competitor band and the target band was plotted as a function of the log10 of the concentration of competitor molecules added. Interpolation of the regression equation for a y value of 0 (log10 1 = 0) gives the concentration of the target template in the sample (2, 9).
Quantitative aspect of QC-PCR.
To confirm that the developed QC-PCR assay could be applied quantitatively, DNA was extracted from an overnight culture (∼109 CFU/ml by viable plate counts) and diluted 100- and 200-fold, resulting in DNA samples I and II, respectively. Constant amounts of DNA from each sample were coamplified with corresponding sets of serially diluted competitor DNA in QC-PCR. The DNA concentration in each sample was determined and compared to determine if the results predicted by QC-PCR were equivalent to the actual twofold difference in DNA concentration.
Determination of cell densities in broth and artificially contaminated skim milk.
An overnight culture (109 CFU/ml) was diluted to 105 CFU/ml, and one loop was inoculated into 7 ml of fresh TSB. Three tubes were sampled at 4, 5, 6, 6.5, 7, 7.5, 8, and 9 h postinoculation. Plate counts and DNA extraction followed by QC-PCR were conducted for equivalent time points. For skim milk, methods were identical except that three tubes were sampled at 4.5, 6, 7.5, 8, and 9 h postinoculation, 1 ml of cell suspension at each time point was inoculated into 9 ml of skim milk, and then plate counts or DNA extraction was initiated. Cell densities from plate counts and QC-PCR were compared. All tests were replicated three times. Correlation analysis and regression analysis were conducted to determine the ability of QC-PCR to predict viable plate counts (SAS statistical analysis system, version 7.12; SAS, Cary, N.C.).
Sensitivity and quantitative ability of QC-PCR in broth and skim milk.
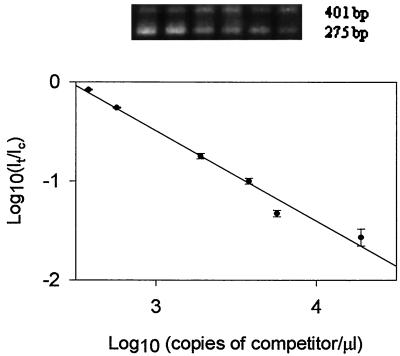
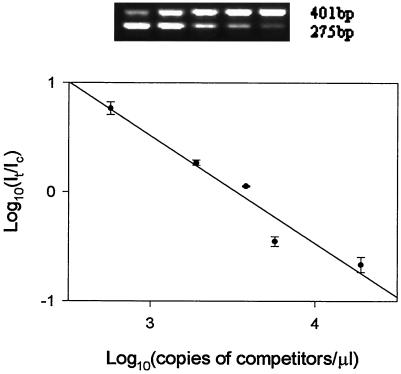
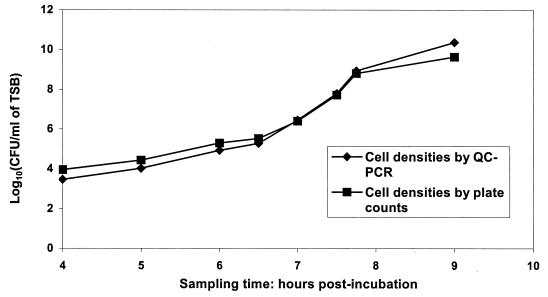
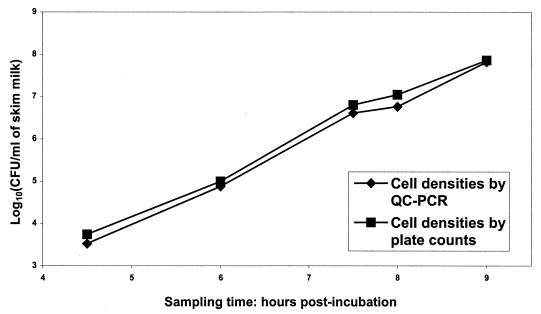
The DNA concentrations determined by QC-PCR were 2.31 × 10⁷ copies/μl and 1.19 × 10⁷ copies/μl for samples I and II, respectively, giving a 1.935-fold difference. This result was very close to the actual value of 2.0-fold. Consequently, QC-PCR can be used to accurately quantitate the slt2 gene. Regression analysis of QC-PCR is shown in Fig. 1 and 2. By QC-PCR, we detected and accurately quantified 103 through 108 CFU of E. coli O157:H7 cells/ml in TSB (Table 1). Regression analysis of predicted CFU from QC-PCR from broth and actual viable CFU from plate counts yielded a straight line with r2 = 0.99 (data not shown), indicating that cell densities in broth determined by QC-PCR and plate counts were highly related. Cell densities predicted by QC-PCR were higher than those by plate counts from stationary phase cells and were lower than those from viable plate counts below 106 CFU/ml (Table 1 and Fig. 3). By using QC-PCR, we detected and accurately quantified 103 through 108 CFU of E. coli O157:H7 cells/ml in skim milk (Table 2). Regression analysis of predicted CFU from QC-PCR and actual viable CFU from plate counts yielded a straight line with r2 = 0.93 (data not shown), indicating that cell densities in skim milk determined by QC-PCR and plate counts were highly related. Cell densities quantified by QC-PCR were consistently lower than those by plate counts (Fig. 4).
FIG. 1.
QC-PCR from 8.86 × 10³ CFU of E. coli O157:H7 cells/ml (as determined by viable plate counts) in TSB. Extracted DNA was coamplified with serially diluted competitors (1.9 × 10⁴, 5.7 × 10³, 3.8 × 10³, 1.9 × 10³, 5.7 × 10², and 3.8 × 10² copies/μl); the ratio of the intensities of the target to the competitor was plotted against the concentration of the competitor on a log scale. Each point on the plot was the mean (± the standard deviation) of three replicate samples.
FIG. 2.
QC-PCR from 5.5 × 10³ CFU of E. coli O157:H7 cells/ml in skim milk. Extracted DNA was coamplified with serially diluted competitors (1.9 × 10⁴, 5.7 × 10³, 3.8 × 10³, 1.9 × 10³, and 5.7 × 10² copies/μl); the ratio of the intensities of the target to the competitor was plotted against the concentration of the competitor on a log scale. Each point on the plot was the mean (± the standard deviation) of three replicate samples.
TABLE 1.
Correlation of cell densities in TSB by plate counts and QC-PCR
| Sampling time (h post-incubation) | CFU/ml quantified by:
|
Regression equations from QC-PCR and r2
|
||
|---|---|---|---|---|
| Plate countsa | QC-PCR | Equation | r2 | |
| 4 | (8.86 ± 0.68) × 103 | 2.89 × 10³ | Y = −0.91X + 2.24 | 0.98 |
| 5 | (2.70 ± 0.56) × 104 | 1.05 × 10⁴ | Y = −0.97X + 2.94 | 0.97 |
| 6 | (1.95 ± 0.12) × 105 | 8.33 × 10⁴ | Y = −0.96X + 3.77 | 0.95 |
| 6.5 | (3.33 ± 0.38) × 105 | 1.88 × 10⁵ | Y = −1.07X + 4.57 | 0.99 |
| 7 | (2.50 ± 0.28) × 106 | 2.80 × 10⁶ | Y = −1.03X + 5.62 | 0.95 |
| 7.5 | (5.21 ± 0.31) × 107 | 6.13 × 10⁷ | Y = −0.97X + 6.57 | 0.96 |
| 8 | (6.40 ± 0.75) × 108 | 8.60 × 10⁸ | Y = −1.03X + 8.18 | 0.95 |
| 9 | (4.30 ± 0.44) × 109 | 2.31 × 10¹⁰ | Y = −1.08X + 7.97b | 0.96 |
Mean plate counts (± standard deviation) of three replicate samples.
DNA was diluted 100-fold before QC-PCR.
FIG. 3.
Comparison of cell densities in TSB by plate counts and QC-PCR. Data points for viable plate counts represent the mean of three replicates. QC-PCR-predicted cell densities were calculated by regression analysis of QC-PCR from triplicate replicates.
TABLE 2.
Correlation of cell densities in skim milk by plate counts and QC-PCR
| Sampling time (h post-incubation) | CFU/ml quantified by:
|
Regression equations of QC-PCR and r2
|
||
|---|---|---|---|---|
| Plate countsa | QC-PCR | Equation | r2 | |
| 4.5 | (5.50 ± 0.31) × 103 | 3.34 × 10³ | Y = −0.98X + 3.47 | 0.95 |
| 6 | (9.87 ± 0.65) × 104 | 7.50 × 10⁴ | Y = −1.10X + 5.41 | 0.92 |
| 7.5 | (6.30 ± 0.56) × 106 | 4.04 × 10⁶ | Y = −0.98X + 6.45 | 0.94 |
| 8 | (1.10 ± 0.06) × 107 | 7.95 × 10⁶ | Y = −0.96X + 6.65 | 0.99 |
| 9 | (7.20 ± 0.53) × 107 | 6.50 × 10⁷ | Y = −1.06X + 8.30 | 0.97 |
Mean plate counts (± standard deviation) of three replicate samples.
FIG. 4.
Comparison of cell densities in skim milk by plate counts and QC-PCR. Data points for viable plate counts represent the mean of three replicates. QC-PCR-predicted cell densities were calculated by regression analysis of QC-PCR from triplicate replicates.
PCR can be used theoretically to detect one copy of target sequence. However, the minimum copies of target DNA quantified by QC-PCR are increased because the target and the competitor compete for amplification reagents similar to multiplex PCR (10). It is well known that residual food components can inhibit PCR enzymatic reactions (1, 18). Inhibition by matrix components was reported when QC-PCR was conducted with rumen fluid or soil (3, 11). McKillip et al. (7) studied DNA extraction efficiency from dairy foods and reported that food and type of food significantly affected extraction efficiency. In general, as matrix complexity increases, DNA extraction efficiency decreases. From broth at low cell densities, the number of bacteria predicted by QC-PCR was lower than actual viable cell counts. This lower predicted number is presumably due to a decrease in DNA extraction efficiency which occurs at low cell numbers. At higher cell densities, the number of bacteria predicted by QC-PCR was higher than the number obtained from viable cell counts. In stationary phase, dead cells accumulate. QC-PCR is based on target DNA copies, and DNA from dead cells was presumably responsible for the higher predicted bacterial numbers. Reverse transcriptase PCR (RT-PCR), which amplifies RNA instead of DNA, has been proposed as an alternative for detection of viable cells. However, 16S rRNA is not an indicator of cell viability (5, 6), which necessitates the use of mRNA as a target in RT-PCR. mRNA is unstable and consequently difficult to extract from food matrices. RT inhibitors and the issue of a suitable mRNA target that is abundant, constitutive, and specific all pose significant challenges to the application of RT-PCR of mRNA to foods. Since PCR will amplify DNA from dead cells, QC-PCR cannot measure target cell viability. However, QC-PCR applied at two points during an enrichment may provide an indicator of target cell viability. This topic is an area of ongoing research in our laboratory.
Acknowledgments
Funding was provided by the USDA NRI (award 99035201-8125) and the Scientific Research Initiative of the Mississippi Agriculture and Forestry Experiment Station (MAFES).
REFERENCES
- 1.Bickley J, Short J K, McDowell D G, Parkes H C. Polymerase chain reaction (PCR) detection of Listeria monocytogenes in diluted milk and reversal of PCR inhibition caused by calcium ions. Lett Appl Microbiol. 1996;22:153–158. doi: 10.1111/j.1472-765x.1996.tb01131.x. [DOI] [PubMed] [Google Scholar]
- 2.Connolly A R, Cleland L G, Kirkham B W. Mathematical considerations of competitive polymerase chain reaction. J Immunol Meth. 1995;187:201–211. doi: 10.1016/0022-1759(95)00185-2. [DOI] [PubMed] [Google Scholar]
- 3.Elsas J D V, Rosado A S, Wolters A C, Moore E, Karison U. Quantitative detection of Sphingomonas chlorophenolica in soil via competitive polymerase chain reaction. J Appl Microbiol. 1998;85:463–471. doi: 10.1046/j.1365-2672.1998.853509.x. [DOI] [PubMed] [Google Scholar]
- 4.Jin C F, Mata M, Fink D J. Rapid construction of deleted DNA fragments for use as internal standards in competitive PCR. PCR Methods Appl. 1994;3:252–225. doi: 10.1101/gr.3.4.252. [DOI] [PubMed] [Google Scholar]
- 5.McKillip J L, Jaykus L A, Drake M. rRNA stability in heat-killed and UV-irradiated enterohemorrhagic Staphylococcus aureus and Escherichia coli O157:H7. Appl Environ Microbiol. 1998;64:4264–4268. doi: 10.1128/aem.64.11.4264-4268.1998. [DOI] [PMC free article] [PubMed] [Google Scholar]
- 6.McKillip J L, Jaykus L A, Drake M A. Nucleic acid persistence in heat-killed Escherichia coli O157:H7 from contaminated skim milk. J Food Prot. 1999;62:839–844. doi: 10.4315/0362-028x-62.8.839. [DOI] [PubMed] [Google Scholar]
- 7.McKillip J L, Jaykus L A, Drake M A. A comparison of methods for the detection of Escherichia coli O157:H7 from artificially-contaminated dairy products using PCR. J Appl Microbiol. 2000;88:49–55. doi: 10.1046/j.1365-2672.2000.01079.x. [DOI] [PubMed] [Google Scholar]
- 8.Meyer T, Karch H, Hacker J, Bocklage H, Heesemann J. Cloning and sequencing of a Shiga-like toxin II-related gene from Escherichia coli O157:H7 strain 7279. Zentbl Bakteriol. 1992;276:176–188. doi: 10.1016/s0934-8840(11)80004-6. [DOI] [PubMed] [Google Scholar]
- 9.Piatak M, Luk K C, Williams B, Lifson J D. Quantitative competitive polymerase chain reaction for accurate quantitation of HIV DNA and RNA species. BioTechniques. 1993;14:70–80. [PubMed] [Google Scholar]
- 10.Raeymaekers L. Quantitative PCR: theoretical considerations with practical implications. Anal Biochem. 1993;214:582–585. doi: 10.1006/abio.1993.1542. [DOI] [PubMed] [Google Scholar]
- 11.Reilly K, Attwood G T. Detection of Clostridium proteoclasticum and closely related strains in the rumen by competitive PCR. Appl Environ Microbiol. 1998;64:907–913. doi: 10.1128/aem.64.3.907-913.1998. [DOI] [PMC free article] [PubMed] [Google Scholar]
- 12.Scheu P M, Berghof K, Stahl U. Detection of pathogenic and spoilage micro-organisms in food with the polymerase chain reaction. Food Microbiol. 1998;15:13–31. [Google Scholar]
- 13.Scotland S M, Willshaw G A, Smith H R, Rowe B. Properties of strains of Escherichia coli belonging to serogroup O157 with special reference to production of Vero cytotoxins VT1 and VT2. Epidemiol Infect. 1987;99:613–624. doi: 10.1017/s0950268800066462. [DOI] [PMC free article] [PubMed] [Google Scholar]
- 14.Siebert P D, Larrick J W. Competitive PCR. Nature. 1992;359:557–558. doi: 10.1038/359557a0. [DOI] [PubMed] [Google Scholar]
- 15.Sidhu H, Holmes R P, Allison M J, Peck A B. Direct quantification of the enteric bacterium Oxalobacter formigenes in human fecal samples by quantitative competitive-template PCR. J Clin Microbiol. 1999;37:1503–1509. doi: 10.1128/jcm.37.5.1503-1509.1999. [DOI] [PMC free article] [PubMed] [Google Scholar]
- 16.Sungsu P, Worobo R, Richard A D. Escherichia coli O157:H7 as an emerging foodborne pathogen: a literature review. Crit Rev Food Sci Nutr. 1999;39:481–502. doi: 10.1080/10408699991279259. [DOI] [PubMed] [Google Scholar]
- 17.Wadolkowski E A, Sung L M, Buris J A, Samuel J E, O'Brien A D. Acute renal tubular necrosis and death of mice orally infected with Escherichia coli strains that produce Shiga-like toxin type II. Infect Immun. 1990;58:3959–3965. doi: 10.1128/iai.58.12.3959-3965.1990. [DOI] [PMC free article] [PubMed] [Google Scholar]
- 18.Wilson I G. Inhibition and facilitation of nucleic acid amplification. Appl Environ Microbiol. 1997;63:3741–3751. doi: 10.1128/aem.63.10.3741-3751.1997. [DOI] [PMC free article] [PubMed] [Google Scholar]


