

Abstract
Background: For prediction of many types of clinical outcome, the skeletal muscle mass can be used as an independent biomarker. Manual segmentation of the skeletal muscles is time-consuming, therefore we present a deep-learning-based approach for the identification of muscle mass at the L3 level in clinical routine computed tomographic (CT) data.
Patients and Methods: We conducted a retrospective study of 130 patient datasets. Individual CT slice analysis at the L3 level was fed into a U-Net architecture. As a result, we obtained segmentations of the musculus rectus abdominis, abdominal wall muscles, musculus psoas major, musculus quadratus lumborum and musculus erector spinae in the CT-slice at the L3 level.
Results: The Dice score was 0.95±0.02, 0.86±0.12, 0.93±0.05, 0.92±0.05, 0.86±0.08 for the erector spine, rectus, abdominal wall, psoas and quadratus lumborum muscles, respectively. For the overall skeletal muscle mass, the test data achieved a Dice score of 0.95±0.03.
Conclusion: Our network achieved Dice scores larger than 0.86 for each of the five different muscle types and 0.95 for the overall skeletal muscle mass. The subdivision of muscle types can serve as a basis for obtaining future biomarkers. Our network is publicly available so that it might be beneficial for others to improve the clinical workflow within examination of routine CT scans.
Keywords: Skeletal muscle mass, deep-learning segmentation, sarcopenia
Low skeletal muscle mass (LSMM) on sectional images such as computer tomographic (CT) scans is a well-established independent biomarker in several studies (1-8). LSMM predicts clinically relevant outcomes in different oncological diseases. For instance, in gastric cancer, LSMM was a predictor for worse overall survival (hazard ratio=2.12, 95% confidence interval=1.89-2.38; p<0.001) (2). Furthermore, in patients with esophageal cancer who underwent curative resection, LSMM was associated with poor overall (hazard ratio=1.5, 95% confidence interval=1.35-1.85; p<0.001) and disease-free (HR=1.46, 95% confidence interval=1.12-1.90]; p=0.005) survival (1). Similar results have been shown for other malignancies, such as lung cancer, head and neck carcinoma, prostatic cancer, and malignant hematological diseases (3-6).
In Intensive Care Unit patients, LSMM was shown to predict in-hospital mortality (7). In patients with COVID-19, LSMM was found to be a predictor for short-term mortality (8). Finally, LSMM predicted worse prognosis in patients with other conditions such as transcatheter aortic valve implantation, chronic obstructive pulmonary disease, appendicitis, and colonic diverticulitis (9-11).
Usually, for the measurement of the skeletal musculature, one axial CT slide at the third lumbar vertebra (L3) is used to quantify the muscle area of paraspinal, abdominal wall and psoas muscles. The skeletal muscle index is calculated by dividing the muscle mass by the body height. Although this approach is performed most frequently semi-automatically, it is a time-consuming procedure. Therefore, there is a great need for a fully automatic analysis of the skeletal musculature.
The aim of the present study was to develop a fully automatic software based on deep learning for estimation of skeletal muscle area and mass at the L3 level on CT scans.
Patients and Methods
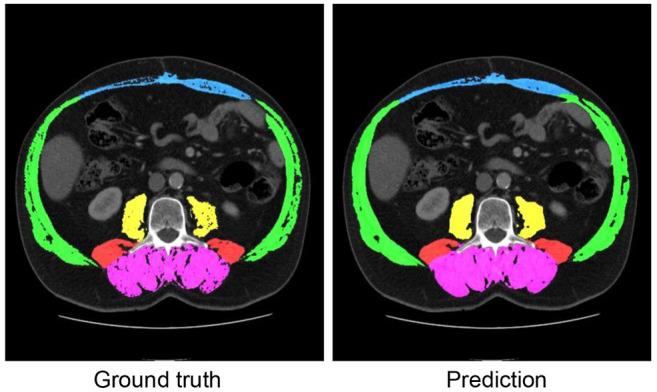
Dataset. For the retrospective data analysis, the data set was derived from our archiving system database. We used 130 consecutively performed imaging studies from patients undergoing CT scans without filtering for any factors such as diagnosis, artifacts or contrast agent phases. We chose this path since it was our objective to build a robust and universal software approach. More precisely, we chose series with 5-mm axial slice thickness and a soft-tissue kernel. Subsequently, segmentation was performed on three adjacent slices at the height of the L3. A dataset consisted of a CT volume with a resolution of 5123 voxels, with manual segmentation of the muscles around the L3 vertebra (three slices). The segmentation of the muscles was divided into five muscle groups: Musculus rectus abdominis, abdominal wall muscles, musculus psoas major, musculus quadratus lumborum and musculus erector spinae (see Figure 1).
Figure 1. Example of a patient’s L3 slice with manually segmented data (Ground truth) and predicted classes by the network (Prediction) that achieved high Dice scores, i.e., where the segmentation works very well. Magenta denotes the musculus erector spinae, blue denotes musculus rectus abdominis, green denotes the abdominal wall muscles, yellow denotes the musculus psoas major, and red denotes the musculus quadratus lumborum.
Network model. We present a U-Net-based neural network for fully automatic segmentation of skeletal muscle area based on 130 patient datasets. A depth of 4 was chosen for the network, with feature maps duplicated at each level in the network i.e., 32, 64, 128, and 256. As a result, the network has 12.9 million learnable parameters. Each down-evaluation block consists of two repetitions of convolution, batch normalization and a Relu activation function (12).
At the end of each downvaluation block, a pooling of the maximum values takes place. The blocks of the upvaluation path follow the same structure. Each block starts with the combination of the feature maps of the previous upvaluation block and the corresponding downvaluation block, followed by an upsampling. This is followed by two repetitions of convolution, batch normalization and a Relu activation function. Since the network segments multiple classes, the activation function in the output layer of the network is a softmax activation function.
For training the network, the Dice Loss was chosen as the loss function with the Adam weight decay (AdamW) (13) optimizer and a learning rate of 1e−2 to allow the network to converge quickly. However, since the learning rate is too high in the later training process, it is dynamically reduced when the accuracy no longer changes.
To further improve the accuracy, the predictions of the network were adjusted by thresholding, where values that were not in the range of the Hounsfield units for muscles were removed from the predictions. This can be done since it is known that values for muscles can only lie in the range of between −20 and 200 HU.
Results
To assess the accuracy of the networks, a 10-fold cross-validation was performed. As accuracy measures for the evaluation, the Dice score (14) was calculated for each label. In addition, the Hamming distance (15) and Jaccard index (16) were also computed. The results are provided in Table I. In order to obtain a statistical overview of our trained network, violin plots are provided in Figure 2.
Table I. Evaluation of the segmentation accuracy of the trained neural network based on the mean and standard deviation for Dice score, Hamming distance and Jaccard Index.

Figure 2. Violin plots of the Dice scores of test datasets for the rectus, abdominal wall, psoas, quadratus and erector spine muscles. The violin plots depict the distribution of the data (in green). Mean values and standard deviation are illustrated by the box plot. The violin plots visualize Dice scores for all test datasets and illustrates that the majority of the datasets achieved very high scores as well as underlining the absence of a critical number of outliers.

Discussion
We present a neural network for automatic segmentation of skeletal muscle area based on 130 patient datasets. Our network was inspired by the U-Net architecture and adapted to the presented clinical application scenario. Due to its importance within oncology, related approaches exist that aim at similar measurements.
Hsu et al. present a general approach for using artificial intelligence-based methods applied to routine abdominal CT scans to assess body composition (17). They used a network pre-trained on the LiTS data challenge (18) and designed a fully automated approach to measure fat and muscle masses. Their system included automatic identification of the L3 slice, as well as automatic segmentation of fat and muscle tissue, but they did not carry out any subdivision of the muscles. The authors provide their code, training data and workflow solutions.
The work of Zopf and colleagues combined quantitative spectral detector CT data with machine-learning approaches and also focused on body composition analysis (19). Although they employed neural networks to extract the corresponding slice of the CT dataset, segmentation of the skeletal muscle mass mainly depended on thresholding of voxel intensities and analysis of iodine uptake.
Kanavati et al. used a variant of the U-Net architecture to automatically segment the erector spinae, psoas and rectus abdominus muscles (Dice scores of 0.97±0.02, 0.95±0.04, 0.94±0.04, respectively) and reported a Dice score for the combined muscle mass of 0.96±0.02 (20). Our approach was similar to this, although we only used a tenth of the amount of patient data. We also subdivided muscles into five muscle classes instead of three. Paris et al. achieved a Dice score of 0.983±0.0013 for the skeletal muscle mass (21) but also did not subdivide into five different categories as presented in our work.
The work by Burns et al. took five levels, L1-L5, into account (22). Interestingly, they also subdivided into the five muscle groups. For the overall skeletal muscle mass at the L3 level, they reported a mean Dice score of 0.939±0.049. The abdominal wall muscle and musculus quadratus lumborum achieved a Dice score of 0.94 and 0.935, respectively. We achieved lower results for the quadratus muscle (0.86), but this value was higher than their reported result for this muscle at all levels L1-L5 (0.819). Erector spine muscle segmentation had a Dice score of 0.95 for all lumbar levels, which our result at the L3 level (0.95) is in accordance with. Psoas and rectus muscle segmentation for all five levels achieved similar or slightly better results compared to our approach, i.e., a Dice value of 0.92 vs. 0.92 for psoas and 0.90 vs. 0.86 for the rectus muscle.
For future work, an analysis of whether an increased amount of data would increase the achieved accuracy of the network would be interesting. In addition, a combination with automatic identification of the L3 level as presented by Belharbi et al. (23) could be carried out.
In conclusion, we present an artificial intelligence-based approach for automatic segmentation of skeletal muscles at the L3 level in routine CT scans. Our network achieved Dice scores larger than 0.86 for each of the five different muscle types. The subdivision of muscle types can serve as a basis for obtaining future biomarkers. Our network is publicly available at www.forschungscampus-stimulate.de/bodycomposition so that it might be beneficial for others to improve the clinical work flow within routine CT scans.
Conflicts of Interest
The Authors state no conflicts of interest exist.
Authors’ Contributions
Conceptualization, SS and AS; methodology, RK and MH and SS and AS; software, RK and MH; validation, RK and MH and SS and AS; formal analysis, SS and AS; investigation, RK and MH and SS and AS; resources, SS and AS; data curation, MH and AS; writing—original draft preparation, RK and SS and AS; writing—review and editing, RK and MH and BP and SS and AS; visualization, RK and SS; supervision, SS and AS; project administration, SS and AS; funding acquisition, SS and AS. All Authors read and agreed to the published version of the article.
References
- 1.Deng HY, Zha P, Peng L, Hou L, Huang KL, Li XY. Preoperative sarcopenia is a predictor of poor prognosis of esophageal cancer after esophagectomy: a comprehensive systematic review and meta-analysis. Dis Esophagus. 2019;32(3):doy115. doi: 10.1093/dote/doy115. [DOI] [PubMed] [Google Scholar]
- 2.Kamarajah SK, Bundred J, Tan BHL. Body composition assessment and sarcopenia in patients with gastric cancer: a systematic review and meta-analysis. Gastric Cancer. 2019;22(1):10–22. doi: 10.1007/s10120-018-0882-2. [DOI] [PubMed] [Google Scholar]
- 3.Yang M, Shen Y, Tan L, Li W. Prognostic value of sarcopenia in lung cancer: a systematic review and meta-analysis. Chest. 2019;156(1):101–111. doi: 10.1016/j.chest.2019.04.115. [DOI] [PubMed] [Google Scholar]
- 4.Meyer HJ, Wienke A, Surov A. CT-defined low-skeletal muscle mass as a prognostic marker for survival in prostate cancer: A systematic review and meta-analysis. Urol Oncol. 2022;40(3):103.e9–103.e16. doi: 10.1016/j.urolonc.2021.08.009. [DOI] [PubMed] [Google Scholar]
- 5.Surov A, Wienke A. Low skeletal muscle mass predicts relevant clinical outcomes in head and neck squamous cell carcinoma. A meta analysis. Ther Adv Med Oncol. 2021;13:17588359211008844. doi: 10.1177/17588359211008844. [DOI] [PMC free article] [PubMed] [Google Scholar]
- 6.Surov A, Wienke A. Sarcopenia predicts overall survival in patients with malignant hematological diseases: A meta-analysis. Clin Nutr. 2021;40(3):1155–1160. doi: 10.1016/j.clnu.2020.07.023. [DOI] [PubMed] [Google Scholar]
- 7.Meyer HJ, Wienke A, Surov A. Computed tomography-defined low skeletal muscle mass as a prognostic marker for short-term mortality in critically ill patients: A systematic review and meta-analysis. Nutrition. 2021;91-92:111417. doi: 10.1016/j.nut.2021.111417. [DOI] [PubMed] [Google Scholar]
- 8.Ufuk F, Demirci M, Sagtas E, Akbudak IH, Ugurlu E, Sari T. The prognostic value of pneumonia severity score and pectoralis muscle Area on chest CT in adult COVID-19 patients. Eur J Radiol. 2020;131:109271. doi: 10.1016/j.ejrad.2020.109271. [DOI] [PMC free article] [PubMed] [Google Scholar]
- 9.Bertschi D, Kiss CM, Schoenenberger AW, Stuck AE, Kressig RW. Sarcopenia in patients undergoing transcatheter aortic valve implantation (TAVI): a systematic review of the literature. J Nutr Health Aging. 2021;25(1):64–70. doi: 10.1007/s12603-020-1448-7. [DOI] [PubMed] [Google Scholar]
- 10.Sepúlveda-Loyola W, Osadnik C, Phu S, Morita AA, Duque G, Probst VS. Diagnosis, prevalence, and clinical impact of sarcopenia in COPD: a systematic review and meta-analysis. J Cachexia Sarcopenia Muscle. 2020;11(5):1164–1176. doi: 10.1002/jcsm.12600. [DOI] [PMC free article] [PubMed] [Google Scholar]
- 11.Matsushima K, Inaba K, Jhaveri V, Cheng V, Herr K, Siboni S, Strumwasser A, Demetriades D. Loss of muscle mass: a significant predictor of postoperative complications in acute diverticulitis. J Surg Res. 2017;211:39–44. doi: 10.1016/j.jss.2016.12.002. [DOI] [PubMed] [Google Scholar]
- 12.Fukushima K. Visual feature extraction by a multilayered network of analog threshold elements. IEEE Trans Syst Sci Cyber. 1969;5(4):322–333. doi: 10.1109/TSSC.1969.300225. [DOI] [Google Scholar]
- 13.Loshchilov I, Hutter F. Decoupled weight decay regularization. arXiv. 2017 doi: 10.48550/arXiv.1711.05101. [DOI] [Google Scholar]
- 14.Dice LR. Measures of the amount of ecologic association between species. Ecology. 1945;26(3):297–302. doi: 10.2307/1932409. [DOI] [Google Scholar]
- 15.Hamming RW. Englewood Cliffs, NJ, USA, Prentice-Hall. 1980. Coding and information theory. [Google Scholar]
- 16.Jaccard P. The distribution of the flora in the Alpine zone. 1. New Phytol. 1912;11(2):37–50. doi: 10.1111/j.1469-8137.1912.tb05611.x. [DOI] [Google Scholar]
- 17.Hsu TH, Schawkat K, Berkowitz SJ, Wei JL, Makoyeva A, Legare K, DeCicco C, Paez SN, Wu JSH, Szolovits P, Kikinis R, Moser AJ, Goehler A. Artificial intelligence to assess body composition on routine abdominal CT scans and predict mortality in pancreatic cancer- A recipe for your local application. Eur J Radiol. 2021;142:109834. doi: 10.1016/j.ejrad.2021.109834. [DOI] [PubMed] [Google Scholar]
- 18.Bilic P, Christ PF, Vorontsov E, Chlebus G, Chen H, Dou Q, Fu C-W, Han X, Heng P-A, Hesser J, Kadoury S, Konopczynski T, Le M, Li C, Li X, Lipkovà J, Lowengrub J, Meine H, Moltz JH, Pal C, Piraud M, Qi X, Qi J, Rempfler M, Roth K, Schenk A, Sekuboyina A, Zhou P, Hülsemeyer C, Beetz M, Ettlinger F, Gruen F, Kaissis G, Lohöfer F, Braren R, Holch J, Hofmann F, Sommer W, Heinemann V, Jacobs C, Mamani GEH, van Ginneken B, Chartrand G, Tang A, Drozdzal M, Ben-Cohen A, Klang E, Amitai MM, Konen E, Greenspan H, Moreau J, Hostettler A, Soler L, Vivanti R, Szeskin A, Lev-Cohain N, Sosna J, Joskowicz L, Menze BH. The Liver Tumor Segmentation Benchmark (LiTS) arXiv. 2019 doi: 10.48550/arXiv.1901.04056. [DOI] [Google Scholar]
- 19.Zopfs D, Bousabarah K, Lennartz S, Santos DPD, Schlaak M, Theurich S, Reimer RP, Maintz D, Haneder S, Große Hokamp N. Evaluating body composition by combining quantitative spectral detector computed tomography and deep learning-based image segmentation. Eur J Radiol. 2020;130:109153. doi: 10.1016/j.ejrad.2020.109153. [DOI] [PubMed] [Google Scholar]
- 20.Kanavati F, Islam S, Arain Z, Aboagye EO, Rockall A. Fullyautomated deep learning slice-based muscle estimation from CT images for sarcopenia assessment. arXiv. 2020 doi: 10.48550/arXiv.2006.06432. [DOI] [PubMed] [Google Scholar]
- 21.Paris MT, Tandon P, Heyland DK, Furberg H, Premji T, Low G, Mourtzakis M. Automated body composition analysis of clinically acquired computed tomography scans using neural networks. Clin Nutr. 2020;39(10):3049–3055. doi: 10.1016/j.clnu.2020.01.008. [DOI] [PMC free article] [PubMed] [Google Scholar]
- 22.Burns JE, Yao J, Chalhoub D, Chen JJ, Summers RM. A machine learning algorithm to estimate sarcopenia on abdominal CT. Acad Radiol. 2020;27(3):311–320. doi: 10.1016/j.acra.2019.03.011. [DOI] [PubMed] [Google Scholar]
- 23.Belharbi S, Chatelain C, Hérault R, Adam S, Thureau S, Chastan M, Modzelewski R. Spotting L3 slice in CT scans using deep convolutional network and transfer learning. Comput Biol Med. 2017;87:95–103. doi: 10.1016/j.compbiomed.2017.05.018. [DOI] [PubMed] [Google Scholar]