Abstract
The state and behavior of a cell can be influenced by both genetic and environmental factors. In particular, tumor progression is determined by underlying genetic aberrations1–4 as well as the makeup of the tumor microenvironment5,6. Quantifying the contributions of these factors requires new technologies that can accurately measure the spatial location of genomic sequence together with phenotypic readouts. Here we developed slide-DNA-seq, a method for capturing spatially-resolved DNA sequences from intact tissue sections. We demonstrate that this method accurately preserves local tumor architecture and enables de novo discovery of distinct tumor clones and their copy number alterations. We then apply slide-DNA-seq to a mouse metastasis model and a primary human cancer, revealing that clonal populations are confined to distinct spatial regions. Moreover, through integration with spatial transcriptomics, we uncover distinct sets of genes that are associated with clone-specific genetic aberrations, the local tumor microenvironment, or both. Together, this multi-modal spatial genomics approach provides a versatile platform for quantifying how cell-intrinsic and extrinsic factors contribute to gene expression, protein abundance, and other cellular phenotypes.
Tissue function requires precise spatial organization of cell types, whose states are influenced by cell-intrinsic genetic factors and extrinsic environmental cues. In cancer, clonal populations of tumor cells evolve a diverse repertoire of DNA mutations, copy number alterations (CNAs), and large chromosomal rearrangements1,2 an increased risk of drug resistance, metastasis, and relapse3,4. Concomitantly, surrounding normal cells that make up the tumor microenvironment communicate to form spatial neighborhoods with distinct biochemical and biomechanical properties5,6 that influence cell migration and invasion7,8, as well as drug permeability9. Decoupling and quantifying these genetic aberrations and environmental cues within a tumor is critical to understanding cancer progression and improving treatments.
Current methods for delineating intratumor genetic heterogeneity include deep-sequencing to quantify mutant allele frequencies10,11 and single-cell whole-genome sequencing12–14. These methods leverage genetic alterations that occur during the evolution of the tumor to reconstruct phylogenetic cell lineages10–14, but do not measure spatial organization. In contrast, multi-region sequencing methods15–17 such as laser capture microdissection (LCM) preserve spatial context, but are mostly limited to clearly observable late-stage cancers and require manual selection of cells, constraining throughput and de novo discovery. A new technology called in situ genome sequencing18 enables untargeted spatial measurements of DNA, but focuses on high-resolution imaging of chromosome structure, precluding analysis of tissue sections. It therefore remains poorly understood how tumor clones are organized within a tissue, and to what extent cancer progression is driven by clone-specific genetic aberrations or environmental cues, highlighting a need for new methods that can integrate genomic, transcriptomic, and spatial measurements at scale.
Spatially-resolved DNA sequencing
In previous work, we described Slide-seq19,20, a scalable technology that uses barcoded bead arrays to capture spatially-resolved genome-wide expression, referred to as slide-RNA-seq from here on for clarity. Here we developed slide-DNA-seq, a new method that enables spatially-resolved DNA sequencing from intact tissues.
We first generate a spatially indexed bead array (3-mm diameter) as developed for slide-RNA-seq19,20. Each 10 μm polystyrene bead contains a unique DNA barcode that corresponds to a spatial location and is read out using sequencing by ligation chemistry19,20. We then cryosection tissues and transfer a single 10 μm thick fresh-frozen section onto the sequenced bead array (Fig. 1a). In a new workflow that enables unbiased capture of DNA, the tissue section is treated with HCl to remove histones and transposed with Tn5 to create genomic fragments flanked by custom adapter sequences21,22 (Supplementary Table 1). We then photocleave spatial barcodes from the beads, ligate them to proximal genomic fragments, and PCR amplify the resulting DNA sequencing library (Fig. 1b). Following library construction, we perform high-throughput paired-end sequencing and use DNA barcodes to associate each genomic fragment with a spatial location on the bead array. These associations enable us to reconstruct the spatial organization of DNA in a tissue without imaging the sample under a microscope. We developed optimizations for tissue fixation, histone removal, and bridge oligo hybridization that collectively maximize library size, make chromatin uniformly accessible to Tn5 (Extended Data Fig. 1), and preserve tissue architecture (Extended Data Fig. 2). Following our initial optimizations, each array contains 20,000 to 40,000 beads with a median 165 to 421 fragments per bead (tumor tissues, Extended Data Fig. 3). Furthermore, we developed a proof-of-concept protocol variant that uses repeated Tn5 tagmentation to improve yield, resulting in a 10 fold increase in genomic fragments (Extended Data Fig. 3, Supplementary Methods). Detailed metrics for all tissues analyzed in this study are listed in Supplementary Table 2.
Fig. 1: slide-DNA-seq enables spatially-resolved DNA sequencing.
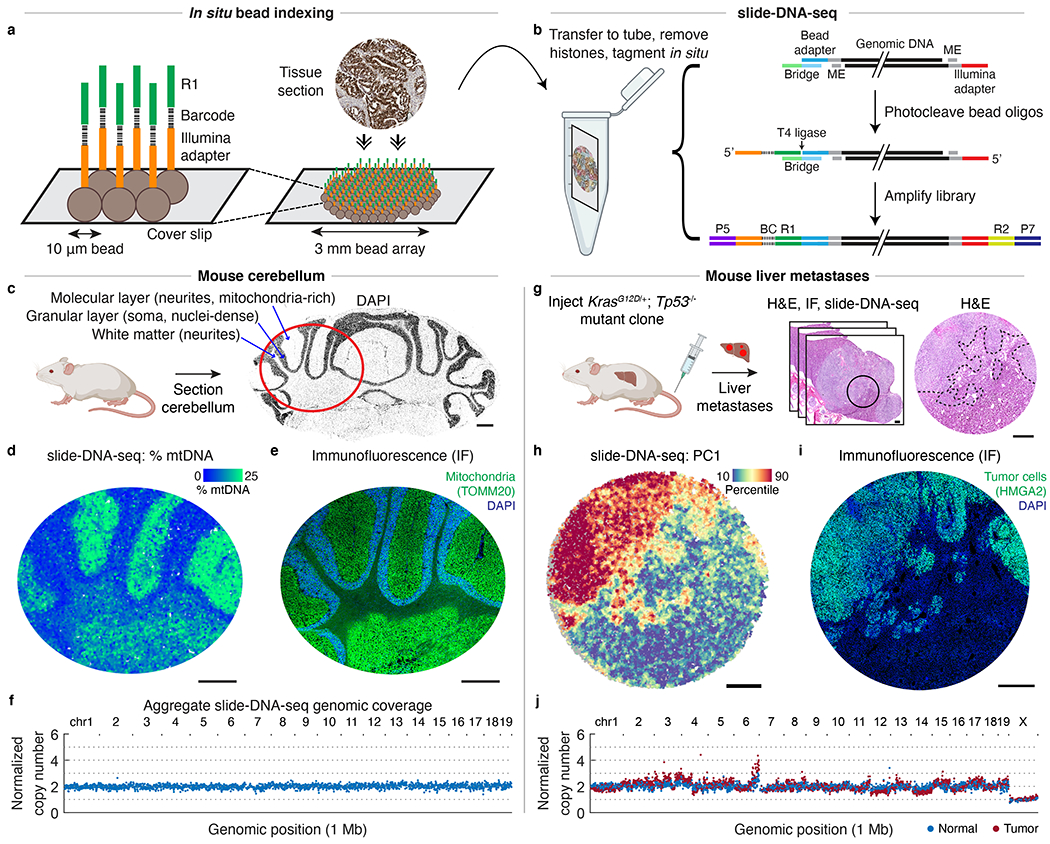
a, Schematic of in situ bead indexing. Array of randomly-deposited beads is spatially indexed through in situ sequencing of DNA barcodes. Fresh-frozen tissue is cryosectioned onto array. b, Schematic of slide-DNA-seq library construction. Genomic DNA is transposed with Tn5. Hybridization of a bridge oligo allows ligation of photocleaved, spatially-indexed bead oligos to genomic fragments. ME, mosaic ends; BC, barcode; R1, Illumina read 1; R2, Illumina read 2. c, DAPI stained cryosection of a mouse cerebellum. Red circle indicates approximate region shown in d and e. d, slide-DNA-seq of a cerebellar section with beads colored by percentage of fragments aligned to mitochondrial genome. e, Serial section to d stained with DAPI and antibody against mitochondrial protein TOMM20. f, Normalized copy number per 1 Mb genomic bin for aggregated beads from d. g, Serial sections from KrasG12D/+; Tp53−/− liver metastases were processed for H&E staining (center, circle indicates region analyzed; right, dotted lines indicate tumor boundary), slide-DNA-seq (h), and IF against HMGA2 (i). h, slide-DNA-seq of mouse liver section with beads colored by principal component 1 scores (PC1). For visualization, scores for each bead are smoothed by 50 PC neighbors and 10 spatial neighbors (36 μm diameter). i, Serial section to h stained with DAPI and antibody against tumor marker HMGA2 . j, Normalized copy number per 1 Mb genomic bin for aggregated normal and tumor beads from liver section from h. Scale bars, 500 μm. Grey beads shown for spatial context but excluded from analysis.
To determine the spatial and genomic resolution of this approach, we first applied slide-DNA-seq to the mouse cerebellum, which contains distinct nuclei-dense (soma) and mitochondria-rich (neurites) regions (Fig. 1c). We reasoned that these patterns should be reflected in the spatial distribution of nuclear versus mitochondrial DNA fragments. Indeed, striations of nuclear versus mitochondrial DNA content were apparent from slide-DNA-seq data (Fig. 1d, Extended Data Fig. 3). We then leveraged these patterns to measure our spatial resolution by performing immunofluorescence (IF) and DAPI staining on serial tissue sections of the same cerebellum, resulting in a lateral diffusion estimate of ~25 μm (Fig. 1e, Extended Data Fig. 4, Supplementary Methods). To measure genomic resolution, we corrected the data for sequence biases and normalized coverage using bulk sequencing of the same tissue (Extended Data Fig. 5, Supplementary Methods, Supplementary Discussion). Using this approach, 99.78% of non-overlapping 1 Mb genomic bins had a normalized copy number between 1.5 and 2.5 (Fig. 1f, Extended Data Fig. 6). Altogether, these data show that slide-DNA-seq can spatially localize genomic information within normal tissues.
Detecting spatial distribution of CNAs
We next applied slide-DNA-seq to measure the spatial distribution of copy number alterations (CNAs) in a tumor section by leveraging genetically engineered mouse models of lung adenocarcinoma known to harbor chromosomal amplifications and deletions23. First, we isolated and expanded a single tumor clone from a KrasG12D/+ Trp53−/− (KP) mouse lung tumor24,25 and injected this clone into the tail vein of a mouse, giving rise to large metastases in the liver (Fig. 1g). We then collected multiple serial sections of liver metastases to perform slide-DNA-seq, along with hematoxylin and eosin (H&E) staining and IF for Hmga2, a late stage tumor marker. To characterize tumor heterogeneity within the tissue, we developed a slide-DNA-seq analysis workflow consisting of two main tasks: 1) de novo identification and spatial localization of clonal populations and 2) characterization of genomic CNAs for each clone.
First, to detect and localize tumor clones within a tissue, we smooth beads based on spatial proximity (k = 50 nearest beads, ~110 μm diameter, Extended Data Fig. 3, median 18,587 ± 5,300 fragments) and perform principal component analysis (PCA) to find co-associated genomic regions with variable coverage across the tissue. We then use these regions to assign a clonal identity to each bead on the slide-DNA-seq array by k-means clustering (Extended Data Fig. 7, Supplementary Methods). When we applied this approach to the liver metastases slide-DNA-seq array, principal component 1 (PC1, 2.89% variance explained) showed spatial patterning (Fig. 1h) that was visually concordant with IF on a serial section against the late stage tumor marker HMGA2 26–28 (Fig. 1i). To validate if this approach can identify genetically-distinct tumor clones, we performed downsampling on bulk sequencing of four tumor cell lines and found robust accuracy (99.38%) with as few as 1,000 fragments per sample (Extended Data Fig. 8, Supplementary Methods), suggesting it is sufficient for slide-DNA-seq data.
The second task in the analysis workflow is to characterize the CNAs present in each tumor clone. To do this, we aggregate 100-1000s of raw beads based on the cluster assignments from the first task and visualize the genomic coverage of each cluster at 1 Mb resolution. When applied to the liver metastases array, the tumor-associated cluster displayed significant CNAs, including amplification of chromosome 6 that is characteristic for Kras-induced lung tumors23, while the normal cluster showed comparatively uniform coverage (Fig. 1j). Further comparisons to a biological replicate performed on a serial section revealed visually-concordant tissue architecture, as well as high correlation between tumor copy number profiles (Pearson’s r = 0.986, Extended Data Fig. 9). To quantify the accuracy of the copy number analysis, we used the diploid mouse cerebellum data to systematically evaluate coverage at a range of bin sizes and spatial resolutions (Extended Data Fig. 10, Supplementary Methods). Altogether, these results demonstrate that our slide-DNA-seq analysis workflow enables de novo discovery and localization of tumor regions at approximately ~1 Mb genomic resolution (Supplementary Discussion).
Spatial genomics of metastatic clones
To demonstrate that our experimental and computational approach can distinguish between clones within a tissue, we injected multiple clones originating from two independently-derived metastatic KP tumors into the tail vein of a mouse, which gave rise to large metastases in the liver. We then performed H&E staining and identified a region of the tissue that appeared to have two spatially-distinct metastases (Fig. 2a). Immunohistochemistry (IHC) on the same region of a serial section revealed that the two varied in protein levels of tumor marker HMGA226, suggesting that they may originate from different metastatic clones (Extended Data Fig. 11a).
Fig. 2: Paired slide-DNA-seq and slide-RNA-seq characterize the genetics and transcriptomes of distinct metastatic clones.
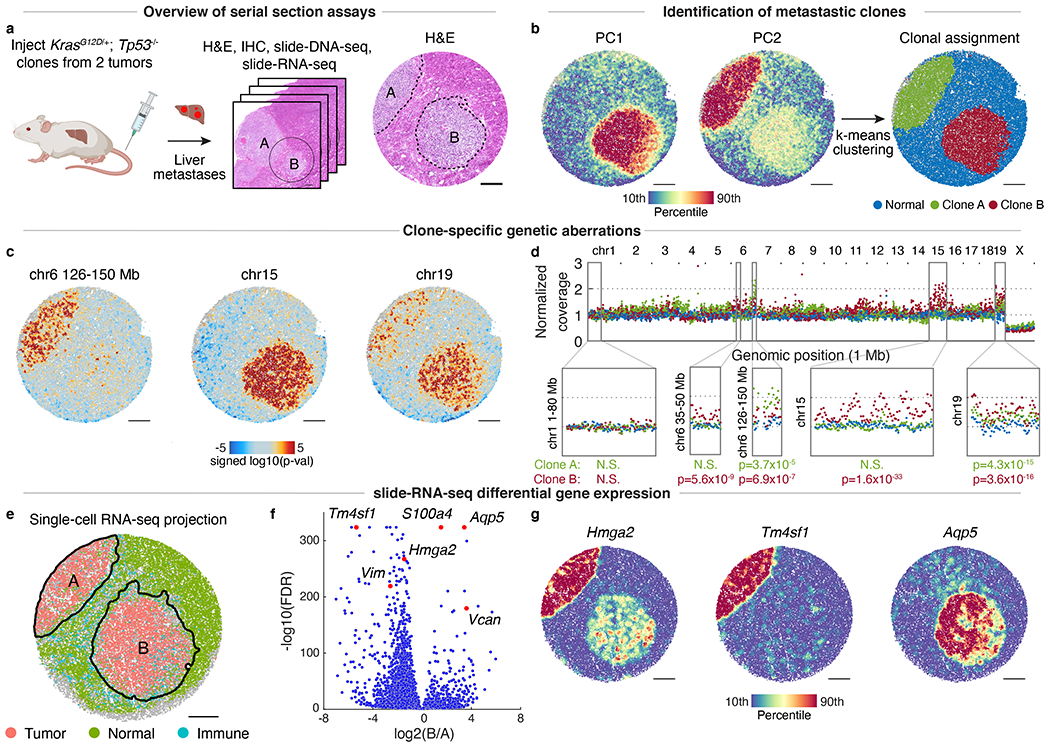
a, Serial sections from KrasG12D/+; Trp53−/− liver metastases were processed for H&E staining (center, circle indicates region analyzed; right, dotted lines indicate tumor boundaries), immunohistochemistry (IHC, Extended Data Fig. 5), slide-DNA-seq (b-d), and slide-RNA-seq (e-g). b, Principal components 1 (left) and 2 (middle) of slide-DNA-seq genomic coverage. Beads clustered using k-means (k=3) and annotated as normal, clone A, or clone B (right). c, Genomic region enrichment signed p-values for chromosomes 6 (126-150 Mb), 15, and 19 (two-sided permutation test, not adjusted for multiple comparisons). Amplifications, red; deletions, blue. d, Genomic coverage profiles of aggregate normal (blue), clone A (green), and clone B (red) beads from b. Genomic coverage normalized to 1 to compare profiles of different ploidy (Extended Data Fig. 12). p-values calculated using two-sided Wilcoxon Rank Sum test to compare clone and normal coverage. e, slide-RNA-seq of mouse liver serial section colored by tumor, normal and immune cell classes as assigned from single-cell projection. Detailed cell type labels in Extended Data Fig. 13. f, Differentially-expressed genes between clones A and B. Genes shown in g or referred to in text are labeled and colored in red. g, Normalized expression of select genes from f. Scale bars, 500 μm. Grey beads shown for spatial context but excluded from analysis.
We then applied slide-DNA-seq to a third serial section of the same liver tissue. Using the PCA approach described above, we found that both PC1 and PC2 explained substantial variance (4.21% and 2.50% respectively), allowing the beads to be assigned to 3 distinct clusters based on their genomic profiles (Fig. 2b). One of these clusters was visually concordant with the normal tissue observed in the H&E, while the other two appeared to correspond to the different metastases. We developed a permutation test to spatially localize statistically significant CNA gains or losses present in one or both of the metastases, detecting differential regions on chr6, chr15, and chr19 (Fig. 2c, Supplementary Methods). We then tested the aggregate genomic coverage in select regions for statistical significance (two-sided Wilcoxon Rank Sum Test, p-values in Fig. 2d), providing further evidence that they were seeded by different clones. Additionally, we observed one clone was likely triploid, which we independently confirmed with flow cytometry (Extended Data Fig. 12).
To test whether genetic differences between the two clones were reflected in cell state, we performed slide-RNA-seqV220 on a fourth serial section and collected paired single-nucleus RNA-seq. Unsupervised clustering of the snRNA-seq and spatial projection29 onto slide-RNA-seq beads (Methods, Supplementary Table 3) revealed that the two metastases were transcriptionally distinct (Fig. 2e, Extended Data Fig. 11b–c), resulting in 3,732 genes differentially expressed between the two clones (Fig 2f, Supplementary Table 4, two-sided z-test, FDR < 0.01, log2(FC) > 1, minimum 100 transcripts). Clone A had higher expression of late-stage tumor markers, including Hmga2 (lung metastases), Tm4sf1 (JAK/STAT), and Vimentin (cell motility), whereas the top hits for clone B included Aquaporin 5 (loss of lineage identity) and epithelial-to-mesenchymal transition (EMT) markers S100A4 and Versican25 (Fig. 2f–g). While both clones exhibited EMT and metastasis expression signatures, these differentially-expressed genes may reflect divergent paths of tumor evolution. Furthermore, we found differential monocyte localization (p = 0.0002, permutation test) into clone B, reflecting a higher degree of immune infiltration (Extended Data Fig. 11e–f, Supplementary Methods). Altogether, these data demonstrate that paired slide-DNA-seq and slide-RNA-seq enable spatial characterization of genetically-distinct metastatic tumor clones and their associated cell states.
Subclone detection in human colon cancer
We then sought to determine whether slide-DNA-seq could discover clonal heterogeneity de novo in a primary human tumor. We selected a stage IIIB colorectal tumor sample, because colorectal cancer is one of the most common causes of cancer-related deaths worldwide and 84% of tumors display chromosome instability30,31. As before, we performed H&E staining, multiplexed IHC, and slide-DNA-seq on serial sections (Fig. 3a). Looking first at the H&E staining, we observed many ~100-500 μm localized aggregates of tumor cells. We hypothesized that each of these aggregates could arise from a single clonal lineage, suggesting constraints on migration, or alternatively, each aggregate could contain a mixture of cells from different lineages, indicating cell intermixing.
Fig. 3: De novo identification of spatial tumor clones in primary human colorectal cancer.
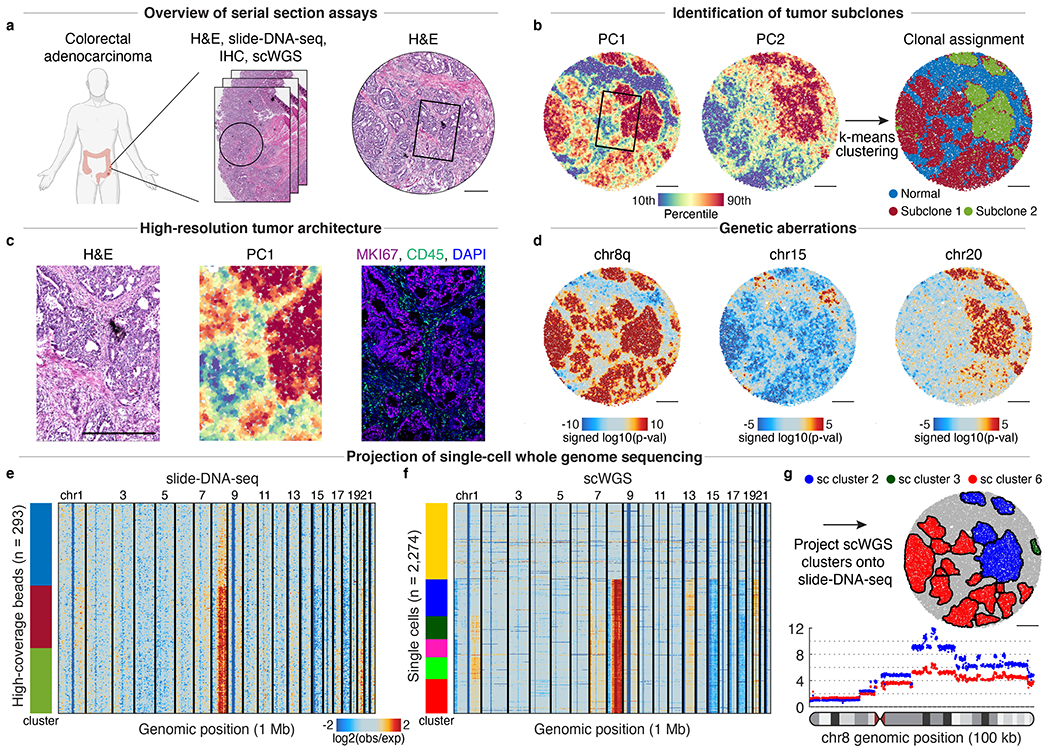
a, Serial sections of primary human colorectal tumor were processed for H&E staining (right, c), slide-DNA-seq (b-e), and multiplexed IHC (c); single-cell whole-genome sequencing (scWGS) was performed on the same sample (f-g). b, Principal components 1 (left) and 2 (middle) of slide-DNA-seq genomic coverage. Beads clustered using k-means (k=3) and annotated as normal, subclone 1, or subclone 2 (right). c, Magnified view of boxed regions in a-b. Right, serial section stained with antibodies against MKI67 , CD45 , and DAPI. d, Genomic region enrichment signed p-values for chromosomes 8q, 15, and 20 (two-sided permutation test, not adjusted for multiple comparisons). e, Copy number profiles for 293 high-coverage slide-DNA-seq beads. f, Copy number profiles for 2,274 single cells profiled via scWGS. Profiles within each cluster are ordered by PC1 score in e-f. g, Matched single-cell clusters projected onto slide-DNA-seq array (top). Genomic coverage of chromosome 8 at 100 kb resolution for single-cell clusters 2 and 6 (bottom). Scale bars, 500 μm. Amplifications, red; deletions, blue in d-f. Grey beads shown for spatial context but excluded from analysis.
To distinguish between these two possibilities, we performed PCA and unsupervised clustering on the slide-DNA-seq data as described above, which resulted in 3 distinct clusters of genomic profiles (Fig. 3b). One of these clusters was visually concordant with the normal tissue from the H&E staining (Fig. 3b right, blue), but also included regions of moderate PC1 scores, suggesting a low abundance of cancer cells harboring CNAs. In contrast, the other two clusters displayed high PC1 scores and were spatially restricted to distinct tumor aggregates, supporting the hypothesis that each aggregate originates from a single lineage. This finding is consistent with reports suggesting that individual colorectal tumor cells seed a glandular organization in which neighboring cells share a recent common ancestor32,33. We validated the tumor architecture detected by slide-DNA-seq through co-registration of the slide-DNA-seq array, H&E stain, and IHC against tumor marker MKI67 and immune marker CD45 (Fig. 3c).
We then set out to characterize the genetic aberrations of the identified subclones. We found several, including chr8q amplification, and loss of chr15 and chr18, that were shared across all tumor regions (Fig. 3d–e, Supplementary Methods), indicating that they arose early in tumor evolution and may have played an important role in tumor initiation. The chr8q amplification contains genes known to promote tumor progression, including proto-oncogenes MYC and MYBL134, while deletion of chr15 results in loss of multiple genes required for genome stability, including TP53BP135, RAD5136, and FAN137. Supporting these observations, chr8q gain and chr18 loss were identified as typical early events in an evolutionary history of 60 colorectal tumors10. In contrast to these shared aberrations, we observed subclonal amplifications of chr1q, chr7, and chr20, which presumably occurred at a later stage of evolution (Fig. 3d–e). Interestingly, previous analyses of colorectal cancers classified chr7p amplification as a typically clonal (rather than subclonal) event, while both loss and gain of chr20p were identified as frequent subclonal aberrations10,38. The detection and temporal classification of these events demonstrate the utility of slide-DNA-seq for studying the evolution of clonal heterogeneity.
To validate these genetic aberrations, we performed single-cell whole-genome sequencing (scWGS) on the same colorectal tumor. This approach sampled cells from the entirety of the tumor (100-fold greater material than the slide-DNA-seq tissue section), so we expected to potentially identify additional subclones. In line with this expectation, analysis of 2,274 high-coverage single-cell CNA profiles resulted in one normal and five tumor clusters, some of which resembled the slide-DNA-seq CNA profiles (Fig. 3f). We then sought to project the high-coverage sequencing onto the slide-DNA-seq array to identify CNAs at enhanced resolution (Supplementary Methods). The spatial regions predominantly matched two separate scWGS clusters, supporting the slide-DNA-seq-only analysis, but we also found a small region with distinct genetic aberrations that was revealed only through the higher coverage of the scWGS data (Fig. 3g, top, Extended Data Fig. 13). Having demonstrated improved spatial resolution, we then re-analyzed the matched scWGS clusters at 100 kb genomic resolution, revealing a complex CNA landscape in chromosome 8 (Fig. 3g, bottom). Altogether, these analyses validate that slide-DNA-seq alone is sufficient for de novo discovery and localization of distinct tumor clones within a tissue, while also showing that CNA characterization can be enhanced through integration with scWGS.
Multi-modal analysis of clonal heterogeneity
Finally, to demonstrate the unique capabilities of a multi-modal spatial sequencing approach, we sought to quantify how tumor transcriptional programs are controlled by both genetics and environmental cues. We first performed H&E staining, slide-DNA-seq, and slide-RNA-seqV2 on serial sections from a nearby region of the colorectal tumor (Fig. 4a) and co-registered the arrays to integrate pathological, genomic, and transcriptomic information. We then identified spatially-distinct regions of tumor cells (Fig. 4b, Supplementary Methods), and proceeded to assign each one a subclonal identity (Fig. 4c) and quantify the local tumor density (Fig. 4d, Supplementary Methods). Comparison with the H&E stain validated the spatial architecture of the subclones identified by slide-DNA-seq, as well as the tumor density quantified by slide-RNA-seq (Extended Data Fig. 14).
Fig. 4: Decomposition of transcriptional programs driven by genetic aberrations and tumor density.
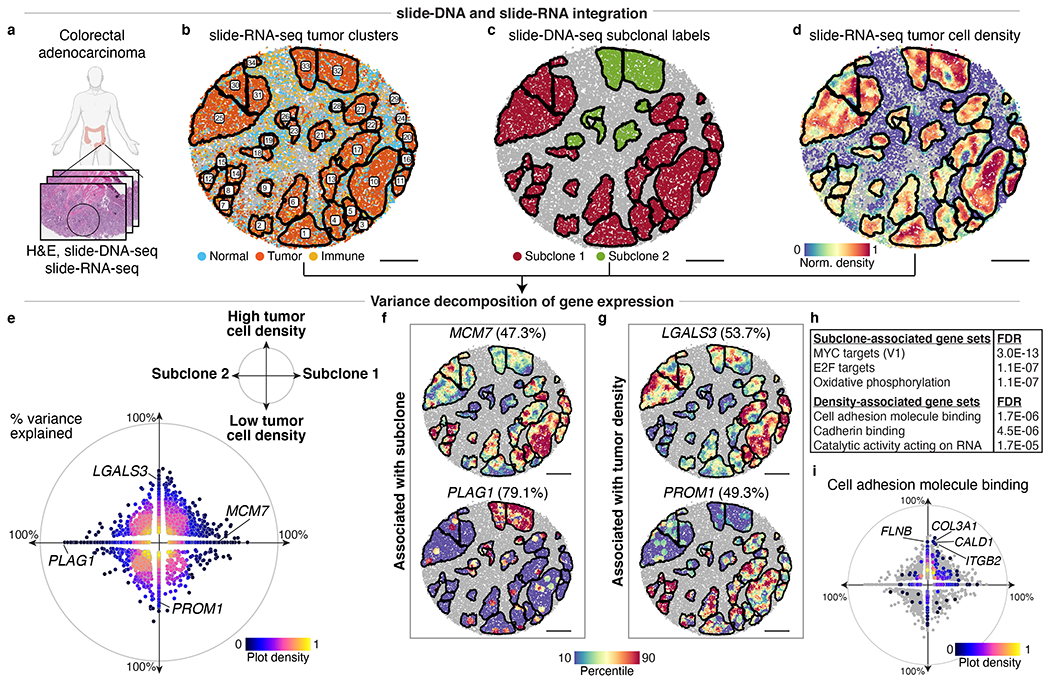
a, Serial sections from nearby region of human colorectal tumor from Fig. 3 were processed for H&E staining, slide-DNA-seq (Extended Data Fig. 14), and slide-RNA-seq (b-j) b, slide-RNA-seq of colon tumor section with beads colored by assignment to normal, tumor, or immune clusters. Black lines denote boundaries of spatially-distinct tumor regions. c, Subclone labels for spatial tumor regions (defined via co-registration with slide-DNA-seq serial section) plotted on slide-RNA-seq array from b. d, Tumor density plotted on slide-RNA-seq array from b. e, Genes plotted by percent variance explained by subclone (x-axis) and/or tumor density (y-axis), colored by plot density (n=2,148, stepwise regression, p<0.05). f, Top subclone-associated genes, with expression plotted for spatial tumor regions. g, Same as f but for top density-associated genes. h, Select gene sets significantly associated with either subclone or tumor density. i, Cell adhesion molecule binding genes (n=544) plotted by percent variance explained by subclone (x-axis) and tumor density (y-axis), colored by plot density. All other genes from e shown in grey. Scale bars, 500 μm. Grey beads shown for spatial context but excluded from analysis.
Given both subclonal identity (cell-intrinsic) and tumor density (cell-extrinsic) measurements, we set out to deconvolve how these factors contribute to the transcriptional programs of the colorectal tumor. To this end, we used a variance decomposition approach that, for each gene, calculates the percentage of gene expression variance explained by subclonal identity, tumor density, and unexplained variance (Supplementary Methods). Of the 25,074 genes detected by slide-RNA-seq 412 genes were significantly associated with subclonal identity, 638 genes by tumor density, and 1,098 genes by some combination of both (p < 0.05, variance explained > 30%, Fig. 4e, Supplementary Table 5). Genes associated with subclonal identity included known cancer genes located in amplified regions, such as PLAG1, an oncogene on chr8q39, and MCM7, a MYC target gene on chr7q involved in DNA replication initiation40 (Fig. 4f). Notable density-associated genes include LGALS341 (Galectin-3), contributing to immunosuppression in the tumor microenvironment, and PROM1 (CD133), important for intestinal homeostasis, regeneration, and tumor initiation42 (Fig. 4g).
Beyond characterizing individual genes, we also performed gene set enrichment analysis to determine which molecular pathways were associated with subclonal identity or tumor density (Fig. 4h, Supplementary Methods). This analysis showed that subclonal identity primarily altered the expression of genes involved in cell growth and proliferation, with MYC and E2F target genes representing the top Hallmark gene sets for subclone 1 (Extended Data Fig. 15). In contrast, genes associated with high tumor density were most enriched for cell adhesion molecule- and cadherin-binding properties (Fig. 4i, Extended Data Fig. 15), including extracellular matrix (ECM) component COL3A1, actin modulators FLNB and CALD1, and mechanotransduction regulator ITGB2 (CD18). Intriguingly, ECM stiffness and remodelling are thought to promote cell proliferation and tumor progression43, which may contribute to high tumor cell density. Overall, these analyses demonstrate the utility of this multi-modal approach to decouple and quantify contributions of genetic and environmental factors to gene expression.
Discussion:
Our study demonstrates that slide-DNA-seq can detect clonal heterogeneity, characterize the copy number alterations of each clone, and analyse their spatial distribution within a tissue. These capabilities, in combination with processing of serial sections for histopathology and slide-RNA-seq enable high-resolution multi-omic characterization of intratumoral heterogeneity44. Additionally, integration with single-cell whole-genome sequencing may enable spatial characterization of complex subclonal events, such as loss-of-heterozygosity or extrachromosomal DNA amplifications45. Going forward, we anticipate that slide-DNA-seq will be especially useful to large-scale efforts to create atlases of tumor evolution10, adding spatial information to studies of clonal heterogeneity. It may also empower new frontiers in clinical diagnoses as a complement to standard pathology assays such as H&E staining, karyotyping, and DNA FISH.
Spatially-resolved DNA sequencing may also enable advances in many fields beyond cancer genomics, including spatially-resolved metagenomics46, evaluation of gene therapy delivery47, synthetic DNA data storage48, and lineage tracing in healthy tissues49. Importantly, the core of this technology, i.e. fragmenting and barcoding DNA in situ to preserve spatial information for next-generation sequencing, is compatible with other sequencing-based assays. For example, direct tagmentation of the DNA without HCl treatment, or converting methylated cytosines to dihydrouracil before amplification, would allow spatially-resolved measurements of chromatin accessibility and DNA methylation respectively22,50. Altogether, slide-DNA-seq enables new opportunities to chart the spatial organization of cell states in human development, homeostasis, and disease.
Extended Data
Extended Data Figure 1: Optimization of slide-DNA-seq protocol.
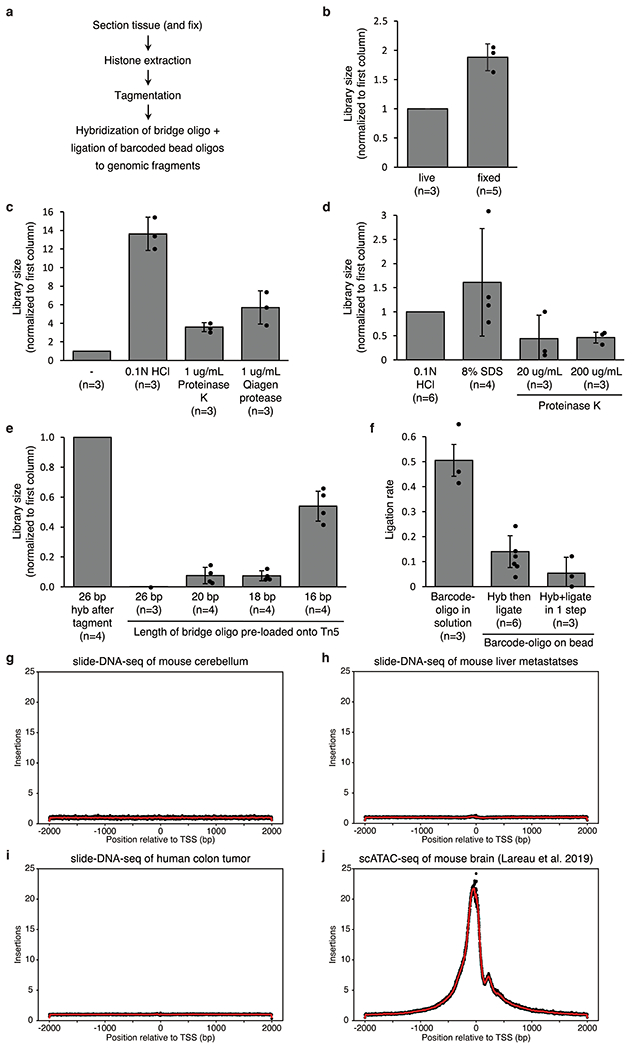
a, Library preparation steps. b-e, Library size comparisons for live vs fixed tissue (b); histone extraction protocols (c-d); and varying lengths of a bridge oligo used to connect the barcoded bead oligo to genomic fragments e, either hybridized after tagmentation (left bar) or pre-loaded onto the Tn5 transposase prior to tagmentation (rest). All values are normalized to control condition (first column). f, Rate of ligation of genomic fragments to barcoded oligo either ordered in solution from IDT (left) or cleaved off from beads (center, right). g-j, Frequency of Tn5 insertions in the genome relative to the nearest transcription start site (TSS) for slide-DNA-seq of mouse cerebellum (g), mouse liver metastases (h), human colon tumor (i), and for single-cell ATAC-seq of a mouse brain (j). Error bars, mean ± s.d; n, number of replicate comparisons (generated from 4 biological samples); dots represent values of each replicate.
Extended Data Figure 2: Comparison of fixation conditions during histone extraction.
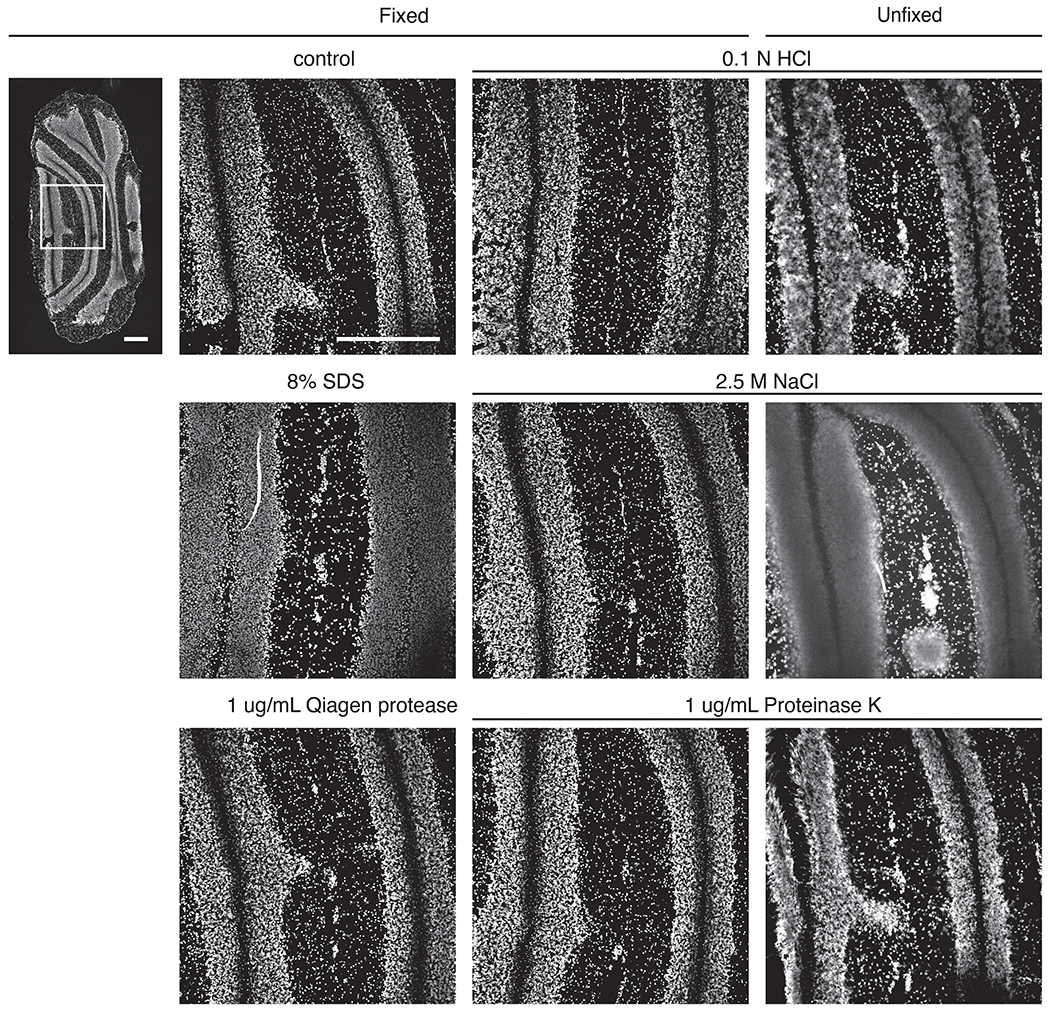
Cerebellar sections are exposed to treatment as stated (with or without prior fixation) and stained with DAPI. Scale bars, 500 μm.
Extended Data Figure 3: Quantification of DNA fragments per slide-DNA-seq array.
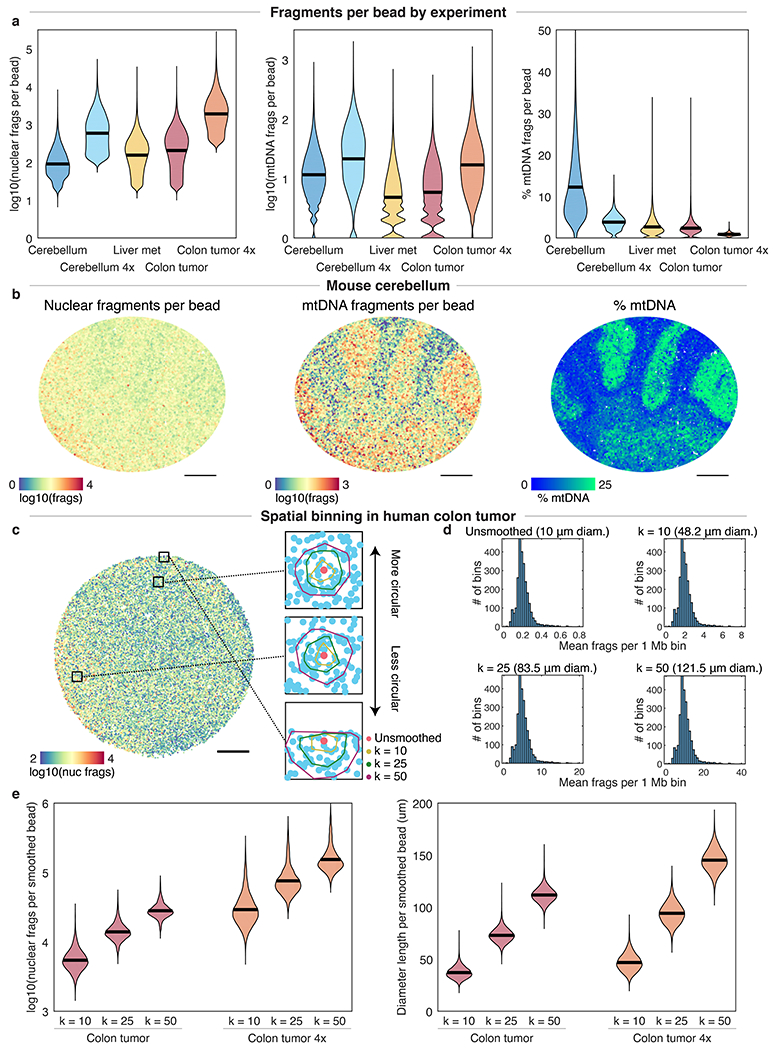
a, Nuclear (left) and mitochondrial (center) DNA fragments per bead obtained for tissues used in this study. Right, mitochondrial fraction of fragments. 4x, protocol variant with 4x tagmentation. Black lines on violin plots indicate the mean. b, slide-DNA-seq of the mouse cerebellum experiment in Fig. 1. Beads are colored by the number of nuclear fragments (left), mitochondrial DNA fragments (center), and fraction of mitochondrial DNA fragments (right). c, Visualization of representative convex hulls for different spatial bin values of k for k-nearest neighbor smoothing. Beads are colored by raw counts, insets show convex hulls for k = 1, 10, 25, and 50, centered on salmon colored beads. Hulls are generally circular except at the edge of the array. d, Distribution of mean fragments per 1 Mb genomic bin for different spatial bin values of k. The median diameter of the smoothed features is indicated in parentheses. e, Comparison of nuclear fragments (left) and effective diameter (right) per bead for different spatial bin values of k. Scale bars, 500 μm.
Extended Data Figure 4: Estimation of slide-DNA-seq lateral diffusion.
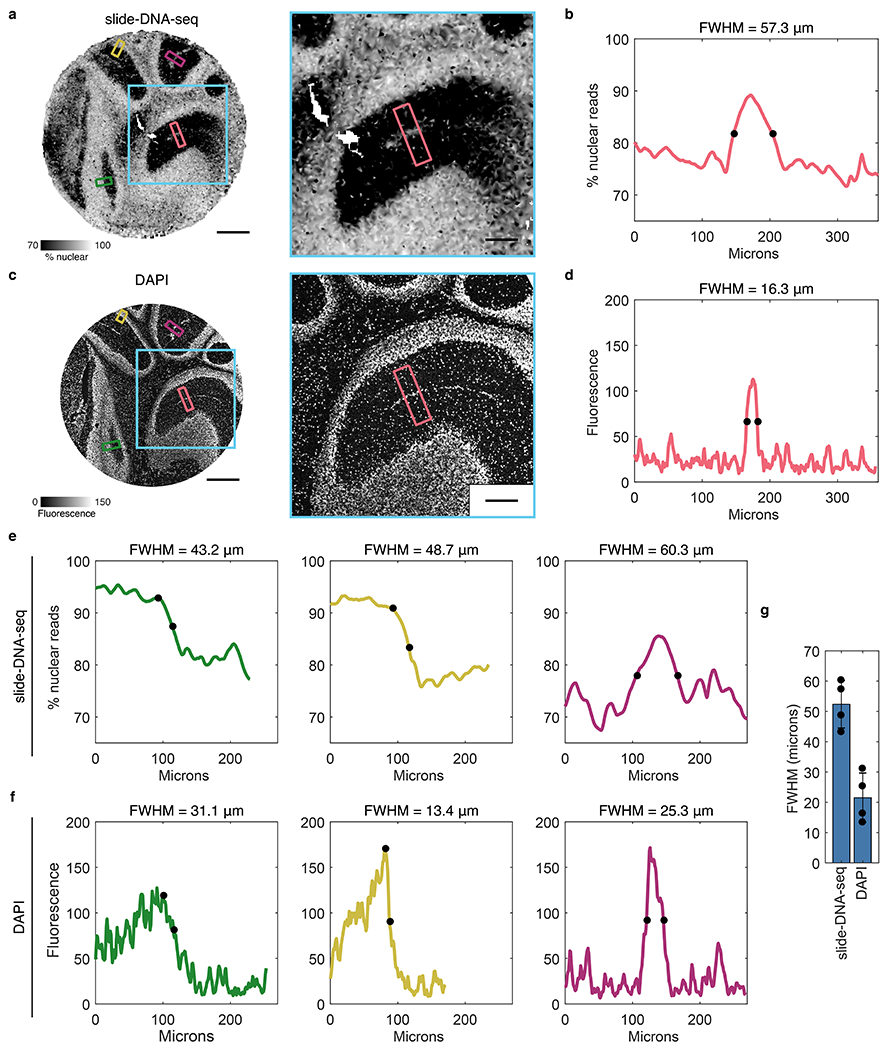
a, Interpolated image showing the nuclear fraction of fragments of a 10 μm mouse cerebellar section processed for slide-DNA-seq. Cyan box indicates magnified area (right). Smaller boxes indicate regions taken for linescans in b and e. b, Pseudo-intensity (representing nuclear fraction of fragments) of linescan as indicated by red box in a. Black dots, halfmax. Full Width at Half Maximum (FWHM) = 57.3 μm. c, 10 μm serial section of the same mouse cerebellum stained with DAPI. Blue box indicates magnified area (right). Smaller boxes indicate regions taken for linescans in d and f. d, Linescan of DAPI intensity as indicated in c. Black dots, halfmax. FWHM = 16.4 μm. e, Same as b, but for 3 different regions as indicated by the smaller non-red boxes in a. For the left (green) and middle (yellow) panel, FWHM is calculated as twice the distance between the peak and the halfmax (marked by black dots). f, Same as d, but for 3 different regions as indicated by the smaller non-red boxes in b. For the left (green) and middle (yellow) panel, FWHM is calculated as twice the distance between the peak and the halfmax (marked by black dots). g, Bar graph of average FWHM (n=4 regions). Error bars, mean ± s.d. Upper bound for the diffusion measurement is half of largest FWHM (not taking into account the DAPI measurement). Scale bars, 500 μm (a, c), 200 μm (b, d).
Extended Data Figure 5: Normalization of slide-DNA-seq sequencing biases.
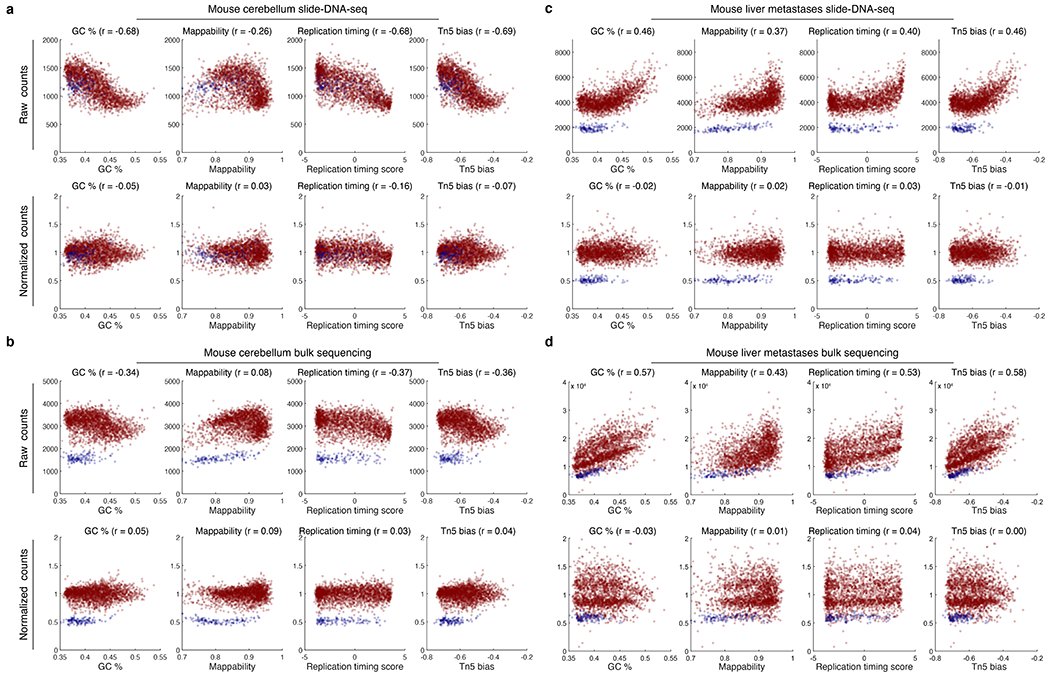
a, Top, raw sequencing reads per 1 Mb bin for mouse cerebellum slide-DNA-seq are plotted for GC-content, mappability, replication timing score, and Tn5 bias. Pearson’s r values are shown for each. Bottom, bias corrected coverage and correlation values after normalization. b, Same as a but for tagmentation-based bulk sequencing of mouse cerebellum (Methods). c, Same as a but for slide-DNA seq of mouse liver metastases. d, Same as b but for tagmentation-based bulk sequencing of mouse liver metastases. Blue points, bins from chrX (not included in the calculation of the fit).
Extended Data Figure 6: Quantification of genomic coverage in a diploid sample.
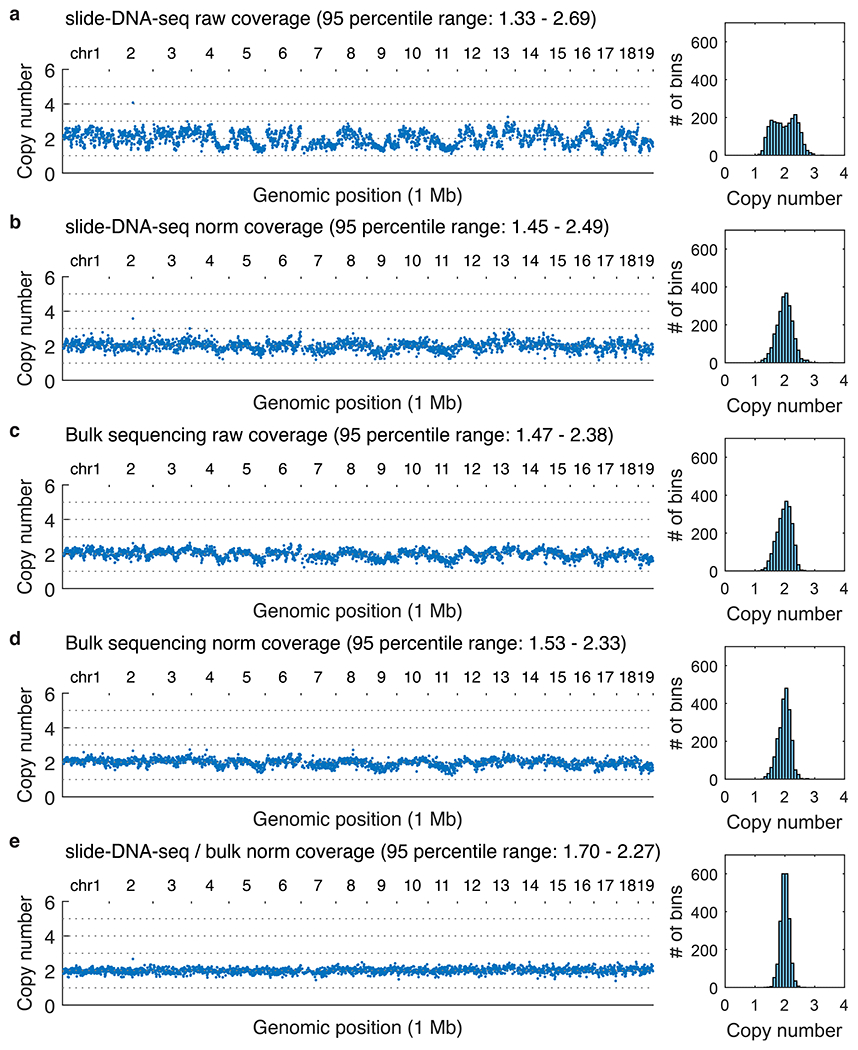
Left (all panels), copy number profiles at 1 Mb genomic resolution of the mouse cerebellum for the sequencing modality and processing indicated. For this diploid sample, each copy number distribution is normalized to a median of 2. Right (all panels), histogram of the number of bins per copy number. a, Raw coverage profile of slide-DNA-seq. b, Coverage profile of slide-DNA-seq normalized by GC-content and mappability. c, Coverage profile for bulk tagmentation-based sequencing. d, Coverage profile of bulk sequencing normalized by GC-content and mappability. e, Coverage profile of slide-DNA-seq normalized by the GC-content and mappability divided by bulk sequencing normalized by GC-content and mappability.
Extended Data Figure 7: slide-DNA-seq clonal analysis workflow.
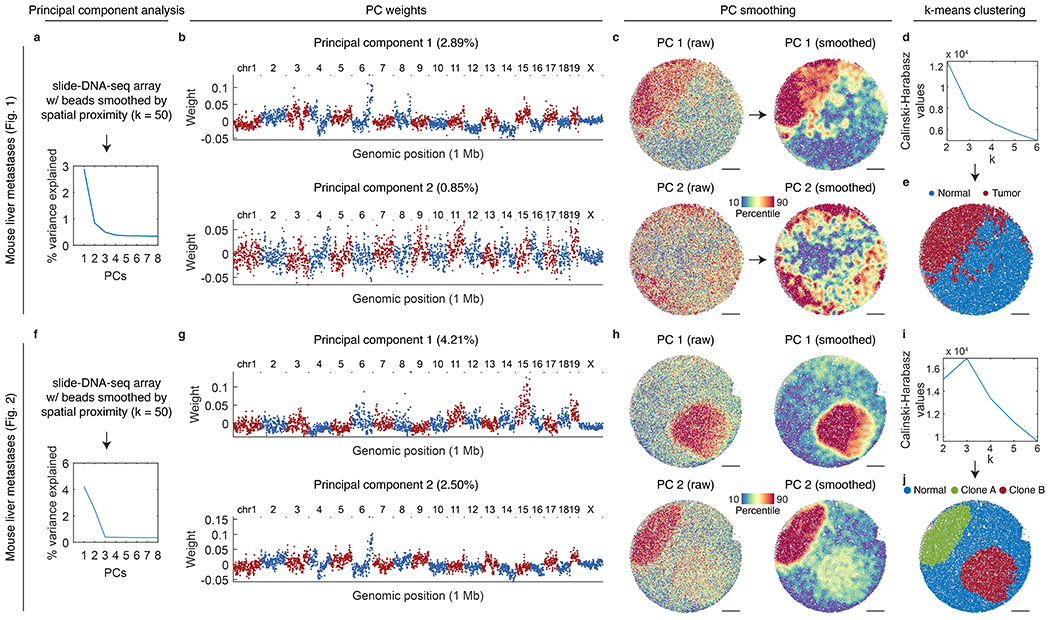
a, Principal components calculated from smoothed slide-DNA-seq beads, ordered by the percentage of variance explained for the mouse liver metastases array shown in Fig. 1. b, Weights per 1 Mb genomic bin for principal components 1 and 2. Red points indicate bins from chromosomes with an odd number, blue from chromosomes with an even number (and chrX). c, slide-DNA-seq array for the mouse liver metastases array shown in Fig. 1 with points colored by raw PC 1 scores (top left), smoothed PC 1 scores (top right), raw PC 2 scores (bottom left), smoothed PC 2 scores (bottom right). d, Calinski-Harabasz criterion values used to select the optimal value of k for k-means clustering. e, slide-DNA-seq array colored by cluster assignment using the value of k selected in d. f-j, Same as a-e, but for the mouse liver metastases array shown in Fig. 2.
Extended Data Figure 8: Accuracy of clonal assignment via downsampling of bulk tumor cell lines.
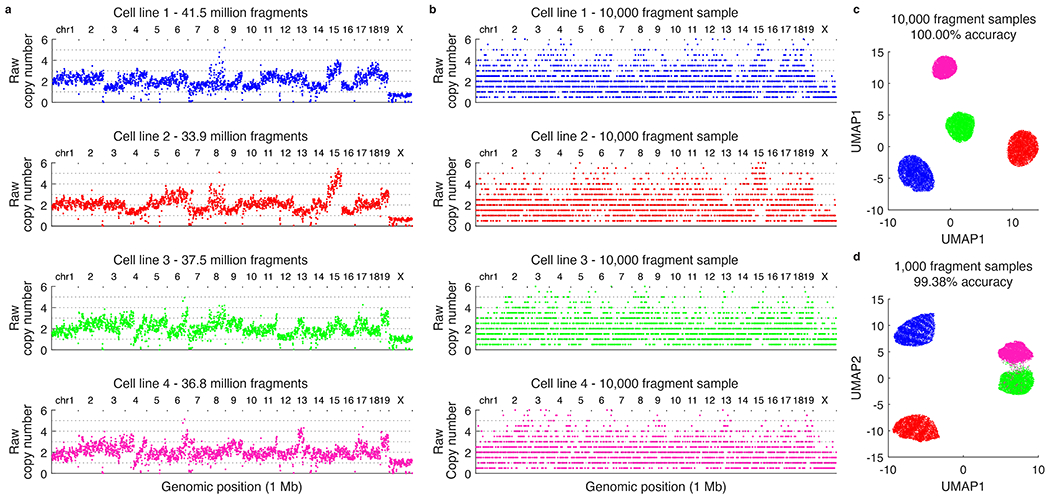
a, Raw copy number profiles for four tumor cell lines profiled using tagmentation-based bulk sequencing. b, Representative 10,000 fragments samples of the cell lines shown in a. c, Clonal assignment accuracy for 10,000 fragment samples (n=5,000 samples of each cell line) using the analysis workflow shown in Extended Data Fig. 7. d, Same as c but for 1,000 fragment samples.
Extended Data Figure 9: Reproducibility of slide-DNA-seq across serial sections.
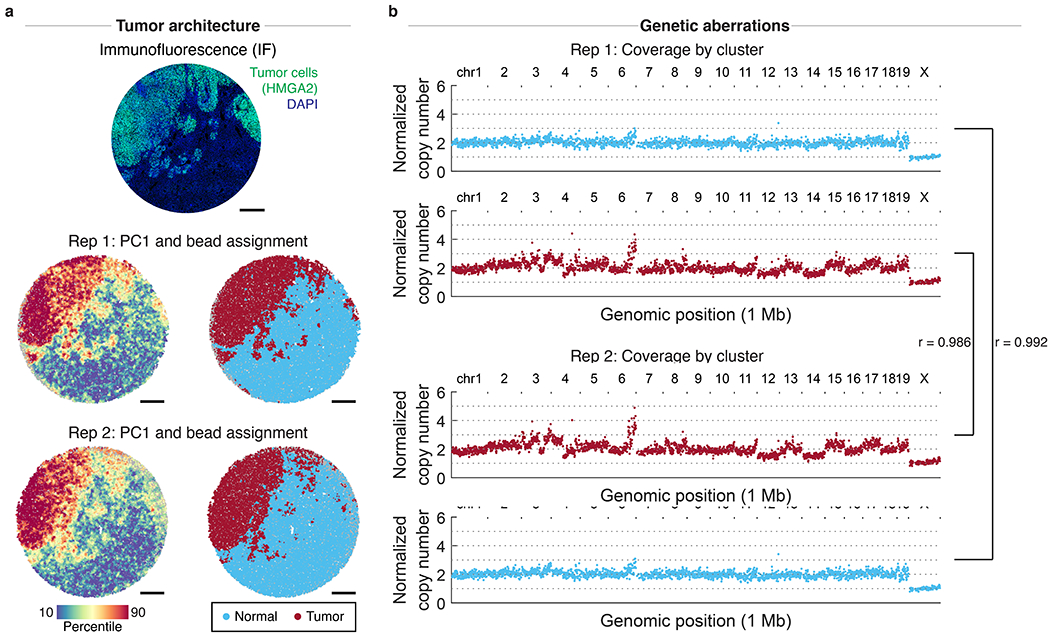
a, Immunofluorescence (IF) against tumor marker HMGA2 (top) and two slide-DNA-seq replicates (center, bottom) were performed on two serial sections of a mouse liver metastasis. Beads colored by PC1 scores (left) and cluster assignment (right) show similar spatial architecture between replicates. Scale bars, 500 μm. b, Aggregate copy number profiles of normal and tumor beads show high correlation (Pearson’s r = 0.986 and 0.992) between the two replicates.
Extended Data Figure 10: Quantification of genomic coverage by bin size and number of beads.
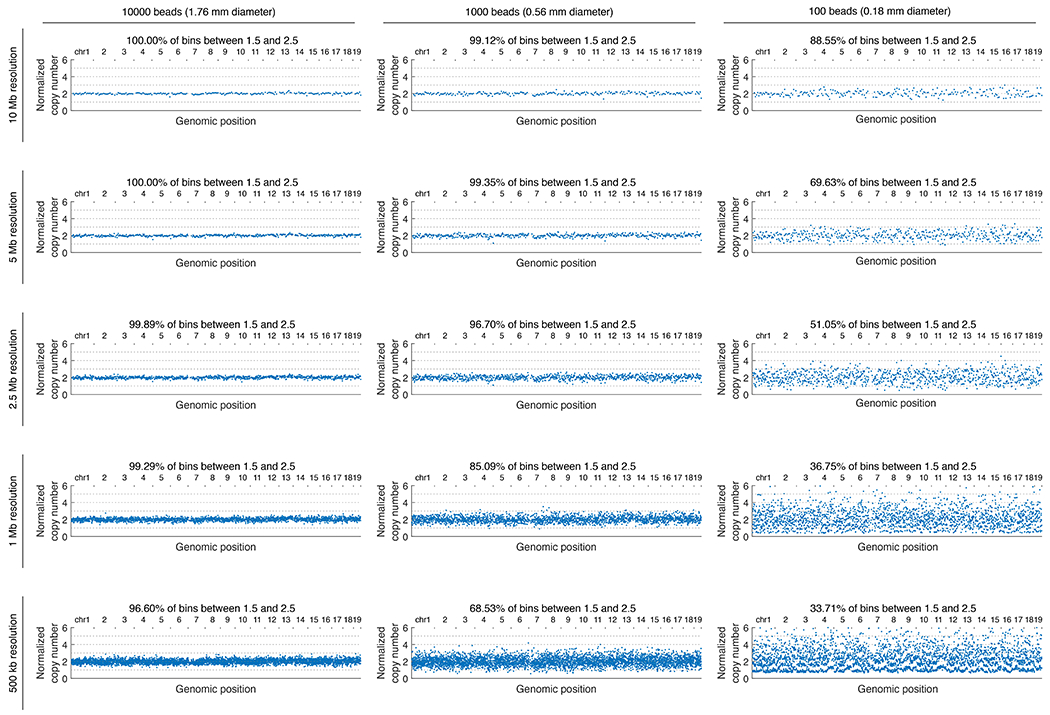
Each column represents normalized copy number profiles aggregated across the number of slide-DNA-seq beads indicated (10,000; 1,000; or 100), while each row indicates the genomic bin size (10 Mb, 5 Mb, 2.5 Mb, 1 Mb, and 500 kb) for the mouse cerebellum array.
Extended Data Figure 11: Integrated slide-RNA-seq and single-nucleus RNA-seq analysis of clones.
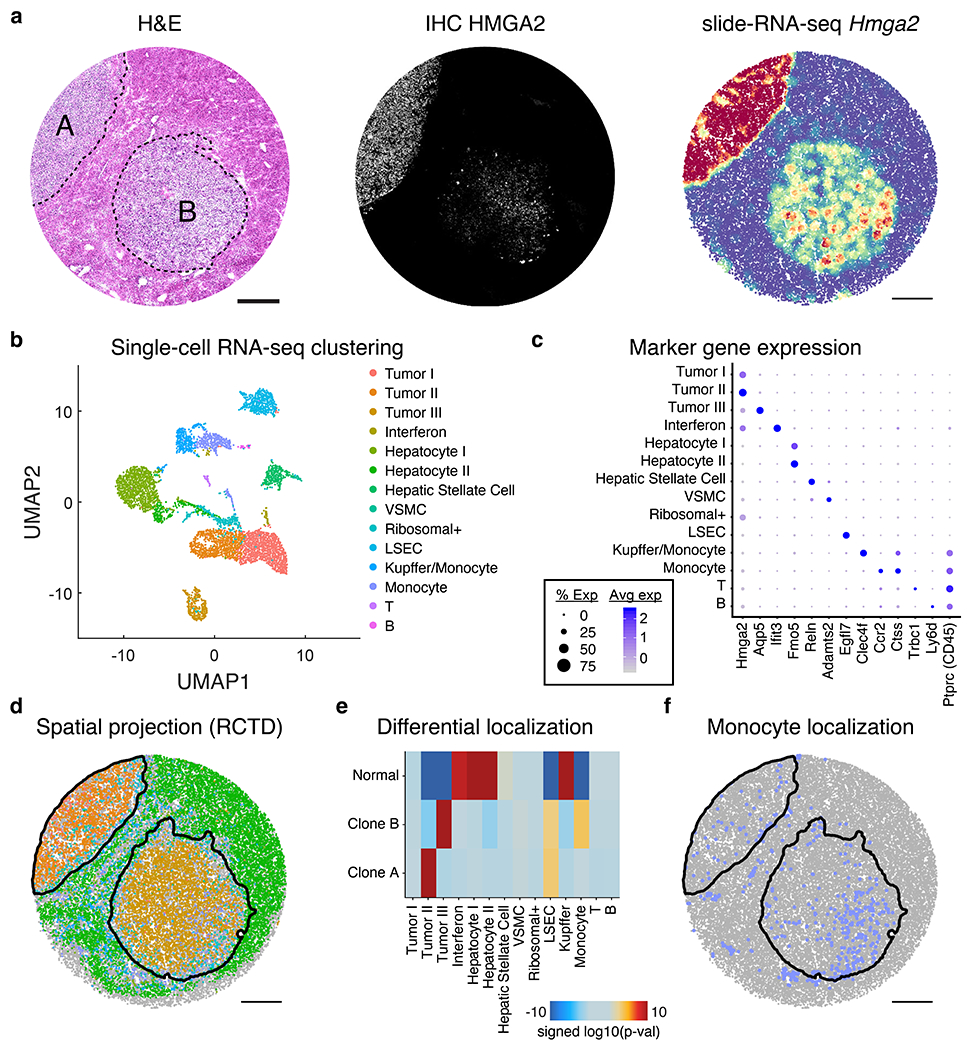
a, H&E stain (left), IHC against tumor marker HMGA2 (center), and Hmga2 expression from slide-RNA-seq (right) of three serial sections of mouse liver metastases. b, UMAP of unsupervised clustering of single nucleus RNA-seq performed on nuclei from mouse liver metastasis sample. c, Dot plot showing the expression of marker genes used to annotate clusters in b. d, Spatial projection of cell types from b onto the slide-RNA-seq array, colored in the same fashion. Black lines indicate spatial tumor clusters. e, Differential localization of cell types between clone A, clone B and normal regions. Heatmap shows signed (positive, enrichment; negative, depletion) log10(p-value) from permutation testing (two-sided, not adjusted for multiple comparisons). f, Spatial plot of monocyte localization on the array, which is significantly enriched for clone B. Black lines indicate spatial tumor clusters. VSMC, vascular smooth muscle cell; LSEC, liver sinusoidal endothelial cells.
Extended Data Figure 12: Validation of ploidy and copy number of metastatic clones.
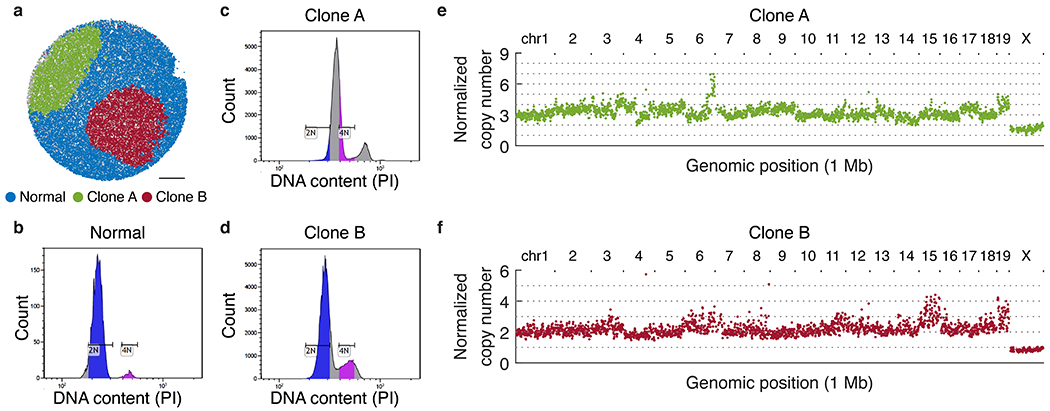
a, Assignment of beads to normal tissue, clone A, and clone B based on k-means clustering. b-d, Histogram of DNA content of single cells measured by propidium iodide (PI) fluorescence intensity through flow cytometry. (b) bone marrow cells (normal control); (c) clone A; (d) clone B. Diploid G1 (2N) and G2 (4N) gates are determined on bone marrow histogram and applied to clones A and B, revealing that the clone A genome is triploid; and the clone B genome is diploid with some amplifications (e.g. of chr. 15 and 19, see Fig. 2d). e, Aggregate copy number profiles of beads assigned to clone A. f, Aggregate copy number profiles of beads assigned to clone B.
Extended Data Figure 13: Spatial projection of single-cell whole-genome sequencing (scWGS) clusters.
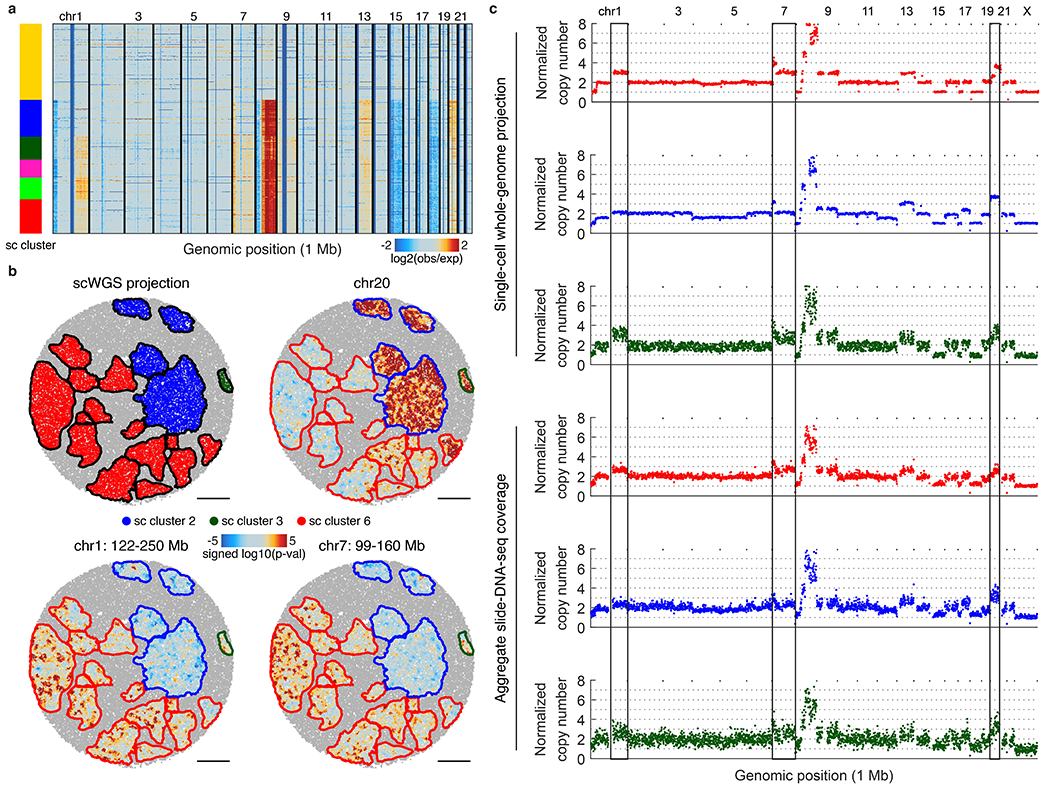
a, Genomic copy number profiles for 2,274 single cells obtained using scWGS, with cluster annotations colored. b, Top left: projection of scWGS clusters onto slide-DNA-seq. All other: three genomic regions of differential CNA profiles between the three projected clusters, shown are spatial heatmaps of signed p-value differences from the average profile (two-sided permutation test, not adjusted for multiple comparisons). c, Normalized copy number profiles for the three scWGS clusters, and the corresponding spatial clusters. Vertical lines denote variable regions from b. Single-cell cluster 2 (blue) shows complex CNA patterns that obscure cluster ploidy, nevertheless, copy number values are normalized to 2 for easy comparison to other clusters.
Extended Data Figure 14: Tumor morphology of primary human colon cancer sample.
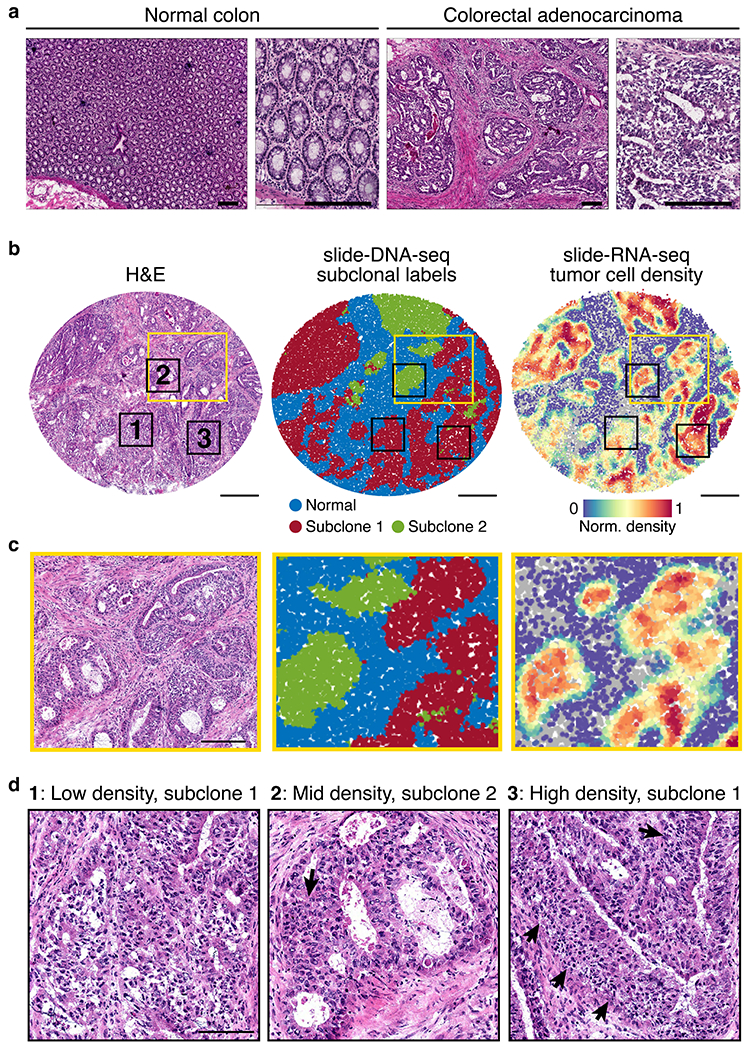
a, H&E stain of normal colon (left) and colon tumor (right) tissue from the same patient. Scale bars, 200 μm. b, Serial sections processed for H&E stain (left), slide-DNA-seq (center), and slide-RNA-seq (right). Scale bars, 500 μm. Yellow and black boxes indicate magnified areas in c and d, respectively. c, Magnified views of H&E stain, slide-DNA-seq and slide-RNA-seq reconstructions show concordant spatial tissue architecture across three modalities; scale bar, 200 μm. d, Magnified view of H&E stain of three regions that are assigned low, medium, and high tumor density by slide-RNA-seq transcriptomic analysis (b, right). Arrows indicate regions of high tumor density identified through H&E stain. Scale bar, 100 μm.
Extended Data Figure 15: Biological pathways explained by subclone or tumor density.
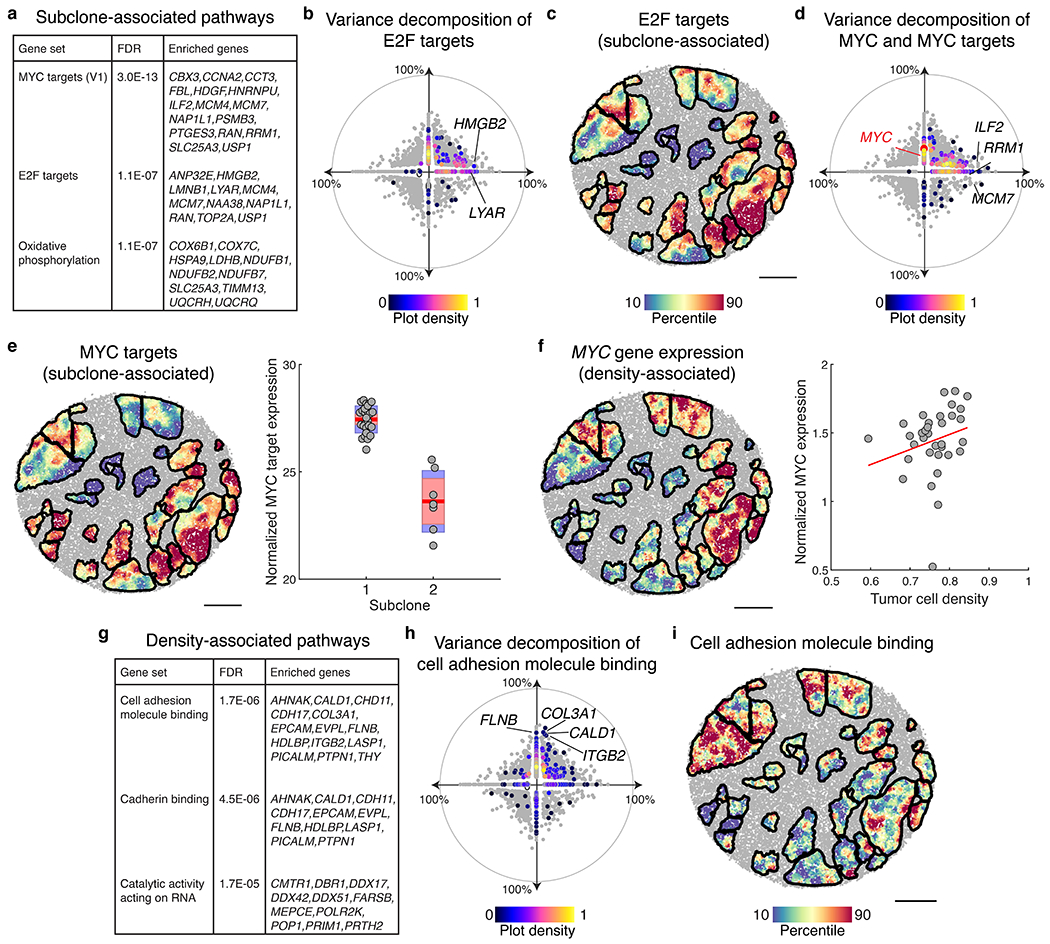
a, Subclone-associated pathways identified through gene set enrichment analysis. b, Hallmark E2F target genes (n=200) plotted according to percent variance explained by clonal identity (x-axis) and tumor density (y-axis). Included genes colored by normalized density on the scatter plot, all other genes are shown in grey. c, Expression of highly subclone-associated E2F target genes (n=11, listed in a), plotted for spatial tumor regions of the slide-RNA-seq array from Fig. 4. d, MYC target genes (n=200) plotted according to percent variance explained by clonal identity (x-axis) and tumor density (y-axis). Included genes are colored by normalized density on the scatter plot, MYC is colored red, all other genes are shown in grey. e, Expression of highly subclone-associated MYC target genes (n=16, listed in a), plotted for spatial tumor regions (left). Box plot showing normalized MYC target gene expression by subclone assignment; each point represents a spatial tumor cluster (right). Red line, mean, red box, 95% confidence interval for mean, blue box, standard deviation. f, MYC expression plotted for spatial tumor regions (left). Scatter plot showing normalized MYC expression by tumor cell density; each point represents a spatial tumor cluster (right). g, Subclone-associated pathways identified through gene set enrichment analysis. h, Cell adhesion molecule binding genes (n=514) plotted according to percent variance explained by clonal identity (x-axis) and tumor density (y-axis). Included genes are colored by normalized density on the scatter plot, all other genes are shown in grey (reproduced from Fig. 4i). i, Expression of highly density-associated cell adhesion molecule binding genes (n=14, listed in g), plotted for spatial tumor regions. Scale bars, 500 μm.
Supplementary Material
Supplementary Table 1: DNA oligo sequences
Supplementary Table 2: Samples used in this study
Supplementary Table 3: Marker genes for snRNA-seq clusters (relating to Fig. 2)
Supplementary Table 4: DEGs between clone A and clone B in mouse liver (relating to Fig. 2)
Supplementary Table 5: Significant genes from variance decomposition analysis (relating to Fig. 4)
Acknowledgements:
J.D.B. and F.C. acknowledge funding from the Allen Institute Distinguished Investigator award and funding from the NIH R21HG009749. F.C. also acknowledges funding from NIH DP5OD024583, R33CA246455, and NIH R01HG010647. J.D.B. acknowledge support from the NIH New Innovator Award (DP2HL151353). Z.D.C. acknowledges funding from NHGRI training grant T32HG002295 and the Harvard Quantitative Biology Initiative. We thank Jonathan Strecker for the gift of Tn5 enzyme, and the Buenrostro and Chen labs for helpful discussions. Furthermore, we thank the cancer patients and their families for their invaluable donations to science, making this work possible.
Competing interests:
E.Z.M. and F.C. are listed as inventors on a patent application related to Slide-seq. T.J. is a member of the Board of Directors of Amgen and Thermo Fisher Scientific. He is also a co-Founder of Dragonfly Therapeutics and T2 Biosystems. T.J. serves on the Scientific Advisory Board of Dragonfly Therapeutics, SQZ Biotech, and Skyhawk Therapeutics, and is the President of Break Through Cancer. J.D.B. holds patents related to ATAC-seq and is on the scientific advisory board for Camp4, Seqwell, and Celsee. F.C. is a paid consultant for Celsius Therapeutics and Atlas Bio. E.Z.M is a paid consultant for Atlas Bio. T.Z., J.D.B. and F.C. have filed a patent application on this work.
Footnotes
Supplementary Information is available for this paper.
Code availability
Code for the in situ bead indexing is available from https://github.com/broadchenf/Slideseq. Code for all analyses are available from https://github.com/buenrostrolab/slide_dna_seq_analysis and archived at https://doi.org/10.5281/zenodo.5553305.
Data availability
Raw sequencing data is available from the Sequence Read Archive (SRA) at accession PRJNA768453. Spatial barcode locations and counts matrices are available from the Broad Institute Single Cell Portal (https://singlecell.broadinstitute.org/single_cell/study/SCP1278).
GC-content tracks for hg19 and mm10 were downloaded from the UC Santa Cruz Genome Browser. k36 mappability tracks for both genomes were downloaded from https://bismap.hoffmanlab.org/. Replication timing data was downloaded from GEO accession GSM923451 for hg19 and GSE137764 for mm10. Tn5 insertion bias tracks for both genomes were generated using the bias command from pyatac (https://nucleoatac.readthedocs.io/en/latest/pyatac/). Gene sets were downloaded from the Molecular Signatures Database Collections (MSigDB, http://www.gsea-msigdb.org/gsea/msigdb/collections.jsp).
References
- 1.McGranahan N & Swanton C Clonal Heterogeneity and Tumor Evolution: Past, Present, and the Future. Cell 168, 613–628 (2017). [DOI] [PubMed] [Google Scholar]
- 2.Turajlic S, Sottoriva A, Graham T & Swanton C Resolving genetic heterogeneity in cancer. Nat. Rev. Genet 20, 404–416 (2019). [DOI] [PubMed] [Google Scholar]
- 3.Ramón y Cajal S et al. Clinical implications of intratumor heterogeneity: challenges and opportunities. J. Mol. Med 98, 161–177 (2020). [DOI] [PMC free article] [PubMed] [Google Scholar]
- 4.Pogrebniak KL & Curtis C Harnessing Tumor Evolution to Circumvent Resistance. Trends Genet. 34, 639–651 (2018). [DOI] [PMC free article] [PubMed] [Google Scholar]
- 5.Duan Q, Zhang H, Zheng J & Zhang L Turning Cold into Hot: Firing up the Tumor Microenvironment. Trends Cancer Res. 6, 605–618 (2020). [DOI] [PubMed] [Google Scholar]
- 6.Jin M-Z & Jin W-L The updated landscape of tumor microenvironment and drug repurposing. Signal Transduct Target Ther 5, 166 (2020). [DOI] [PMC free article] [PubMed] [Google Scholar]
- 7.Tse JM et al. Mechanical compression drives cancer cells toward invasive phenotype. Proc. Natl. Acad. Sci. U. S. A 109, 911–916 (2012). [DOI] [PMC free article] [PubMed] [Google Scholar]
- 8.Zhao Y et al. Selection of metastasis competent subclones in the tumour interior. Nature Ecology & Evolution vol. 5 1033–1045 (2021). [DOI] [PMC free article] [PubMed] [Google Scholar]
- 9.Stylianopoulos T, Munn LL & Jain RK Reengineering the Physical Microenvironment of Tumors to Improve Drug Delivery and Efficacy: From Mathematical Modeling to Bench to Bedside. Trends Cancer Res. 4, 292–319 (2018). [DOI] [PMC free article] [PubMed] [Google Scholar]
- 10.Gerstung M et al. The evolutionary history of 2,658 cancers. Nature 578, 122–128 (2020). [DOI] [PMC free article] [PubMed] [Google Scholar]
- 11.Landau DA et al. Evolution and impact of subclonal mutations in chronic lymphocytic leukemia. Cell 152, 714–726 (2013). [DOI] [PMC free article] [PubMed] [Google Scholar]
- 12.Wang Y et al. Clonal evolution in breast cancer revealed by single nucleus genome sequencing. Nature 512, 155–160 (2014). [DOI] [PMC free article] [PubMed] [Google Scholar]
- 13.Xu X et al. Single-cell exome sequencing reveals single-nucleotide mutation characteristics of a kidney tumor. Cell 148, 886–895 (2012). [DOI] [PMC free article] [PubMed] [Google Scholar]
- 14.Minussi DC et al. Breast tumours maintain a reservoir of subclonal diversity during expansion. Nature 592, 302–308 (2021). [DOI] [PMC free article] [PubMed] [Google Scholar]
- 15.Casasent AK et al. Multiclonal Invasion in Breast Tumors Identified by Topographic Single Cell Sequencing. Cell 172, 205–217.e12 (2018). [DOI] [PMC free article] [PubMed] [Google Scholar]
- 16.McPherson A et al. Divergent modes of clonal spread and intraperitoneal mixing in high-grade serous ovarian cancer. Nat. Genet 48, 758–767 (2016). [DOI] [PubMed] [Google Scholar]
- 17.Jamal-Hanjani M et al. Tracking the Evolution of Non-Small-Cell Lung Cancer. N. Engl. J. Med 376, 2109–2121 (2017). [DOI] [PubMed] [Google Scholar]
- 18.Payne AC et al. In situ genome sequencing resolves DNA sequence and structure in intact biological samples. Science (2020) doi: 10.1126/science.aay3446. [DOI] [PMC free article] [PubMed] [Google Scholar]
- 19.Rodriques SG et al. Slide-seq: A scalable technology for measuring genome-wide expression at high spatial resolution. Science 363, 1463–1467 (2019). [DOI] [PMC free article] [PubMed] [Google Scholar]
- 20.Stickels RR et al. Highly sensitive spatial transcriptomics at near-cellular resolution with Slide-seqV2. Nature Biotechnology (2020) doi: 10.1038/s41587-020-0739-1. [DOI] [PMC free article] [PubMed] [Google Scholar]
- 21.Adey A et al. Rapid, low-input, low-bias construction of shotgun fragment libraries by high-density in vitro transposition. Genome Biol. 11, R119 (2010). [DOI] [PMC free article] [PubMed] [Google Scholar]
- 22.Buenrostro JD, Giresi PG, Zaba LC, Chang HY & Greenleaf WJ Transposition of native chromatin for fast and sensitive epigenomic profiling of open chromatin, DNA-binding proteins and nucleosome position. Nat. Methods 10, 1213–1218 (2013). [DOI] [PMC free article] [PubMed] [Google Scholar]
- 23.McFadden DG et al. Genetic and clonal dissection of murine small cell lung carcinoma progression by genome sequencing. Cell 156, 1298–1311 (2014). [DOI] [PMC free article] [PubMed] [Google Scholar]
- 24.Johnson L et al. Somatic activation of the K-ras oncogene causes early onset lung cancer in mice. Nature 410, 1111–1116 (2001). [DOI] [PubMed] [Google Scholar]
- 25.LaFave LM et al. Epigenomic State Transitions Characterize Tumor Progression in Mouse Lung Adenocarcinoma. Cancer Cell 38, 212–228.e13 (2020). [DOI] [PMC free article] [PubMed] [Google Scholar]
- 26.Morishita A et al. HMGA2 is a driver of tumor metastasis. Cancer Res. 73, 4289–4299 (2013). [DOI] [PMC free article] [PubMed] [Google Scholar]
- 27.Thuault S et al. Transforming growth factor-beta employs HMGA2 to elicit epithelial-mesenchymal transition. J. Cell Biol 174, 175–183 (2006). [DOI] [PMC free article] [PubMed] [Google Scholar]
- 28.Kumar MS et al. HMGA2 functions as a competing endogenous RNA to promote lung cancer progression. Nature 505, 212–217 (2014). [DOI] [PMC free article] [PubMed] [Google Scholar] [Retracted]
- 29.Cable DM, Murray E, Zou LS, Goeva A & Macosko EZ Robust decomposition of cell type mixtures in spatial transcriptomics. bioRxiv (2020). [DOI] [PMC free article] [PubMed] [Google Scholar]
- 30.Dienstmann R et al. Consensus molecular subtypes and the evolution of precision medicine in colorectal cancer. Nat. Rev. Cancer 17, 268 (2017). [DOI] [PubMed] [Google Scholar]
- 31.Network TCGA & The Cancer Genome Atlas Network. Comprehensive molecular characterization of human colon and rectal cancer. Nature vol. 487 330–337 (2012). [DOI] [PMC free article] [PubMed] [Google Scholar]
- 32.Kang H et al. Many private mutations originate from the first few divisions of a human colorectal adenoma. J. Pathol 237, 355–362 (2015). [DOI] [PMC free article] [PubMed] [Google Scholar]
- 33.Humphries A et al. Lineage tracing reveals multipotent stem cells maintain human adenomas and the pattern of clonal expansion in tumor evolution. Proc. Natl. Acad. Sci. U. S. A 110, E2490–9 (2013). [DOI] [PMC free article] [PubMed] [Google Scholar]
- 34.Brayer KJ, Frerich CA, Kang H & Ness SA Recurrent Fusions in MYB and MYBL1 Define a Common, Transcription Factor-Driven Oncogenic Pathway in Salivary Gland Adenoid Cystic Carcinoma. Cancer Discov. 6, 176–187 (2016). [DOI] [PMC free article] [PubMed] [Google Scholar]
- 35.Wang B, Matsuoka S, Carpenter PB & Elledge SJ 53BP1, a mediator of the DNA damage checkpoint. Science 298, 1435–1438 (2002). [DOI] [PubMed] [Google Scholar]
- 36.Long DT, Räschle M, Joukov V & Walter JC Mechanism of RAD51-dependent DNA interstrand cross-link repair. Science 333, 84–87 (2011). [DOI] [PMC free article] [PubMed] [Google Scholar]
- 37.Lachaud C et al. Ubiquitinated Fancd2 recruits Fan1 to stalled replication forks to prevent genome instability. Science 351, 846–849 (2016). [DOI] [PMC free article] [PubMed] [Google Scholar]
- 38.Sottoriva A et al. A Big Bang model of human colorectal tumor growth. Nat. Genet 47, 209–216 (2015). [DOI] [PMC free article] [PubMed] [Google Scholar]
- 39.Landrette SF et al. Plag1 and Plagl2 are oncogenes that induce acute myeloid leukemia in cooperation with Cbfb-MYH11. Blood 105, 2900–2907 (2005). [DOI] [PubMed] [Google Scholar]
- 40.Ren B et al. MCM7 amplification and overexpression are associated with prostate cancer progression. Oncogene 25, 1090–1098 (2006). [DOI] [PubMed] [Google Scholar]
- 41.Farhad M, Rolig AS & Redmond WL The role of Galectin-3 in modulating tumor growth and immunosuppression within the tumor microenvironment. Oncoimmunology 7, e1434467 (2018). [DOI] [PMC free article] [PubMed] [Google Scholar]
- 42.Karim BO, Rhee K-J, Liu G, Yun K & Brant SR Prom1 function in development, intestinal inflammation, and intestinal tumorigenesis. Front. Oncol 4, 323 (2014). [DOI] [PMC free article] [PubMed] [Google Scholar]
- 43.Winkler J, Abisoye-Ogunniyan A, Metcalf KJ & Werb Z Concepts of extracellular matrix remodelling in tumour progression and metastasis. Nat. Commun 11, 5120 (2020). [DOI] [PMC free article] [PubMed] [Google Scholar]
- 44.Wu C-Y et al. Integrative single-cell analysis of allele-specific copy number alterations and chromatin accessibility in cancer. Nat. Biotechnol (2021) doi: 10.1038/s41587-021-00911-w. [DOI] [PMC free article] [PubMed] [Google Scholar]
- 45.Wu S et al. Circular ecDNA promotes accessible chromatin and high oncogene expression. Nature 575, 699–703 (2019). [DOI] [PMC free article] [PubMed] [Google Scholar]
- 46.Integrative HMP (iHMP) Research Network Consortium. The Integrative Human Microbiome Project. Nature 569, 641–648 (2019). [DOI] [PMC free article] [PubMed] [Google Scholar]
- 47.van Haasteren J, Li J, Scheideler OJ, Murthy N & Schaffer DV The delivery challenge: fulfilling the promise of therapeutic genome editing. Nat. Biotechnol 38, 845–855 (2020). [DOI] [PubMed] [Google Scholar]
- 48.Goldman N et al. Towards practical, high-capacity, low-maintenance information storage in synthesized DNA. Nature 494, 77–80 (2013). [DOI] [PMC free article] [PubMed] [Google Scholar]
- 49.Ludwig LS et al. Lineage Tracing in Humans Enabled by Mitochondrial Mutations and Single-Cell Genomics. Cell 176, 1325–1339.e22 (2019). [DOI] [PMC free article] [PubMed] [Google Scholar]
- 50.Liu Y et al. Bisulfite-free direct detection of 5-methylcytosine and 5-hydroxymethylcytosine at base resolution. Nat. Biotechnol 37, 424–429 (2019). [DOI] [PubMed] [Google Scholar]
Associated Data
This section collects any data citations, data availability statements, or supplementary materials included in this article.
Supplementary Materials
Supplementary Table 1: DNA oligo sequences
Supplementary Table 2: Samples used in this study
Supplementary Table 3: Marker genes for snRNA-seq clusters (relating to Fig. 2)
Supplementary Table 4: DEGs between clone A and clone B in mouse liver (relating to Fig. 2)
Supplementary Table 5: Significant genes from variance decomposition analysis (relating to Fig. 4)
Data Availability Statement
Raw sequencing data is available from the Sequence Read Archive (SRA) at accession PRJNA768453. Spatial barcode locations and counts matrices are available from the Broad Institute Single Cell Portal (https://singlecell.broadinstitute.org/single_cell/study/SCP1278).
GC-content tracks for hg19 and mm10 were downloaded from the UC Santa Cruz Genome Browser. k36 mappability tracks for both genomes were downloaded from https://bismap.hoffmanlab.org/. Replication timing data was downloaded from GEO accession GSM923451 for hg19 and GSE137764 for mm10. Tn5 insertion bias tracks for both genomes were generated using the bias command from pyatac (https://nucleoatac.readthedocs.io/en/latest/pyatac/). Gene sets were downloaded from the Molecular Signatures Database Collections (MSigDB, http://www.gsea-msigdb.org/gsea/msigdb/collections.jsp).


