

Abstract

The use of blast furnace gas (BFG) as a fuel provides an alternative for waste stream valorization in the steel industry, enhancing the sustainability and decarbonization of its processes. Nevertheless, the implementation of this solution on an industrial scale requires a continuous control of the combustion due to the low calorific value of BFG. This work analyzes the combustion behavior and monitoring of BFG/CH4 blends in a laboratory premixed fuel burner. We evaluate several stable combustion conditions by burning different BFG/CH4 mixtures at a constant power rate over a wide range of air/fuel equivalence ratios. In addition, relevant image features and chemiluminescence emission spectra have been extracted from flames, using advanced optical devices. BFG combustion causes an increase in CO2 and CO emissions, since those fuels are the main fuel components of the mixture. On the other hand, NOx emissions decreased because of the low temperature of combustion of the BFG and its mixtures. Chemiluminescence shows that, in the case of CH4 combustion, peaks associated with hydrocarbons are present, while during the substitution of CH4 by BFG those peaks are attenuated. Image flame features extracted from both ultraviolet and visible bandwidths show a correlation with the fuel blend and air/fuel equivalence ratio. In the end, methodologies developed in this work have been proven to be valuable alternatives with a high potential for the monitoring and control of BFG cofiring for the steel industry.
1. Introduction
Currently, energy-intensive industries are directing their processes toward more sustainable models. Thus, industrial processes can increase their efficiency and reduce pollutant emissions. In order to meet these objectives, several strategies are being promoted, such as waste heat recovery,1 waste stream valorization,2 and electrical flexibility.3 In the case of the steel industry, multiple waste gas streams with calorific value are produced. One of these streams is blast furnace gas (BFG), a byproduct of the chemical reduction of iron ore developed in blast furnaces. BFG can be valorized through combustion for different processes, such as gas turbines, steelmaking–annealing lines, or reheating of furnaces.4−6 Among all these applications, the steel industry is highly interested in BFG valorization within the same facility where it is produced. Nevertheless, the combustion of BFG in steelmaking processes faces several drawbacks. Due to the large concentration of inert gases in its composition, blast furnace gas does not provide enough thermal energy to meet the temperature requirements of steelmaking processes.7 Several strategies have been used to overcome this, such as preheated combustion air and a higher calorific gas as a support fuel. In Europe, BFG is usually mixed with natural gas (NG), while in other regions, such as Brazil, India, and China, BFG is blended with other fuels, such as fuel oil.8 Furthermore, the low calorific value of the BFG also results in more unstable combustion,6,7 which may move the operation toward suboptimal conditions and even produce flame extinction. Therefore, BFG combustion needs to be monitored and controlled to correct suboptimal conditions. Traditional sensors can be used to monitor the fuel and airflow of each furnace burner. However, the high number of burners in industrial furnaces increases the cost of this alternative and limits its application. Therefore, the steel industry has searched for novel combustion monitoring systems based on optical techniques, which have been scarcely reported in the open literature on industrial-level applications.9 Implementing such monitoring systems on such a large scale requires a complex development with extensive studies at laboratory, semi-industrial, and industrial scales. In this aspect, studies of the different scales have not been previously considered.
Several advanced optical techniques have been used to monitor and control the combustion process. They involve analyzing energy radiated by the flames, which depends on various combustion factors. For diffusion flames, energy emission is dominated by continuous radiation (black-body emission) related to soot production.10,11 In contrast, the emission of premixed flames is mainly characterized by multiple emissions in discrete wavelengths, related to the transition of intermediate combustion radicals from excited to ground states, known as chemiluminescence,10 which is affected by the reactant composition and equivalence ratio.10,12
In order to study the chemiluminescence phenomenon, optical instruments, such as spectrometers and cameras, have been extensively employed to capture spectra and flame images, respectively. In most cases, a huge amount of collected information needs to be processed to extract specific features to characterize flames for different fuel blends,13 air or fuel flows,13,14 air swirls,15 and temperatures.16
First, spectrometers capture chemiluminescence emissions from the ultraviolet (UV) to the infrared (IR) ranges, associating specific wavelengths with the reaction of chemical species. Combustion studies are typically focused on detecting combustion radicals such as OH*, CH*, C2*, and CO2*. On one hand, OH*, CH*, and C2* provide narrow-band emissions at around 310 nm (OH*),17−23 430 nm (CH*),17−23 470 nm (C2*),17,19,21 and 515 nm (also C2*).17−21,23 On the other hand, CO2* is related to broad-band emissions from approximately 350 to 610 nm.17,18,20,21
Second, research on combustion chemiluminescence can also be developed with imaging techniques. For that purpose, cameras for UV, visible (vis), and IR ranges are set up with narrow-band filters to only measure light emissions related to the relevant radicals.22,24−26 For example, the measurement of OH* emissions with imaging techniques enables the characterization of premixed flame fronts.22,26,27 In addition, hyperspectral cameras can also be used to measure light emissions of several radicals simultaneously.28
Finally, cameras without narrow-band filters can also be used to characterize flame radiation, usually measuring the VIS range. Most studies use statistical characteristics of the image pixel values,13−16,29−32 which are related to the intensity of light emissions. Additionally, other methods can also compute texture14,33 and geometrical characteristics15,31,34−36 and flame speeds.37,38 Before the characteristics are extracted from the image, several preprocessing techniques are used. These preprocessing techniques include the averaging of image sequences,29,30,32 flame segmentation with thresholding,13,15,16 noise filters,14 color space conversions to grayscale,15 and finally hue, saturation, and intensity (HSI).31,36
The present research aims to characterize the combustion of BFG for the partial replacement of CH4 in a premixed laboratory-scale burner. For that purpose, three optical devices are simultaneously employed to provide a more complete and robust insight into the combustion process. Flame emissions are measured by a spectrometer, a UV–vis camera with a narrow-band filter, and a vis camera. Spectra and image features are analyzed for different fuel blends, air/fuel equivalence ratios, and flue gas compositions. Furthermore, this research constitutes the first step toward the development of a novel combustion monitoring system based on optical techniques to enable BFG cofiring with NG in steelmaking furnaces.
2. Materials and Methods
The present section describes the methodology used in the research. The final aim of the work is the the diagnosis of combustion on the basis of flame optical parameters, and it is mainly intended for industrial furnaces. The experimental procedures have been defined similarly to those of an industrial environment, where the level of tunability and configuration of the commercial burners is limited. This way, by defining a similar procedure for laboratory and industrial scales, the methodology developed in the laboratory can be implemented in industry with lower barriers.
2.1. Experimental Setup
Tests were carried out in a customized combustion chamber equipped with a 20 kWth premixed gas fuel burner, designed to enable extensive visual characterization and flue gas measurements. Figure 1 shows the overall scheme of the facility. The fuel and air enter the premixed gas fuel burner through two separate inlets (25 and 10 mm diameters, respectively) (Figure 2a). The fuel/air mixture leaves the burner via a 100 mm diameter header and a pattern of holes of 5 mm, as shown in Figure 2a. Although different headers can be used for each fuel in order to optimize the working conditions in this research, the same header has been used. This way, standard procedures are simulated on an industrial scale. The flame generated is enclosed in a sealed combustion chamber with a width and depth of 65 cm and a height of 90 cm (see Figure 2b). The chamber is equipped with both quartz and glass inspection windows in order to enable energy transmission in the UV and VIS ranges, respectively. A pilot flame is used to start the combustion, which increases the facility’s safety by burning the remaining fuel from previous operations.
Figure 1.

Scheme of the experimental facility.
Figure 2.

(a) Scheme of the premixed gas fuel burner and (b) example of a flame generated in the test combustion chamber.
The burner is fed with bottles of gaseous fuels whose mixtures are blended by a gas supplier. The gaseous fuels feed the burner via two independent gas lines designed to admit gaseous fuels of highly different heating values. For CH4, one line with a batch of one bottle is used. For the BFG and mixtures, a line connected to a batch of eight bottles is employed, which allows carrying out the tests continuously, despite the high consumption of fuel. The amount of gas fed to the burner is measured by a volumetric flow meter. The facility also has a safety system to stop the fuel supply when leakages are detected.
The combustion air is supplied by a compressor, whose pressure (and thus flow rate) is controlled by an SMC ITV2000 electropneumatic regulator. Before burner connection, the airflow rate is measured by an IFM SD6000 flow switch, with a repeatability of ±1.5% and an accuracy of ±(3% reading + 0.3% full scale). The electropneumatic regulator and flow switch communicate with a computer through a data acquisition system, which also collects the flue gas temperature measured by a thermocouple. Since flue gas temperatures were measured at the exhaust duct of the test rig, they are only qualitative measurements. Thus, these flue gas temperatures are not representative of the combustion and product behavior.
Furthermore, exhaust gas emissions were measured with an MRU Vario Plus Industrial gas analyzer. Concentrations of O2, CO, CO2, NOx, and CH4 in the combustion gases were measured with the a analyzer, whose measurement principles, ranges of measurement, and accuracies are summarized in Table 1.
Table 1. Specifications of the Gas Analyzer.
| gas | measurement principle | range | accuracy |
|---|---|---|---|
| O2 | electrochemical | 0–21.0 %v | ±0.2 %v abs |
| CH4 | nondispersive infrared (NDIR) | 0–10000 ppm | ±60 ppm or 5% reading |
| CO | NDIR | 0–10000 ppm | ±40 ppm or 5% reading |
| CO2 | NDIR | 0–30 %v | ±0.5% or 3% reading |
| NO | electrochemical | 0–1000 ppm (up to 5000 ppm) | ±5 ppm or 5% reading ≤1000 ppm |
| 10% reading >1000 ppm | |||
| NO2 | electrochemical | 0–200 ppm (up to 1000 ppm) | ±5 ppm or 5% reading ≤200 ppm |
| 10% reading >200 ppm |
Three optical devices were employed to characterize the combustion: a spectrometer (Ocean Optics Flame-S Miniature), an electron multiplying charge-coupled device (EMCCD) camera for the UV–visible (UV–vis) range (Raptor Photonics Falcon Blue), and a red/green/blue (RGB) camera (The Imaging Source DFK 33GX174). The spectrometer and UV–vis and RGB cameras included a Sony ILX511B sensor with 2048 pixels of resolution, a Texas Instruments TC285SPD sensor (1.0 megapixels), and a Sony IMX174LQJ sensor (2.3 megapixels), respectively. The UV–vis camera was set with a narrow-band optical filter (310 ± 10 nm, ASAHI). In the case of the RGB camera, the sensitivity of its color channels is maximized for the approximate ranges of 580–800 nm (red channel), 475–600 nm (green channel) and 400–500 nm (blue channel).
Experimental tests were carried out for three different fuel gases, defined according to the industrial interest in the substitution of NG by BFG, to increase the efficiency of the processes. Higher percentages of BFG help to reduce NG consumption and, consequently, fossil fuel emissions. However, blends with a high percentage of BFG, which has a low heating value, limit the maximum temperature inside the combustion chamber and result in some operational problems associated with the high gas flow needed to satisfy the furnaces’ demand.4 Consequently, the amount of BFG in the mixture is limited and some NG is needed to reach the temperatures needed for the steel production processes.6 For example, in a study by Zheng et al.,6 the adiabatic flame temperature is increased between 10% and 20% by increasing the CH4 share in the BFG blend from 0 to 15 %v.
In the present research, a 70 %v BFG gaseous mixture (BFG70) was chosen, since it contains the minimum amount of CH4 required to reach the steel processing temperatures (1100–1300 °C) in industrial reheating furnaces.4 On the other hand, pure BFG (BFG100) and G20 CH4 (BFG0) have been defined as baseline fuels for the tests.
The compositions of the fuel blends and their lower heating values (LHV) are collected in Table 2. BFG0, BFG70, and BFG100 were fed at manometric pressures of 10, 86, and 82 mbar, respectively.
Table 2. Fuel Blend Composition.
| fuel
blend |
|||
|---|---|---|---|
| BFG0 | BFG70 | BFG100 | |
| [CH4] (%v) | 100 | 28 | |
| [H2] (%v) | 3 | 4 | |
| [CO] (%v) | 16 | 22 | |
| [CO2] (%v) | 16 | 22 | |
| [N2] (%v) | 37 | 52 | |
| LHV (MJ/kg) | 50.0 | 10.8 | 2.8 |
2.2. Methods
In order to analyze the combustion behavior of the premixed flames when the fuel blend and air/fuel ratio were varied, we carried out an extensive experimental campaign where several operation points were obtained at different airflow rates. Combustion regimes for each operation point were characterized by calculating their air/fuel equivalence ratio (ER), computed as the fraction between the actual and stoichiometric air/fuel ratios. Consequently, an ER higher (or lower) than 1 implies fuel-lean and air-rich (or fuel-rich and air-lean) combustion. The limits of the airflow rates were defined according to the flame stability of each fuel blend. On one side, a reduced airflow caused the flashback of the flame inside the burner mixture chamber, because of the low mixture velocities. On the other side, the highest air flows produced instability and extinction of the flame when the combustion approached its lean operation limits. Since the configuration of the burner was kept for the different blends, similarly to the industrial case, the velocities of the air/fuel mixtures are different. Thus, the ERs are limited by the burner geometry and the amount of BFG of the blend. In this way, the burner is forced to operate near its extinction and flashback working points, acquiring samples of inefficient operation conditions, whose analysis is relevant for their detection at a larger scale. With the current burner, the studied ERs vary from 1.4 to 2.0, from 1.1 to 1.9, and from 0.9 to 1.2 for BFG0, BFG70, and BFG100 fuel mixtures, respectively (see Table 3).
Table 3. Main Characteristics of the Test Campaign.
| test set | BFG0 | BFG70 | BFG100 |
|---|---|---|---|
| ER | 1.4–2.0 | 1.1–1.9 | 0.9–1.2 |
| no. of tests | 7 | 8 | 5 |
The burner power was fixed at 5.5 kWth for each test, independently of the fuel blend and airflow rate. Before each test set, the burner was started up for 1 h to reach a steady temperature. These temperatures were controlled on the surface of the combustion chamber with a thermocouple. Once the warming up was finished, the same procedure was followed for each combustion test. First, the fuel and air flows were adjusted. Second, chamber gases near the flame were measured and compared with the flue gases reported. Steady conditions were reached when the chamber gases and the flue gas measurements presented similar values. At this point, the spectra and images were acquired for 6 min.
According to previous works, the experiment duration can significantly vary between 5 and 180 s.15,16 Thus, a conservative approach was followed to select the test period, defining it to be higher than previous references, with a value of 6 min (360 s). This way, a higher number of measurements were acquired, reducing the effect of abnormal and spurious data.
The fuel flow rate, air flow rate, and exhaust gas analyzer measurements were averaged per test. Furthermore, exhaust gas concentrations detected by the gas analyzer were corrected to 3 %v O2. The CH4 concentration in flue gases was measured in order to detect operation points in which unburned fuel fractions could arise from incomplete combustion.
The spectrometer and the UV–vis camera were both set in front of the quartz glass of the combustion chamber, allowing the acquisition of the flame radiation in the UV bandwidth. On the other hand, the RGB camera was installed in front of the ceramic glass to measure only the visible range. This way, the three optical devices collected spectra and images simultaneously under ambient conditions of dark lighting.
The integration time of the spectrometer and the exposure times of the cameras were selected by preliminary tests according to optimum criteria. At first, longer times are desirable to increase the signal provided by the optical devices. Nevertheless, higher exposure times may saturate sensor pixels and provide inadequate measurements. Thus, the optimum criteria were the maximizations of the integration and exposure times up to their saturation limits. Since the saturation limits of each optical device are originally unknown for an analysis of the flames, preliminary trials were performed to define them by burning BFG0 and BFG100. Furthermore, to compare measures of the same optical device between different tests and fuel blends, fixed integration and exposure times were used for all the tests. In that aspect, the integration and exposure times were defined by the tests that provide higher flame radiation, related to lower airflow rates. Consequently, the tests with lower airflow rates for BFG0 and BFG100 were carried out. Therefore, the integration and exposure times were set to 1000, 540, and 30 ms for the spectrometer and UV–vis and RGB cameras, respectively. Their values appear in Table 4, together with sampling rates, the number of samples (spectra or images) per test, and the optical device. Finally, the configuration of the spectrometer was completed by selecting a slit width of 200 μm.
Table 4. Acquisition Parameters of the Optical Devices.
| optical
device |
|||
|---|---|---|---|
| spectrometer | UV–vis camera | RGB camera | |
| exposure time (ms) | 1000 | 540 | 30 |
| sampling rate (Hz) | 1 | 1.4 | 12 |
| samples per test | 360 | 504 | 4320 |
As in previous works, combustion diagnosis was performed on the basis of flame characteristics obtained by processing spectra and images of the flame. For each optical device, different processing operations were defined. Previously, the signals and images were submitted to an operation based on the subtraction of the dark signals from the captured spectra and images to remove sensor electrical noise.27,30,32
In the case of the spectrometer, measured spectra were averaged for each test to easily characterize them through a visual representation. Nevertheless, a high amount of information is lost with this operation, since the number of spectra per test is reduced from 360 to 1. Thus, each measured spectrum was also computed individually to provide a more detailed analysis. For that purpose, a wavelength segmentation was applied, with a range of 20 nm centered at each radical wavelength being selected. Within this study, OH*, CH*, and C2* were studied by considering their wavelengths of 310, 430, and 515 nm,17−21 respectively, and an additional wavelength of 470 nm for C2*.17,19,21 CO2* was also characterized using a wavelength of 410 nm,18 which was contained within the CO2* broad-band emission and was unrelated to those of other radical species. After the wavelength segmentation, 278 wavelength intensities were obtained. Finally, wavelength intensities were downsampled from 278 to 56 to reduce redundant information. The whole series of 278 wavelength intensities were split into groups of 5 wavelength intensities. Therefore, 55 groups of 5 wavelength intensities were obtained, together with a group of 3 wavelength intensities. For each one of these groups, only the first wavelength intensity was used. In this way, the wavelength resolution of the intensities was reduced from approximately 0.4 to 2 nm.
For the UV–vis and RGB images, the processing methodology was similar. On one hand, Otsu’s thresholding segmentation was applied to detect flame pixels in each image channel. Otsu’s method selects the threshold that maximizes the variance between the two-pixel classes, the variance being computed from the image histogram.15,16,39 After Otsu’s thresholding segmentation, the features of statistic mean13−16,29−32 and Haralick’s texture information measure of the correlation I (IMC1)14,40,41 were computed from flame pixels. The mean is the averaged intensity value of the flame pixels, which is related to the combustion characteristics of flame brightness. On the other hand, texture features such as IMC1 are more complex to interpret in comparison to the other image features. Thus, their theoretical relationships with combustion characteristics may be unknown beforehand. Nevertheless, IMC1 has been used together with other color and texture features to characterize primary air flow and secondary air to territory air split.14 Furthermore, other Haralick features have been used to characterize O2 and NOx content in flue gases.33 In this way, dependences between the combustion characteristics and IMC1 (or other related texture features) have been empirically reported. When Otsu’s thresholding segmentation is applied, a small number of flame pixels could be separated from the main contour of the flame and distort the values of the geometrical features. In order to discard these pixels, the morphological transformation of erosion was applied using a kernel of 3 × 3 pixels.42
Next to morphological erosion, the features of the geometrical area and centroid vertical coordinate were extracted from the binary images.15,31,35,43 The area is the number of flame pixels related to the flame area. The centroid vertical coordinate is the vertical coordinate of the flame mass center. This feature is related to the distance between the burner and the flame and the flame length.
After the image features were computed, a total of 4 characteristics were obtained per image channel, resulting in 4 and 12 characteristics for the UV–vis and RGB cameras. Table 5 gathers the 4 channel characteristics and their mathematical expressions, referenced to a grayscale image of P pixels, with x(p) denoting the grayscale value of the pixel p. For the texture IMC1, the element located in row i and column j of a normalized gray-level co-occurrence matrix (GLCM) is referred to as p(i,j). The GLCM has N rows and N columns, where N is the number of distinct gray values in the grayscale image. Additional variables are used to compute the texture features, which appear in Table 6. In the case of the geometrical features, the binary image also has P pixels (with R rows and C columns), and the binary value (0 or 1) of a pixel p located in column c and row r is denoted b(c,r).
Table 5. Image Features Per Channel Considered.
Table 6. Additional Variables and Their Equations to Compute the Texture Image Features of IMC1.
In order to compute the processing operations for the spectra and images of the tests, a specific code was developed using the programming language of Python (version 3.7). Furthermore, the developed code also used the libraries of OpenCV, NumPy, SciPy, Mahotas, and Pandas. An additional code was written to automatically read the spectra and images acquired during the experimental campaign, which filtered them according to the characteristics of the tests.
3. Results and Discussion
3.1. Analysis of Pollutant Emissions
The first analysis of the test data is focused on the pollutant emissions of CH4, CO2, CO, and NOx, whose trends are shown in Figure 3.
Figure 3.

Concentration in the flue gases of (a) CH4, (b) CO2, (c) CO, and (d) NOx, for the fuel blends BFG0, BFG70, and BFG100.
Complete combustion is achieved for most BFG0 and BFG70 operation points, since no CH4 is measured in flue gases (Figure 3a). However, a non-negligible CH4 concentration is detected at higher ERs (over 1.7) for these fuel blends, most probably caused by unburned CH4, a constituent of BFG0 and BFG70. Additionally, CH4 emissions are higher for BFG70 than for pure CH4. In these cases, the test burner presents some combustion instability due to the higher velocity of the air/fuel mixture, which prevents the proper burning of the fuel.
Figure 3b shows CO2 emissions for the different operation points. These emissions have different sources depending on the fuel blend. In the case of BFG0, CO2 emissions correspond to the completely oxidated CH4. For BFG100, CO2 emissions have two sources: the combustion of CO and the original CO2 included in the fuel blend. Finally, the mixture BFG70 presents CO2 emissions originating from the three previous sources (combustion of CH4 and CO and CO2 from fuel).
In this way, the effect of each source is modified with different BFG shares in the fuel blend. With an increase in BFG share in the fuel blend, higher CO2 emissions are generated from CO combustion and the CO2 composition of the fuel. At the same time, lower CO2 emissions originate from CH4 combustion. According to BFG measurements, total CO2 emissions are higher when the share rises from 0 to 70 %v. Consequently, CO combustion and CO2 composition of the fuel exceed the effect of CH4 combustion in CO2 emissions. As expected, a constant trend is observed when CO2 emissions of the same fuel blend are compared for different ERs, due to the operation with a fixed thermal power for all of the tests.
The CO concentration in the exhaust gases is included in Figure 3c. In general, CO emissions are increased when the BFG share of the fuel blend is raised. This effect is due to a higher CO content in the fuel blend, higher air/fuel velocities, and lower calorific value (higher inert content). For each fuel blend, lower CO emissions are obtained at points closer to the stoichiometric point. The conditions of fuel excess (ER < 1) led to an increase in CO emissions because part of the fuel is not burned due to the absence of O2. In the same way, high ER conditions generate combustion instability because of the air dilution. Part of the CH4 of BFG0 is unburned and part of the CO of BFG100 and BFG70 is unburned, causing an increase in CO emissions.
Trends of NOx emissions are included in Figure 3d. NOx emissions are highly dependent on the flame temperature and the availability of N2 to be oxidized.44 Higher shares of CH4 in the fuel blend increase the adiabatic flame temperature over 1800 K, for which the Zeldovich mechanism dominates NOx emissions, where the flame temperature and residence time are important factors.
On the other hand, a fuel blend of BFG without CH4 (such as BFG0) does not reach 1800 K, and NOx emissions are reduced. This behavior is also reported in the work of Zheng et al.6
In addition to previous effects, NOx emissions are decreased in the combustion of BFG0 for higher ERs, since the air acts as a diluent. The effect of the dilution is significant in the case of pure CH4, which implies a significant reduction in NOx at high equivalence ratios.45 However, the mixtures BFG70 and BFG100 have high concentrations of diluents such as CO2 and N2, which receive part of the energy of the combustion. This effect causes lower combustion temperatures, and therefore, the concentration of NOx in the flue gases is significantly lower and the effect of the increase of air is not significant.4
3.2. Analysis of Chemiluminescence Spectroscopy
An analysis with chemiluminescence spectroscopy was performed to compare intensities and wavelengths of the energy radiated by the premixed flame radicals. The spectrometer captured the radiant energies emitted by the flame, which were averaged for each test. Figure 4 presents the averaged spectra of BFG0, BFG70, and BFG100 for different ERs.
Figure 4.

Average spectra for the fuel blends (a) BFG0, (b) BFG70, and (c) BFG100, with different ERs.
The BFG0 spectra, measured as a reference, show their signature shape, with the intensity peaks of OH*, CH*, and C2* at 310, 430, and 470–515 nm, respectively. Nevertheless, other patterns of high intensities appear in the mean spectrum. The peak at around 589 nm is the typical emission band of Na*, which in previous works has been linked to the combustion of impurities from traces.19,46,47 Also, several peaks above 700 nm (visible and infrared range) could be related to the emission of the burner surface,17 HNO* (between 650 and 900 nm),45,46 and vibrational–rotational transitions of diatomic molecules with hydrogen, as CH (from 813 to 847 nm), OH (from 834 to 845 nm), or H2O (from 892 to 967 nm).46 Additionally, the peaks measured between 700 and 800 nm are similar to the results of Parameswaran et al. for hydrocarbon flames with a premixed burner.48
On the other hand, flame spectra obtained with BFG100 have a higher and dominant contribution from the broad-band CO2* emission due to the CO2 content of the BFG. Since the BFG composition does not include CH4, CH* (430 nm) and C2* (470 and 515 nm) peaks are not detected. Nonetheless, the peak of OH* (310 nm) is still detected due to the H2 content in the BFG, but its intensity is lower than that for BFG0. This trend is also reported in the work of Zheng et al.,6 in which the OH concentration is increased when CH4 is added to BFG.
The spectra of BFG70 contains characteristics of the other two fuel blends. The BFG in the fuel blend provides a broad-band CO2* emission of intensity lower than that in the case of BFG100 due to the higher concentration of BFG. CH* and C2* peaks are detected due to the CH4 of BFG70, and the measured peak of OH* is related to both CH4 and H2. These narrow-band emissions show intensities lower than those in the case of BFG0 due to the lower concentration of CH4 in the fuel blend.
For each fuel type, the intensity throughout the whole bandwidth depends on the air/fuel ratio (ER). For BFG0 and BFG70, whose conditions are fuel-lean (air-rich), the emission intensity increases as the combustion air decreases. For BFG100, higher intensities are measured at medium air/fuel ratios. Nevertheless, these trends of the emission intensities with the air/fuel ratio for the three fuel blends can be described together using the ER values. For the three fuel blends, the maximum emission intensity could be measured at an ER around 1.0 (stoichiometric conditions), as in the case of BFG100, which has a maximum intensity for the ER of 1.1. Consequently, the emission intensity is reduced with an increase in the difference between the actual ER and the ER of 1.1 for BFG100. This relationship is also repeated for BFG0 and BFG70, where the emission intensity increases as the difference between the actual ER and the ER of 1.1 is reduced.
The intensities of OH*, CO2*, CH*, and C2* are shown in Figure 5 for BFG0, BFG70, and BFG100. The general trend detected in the average spectra is repeated by the radical emissions, which increase when the ER approaches 1.1. In particular, these behaviors of the OH* and CO2* intensities around an ER of 1.0 have also been reported in previous studies. In the work of Ahmadi et al.,49 the OH* emission intensity had a maximum at an ER of 0.8 for NG flames in a premixed burner of domestic heating boilers. Related to the work of Ahmadi et al.,49 the Soltanian et al.17 detected a peak of the intensities of OH* and CO2* at an ER of 0.8 for NG flames and a premixed gas boiler burner. Additionally, Ding et al.50 detected a maximum of OH* intensity at an ER of 1.0 for flames of different fuel blends (pure CH4 and mixtures of CH4 with N2, CO2, H2, and C3H8) in a burner similar to those in the studies referenced above.
Figure 5.

Intensities of (a) OH*, (b) CO2*, and (c) CH* and of C2* at (d) 470 nm and (e) 515 nm versus ER, for the fuel blends BFG0, BFG70, and BFG100.
All of the radical intensities of BFG0 are slightly higher than those of BFG70 at similar ERs. The addition of CO2 in BFG70 increases the broad-band CO2* emission with respect to the BFG0 case due to the increase in the BFG share. However, the reduction of the CH4 concentration decreases the emission intensity of OH*, CH*, and C2* (at both 470 and 515 nm). When the concentration of BFG in the fuel blend is increased to 100%, the broad-band CO2* emission also increases, increasing the intensities radiated in its range (between 350 and 600 nm). This behavior matches with the trends shown for the intensities of CO2*, CH*, and C2*, which are higher for BFG100 than for BFG70, at similar ERs. The emission intensity of OH* is not affected by the increase of broad-band CO2* emission, since 310 nm is not in the range between 350 and 600 nm. In particular, the emission intensity of OH* was reduced for BFG100 with regard to BFG70 at similar ERs, showing a trend in contrast with the rest of the radicals due to the different compositions of the fuel blends. In this study, the intensity of OH* is related to the reaction of CH4 and H2 (included in the composition of the BFG). While BFG70 includes both CH4 and H2, BFG100 has a higher concentration of H2 but no CH4. This higher concentration of H2 does not balance the lack of CH4, providing a lower emission at 310 nm in comparison to that for BFG70.
OH* measurements are also related to CO and CO2 emissions through the reaction CO + OH = CO2 + H, fundamental for CO oxidation.51 With this reaction, if the OH concentration is decreased, CO emissions are expected to increase. This behavior is shown by comparing parts a and c of Figure 5, in which OH* radiation and CO emissions are inversely proportional.
3.3. Analysis of the Flame Images
After the spectral features were studied, images acquired with the cameras were analyzed. Figure 6 shows different flames captured for the three fuels with the UV–vis and RGB cameras under similar conditions.
Figure 6.
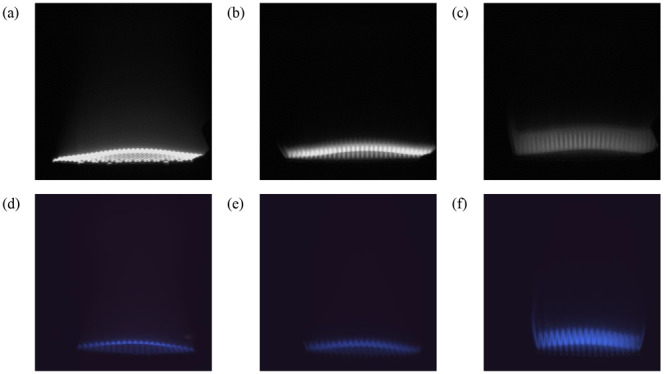
Sample images captured by the UV–vis camera with the 310 nm filter for (a) BFG0, (b) BFG70 and (c) BFG100 and by the RGB camera for (d) BFG0, (e) BFG70, and (f) BFG100, with ERs of 1.2 and 1.4 (fuel-lean and air-rich).
Features extracted from the 310 nm images show dependences on the fuel blend and ER, independent of the feature type (statistical, texture, or geometrical), which can be seen in Figure 7. Among the 310 nm image features, the statistical mean has a stronger dependence on the combustion regimes for BFG0 and BFG70.
Figure 7.

Image features of (a) statistical mean, (b) texture IMC1, and (c) geometrical centroid vertical coordinate versus ER, for the 310 nm (OH*) images of BFG0, BFG70, and BFG100.
The mean is reduced with an increase in the BFG (reduction of CH4) share in the fuel blend. In the tests, there are two sources for OH*: CH4 hydrocarbons and BFG hydrogen. Since the substitution of CH4 with BFG reduces the average combustion radiation, CH4 hydrocarbons may make a greater contribution than BFG hydrogen. Furthermore, the mean increases for the same fuel blend when the ER approaches 1.1. Similar behavior has also been shown in previous works.17,48,49
Despite the different natures between the mean (statistical) and IMC1 (texture), the overall trends highlighted for the mean are shared for the IMC1. Thus, the flame texture is also related to the BFG share in the fuel blend and the ER.
Finally, the centroid vertical coordinate is increased by raising the BFG share in the fuel blend. The increase in BFG share increases the length of the flame front, and thus, higher centroid vertical coordinates are measured. The increase in the flame front length may be caused by the higher fuel flows used when the BFG share is increased. Within the same fuel, similar behavior is found when the ER is increased. This effect could be related to the air flow increase, which extends the flame front. In addition, the geometrical vertical coordinate of the centroid (cy) has a higher relevance for the classification of the fuel blends, since most values of the feature are only related to one specific fuel blend, independently of the ER. For example, a flame image with an unknown ER could be related to BFG0 (if cy is higher than or equal to 835-pixel rows), BFG70 (cy between 835- and 790-pixel rows) or BFG 100 (if cy is equal to or lower than 790-pixel rows).
A similar study was carried out for the RGB images. For the 310 nm images, the statistical mean and geometrical area show trends with the fuel blend and ER. In addition, these dependences can be observed independently of the color channel, and some features such as the statistical mean share its behavior for the three channels (Figure 8).
Figure 8.

Image features of (a) red statistical mean, (b) red geometrical area, (c) green statistical mean, (d) green geometrical area, (e) blue statistical mean, and (f) blue geometrical area versus ER, for the RGB images of BFG0, BFG70, and BFG100.
The mean values are higher for the blue channel and lower for the red channel, while the green channel presents intermediate values. This trend is due to the radiation differences in the spectral sensitivity of each color channel. Nevertheless, the mean shows the same behavior with respect to fuel blend and ER, independently of the color channel. BFG0 and BFG70 have similar values, and therefore, the flame intensity does not differ significantly. For BFG100, the mean (and thus, the flame intensity) is higher due to the significant contribution of the broad-band CO2* emission. With regard to the behavior of the mean with the ER, the mean increases when the ER approaches 1.1, as for the 310 nm images.
The areas are similar for the green and blue channels, but it differs for the red channel. As with the mean, these variations between channels are related to the different spectral sensitivities of the color channels. The area for the red channel shows almost no dependence on the fuel blend and ER; only extreme ERs of the BFG0 show significant differences. With those ERs, the length of the red flame is increased, and thus, the area as well. For the green and blue channels, an increase in the BFG share increases the flame length, due to a higher fuel flow. For each fuel, higher ERs result in higher areas since the fuel flow is constant and the airflow is increased. Notable exceptions are lower ERs of BFG0, for which the flame length is slightly increased. Among all image features, the geometrical area of the blue channel is of greater interest due to its stronger relationship with the fuel blends and combustion regimes, as seen in Figure 8f.
3.4. Coupled Analysis of the Optical Devices
Chemiluminescence spectra, UV filtered images, and color images were processed to extract different features. The relationships of these features with the combustion characteristics were analyzed in previous sections. Now, features measured with different optical devices are compared together to study their correlations.
First, chemiluminescence spectra and UV filtered images were studied. The OH* spectral intensity (Figure 5a) and image mean (Figure 7a) share similar trends with regard to the fuel composition and ER. In the captured trends, the feature values decrease when the ER is increased for BFG0 and BFG70, and higher values are measured at equal ERs for lower shares of BFG in the fuel blend. This behavior is expected for the OH* spectral intensity and image mean, since they are related to the same combustion characteristic (magnitude of the flame radiated energy). On the other hand, the image IMC1 (Figure 7b) and centroid vertical coordinate (Figure 7c) characterize the spatial texture and geometry of the flame radiated energy, instead of its magnitude. In this way, these features could have different trends with the combustion characteristics. Nevertheless, the image IMC1 also shows a similar trend with the fuel composition and ER. In addition, the image centroid vertical coordinate (Figure 7c) has an inverse relationship with the fuel composition and ER with respect to previous optical features.
Color images capture flame radiated energy in broad-band ranges instead of the narrow-band range used by the UV filtered images. These broad-band ranges are 580–800 nm (red channel), 475–600 nm (green) and 400–500 nm (blue). Spectral intensities (Figure 4) and image means (Figure 8a,c,e) characterize the magnitude of the flame radiated energy. Trends of these features with combustion characteristics differ from previous trends. While the feature values still decrease with an ER increase, similar values are measured at equal ERs for BFG0 and BFG70.
Moreover, the values for BFG100 are higher than those for BFG0 and BFG70. This behavior is due to the measurement of the radiation in broad-band instead of narrow-band ranges. The three color channels capture broad-band CO2* radiation, emitted between 350 and 610 nm. This radiation is increased with an increase in the BFG share in the fuel blend, which increases the CO2 fraction. Consequently, feature values for BFG70 and BFG100 are increased. On the other hand, image areas show inverse trends with respect to the previous features. These relationships with combustion characteristics are shared with the image area of the UV filtered images.
4. Conclusions
In this work, BFG, CH4, and a mixture with 70% of BFG and 30% of CH4 have been tested in a laboratory burner at different air/fuel equivalence ratios, at a fixed thermal power of 5.5 kW. An analysis of chemiluminescence spectra, filtered UV images, and color images enables the extraction of relevant features from the flames. These parameters can be used to characterize aspects of the combustion in terms of fuel mixture, ER, and flue gas composition.
The main conclusions from the results of this work are as follows.
Together with the mixture and air/fuel equivalence ratio, the test burner used during the tests strongly influenced the pollutant emissions. The use of fuels with significant differences in their calorific value and the same ducts and burner header produced different velocities of the air/fuel mixture and thus affected the quality of the mixture. This caused in some cases, with high velocities, the mixture left the combustion chamber without being burned. As a result, the CO concentration in flue gases increased at high air equivalence ratios for all of the fuel blends and the CH4 concentration also increased for BFG0 and BFG70. When the combustion conditions were more favorable, pollutant concentrations exhibited the expected trends with ER.
Chemiluminescence spectroscopy revealed that BFG100 shows a signature spectrum with the primary broad-band emission of CO2* due to the higher CO2 concentration of the fuel, whereas BFG0 spectra agree with the classical spectra reported in the literature. The partial substitution of CH4 with BFG provides a hybrid spectrum between BFG100 and BFG0. For all of the fuel blends, spectrumal intensities increased with ERs of closer to 1.1. The dilution caused by the excess air for BFG0 and BFG70 caused a decrease in the spectral intensity, and the different peaks associated with the combustion radicals were attenuated.
The extracted image features show trends with fuel blends and ERs that coincide with the spectroscopy results for the same range of wavelengths. All types of image features considered (statistical, geometrical, and texture) show relationships with the combustion conditions, and some of them share a stronger dependence, such as statistical mean, texture IMC1, and geometrical vertical coordinate of the centroid.
The images captured with the RGB camera also showed trends similar to those of spectroscopy and UV filtered images. As with the UV filtered images, color image features of statistical, texture, and geometrical types show dependences on the BFG concentration and ER. Furthermore, these relationships are provided by all the color channels, highlighting the strong dependences of the statistical mean and geometrical area.
The current study has addressed uncertainties and challenges related to the innovation of the considered BFG valorization. The results have shown strong dependences of the computed spectra and image features related to intensity, texture, and geometry on the BFG concentration and ER. Thus, promising alternatives have been provided for the monitoring and control of BFG cofiring, allowing further research in applications, with the adaptation and optimization of artificial intelligence techniques to develop predictive combustion models.
Acknowledgments
This work has been supported by the European Union’s Horizon 2020 Research and Innovation Programme under Grant Agreement No. 820771 (BAMBOO project).
Glossary
Abbreviations
- AU
arbitrary units
- BFG
blast furnace gas
- DAQ
data acquisition
- EMCCD
electron multiplying charge-coupled device
- ER
equivalence ratio
- GLCM
gray level co-occurrence matrix
- HSI
hue. saturation, and intensity
- IMC1
information measure of correlation I
- IR
infrared
- LHV
lower heating value
- NDIR
nondispersive infrared
- NG
natural gas
- RGB
red–green–blue
- UV
ultraviolet
- vis
visible
The authors declare no competing financial interest.
References
- Larrinaga P.; Campos-Celador A.; Legarreta J.; Diarce G. Evaluation of the Theoretical, Technical and Economic Potential of Industrial Waste Heat Recovery in the Basque Country. J. Clean. Prod. 2021, 312, 127494. 10.1016/j.jclepro.2021.127494. [DOI] [Google Scholar]
- Wang X.; Li C.; Lam C. H.; Subramanian K.; Qin Z. H.; Mou J. H.; Jin M.; Chopra S. S.; Singh V.; Ok Y. S.; Yan J.; Li H. Y.; Lin C. S. K. Emerging Waste Valorisation Techniques to Moderate the Hazardous Impacts, and Their Path towards Sustainability. J. Hazar. Mater. 2022, 423, 127023. 10.1016/j.jhazmat.2021.127023. [DOI] [PubMed] [Google Scholar]
- Pierri E.; Hellkamp D.; Thiede S.; Herrmann C. Enhancing Energy Flexibility through the Integration of Variable Renewable Energy in the Process Industry. Proc. CIRP 2021, 98, 7–12. 10.1016/j.procir.2020.12.001. [DOI] [Google Scholar]
- Cuervo-Piñera V.; Cifrián-Riesgo D.; Nguyen P. D.; Battaglia V.; Fantuzzi M.; della Rocca A.; Ageno M.; Rensgard A.; Wang C.; Niska J.; Ekman T.; Rein C.; Adler W. Blast Furnace Gas Based Combustion Systems in Steel Reheating Furnaces. Energy Procedia 2017, 120, 357–364. 10.1016/j.egypro.2017.07.215. [DOI] [Google Scholar]
- Zheng W.; Pang L.; Liu Y.; Xie F.; Zeng W. Effects of Initial Condition and Fuel Composition on Laminar Burning Velocities of Blast Furnace Gas with Low Heat Value. Fuel 2021, 289, 119775. 10.1016/j.fuel.2020.119775. [DOI] [Google Scholar]
- Zheng W.; Pang L.; Liu Y.; Xie F.; Zeng W. Effects of Methane Addition on Laminar Flame Characteristics of Premixed Blast Furnace Gas/Air Mixtures. Fuel 2021, 302, 121100. 10.1016/j.fuel.2021.121100. [DOI] [Google Scholar]
- Zhang L.; Xie W.; Ren Z. Combustion Stability Analysis for Non-Standard Low-Calorific Gases: Blast Furnace Gas and Coke Oven Gas. Fuel 2020, 278, 118216. 10.1016/j.fuel.2020.118216. [DOI] [Google Scholar]
- Caillat S. Burners in the Steel Industry: Utilization of by-Product Combustion Gases in Reheating Furnaces and Annealing Lines. Energy Procedia 2017, 120, 20–27. 10.1016/j.egypro.2017.07.152. [DOI] [Google Scholar]
- European Commission, Directorate-General for Research and Innovation; Battaglia V.; Niska J.; Cuervo Piñera V., et al. High Efficiency Low NOX BFG Based Combustion Systems in Steel Reheating Furnaces (HELNOx-BFG): Final Report, 2018.
- Huang H. W.; Zhang Y. Digital Colour Image Processing Based Measurement of Premixed CH 4 + Air and C2H4 + Air Flame Chemiluminescence. Fuel 2011, 90 (1), 48–53. 10.1016/j.fuel.2010.07.050. [DOI] [Google Scholar]
- He L.; Guo Q.; Gong Y.; Wang F.; Yu G. Investigation of OH* Chemiluminescence and Heat Release in Laminar Methane-Oxygen Co-Flow Diffusion Flames. Combust. Flame 2019, 201, 12–22. 10.1016/j.combustflame.2018.12.009. [DOI] [Google Scholar]
- Tripathi M. M.; Krishnan S. R.; Srinivasan K. K.; Yueh F. Y.; Singh J. P. Chemiluminescence-based multivariate sensing of local equivalence ratios in premixed atmospheric methane-air flames. Fuel 2012, 93, 684–691. 10.1016/j.fuel.2011.08.038. [DOI] [Google Scholar]
- González-Espinosa A.; Gil A.; Royo-Pascual L.; Nueno A.; Herce C. Effects of Hydrogen and Primary Air in a Commercial Partially-Premixed Atmospheric Gas Burner by Means of Optical and Supervised Machine Learning Techniques. Int. J. Hydrogen Energy 2020, 45 (55), 31130–31150. 10.1016/j.ijhydene.2020.08.045. [DOI] [Google Scholar]
- Bai X.; Lu G.; Hossain M. M.; Szuhánszki J.; Daood S. S.; Nimmo W.; Yan Y.; Pourkashanian M. Multi-Mode Combustion Process Monitoring on a Pulverised Fuel Combustion Test Facility Based on Flame Imaging and Random Weight Network Techniques. Fuel 2017, 202, 656–664. 10.1016/j.fuel.2017.03.091. [DOI] [Google Scholar]
- Katzer C.; Babul K.; Klatt M.; Krautz H. J. Quantitative and Qualitative Relationship between Swirl Burner Operating conditions and Pulverized Coal Flame Length. Fuel Process. Technol. 2017, 156, 138–155. 10.1016/j.fuproc.2016.10.013. [DOI] [Google Scholar]
- Mathew A. P.; Asokan A.; Batri K.; Sivakumar D. Comparative Analysis of Flame Image Features for Combustion Analysis. Indian J. Sci. Technol. 2016, 9 (6), 1–11. 10.17485/ijst/2016/v9i6/79904. [DOI] [Google Scholar]
- Soltanian H.; Targhi M. Z.; Pasdarshahri H. Chemiluminescence Usage in Finding Optimum Operating Range of Multi-Hole Burners. Energy 2019, 180, 398–404. 10.1016/j.energy.2019.05.104. [DOI] [Google Scholar]
- Quintino F. M.; Trindade T. P.; Fernandes E. C. Biogas Combustion: Chemiluminescence Fingerprint. Fuel 2018, 231, 328–340. 10.1016/j.fuel.2018.05.086. [DOI] [Google Scholar]
- Chong C. T.; Hochgreb S. Flame Structure, Spectroscopy and Emissions Quantification of Rapeseed Biodiesel under Model Gas Turbine Conditions. Appl. Energy 2017, 185, 1383–1392. 10.1016/j.apenergy.2016.01.003. [DOI] [Google Scholar]
- Merotto L.; Sirignano M.; Commodo M.; D’Anna A.; Dondè R.; de Iuliis S. Experimental Characterization and Modeling for Equivalence Ratio Sensing in Non-Premixed Flames Using Chemiluminescence and Laser-Induced Breakdown Spectroscopy Techniques. Energy Fuels 2017, 31 (3), 3227–3233. 10.1021/acs.energyfuels.6b03094. [DOI] [Google Scholar]
- Giassi D.; Cao S.; Bennett B. A. v.; Stocker D. P.; Takahashi F.; Smooke M. D.; Long M. B. Analysis of CH* Concentration and Flame Heat Release Rate in Laminar Coflow Diffusion Flames under Microgravity and Normal Gravity. Combust. Flame 2016, 167, 198–206. 10.1016/j.combustflame.2016.02.012. [DOI] [Google Scholar]
- Guiberti T. F.; Durox D.; Schuller T. Flame Chemiluminescence from CO2- and N2-Diluted Laminar CH4/Air Premixed Flames. Combust. Flame 2017, 181, 110–122. 10.1016/j.combustflame.2017.01.032. [DOI] [Google Scholar]
- Huang H. W.; Zhang Y. Imaging Based Chemiluminescence Characterisation of Partially Premixed Syngas Flames through DFCD Technique. Int. J. Hydrogen Energy 2013, 38 (11), 4839–4847. 10.1016/j.ijhydene.2013.01.142. [DOI] [Google Scholar]
- Deng K.; Zhong Y.; Wang M.; Zhong Y.; Luo K. H. Effects of Acoustic Excitation on the Combustion Instability of Hydrogen-Methane Lean Premixed Swirling Flames. ACS Omega. 2020, 5, 8744–8753. 10.1021/acsomega.0c00287. [DOI] [PMC free article] [PubMed] [Google Scholar]
- Huang M.; Xiao Y.; Zhang Z.; Shao W.; Xiong Y.; Liu Y.; Liu Z.; Lei F. Effect of Air/Fuel Nozzle Arrangement on the MILD Combustion of Syngas. Appl. Therm. Eng. 2015, 87, 200–208. 10.1016/j.applthermaleng.2015.04.076. [DOI] [Google Scholar]
- Liu Y.; Tan J.; Wan M.; Zhang L.; Yao X. Quantitative Measurement of OH* and CH* Chemiluminescence in Jet Diffusion Flames. ACS Omega. 2020, 5, 15922–15930. 10.1021/acsomega.0c01093. [DOI] [PMC free article] [PubMed] [Google Scholar]
- Wang J.; Chang M.; Zhang M.; Li G.; Chen S.; Huang Z. Flame front identification and its effect on turbulent premixed flames topology at high pressure. Exp. Therm Fluid Sci. 2019, 107, 107–117. 10.1016/j.expthermflusci.2019.05.016. [DOI] [Google Scholar]
- Wu R.; Xie F.; Wei J.; Song X.; Yang H.; Lv P.; Yu G. Study on Soot Emission Characteristics of Methane/Oxygen Inverse Diffusion Flame. ACS Omega. 2021, 6, 23191–23202. 10.1021/acsomega.1c02789. [DOI] [PMC free article] [PubMed] [Google Scholar]
- González-Cencerrado A.; Peña B.; Gil A. Experimental Analysis of Biomass Co-Firing Flames in a Pulverized Fuel Swirl Burner Using a CCD Based Visualization System. Fuel Process. Technol. 2015, 130, 299–310. 10.1016/j.fuproc.2014.10.041. [DOI] [Google Scholar]
- González-Cencerrado A.; Gil A.; Peña B. Characterization of PF Flames under Different Swirl Conditions Based on Visualization Systems. Fuel 2013, 113, 798–809. 10.1016/j.fuel.2013.05.077. [DOI] [Google Scholar]
- Sun D.; Lu G.; Zhou H.; Li X.; Yan Y. A Simple Index Based Quantitative Assessment of Flame Stability. 2013 IEEE Int. Conf. Imaging Syst. Technol. Proc. (IST) 2013, 190–193. 10.1109/IST.2013.6729689. [DOI] [Google Scholar]
- González-Cencerrado A.; Peña B.; Gil A. Coal Flame Characterization by Means of Digital Image Processing in a Semi-Industrial Scale PF Swirl Burner. Appl. Energy 2012, 94, 375–384. 10.1016/j.apenergy.2012.01.059. [DOI] [Google Scholar]
- Yang G.; He Y.; Li X.; Liu H.; Lan T. Gabor-GLCM-Based Texture Feature Extraction Using Flame Image to Predict the O2 Content and NOx. ACS Omega 2022, 7, 3889–3899. 10.1021/acsomega.1c03397. [DOI] [PMC free article] [PubMed] [Google Scholar]
- Liu Y.; Xue Q.; Zuo H.; Yang F.; Peng X.; Wang J. Effects of CH4 and N2 Dilution on the Combustion Characteristics of H2/CO Mixture in a Turbulent, Partially Premixed Burner. ACS Omega 2021, 6, 15651–15662. 10.1021/acsomega.1c00534. [DOI] [PMC free article] [PubMed] [Google Scholar]
- Hanuschkin A.; Zündorf S.; Schmidt M.; Welch C.; Schorr J.; Peters S.; Dreizler A.; Böhm B. Investigation of Cycle-to-Cycle Variations in a Spark-Ignition Engine Based on a Machine Learning Analysis of the Early Flame Kernel. Proc. Combust. Inst. 2021, 38, 5751–5759. 10.1016/j.proci.2020.05.030. [DOI] [Google Scholar]
- Sun D.; Lu G.; Zhou H.; Yan Y.; Liu S. Quantitative Assessment of Flame Stability Through Image Processing and Spectral Analysis. IEEE Trans. Instrum. Meas. 2015, 64 (12), 3323–3333. 10.1109/TIM.2015.2444262. [DOI] [Google Scholar]
- Luo C.; Yu Z.; Wang Y.; Ai Y. Experimental Investigation of Lean Methane-Air Laminar Premixed Flames at Engine-Relevant Temperatures. ACS Omega 2021, 6, 17977–17987. 10.1021/acsomega.1c01692. [DOI] [PMC free article] [PubMed] [Google Scholar]
- Vargas A. C.; García A. M.; Arrieta C. E.; Del Rio J. S.; Amell A. Burning Velocity of Turbulent Methane/Air Premixed Flames in Subastmospheric Environments. ACS Omega 2020, 5, 25095–25103. 10.1021/acsomega.0c02670. [DOI] [PMC free article] [PubMed] [Google Scholar]
- Otsu N. A Threshold Selection Method from Gray-Level Histograms. IEEE Trans. Syst. Man Cybern. 1979, 9 (1), 62–66. 10.1109/TSMC.1979.4310076. [DOI] [Google Scholar]
- Haralick R. M.; Shanmugam K.; Dinstein I. Textural Features for Image Classification. IEEE Trans. Syst. Man Cybern. 1973, SMC-3 (6), 610–621. 10.1109/TSMC.1973.4309314. [DOI] [Google Scholar]
- Brynolfsson P.; Nilsson D.; Torheim T.; Asklund T.; Karlsson C. T.; Trygg J.; Nyholm T.; Garpebring A. Haralick Texture Features from Apparent Diffusion Coefficient (ADC) MRI Images Depend on Imaging and Pre-Processing Parameters. Sci. Rep. 2017, 7 (1), 4041. 10.1038/s41598-017-04151-4. [DOI] [PMC free article] [PubMed] [Google Scholar]
- Sreedhar K. Enhancement of Images Using Morphological Transformations. Int. J. Comput. Sci. Inf. Technol. 2012, 4 (1), 33–50. 10.5121/ijcsit.2012.4103. [DOI] [Google Scholar]
- Zhao Z.; Hui M.; Liu M.; Dong L.; Liu X.; Zhao Y. Centroid Shift Analysis of Microlens Array Detector in Interference Imaging System. Opt. Commun. 2015, 354, 132–139. 10.1016/j.optcom.2015.05.049. [DOI] [Google Scholar]
- Blauwens J.; Smets B.; Peeters J. Mechanism of “Prompt” NO Formation in Hydrocarbon Flames. Symp. (Int.) Combust. 1977, 16 (1), 1055–1064. 10.1016/S0082-0784(77)80395-0. [DOI] [Google Scholar]
- Cho E. S.; Chung S. H. Numerical evaluation of NOx mechanisms in methane-air counterflow premixed flames. J. Mech. Sci. Technol. 2009, 23, 659–666. 10.1007/s12206-008-1222-y. [DOI] [Google Scholar]
- Sheehe S. L.; Jackson S. I. Identification of Species from Visible and Near-Infrared Spectral Emission of a Nitromethane-Air Diffusion Flame. J. Mol. Spectrosc. 2019, 364. 10.1016/j.jms.2019.111185. [DOI] [Google Scholar]
- Toro C.; Torres S.; Parra V.; Fuentes R.; Castillo R.; Díaz W.; Reyes G.; Balladares E.; Parra R. On the Detection of Spectral Emissions of Iron Oxides in Combustion Experiments of Pyrite Concentrates. Sensors 2020, 20, 1284. 10.3390/s20051284. [DOI] [PMC free article] [PubMed] [Google Scholar]
- Parameswaran T.; Gogolek P.; Hughes P. Estimation of combustion air requirement and heating value of fuel gas mixtures from flame spectra. Appl. Therm. Eng. 2016, 105, 353–361. 10.1016/j.applthermaleng.2014.11.034. [DOI] [Google Scholar]
- Ahmadi Z.; Zabetian Targhi M. Thermal performance investigation of a premixed surface flame burner used in the domestic heating boilers. Energy 2021, 236, 121481. 10.1016/j.energy.2021.121481. [DOI] [Google Scholar]
- Ding Y.; Durox D.; Darabiha N.; Schuller T. Chemiluminescence based operating point control of domestic gas boilers with variable natural gas composition,. Appl. Therm. Eng. 2019, 149, 1052–1060. 10.1016/j.applthermaleng.2018.12.106. [DOI] [Google Scholar]
- Glassman I.Combustion; Elsevier: 1996. 10.1016/B978-0-12-285852-9.X5000-0. [DOI] [Google Scholar]