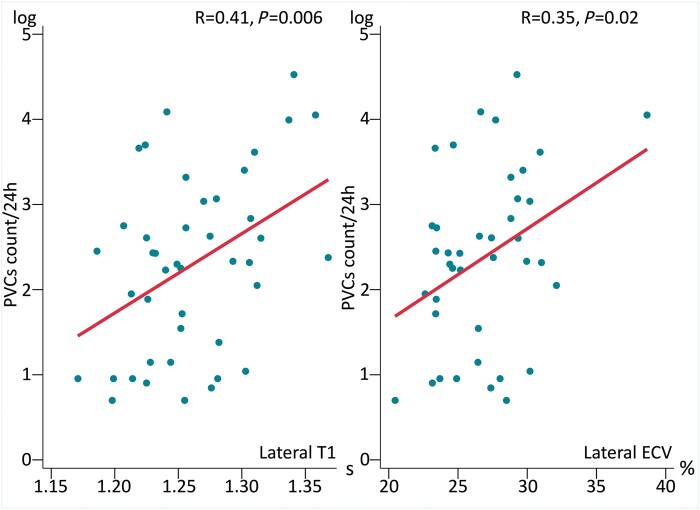
Figure 2.
Correlation between PVCs count/24 h by Holter monitoring and lateral T1 and ECV values by T1-mapping cardiac magnetic resonance. Correlation plots between PVCs count/24 h as evaluated by Holter monitoring (y-axis) and lateral T1 (left panel) and ECV values (right panel) by T1-mapping cardiac magnetic resonance (x-axis). Log base 10 transformation of the PVCs count was performed to assure model linearity assumptions. Correlation coefficient R and P values are calculated by Pearson correlation analysis. ECV, extracellular volume; PVCs, premature ventricular contractions.

