

Abstract
Recent genomic studies have shed light on the biology and inter-tumoral heterogeneity underlying pineal parenchymal tumors, in particular pineoblastomas (PBs) and pineal parenchymal tumors of intermediate differentiation (PPTIDs). Previous reports, however, had modest sample sizes and lacked power to integrate molecular and clinical findings. The different proposed molecular group structures also highlighted a need to reach consensus on a robust and relevant classification system. We performed a meta-analysis on 221 patients with molecularly characterized PBs and PPTIDs. DNA methylation profiles were analyzed through complementary bioinformatic approaches and molecular subgrouping was harmonized. Demographic, clinical, and genomic features of patients and samples from these pineal tumor groups were annotated. Four clinically and biologically relevant consensus PB groups were defined: PB-miRNA1 (n=96), PB-miRNA2 (n=23), PB-MYC/FOXR2 (n=34), and PB-RB1 (n=25). A final molecularly distinct group, designated PPTID (n=43), comprised histological PPTID and PBs. Genomic and transcriptomic profiling allowed the characterization of oncogenic drivers for individual tumor groups, specifically, alterations in the microRNA processing pathway in PB-miRNA1/2, MYC amplification and FOXR2 overexpression in PB-MYC/FOXR2, RB1 alteration in PB-RB1, and KBTBD4 insertion in PPTID. Age at diagnosis, sex predilection, and metastatic status varied significantly among tumor groups. While patients with PB-miRNA2 and PPTID had superior outcome, survival was intermediate for patients with PB-miRNA1, and dismal for those with PB-MYC/FOXR2 or PB-RB1. Reduced-dose CSI was adequate for patients with average-risk, PB-miRNA1/2 disease. We systematically interrogated the clinical and molecular heterogeneity within pineal parenchymal tumors and proposed a consensus nomenclature for disease groups, laying the groundwork for future studies as well as routine use in tumor diagnostic classification and clinical trial stratification.
Keywords: Pineoblastoma, pineal parenchymal tumors of intermediate differentiation, DNA methylation profiling, molecular groups, consensus, risk-stratification
Introduction
Pineal parenchymal tumors are rare central nervous system (CNS) neoplasms that encompass a spectrum of entities with varied histologic appearance and clinical phenotypes [41]. Accounting for <1% of all CNS tumors, these range from World Health Organization (WHO) Grade 1 pineocytomas, to WHO Grade 2–3 pineal parenchymal tumors of intermediate differentiation (PPTIDs), and Grade 4 pineoblastomas (PBs), an embryonal tumor predominantly of pediatric onset [17, 29]. While resection alone will typically suffice for treatment of pineocytoma, the optimal adjuvant therapy needed for patients with PPTIDs is unclear, and many patients with PB succumb to their disease despite intensive cytotoxic chemotherapy as well as craniospinal radiotherapy, which is not feasible in young children [28].
Over the past few years, multi-omic profiling has enhanced our understanding of the biology that underlies pineal parenchymal tumors. In addition to loss of RB1 function, alterations in microRNA (miRNA) processing genes, including loss-of-function mutations and deletions targeting DICER1, DROSHA, and DGCR8, have emerged as prominent genetic events in PB [20, 22, 31, 35, 38]. Indeed, PB represents the most common CNS malignancy for individuals with germline DICER1 mutations (DICER1 syndrome) [9]. Genome-wide DNA methylation studies have demonstrated the molecular distinctiveness of PB despite histologic resemblance to other CNS embryonal tumors [7]. Parallel independent studies have recently described inter-tumoral heterogeneity, with four to five molecularly distinct groups of PB [20, 22, 31]. In addition to recurrent alterations in miRNA-processing genes and RB1, FOXR2 overexpression and MYC gain or amplification were observed in PBs from young children without other putative oncogenic drivers. Methylation analyses also suggest histologic PPTIDs and a subset of PBs together form an epigenetic group distinct from other PBs, with a majority exhibiting in-frame insertions in the Kelch domain of KBTBD4, a substrate adaptor for CUL3-based E3 ubiquitin ligase [6, 7, 19, 20, 31].
Optimal treatment strategies for patients with PB and PPTID remain unknown, as clinical trials to date have accrued few of these rare patients and/or grouped PB with other supratentorial CNS embryonal tumors [16, 32, 34, 40]. Current standard of care considers PB to be a high-risk pediatric embryonal brain tumor requiring maximal safe resection, followed by high-dose craniospinal irradiation (CSI) with tumor boost, and multi-agent chemotherapy, while strategies to delay or avoid radiotherapy have been used in very young children. Combined radio-chemotherapy approaches have also been extrapolated to the management of some PPTID, where clinical literature on optimal clinical care is scarce. Neurosurgical management of pineal parenchymal tumors is technically demanding [30]. Gross tumor removal is often advocated on the basis of medulloblastoma studies, although evidence supporting the value of aggressive resection for patients with PB is inconsistent [1, 16, 22, 28, 30, 44]. Furthermore, CSI with tumor boost, a critical prognostic modality for patients with embryonal tumors including PB, is not an option for infants due to adverse neuro-cognitive effects in survivors [27]. The benefit of high-dose chemotherapy with autologous stem cell rescue versus standard-dose chemotherapy is also unknown. Importantly, the impact of specific treatments on patient survival in the context of the newly recognized molecular groups of PB has yet to be evaluated [13].
To address these important and outstanding clinical questions, we assembled and examined a large international cohort of patients with molecularly characterized pineal parenchymal tumors. DNA-methylation profiling was used to exclude alternative CNS tumor diagnoses with histologic resemblance to pineal parenchymal tumors, and to distinguish PPTIDs from PBs. Complementary bioinformatic approaches were leveraged to define consensus molecular groups and reconcile previously proposed sub-entities [20, 22, 31]. The landscape of genomic alterations, clinical and treatment factors, patient outcome, and pattern of failure were comprehensively assessed.
Materials and Methods
Study design and patient treatment
This study encompassed a meta-analysis of children and adults with pineal parenchymal tumors from collaborative networks led by the German Cancer Research Center (DKFZ; n=134, inclusive of the Children’s Oncology Group [COG] ACNS0332 cohort [NCT00392327]), the Rare Brain Tumor Consortium/Hospital for Sick Children (RBTC/HSC; n=69), and St. Jude Children’s Research Hospital (SJCRH; n=41, inclusive of the SJMB03 [NCT00085202] cohort). With the exception of six new patients from the SJCRH cohort, all others have been reported in separate prior studies [16, 20, 22, 31]. Demographic features, clinical and histologic findings, treatment, and patient outcome were annotated and updated based on data availability. Based on reports from individual institutions or clinical trial databases, extent of resection was classified as gross-total resection (GTR), near-total resection (NTR), subtotal resection (STR), and biopsy (Bx); patients whose extent of resection were annotated only by amount of residual disease were considered to have received GTR/NTR if residual tumor was ≤1.5cm2, or STR/Bx if residual was >1.5cm2. Treatment regimens were summarized according to use, intensity, and extent of radiotherapy and/or chemotherapy prior to disease progression/relapse. Chemotherapeutic protocols involving autologous stem-cell rescue were considered as being high-dose chemotherapy regimens, and all others as standard-dose regimens. Protocols for the ACNS0332 and SJMB03 studies were detailed in previous reports [16, 22]. Patients enrolled on ACNS0332 received adjuvant irradiation at a uniform dose (36Gy CSI, tumor bed boost to 55.8Gy) with concurrent vincristine±carboplatin, followed by six cycles of standard-dose chemotherapy (cisplatin/vincristine/cyclophosphamide), with or without isotretinoin maintenance; patients enrolled on SJMB03 received adjuvant irradiation with risk-adapted CSI dose (localized without bulky residual disease=23.4Gy, metastatic or bulky residual disease=36Gy), tumor boost, and four cycles of high-dose chemotherapy (cisplatin/cyclophosphamide/vincristine). The study was performed according to local ethical and Institutional Review Board approval.
Genome-wide DNA methylation profiling and analysis
FFPE or frozen tumor-derived DNA was profiled on the Infinium HumanMethylation450 (450K) or EPIC BeadChips (Illumina) after bisulfite conversion (Zymo EZ DNA Methylation kit) as previously described [20, 22, 31]. DNA methylation data and statistical analysis were performed in R version 3.6.3 (www.R-project.org). Raw data were preprocessed using the minfi package (Bioconductor), filtered to remove probes on sex chromosomes or those which contained nucleotide polymorphisms, or were not uniquely mapped allowing for one mismatch [2]. Probes shared between the 450K and EPIC arrays were used for analyses. DNA methylation profiles from all samples were compared to a large CNS tumor reference cohort (n>40,000, DKFZ) using t-stochastic neighbor embedding (t-SNE) visualization to exclude molecular outliers, and methylation array-based genotyping was used to identify duplicate samples.
To define tumor groups in the resulting combined cohort, the top 5,000–15,000 variably methylated probes based on standard deviation were used in unsupervised cluster analyses by t-SNE, uniform manifold approximation and projection (UMAP), and nonnegative matrix factorization (NMF) [12, 23, 25]. Further analyses by k-means and hierarchical clustering (HC, ConsensusClusterPlus package v1.44.0) were applied to resolve ambiguous sample membership assignments [42]. Samples that remained unstable in group membership across multiple methods were excluded from downstream analyses. For t-SNE, default parameters were used except for perplexity=10, max_iter=10,000 (Rtsne v0.15). For UMAP, default parameters were used except n_epochs = 5,000 (umap v0.2.2). NMF analysis was performed with ranks (k) 2–10 at 100 runs (NMF v0.20.6). For HC, 1-Pearson correlation for distance measuring and average linkage was used; other settings were default except maxK=10 and reps=10001. k-means was performed with Euclidean for distance measuring and average linkage, with other settings default except maxK=10 and reps=10001. To determine focal and broad chromosomal copy number variations (CNVs), the conumee package was used to generate individual copy-number profiles (https://bioconductor.org/packages/release/bioc/html/conumee.html). Recurrent alterations were identified with GISTIC2 and then validated manually, and composite copy-number profiles per group were assembled based on pre-set thresholds (cut-off for gains=0.15, losses=0.2) [15, 26].
Genomic and transcriptomic profiling
Somatic and germline driver mutations were studied through whole genome sequencing (WGS), whole exome sequencing (WES) or panel-based sequencing as previously described (Supplementary Table 1) [20, 22, 31]. Specifically, tumor-only panel sequencing was performed on samples from the DKFZ cohort using an updated 160-gene version of a targeted neuro-oncology panel [36]; tumor-only or paired germline-tumor sequencing for the RBTC/HSC cohort was performed using a combination of whole-exome sequencing (WES) (Genome Quebec or The Centre for Applied Genomics) and targeted sequencing with a six-gene panel for RB1 and miRNA-processing genes (DICER1, DROSHA, DGCR8, XPO5, TARBP2) or a more restricted panel for DICER1 and TP53 (ResourcePath, Sterling, VA); while tumor-only or paired WGS/WES was performed for the SJCRH cohort and a subset of DKFZ samples. Filtered variants were compiled and frame-shifting or truncating variants (FTVs) in DICER1, DROSHA, DGCR8, and RB1, as well as hotspot missense mutations in the RNase IIIb domain of DICER1, were further curated to ensure stringency, as an expanded mutational analysis did not reveal additional putative drivers (data not shown). In samples molecularly classified as PPTID, sequencing read alignments were manually inspected for exon 4 insertions in KBTBD4. Tumor allele frequencies were interpreted in conjunction with methylation-based CNV analysis to infer loss-of-heterozygosity (LOH).
Normalized gene matrices from all samples were combined for transcriptomic analysis. HC was performed based on the top 100 most variably expressed genes to determine transcriptomic similarities among samples. Expression boxplots were created by taking the log2(Normalized counts+1) and likelihood ratio test for differences in expression among groups. Differential expression and gene-set enrichment analysis (GSEA) was performed as previously described [22].
Clinical correlative and statistical analysis
Continuous variables were expressed by medians and ranges, while categorical variables were summarized by frequencies and percentages. Comparison of variables among molecular groups was performed by Fisher’s exact and Wilcoxon rank-sum tests. For survival analyses, patients with incomplete treatment information on use of adjuvant therapy were excluded in analyses related to chemotherapy and radiotherapy use. In the comparison of patient outcome between the COG ACNS0332 and SJMB03 trials that enrolled patients ≥3 years of age, those with non-metastatic disease who underwent GTR/NTR were considered as having average-risk disease and others, as having high-risk disease. The date of diagnosis was defined as the date of first biopsy or resection. Overall survival (OS) was defined as the duration between the date of diagnosis and date of either death from any cause or last follow-up; progression-free survival (PFS) was defined as the duration between the date of diagnosis and date of either progression, relapse, death from any cause, or last follow-up. Survival comparisons were performed via log-rank testing and Cox regression.
Results
Consensus molecular grouping in pineal parenchymal tumors
After exclusion of molecular outliers and genotype duplicates, methylation profiles from 224 patients were used to determine consensus molecular grouping (Figure 1a–b). Implementation of dimensionality reduction and clustering analyses resulted in robust assignment of 221 patient samples to five main groups (99%, Supplementary Figure 1 and Supplementary Table 2); three patients with unstable group membership were excluded from subsequent genomic and clinical analyses. We designated the five consensus groups, which largely aligned with findings from previous independent studies (Figure 1c), as PB-miRNA1, PB-miRNA2, PB-MYC/FOXR2, PB-RB1, and PPTID, respectively comprising 43% (n=96), 10% (n=23), 15% (n=34), 11% (n=25), and 19% (n=43) of the 221 samples. In keeping with a previous report, we observed further methylation subclusters within the PB-miRNA1 (referred to as PB-miRNA1a and PB-miRNA1b) and PPTID (PPTID-a and PPTID-b) groups, however no specific genomic or clinical features and significant association with outcome were associated with these subclusters (Figure 1b and Supplementary Table 3), and as such they are not currently included in the broader consensus grouping [31]. Histopathologic grading of tumors correlated with molecular classification for the majority of samples (i.e. histologic CNS embryonal tumors [Grade 4] with molecular PBs, histologic PPTID [Grade 2 or 3] with molecular PPTID; Table 1 and Figure 1d), but 14% (3/21) and 11% (21/192, 17 PB, 4 PNET) of tumors with histology reported as PPTIDs or CNS embryonal tumors had discrepant molecular classification. Two samples with histologic labels of pineal anlage tumors segregated within PB-MYC/FOXR2.
Figure 1.
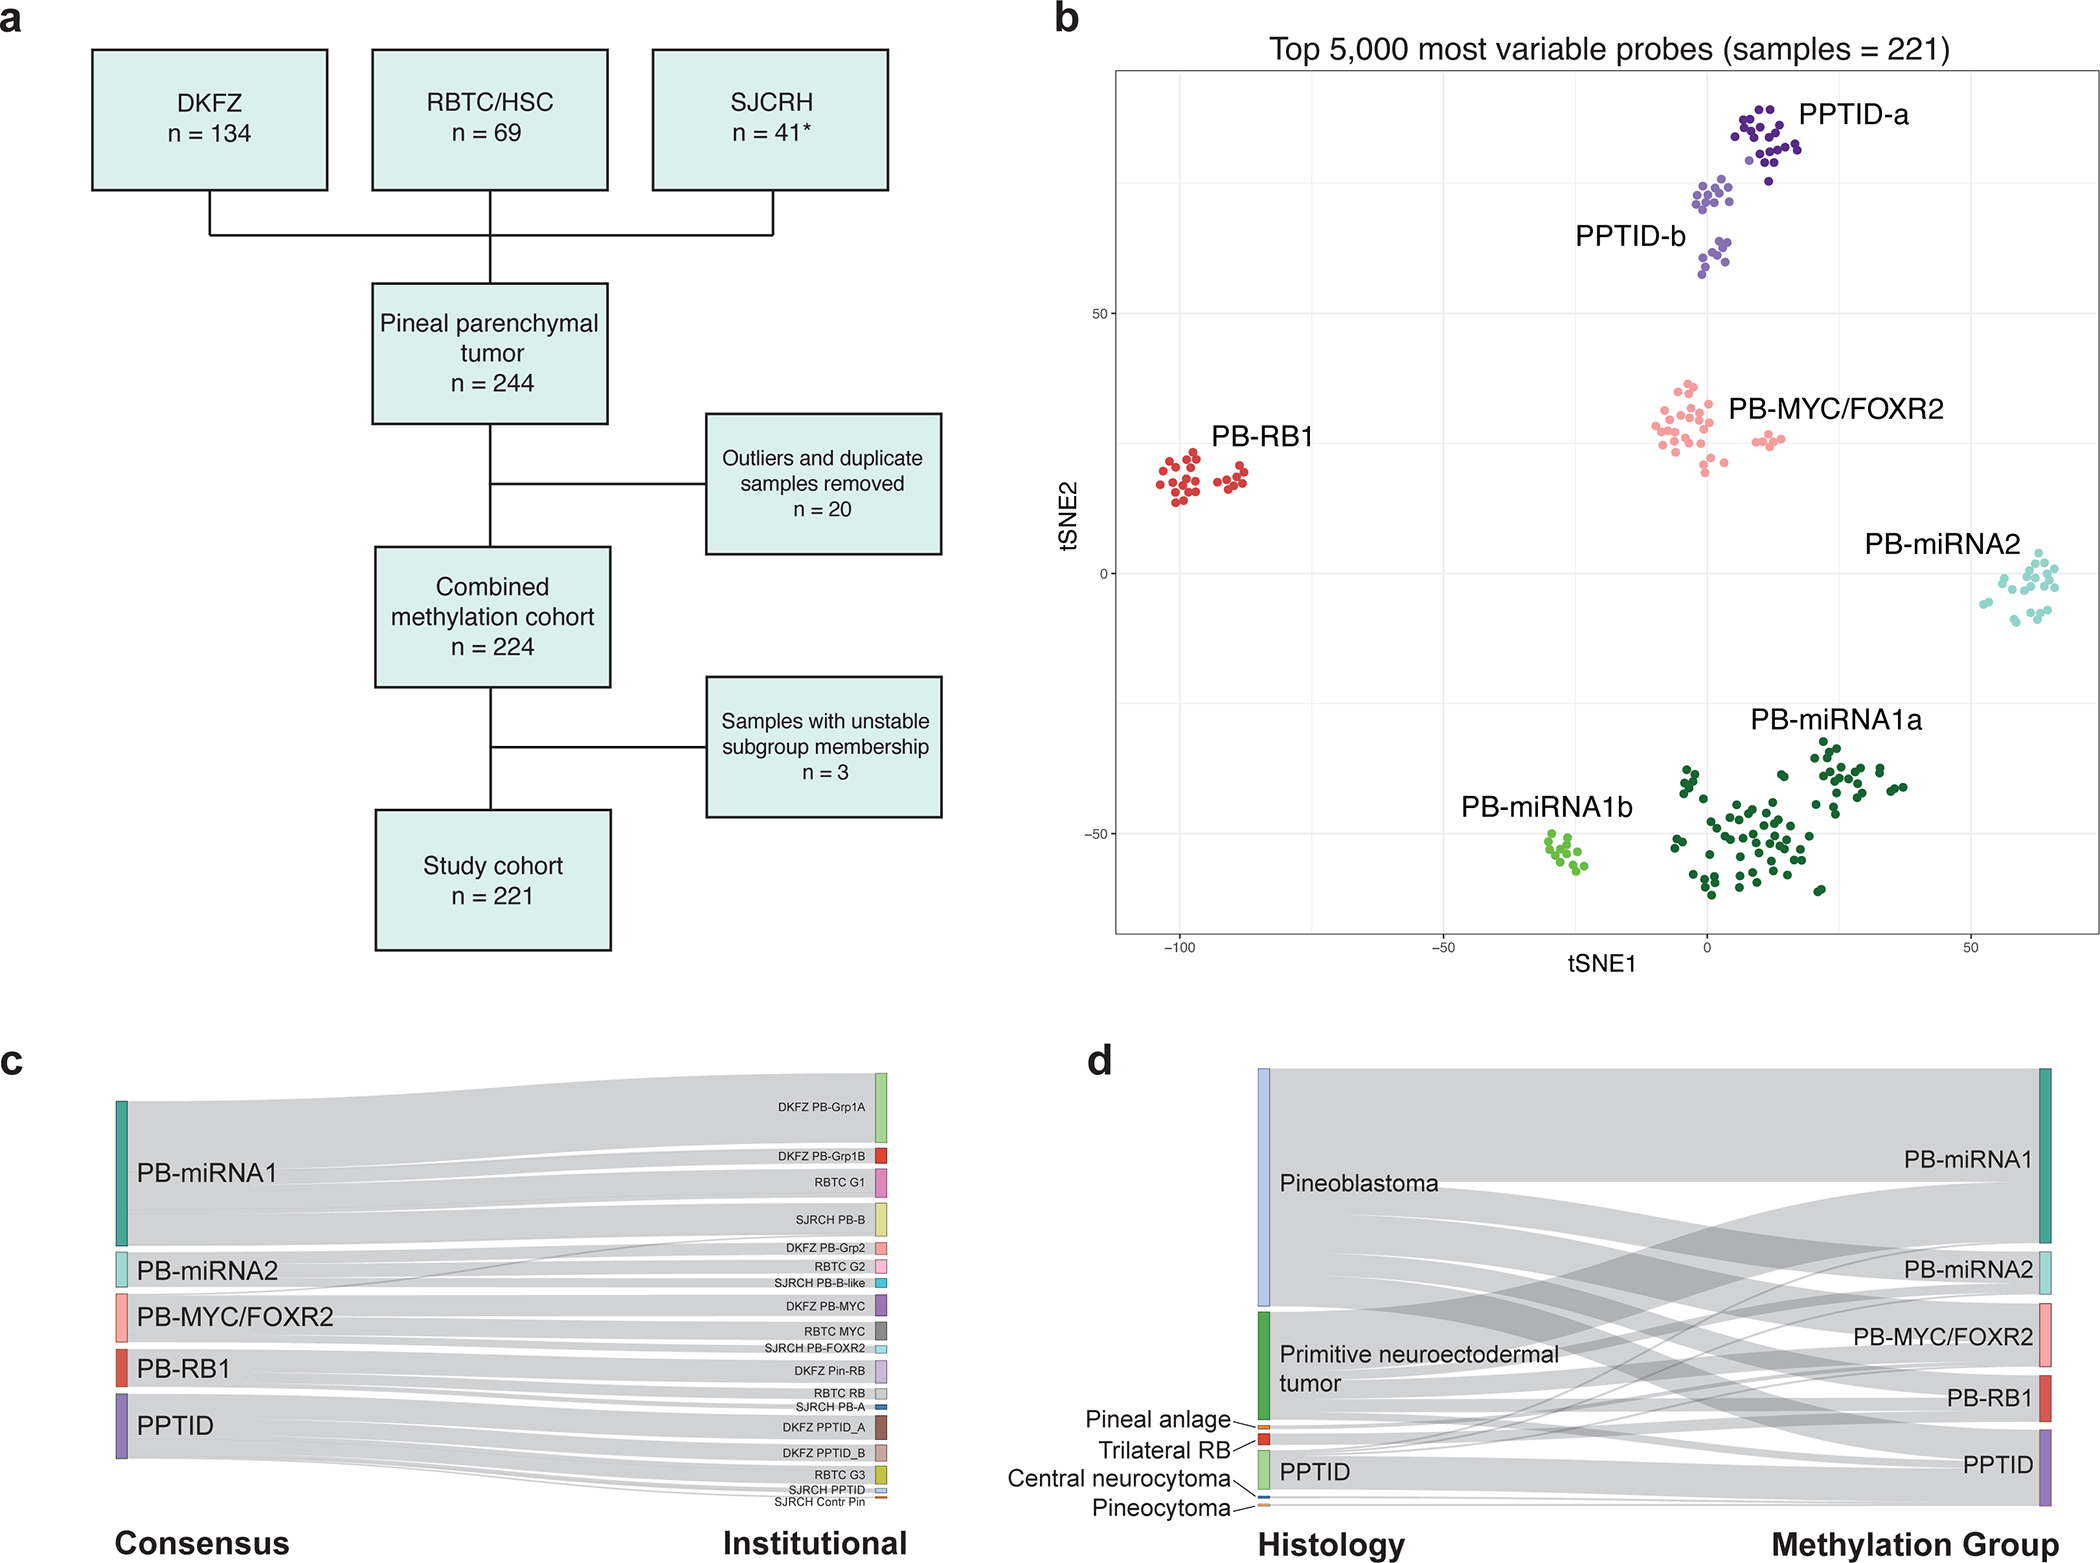
(a) Composition of the consensus study cohort (* including six new patients). (b) t-SNE representation of consensus molecular groups of pineal parenchymal tumors. (c) Relationship between consensus methylation classes and original institutional designations. (d) Relationship between histologic diagnosis and methylation groups. DKFZ, German Cancer Research Center; PPTID, pineal parenchymal tumor of intermediate differentiation; RB, retinoblastoma; RBTC/HSC, Rare Brain Tumor Consortium/Hospital for Sick Children; SJCRH, St. Jude Children’s Research Hospital.
Table 1.
Demographics, clinical characteristics and outcome of patients according to consensus molecular grouping
| Characteristics (number with data available) | Entire cohort | Molecular Groups | P value | ||||
|---|---|---|---|---|---|---|---|
|
| |||||||
| PB-miRNA1 | PB-miRNA2 | PB-MYC/FOXR2 | PB-RB1 | PPTID | |||
| N=221 | N=96 | N=23 | N=34 | N=25 | N=43 | ||
|
| |||||||
| Age of diagnosis (N=188) median (range) – year(s) | 8.4 (0.0–64.0) | 8.5 (2.00–41.5) | 11.8 (1.33–31.5) | 1.4 (0.0–21.0) | 2.1 (0.10–3.94) | 33.0 (3.50–64.0) | <0.001 |
| <3 years | 42 (22%) | 5 (6%) | 1 (5%) | 19 (73%) | 17 (77%) | 0 | <0.001 |
| ≥3 – <18 years | 115 (61%) | 71 (86%) | 19 (86%) | 6 (23%) | 5 (23%) | 14 (40%) | |
| ≥18 years | 31 (17%) | 7 (8%) | 2 (9%) | 1 (4%) | 0 | 21 (60%) | |
| Sex (N=221) | 0.003 | ||||||
| Female | 113 (51%) | 59 (62%) | 9 (39%) | 8 (24%) | 13 (52%) | 24 (56%) | |
| Male | 108 (49%) | 37 (39%) | 14 (61%) | 26 (77%) | 12 (48%) | 19 (44%) | |
| Metastasis (N=138) | 0.01 | ||||||
| Yes | 54 (39%) | 28 (42%) | 3 (16%) | 9 (43%) | 11 (69%) | 3 (20%) | |
| No | 84 (61%) | 39 (58%) | 16 (84%) | 12 (57%) | 5 (31%) | 12 (80%) | |
| Histology (N=217) | -- | ||||||
| Pineoblastoma | 128 (59%) | 61 (65%) | 17 (74%) | 21 (62%) | 12 (48%) | 17 (42%) | |
| PNET | 58 (27%) | 32 (34%) | 5 (22%) | 10 (29%) | 7 (28%) | 4 (10%) | |
| Trilateral retinoblastoma | 6 (3%) | 0 | 0 | 0 | 6 (24%) | 0 | |
| Pineal anlage tumor | 2 (1%) | 0 | 0 | 2 (6%) | 0 | 0 | |
| PPTID | 21 (10%) | 1 (1%) | 1 (4%) | 1 (3%) | 0 | 18 (44%) | |
| Pineocytoma | 1 (1%) | 0 | 0 | 0 | 0 | 1 (2%) | |
| Central neurocytoma | 1 (1%) | 0 | 0 | 0 | 0 | 1 (2%) | |
| Surgery (N=134) | 0.64 | ||||||
| Gross/near-total resection | 63 (47%) | 27 (43%) | 9 (50%) | 11 (55%) | 6 (37.5%) | 10 (59%) | |
| Subtotal resection/biopsy | 71 (53%) | 36 (57%) | 9 (50%) | 9 (45%) | 10 (62.5%) | 7 (41%) | |
| Radiotherapy (N=122) | <0.001 | ||||||
| Craniospinal irradiation | 87 (71%) | 56 (88%) | 14 (88%) | 4 (22.2%) | 6 (54.5%) | 7 (54%) | |
| Focal radiotherapy | 11 (9%) | 3 (5%) | 1 (6%) | 4 (22.2%) | 0 | 3 (23%) | |
| No radiotherapy | 24 (20%) | 5 (8%) | 1 (6%) | 10 (55.6%) | 5 (45.5%) | 3 (23%) | |
| Chemotherapy (N=126) | <0.001 | ||||||
| High-dose | 58 (46%) | 36 (56%) | 8 (44%) | 5 (27.8%) | 4 (36.4%) | 5 (33%) | |
| Standard-dose | 57 (45%) | 28 (44%) | 7 (39%) | 11 (61.1%) | 7 (63.6%) | 4 (27%) | |
| No chemotherapy | 11 (9%) | 0 | 3 (17%) | 2 (11.1%) | 0 | 6 (40%) | |
|
Duration of follow-up median (range) – year(s) |
4.00 (0.00–17.0) | 4.88 (0.58–14.6) | 4.09 (0.50–10.1) | 1.33 (0.00–17.0) | 1.50 (0.20–13.7) | 4.75 (0.25–13.9) | <0.001 |
| Progression-free survival (PFS) | <0.001 | ||||||
| 2-year PFS (95%CI) | 66.7% (59.3–74.9) | 74.8% (65.1–86.0) | 94.7% (85.2–100) | 33.3% (18.9–58.7) | 38.5% (21.2–69.8) | 80.8% (63.4–100) | |
| 5-year PFS (95%CI) | 51.4% (43.5–60.8) | 56.7% (45.7–70.4) | 86.1% (69.5–100) | 16.7% (7.0–44.4) | 19.2% (7.1–52.2) | 80.8% (63.4–100) | |
| Overall survival (OS) | <0.001 | ||||||
| 2-year OS (95%CI) | 80.5% (74.3–87.3) | 92.4% (86.1–99.0) | 100% | 41.7% (26.0–66.9) | 55.9% (37.1–84.2) | 93.3% (81.5–100) | |
| 5-year OS (95%CI) | 62.2% (54.2–71.4) | 70.3% (59.6–82.9) | 100% | 23.8% (10.7–52.8) | 29.8% (14.0–63.6) | 86.2% (70.0–100) | |
CI, confidence interval; PNET, primitive neuroectodermal tumor; PPTID, pineal parenchymal tumor of intermediate differentiation
Although pineal tumors, particularly PB, have generally been considered as a disease of younger children, 59% of our cohort was between ≥3–18 years of age, children <3 years represented 24% of patients, while adults (≥18 years) represented 17% of patients in our combined cohort. However, patient demographics and disease features were significantly different across the five consensus groups (Table 1). PB-miRNA1 or PB-miRNA2 patients were more commonly older children or young adolescents (median age at diagnosis: 8.5 years and 11.8 years, respectively), while patients with PB-MYC/FOXR2 and PB-RB1 were younger children (median age at diagnosis: 1.4 years and 2.1 years, respectively; Fisher’s exact p<0.0001). Sixty percent of molecularly defined PPTIDs were adults (≥18 years) with a median age of 33 years. Despite the absence of sex predilection (female:male=113:108; 51%:49%) across the entire cohort, 61% (14/23) of patients in the PB-miRNA2 group and 77% (26/34) of patients in the PB-MYC/FOXR2 group were male (Fisher’s exact p=0.003). Metastatic status also differed significantly between tumor groups (Fisher’s exact p=0.012). Patients from the PB-miRNA1, PB-miRNA2, PB-MYC/FOXR2 and PPTID groups more likely presented with localized disease (42%, 16%, 43%, and 20% respectively demonstrating metastasis at diagnosis). In contrast, 69% of patients from the PB-RB1 groups had metastatic disease at diagnosis.
The genomic landscape of pineal parenchymal tumors
Tumor molecular groups were enriched for distinct driver gene alterations and broad chromosomal copy-number variations (CNVs, Figure 2). Overall, 65% (53/82) of sequenced tumors from the miRNA groups had mutually exclusive alterations of miRNA-processing genes. Among 61 PB-miRNA1 samples sequenced, FTVs, and/or focal losses of DICER1, DROSHA, and DGCR8 were observed in 16 (26%), 15 (25%), and 5 (8%) cases, respectively; additional samples with focal DROSHA (n=7, 20%) and DGCR8 (n=2, 6%) loss were identified by copy-number analysis in cases without sequencing data (n=35). PB-miRNA1 tumors also had frequent arm-level gains of chromosome 7, 12, and 17. Amongst 21 PB-miRNA2 samples with sequencing data, we observed DICER1 and DROSHA alterations respectively in 11 (52%) and 6 (29%) tumors while 15 (71%) had chr 14q loss. Comparison between DICER1-altered PB-miRNA1 and miRNA2 tumors did not reveal differences in the genetic region affected by mutations (Figure 2c). However, while DICER1 FTVs in PB-miRNA2 tumors were always accompanied by chr 14q loss (presumably leading to complete loss-of-function), PB-miRNA1 tumors most commonly exhibited two different FTVs, or FTV with apparent copy-number neutral LOH (Figure 2d). Notably, the available paired tumor-control sequencing data available showed that 6/12 patients with DICER1-altered PBs had DICER1 mutations that were germline in origin, and were encountered in both PB-miRNA1 and 2 subgroups. In contrast to other DICER1-associated CNS and extra-CNS tumors, no hotspot missense mutations in the DICER1 RNase IIIb domain were present in our cohort [9, 11, 18].
Figure 2.

Recurrent genomic events in pineal parenchymal tumors. (a) Oncoprint depicting nature of driver alterations and recurrent copy-number variations (CNVs) by methylation group. (b) Composite genome-wide CNV plots by methylation groups. (c) Comparison of DICER1 variants and (d) types of DICER1 alterations identified in PB-miRNA1 vs. PB-miRNA2 tumor samples. chr, chromosome; DKFZ, German Cancer Research Center; FTV, frameshifting or truncating variant; RBTC/HSC, Rare Brain Tumor Consortium/Hospital for Sick Children; LOH, loss of heterozygosity; SJCRH, St. Jude Children’s Research Hospital; y, year(s)
Among 34 PB-MYC/FOXR2 tumors, CNV analyses showed recurrent broad chr 8p and 16q loss (Figure 2). Broad chr 8q gain encompassing MYC was observed in 6/34 (18%) tumors, with focal MYC amplification seen in 2/34 (6%). No recurrent genetic driver mutations were detected in 23 PB-MYC/FOXR2 tumors sequenced. However, RNA-seq data available for four non-MYC amplified tumors indicated subgroup-specific (among 18 tumors with RNA-seq in the entire cohort) over-expression of the FOXR2 proto-oncogene (Figure 3 and Supplementary Figure 2). Thirteen of 16 (81%) sequenced PB-RB1 tumors harbored FTV (n=8), focal deletion (n=4), or a combination of FTV and focal deletion (n=1) involving RB1. Focal gain of miR-17/92 was observed in 4/16 (25%) sequenced samples, including three with RB1 alteration. Of nine PB-RB1 samples without sequencing data, one each respectively carried focal RB1 loss and miR-17/92 gain. Similar to observations in retinoblastoma, chr 1q and 6p gain and chr 16 loss were common cytogenetic events in PB-RB1 [5]. Six of 25 patients (24%) from this subgroup had a clinical diagnosis of trilateral retinoblastoma, which is considered pathognomonic for RB1 predisposition syndrome (Table 1 and Figure 1d). In the PPTID group, chromosomal CNVs were infrequent, however 20/27 of samples (74%) with sequencing that included KBTBD4 had hotspot in-frame insertions in the Kelch domain. Adult patients (≥18 years) in the PPTID group were more likely to have KBTBD4-mutant tumors than patients <18 years of age (15/17 vs. 3/7, Fisher’s exact p=0.038, Supplementary Table 4).
Figure 3.

Transcriptomic analysis of study samples (n=18). (a) Clustering based on top 100 differentially expressed genes. (b) Comparison of expression level of CRX – canonical pinealocyte marker, FOXR2, RB1 among tumor groups. (c) Differential expression analysis between tumors from specific groups versus all other samples. DKFZ, German Cancer Research Center; SJCRH, St. Jude Children’s Research Hospital
Clustering analyses of available gene expression data (n=18) recapitulated the molecular grouping derived from methylation analysis (Figure 3). High CRX expression was observed across tumor groups supporting their pineal lineage. GSEA revealed enrichment of “immune-related” and “positive regulation of ERK1 and ERK2 cascade” gene-ontology (GO) terms with significant overexpression of MAP3K19 in PB-miRNA1 tumors, while enrichment of the “phototransduction” GO term was observed in PB-MYC/FOXR2 tumors (Figure 3c).
Outcome for patients with molecularly-classified pineal parenchymal tumors
Reflecting the challenge of surgery for pineal region tumors, only 63/134 patients (47%) with surgical data underwent GTR/NTR. Among 122 patients with radiation treatment data, 87 (71%) received CSI, while 11 (9%) and 24 (20%) respectively had focal or no radiotherapy. Amongst 126 patients with data on applied chemotherapy, 58 (46%), 57 (45%), and 11 (9%) of patients respectively received high-dose, standard-dose, or no chemotherapy.
Complete data on adjuvant therapy and survival were available for 121 (55%) and 152 (69%) patients respectively (Supplementary Table 1). The median duration of follow-up was 4 years (range 0–17) for all patients and 5.3 years (range 0.3–17) for surviving patients. Overall, PFS and OS rates were significantly different across molecular groups (PFS and OS log-rank p<0.0001, Figure 4a–d, Supplementary Figure 3a–f). Patients with PB-miRNA2 had superior 5-year PFS and OS of 86.1% (95% confidence interval [CI]: 69.5–100) and 100%, respectively, while PB-miRNA1 patients exhibited intermediate outcomes with respective 5-year PFS and OS of 56.7% (95%CI: 45.7–70.4) and 70.3% (95%CI: 59.6–82.9). Patients with PB-MYC/FOXR2 and PB-RB1 had dismal outcomes with respective 5-year PFS of 16.7% (95%CI: 7.0–44.4) and 19.2% (95%CI: 7.1–52.2) and respective 5-year OS of 23.8% (95% CI: 10.7–52.8) and 29.8% (95%CI: 14.0–63.6). For patients with molecularly-defined PBs, age (PFS and OS log-rank p<0.0001), metastatic status (PFS log-rank p=0.0041; OS log-rank p=0.0031), use and extent of radiotherapy (PFS and OS log-rank p<0.0001), and extent of surgery (GTR/NTR vs. STR/Bx, PFS log-rank p=0.036) were significantly associated with patient outcome (Figure 4c–d, Supplementary Figure 4a–j). Accounting for metastatic status, GTR/NTR conferred a benefit only in patients with non-metastatic disease (Supplementary Figure 5a–b). When patients with molecularly-defined PBs were stratified according to radiation extent (CSI vs. focal/no RT), the prognostic significance of molecular groups and clinical factors remained in those who received CSI (Supplementary Figure 3a–f).
Figure 4.

Progression-free (PFS) and overall survival (OS) of (a-b) the entire study cohort by methylation groups; and (c-d) outcome of molecularly defined pineoblastomas according to clinical and molecular factors. Bx, biopsy; CSI, craniospinal irradiation; GTR, gross-total resection; M0, non-metastatic; M+, metastatic; NTR, near-total resection; STR, subtotal resection; y, year(s)
Clinical and treatment related prognostic features according to molecular groups
Analysis by subgroups revealed varied impact of clinical and treatment factors on outcome (Supplementary Figure 6 and 7). Age, extent of resection (GTR/NTR vs. STR/Bx), and RT regimen (CSI vs. focal/no RT) were significantly associated with outcome in PB-miRNA1 but not in other PB subgroups. All three patients with metastatic disease and data on outcome in PB-miRNA2 subgroup survived without progression, whereas those with PB-MYC/FOXR2 and PB-RB1 were at risk of progressive disease regardless of disease extent. All patients with PB-miRNA2 and data on outcome survived. While the majority received CSI and high-dose chemotherapy, one patient received focal radiotherapy with high-dose chemotherapy, and three patients received CSI with standard-dose chemotherapy. Long-term survival in the PB-MYC/FOXR2 and PB-RB1 subgroups was anecdotal. Three progression-free survivors in the PB-MYC/FOXR2 subgroup with complete information on adjuvant therapy received CSI with high-dose chemotherapy, CSI with standard-dose chemotherapy, and high-dose chemotherapy alone respectively, while the two survivors with PB-RB1 underwent CSI with high-dose chemotherapy and CSI with standard-dose chemotherapy. Patients with molecularly defined PPTID had 5-year PFS and OS rates of 80.8% (95%CI: 63.4–100) and 86.2% (95%CI: 70.0–100), respectively. Both patients with metastatic disease and data on outcome died of progression, and in contrast three patients with localized disease remained in remission after focal therapy with (n=2) or without (n=1) chemotherapy. Among patients in the PB-miRNA1/2, PB-RB1 and PPTID subgroups, survival did not differ according to the presence or absence of specific driver alterations (Supplementary Figure 8).
Comparison of outcome by clinical trials
Outcome was not significantly different among patients enrolled on the COG ACNS0332 (n=25) and SJMB03 (n=27) trials (Supplementary Table 5, Supplementary Figure 9). When stratified by extent of resection and metastatic status, patients of the PB-miRNA1 or 2 group with average-risk disease (GTR/NTR and non-metastatic) had 100% 5-year PFS and OS on either trial, while the outcome of those with high-risk disease (STR/Bx or metastatic) did not differ significantly.
Pattern of failure and salvage therapy
Site of disease progression was annotated in 29 patients, with 21 (72%) suffering from distant failure, five (17%) from combined distant and local failure, and three (10%) with local failure only (Supplementary Table 6). The site of failure did not differ significantly by molecular subgroup or radiotherapy use and extent. Seven patients were alive at last follow-up for more than one year after disease progression, and details on second-line therapy were available for five patients, all of whom were salvaged by CSI with chemotherapy in the context of upfront therapy that consisted of focal or no radiotherapy (Supplementary Table 7).
Discussion
Based on the largest reported molecularly-defined pineal parenchymal tumor cohort, we harmonized data on previously described inter-tumoral heterogeneity in PB and proposed the nomenclature of consensus molecular groups – PB-miRNA1, PB-miRNA2, PB-MYC/FOXR2 and PB-RB1 (Figure 5). These entities are characterized by critical differences in demographic, clinical and genomic features, and display significant discrepancies in patient survival. Analysis of the molecularly-defined PB cohort recapitulated known prognostic factors, such as metastatic status, age at diagnosis, and radiation use. Importantly, extent of initial surgical resection was only significantly associated with patient survival in patients with non-metastatic disease. It is possible that previously reported benefit of more aggressive resection was confounded by higher rates for total tumor removal in patients with localized disease [22, 39]. The recognition of heterogeneity within PB is key to enhancing patient outcome, as the effect of adjuvant treatment can be scrutinized in the context of such tumor biology in the future. Accordingly, treatment intensity may be adapted and use of experimental therapies prioritized in upcoming studies.
Figure 5.
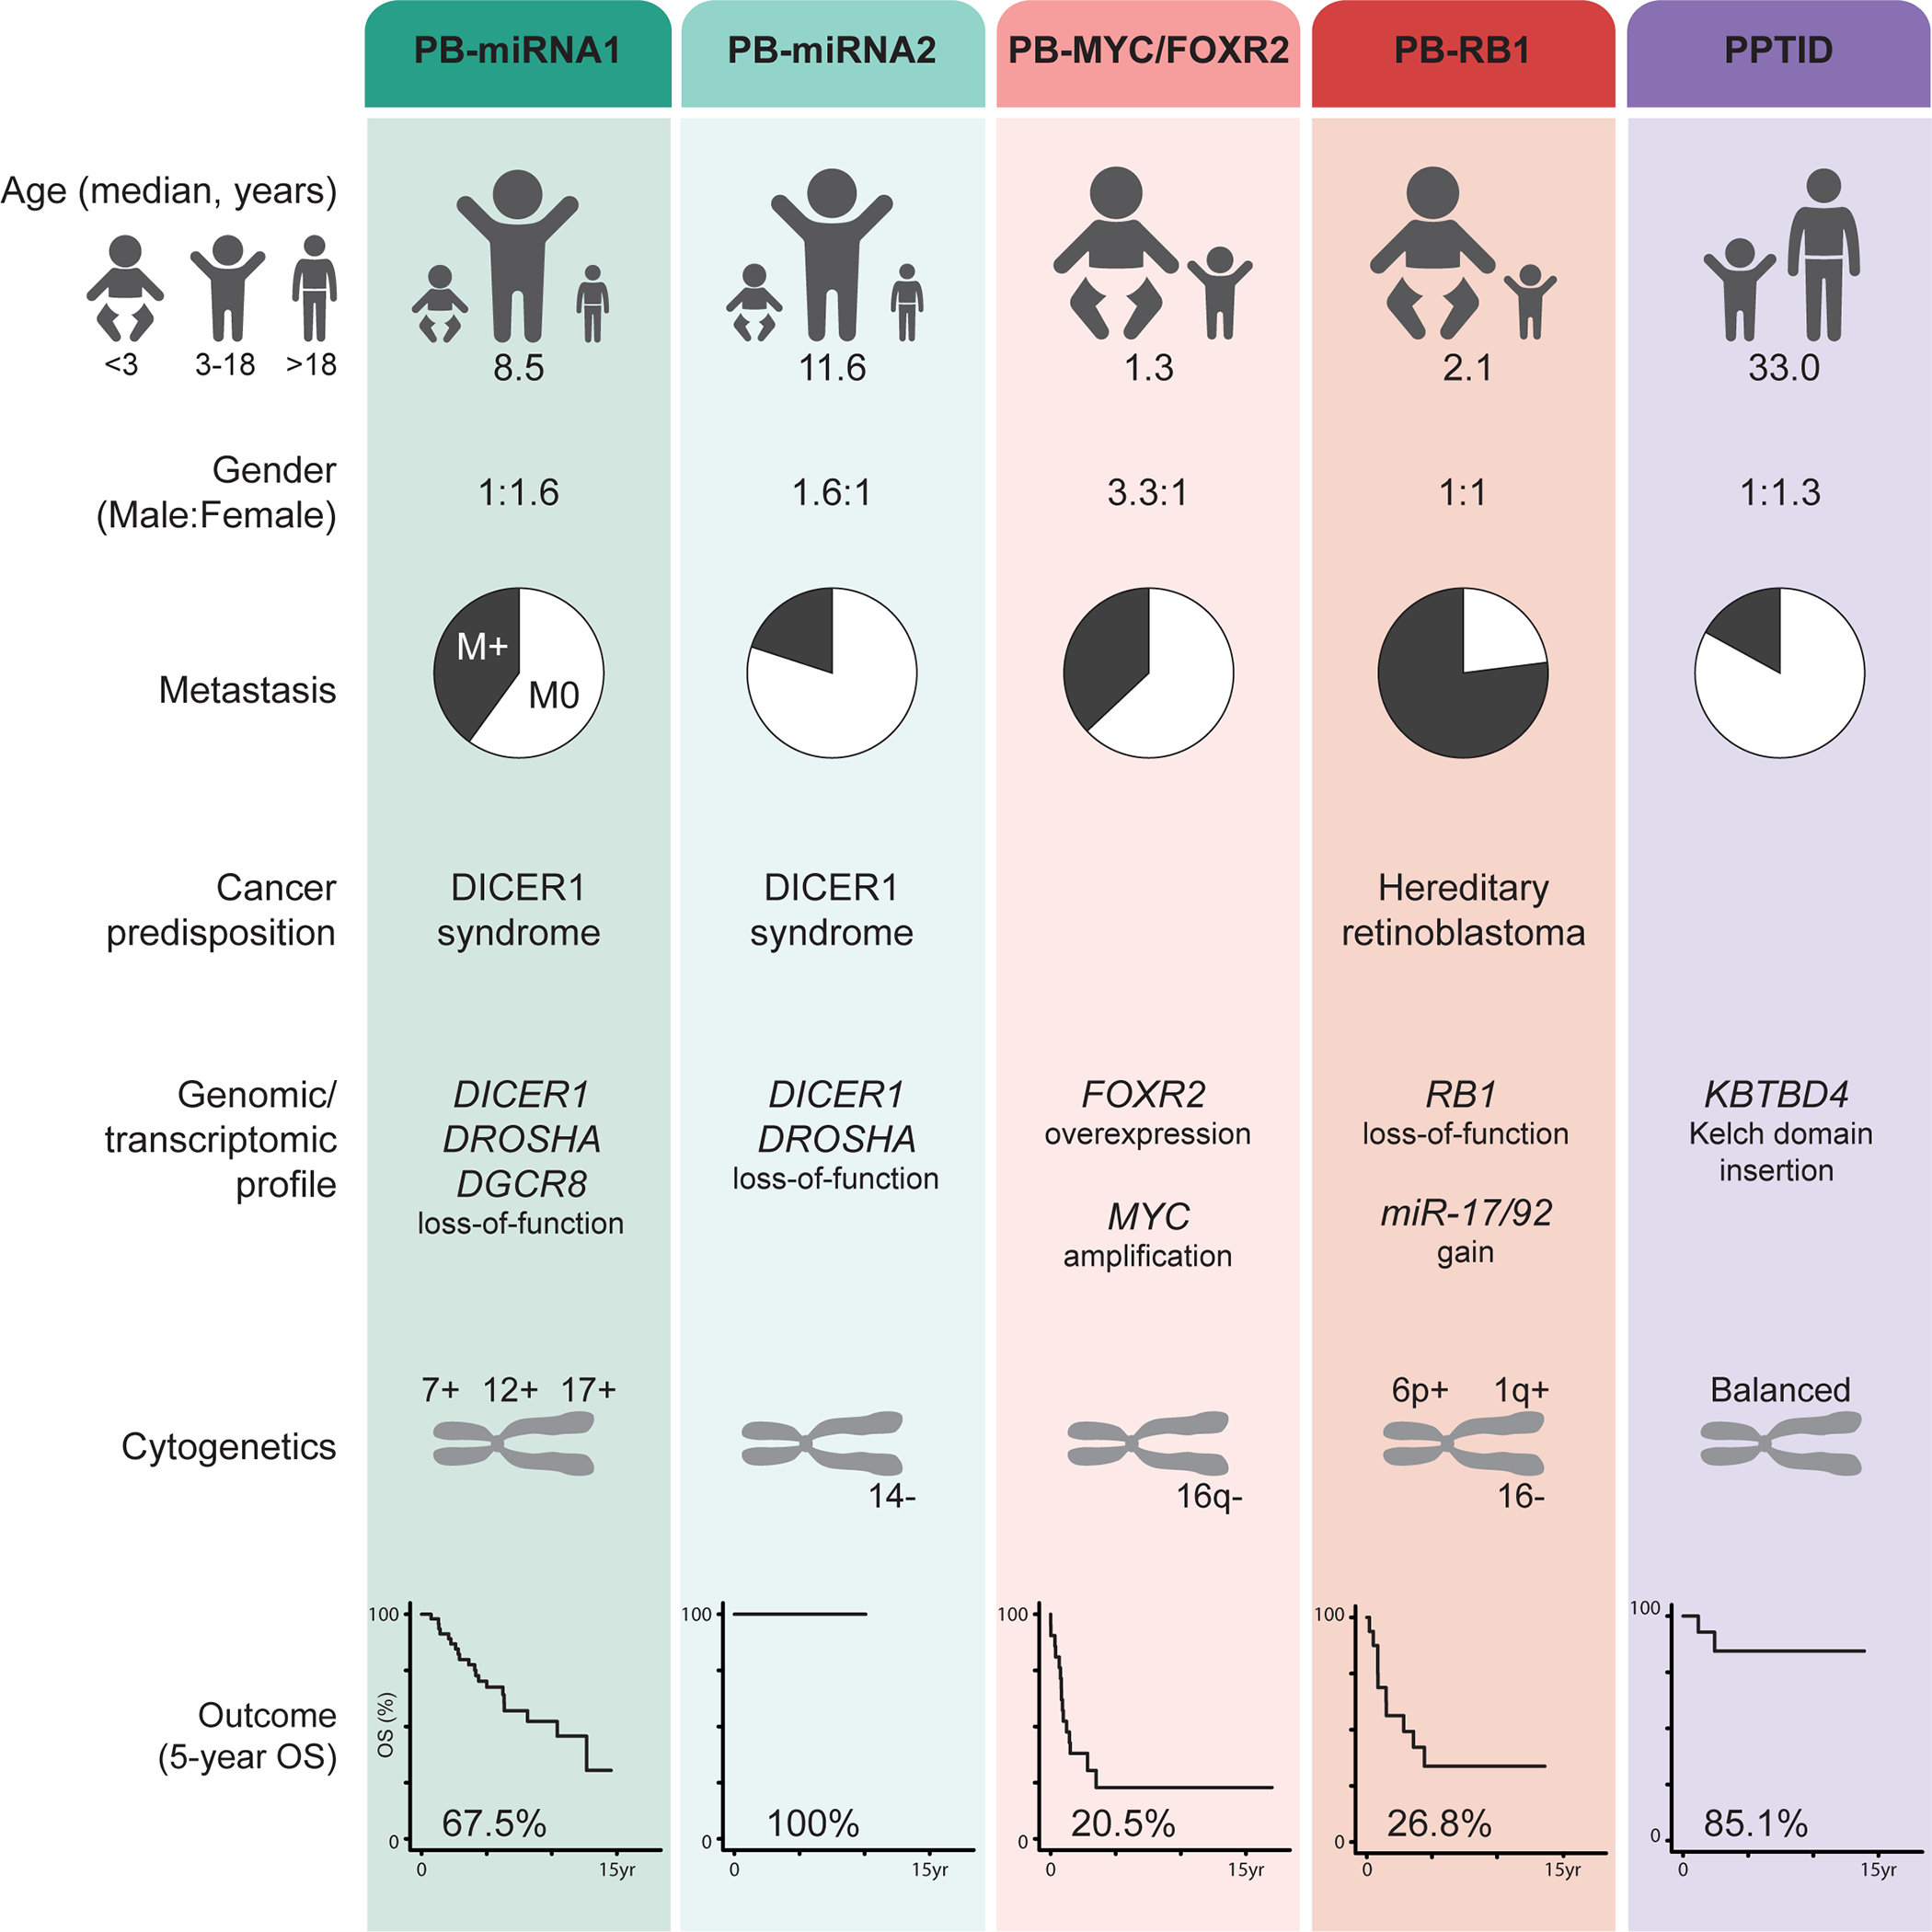
Summary of clinical and molecular characteristics of consensus pineal parenchymal tumor groups. M0, non-metastatic; M+, metastatic; OS, overall survival
PBs with altered miRNA-processing pathway, PB-miRNA1 and PB-miRNA2, were more commonly seen in older children and represented nine out of ten patients known to be in the adult age group from our cohort. Despite a reasonably similar treatment approach that incorporated CSI in >80% of patients in both groups, stark differences in outcome were observed. All patients in the PB-miRNA2 group with reported outcome survived, including one who received only focal radiation and chemotherapy. The omission of adjuvant therapy in one patient (Supplementary Table 6), however, resulted in early relapse but was salvaged with a CSI-containing regimen. On the contrary, patients with PB-miRNA1 carried an intermediate outcome. Comparison of patients from PB-miRNA1 and 2 groups managed on the COG ACNS0332 and SJMB03 trials suggest that 23.4Gy of CSI would suffice for patients with localized disease and satisfactory surgical resection. Patients with incompletely resected or metastatic PB-miRNA1 disease, however, had suboptimal outcome that was not improved by dose-intense chemotherapy on SJMB03. Notably, these patients uniquely exhibited late disease progression, calling for the consideration of maintenance therapy and the need for more protracted disease surveillance. Mechanisms that underlie the varied disease aggressiveness between these two groups remain elusive, although group-specific patterns of miRNA-processing gene alterations were observed. Specifically, PB-miRNA2 had higher rates of tumors with DICER1 alterations than in PB-miRNA1; and while it is now known that PBs tolerate biallelic inactivation of DICER1, we demonstrate that DICER1-mutant PB-miRNA2 tumors universally carry whole chr 14q loss as the second-hit mechanism [10, 11]. In two sibling patients sharing the same germline DICER1 FTV, a second FTV versus 14q loss as the somatic hit resulted respectively in tumors with PB-miRNA1 (SJPB26, M3 disease with very high Ki67) and PB-miRNA2 (RBTC803, M0 disease with 10–15% Ki67) grouping. This contrast suggests that the nature of events leading to complete loss of DICER1 function may dictate disease course in PBs, reminiscent of the association between atypical rhabdoid/teratoid tumor subgroups and different mechanisms of SMARCB1 loss [14]. The remarkable absence of hotspot missense mutations in DICER1-altered PBs would also aid differentiation from other DICER1-altered embryonal tumors which may arise from the pineal region [18, 22]. In view of the upregulation of immune-related GO terms in PB-miRNA1, group-specific tumor microenvironment and possible immune infiltrates might be exploited as therapeutic vulnerabilities in future clinical trials.
Among children less than three years with molecularly-defined PB, 45% belonged to PB-MYC/FOXR2, and 40% to PB-RB1. Outcome for these groups was dismal, with rapid progression observed. Such inferior survival might have been associated with the inability to administer CSI and general reluctance towards radiotherapy use in these very young children [28]. Notwithstanding the theoretical benefit of CSI, the short time-to-progression implies that radiotherapy deferral approaches might be impractical. Furthermore, extended irradiation fields pose an increased risk for subsequent malignancies in patients with germline RB1 mutations [43]. In vitro analyses have demonstrated the cooperative role between FOXR2 and MYC through direct interaction, complex formation and stabilization, in turn promoting MYC transcriptional activities and tumorigenesis [21, 37]. Although further studies to confirm MYC dependency in PB-MYC/FOXR2 tumor without MYC amplification are warranted, experimental approaches that might be explored include BET-bromodomain inhibition which has shown preclinical activity against MYC-driven medulloblastomas [3, 4]. For patients with PB-RB1, in silico drug screening based on a recently established Rb-deficient murine PB model suggested potential activity with nortriptyline, an anti-depressant, through lysosome disruption [8]. Further research on treatment strategies for these disease groups is urgently needed. With 60% of PB-FOXR2/MYC patients presenting with localized disease, the efficacy of upfront focal radiotherapy, especially with proton beam, followed by high-dose chemotherapy could be evaluated while awaiting novel therapeutic agents.
Molecularly-defined PPTIDs are distinct from PB subgroups. Histologically, they were associated with an even split between Grade 4 lesions (PB or PNET) and lower grade ones (including PPTID). Previously proposed “Group 3” PBs that harbored KBTBD4 insertions are aligned with PPTIDs in our meta-analysis cohort [20]. In clinical practice, targeted evaluation for disease-defining driver genes might facilitate diagnosis in cases with indeterminate histomorphology [33]. Such ambiguity also represents a caveat in the interpretation of clinical studies on pineal parenchymal tumors, especially in adolescents and adults, where both entities are encountered. In our study, patients with molecularly-defined PPTIDs had satisfactory outcome with three patients who received focal radiotherapy being survivors at 3.2–5.5 years from diagnosis. Previous studies have demonstrated the prognostic value of adjuvant radiotherapy use in histologically diagnosed PPTIDs, with little being known regarding the impact of field of treatment; while the role of adjuvant chemotherapy has not been established [24, 33]. We suggest that a prospective trial for patients with localized, molecularly-confirmed PPTIDs (by methylation profiling and/or detection of KBTBD4 insertion) to be treated with focal radiotherapy with or without standard-dose chemotherapy should be undertaken.
Our study is inherently limited by its retrospective design and non-uniformity in treatment strategy adopted. The lack of central pathologic review did not permit systematic correlation of histologic findings, such as proliferative labeling index, with molecular results, nor did it allow validation of genomic findings by orthogonal tools. Due to the rarity of pineal parenchymal tumors, however, this unprecedented clinical-molecular cohort is of value for allowing precise description of clinical and genomic features, as well as appreciation of the influence of treatment factors within harmonized disease groups. Specification of pineal tumor molecular grouping in upcoming iterations of CNS tumor classification will ensure clinical applicability. In conclusion, we corroborated the clinical and biological heterogeneity within pineal parenchymal tumors and propose consensus molecular groups. Future PB clinical studies should stratify patients molecularly to allow personalized management.
Data Availability
The data that support the findings of this study are available from the corresponding author upon reasonable request.
Supplementary Material
Supplementary Figure 1. Characterizing heterogeneity of methylation profile among pineal parenchymal tumors based on (a) uniform manifold approximation and projection (UMAP), (b-c) nonnegative matrix factorization (NMF), (d) k-means, and (e) hierarchical clustering (HC).
Supplementary Figure 2. Gene-set enrichment analysis (GSEA) showing up and downregulated Gene Ontology (GO) terms in pineal parenchymal tumor groups.
Supplementary Figure 3. Progression-free (PFS) and overall survival (OS) of patients with molecularly classified pineoblastomas (a-b) who received craniospinal irradiation (CSI) and (c-d) focal/no radiotherapy (RT). Forest plot showing univariate cox regression on potential prognostic factors with (e) PFS and (f) OS in patients who received CSI. Bx, biopsy; chr, chromosome; CI, confidence interval; F, female; GTR, gross-total resection; HD, high-dose; HR, hazard ratio; M, male; M status, metastatic status; M0, non-metastatic; M+, metastatic; NTR, near-total resection; Std, standard-dose; STR, subtotal resection; y, year(s)
Supplementary Figure 4. Progression-free (PFS) and overall survival (OS) of patients with molecularly defined pineoblastomas by (a-b) age at diagnosis, (c-d) metastatic status, (e-f) extent of resection, (g-h) radiotherapy (RT) use, and (i-j) chemotherapy (chemo) use. Bx, biopsy; CSI, craniospinal irradiation; GTR, gross-total resection; M0, non-metastatic; M+, metastatic; NTR, near-total resection; STR, subtotal resection; y, year(s)
Supplementary Figure 5. (a) Progression-free (PFS) and (b) overall survival (OS) of patients with molecularly defined pineoblastomas by extent of surgery and metastatic status. Bx, biopsy; GTR, gross-total resection; M0, non-metastatic; M+, metastatic; NTR, near-total resection; STR, subtotal resection; y, year(s)
Supplementary Figure 6. Progression-free (PFS) and overall survival (OS) stratified by methylation grouping and clinical factors, including (a-b) age at diagnosis, (c-d) metastatic status, (e-f) extent of resection, (g-h) radiation (RT) use, and (i-j) chemotherapy use. Bx, biopsy; CSI, craniospinal irradiation; GTR, gross-total resection; HD, high-dose; M0, non-metastatic; M+, metastatic; NTR, near-total resection; y, year(s)
Supplementary Figure 7. Forest plot showing univariate cox regression on potential prognostic factors for (a) progression-free survival and (b) overall survival of patients with PB-miRNA1. Bx, biopsy; CI, confidence interval; CSI, craniospinal irradiation; F, female; GTR, gross-total resection; HD, high-dose; HR, hazard ratio; M, male; M status, metastatic status; M0, non-metastatic; M+, metastatic; NTR, near-total resection; RT, radiotherapy; Std, standard-dose; STR, subtotal resection; y, year(s)
Supplementary Figure 8. Progression-free (PFS) and overall survival (OS) in patients with (a-d) PB-miRNA1 and 2, (e-f) PB-RB1, (g-h) molecularly-defined PPTIDs stratified according to genotype.
Supplementary Figure 9. Progression-free (PFS) and overall survival (OS) in (a-b) patients with managed on the COG ACNS0332 and SJMB03 trials, and (c-d) further stratified by risk-group for those with PB-miRNA1 and 2 disease only. AR, average-risk; HR, high-risk
Supplementary Table 1. Availability of clinical and molecular data for the meta-analysis cohort
Supplementary Table 2. Summary of methylation group membership assignment for our study cohort based on t-stochastic neighbor embedding (t-SNE), uniform manifold approximation and projection (UMAP), nonnegative matrix factorization (NMF), k-means, and hierarchical clustering (HC)
Supplementary Table 3. Demographics, clinical characteristics and outcome of patients with PB-miRNA1a, 1b, PPTID-a and b
Supplementary Table 4. Comparison of clinical and molecular characteristics in patients with PPTID by methylation profiling according to KBTBD4 genotype
Supplementary Table 5. Comparison of clinical and molecular characteristics in patients with enrolled on COG ACNS0332 and SJMB03.
Supplementary Table 6. Pattern of failure based on disease group and radiation regimen
Supplementary Table 7. Characteristics of patients successfully salvaged after progression
Acknowledgements
The authors would like to thank the clinical and research staff of participating sites for contributing to the care and study of all involved patients, collaborators of the Rare Brain Tumor Consortium (Rarebraintumorconsortium.ca), German Cancer Research Center, and St. Jude Children’s Research Hsopital. We are grateful to Dr. Carmine Mottolese, Department of Pediatric Neurosurgery, Hôpital Femme Mère Enfant, Hospices Civils de Lyon for his neurosurgical expertise. We would like to acknowledge the MSK Kids Pediatric Translational Medicine Program (PTMP), the Director of the PTMP, Dr. Neerav Shukla, and the Scarlett Fund for their support with the data generation and curation. Funding was provided by American Lebanese Syrian Associated Charities, National Cancer Institute Cancer Center Grant (P30 CA021765) to St. Jude Children’s Research Hospital, National Cancer Institute Cancer Center Grant (P30 CA008748) to Memorial Sloan Kettering Cancer Center, the German Childhood Cancer Foundation (DKS 2015.01; “Molecular Neuropathology 2.0 - Increasing diagnostic accuracy in paediatric neurooncology”) (D.T.W.J.), the GPOH HIT-MED trial group (S.R.), the Friedberg Charitable Foundation (M.S.), the Making Headway Foundation to NYU (M.S.), b.r.a.i.n.child (B.K.L.), Garron Family Center Research Fellowship (B.K.L.), Canada Research Chair Award (A.H.), Canadian Cancer Society Research Institute Grant (A.H.), Canadian Institute of Health Research Grant (A.H.), and SickKids Foundation Pitblado Grant (A.H.).
Role of the funding source
The funders of the study had no role in study design, data collection, data analysis, data interpretation, or writing of the report.
Footnotes
Conflict of Interest
The authors declare no conflict of interest.
Ethics Committee Approval
Clinical data and tumor material were obtained according to Institutional Review Board approval from St. Jude Children’s Research Hospital, Hospital for Sick Children, and contributing sites to German Cancer Research Center.
References
- 1.Abdelbaki MS, Abu-Arja MH, Davidson TB, Fangusaro JR, Stanek JR, Dunkel IJ, Dhall G, Gardner SL, Finlay JL (2020) Pineoblastoma in children less than six years of age: The Head Start I, II, and III experience. Pediatr Blood Cancer 67: e28252 Doi 10.1002/pbc.28252 [DOI] [PMC free article] [PubMed] [Google Scholar]
- 2.Aryee MJ, Jaffe AE, Corrada-Bravo H, Ladd-Acosta C, Feinberg AP, Hansen KD, Irizarry RA (2014) Minfi: a flexible and comprehensive Bioconductor package for the analysis of Infinium DNA methylation microarrays. Bioinformatics 30: 1363–1369 [DOI] [PMC free article] [PubMed] [Google Scholar]
- 3.Bandopadhayay P, Bergthold G, Nguyen B, Schubert S, Gholamin S, Tang Y, Bolin S, Schumacher SE, Zeid R, Masoud S et al. (2014) BET bromodomain inhibition of MYC-amplified medulloblastoma. Clin Cancer Res 20: 912–925 Doi 10.1158/1078-0432.Ccr-13-2281 [DOI] [PMC free article] [PubMed] [Google Scholar]
- 4.Bolin S, Borgenvik A, Persson CU, Sundström A, Qi J, Bradner JE, Weiss WA, Cho Y-J, Weishaupt H, Swartling FJ (2018) Combined BET bromodomain and CDK2 inhibition in MYC-driven medulloblastoma. Oncogene 37: 2850–2862 Doi 10.1038/s41388-018-0135-1 [DOI] [PMC free article] [PubMed] [Google Scholar]
- 5.Bowles E, Corson TW, Bayani J, Squire JA, Wong N, Lai PB-S, Gallie BL (2007) Profiling genomic copy number changes in retinoblastoma beyond loss of RB1. Genes Chromosom Cancer 46: 118–129 Doi 10.1002/gcc.20383 [DOI] [PubMed] [Google Scholar]
- 6.Canning P, Cooper CD, Krojer T, Murray JW, Pike AC, Chaikuad A, Keates T, Thangaratnarajah C, Hojzan V, Marsden BD (2013) Structural basis for Cul3 protein assembly with the BTB-Kelch family of E3 ubiquitin ligases. J Biol Chem 288: 7803–7814 [DOI] [PMC free article] [PubMed] [Google Scholar]
- 7.Capper D, Jones DT, Sill M, Hovestadt V, Schrimpf D, Sturm D, Koelsche C, Sahm F, Chavez L, Reuss DE (2018) DNA methylation-based classification of central nervous system tumours. Nature 555: 469. [DOI] [PMC free article] [PubMed] [Google Scholar]
- 8.Chung PED, Gendoo DMA, Ghanbari-Azarnier R, Liu JC, Jiang Z, Tsui J, Wang D-Y, Xiao X, Li B, Dubuc A et al. (2020) Modeling germline mutations in pineoblastoma uncovers lysosome disruption-based therapy. Nature Commun 11: 1825–1825 Doi 10.1038/s41467-020-15585-2 [DOI] [PMC free article] [PubMed] [Google Scholar]
- 9.de Kock L, Priest JR, Foulkes WD, Alexandrescu S (2019) An update on the central nervous system manifestations of DICER1 syndrome. Acta Neuropathol: Doi 10.1007/s00401-019-01997-y [DOI] [PubMed] [Google Scholar]
- 10.de Kock L, Rivera B, Foulkes WD (2020) Pineoblastoma is uniquely tolerant of mutually exclusive loss of DICER1, DROSHA or DGCR8. Acta Neuropathol 139: 1115–1118 Doi 10.1007/s00401-020-02139-5 [DOI] [PubMed] [Google Scholar]
- 11.Foulkes WD, Priest JR, Duchaine TF (2014) DICER1: mutations, microRNAs and mechanisms. Nat Rev Cancer 14: 662–672 Doi 10.1038/nrc3802 [DOI] [PubMed] [Google Scholar]
- 12.Gaujoux R, Seoighe C (2010) A flexible R package for nonnegative matrix factorization. BMC bioinform 11: 367. [DOI] [PMC free article] [PubMed] [Google Scholar]
- 13.Gururangan S, McLaughlin C, Quinn J, Rich J, Reardon D, Halperin EC, Herndon J, Fuchs H, George T, Provenzale J (2003) High-dose chemotherapy with autologous stem-cell rescue in children and adults with newly diagnosed pineoblastomas. J Clin Oncol 21: 2187–2191 [DOI] [PubMed] [Google Scholar]
- 14.Ho B, Johann PD, Grabovska Y, De Dieu Andrianteranagna MJ, Yao F, Frühwald M, Hasselblatt M, Bourdeaut F, Williamson D, Huang A (2020) Molecular subgrouping of atypical teratoid/rhabdoid tumors—a reinvestigation and current consensus. Neuro Oncol 22: 613–624 [DOI] [PMC free article] [PubMed] [Google Scholar]
- 15.Hovestadt V, Zapatka M (2017) Conumee: enhanced copy-number variation analysis using Illumina DNA methylation arrays. R package version 1: [DOI] [PMC free article] [PubMed] [Google Scholar]
- 16.Hwang EI, Kool M, Burger PC, Capper D, Chavez L, Brabetz S, Williams-Hughes C, Billups C, Heier L, Jaju A et al. (2018) Extensive Molecular and Clinical Heterogeneity in Patients With Histologically Diagnosed CNS-PNET Treated as a Single Entity: A Report From the Children’s Oncology Group Randomized ACNS0332 Trial. J Clin Oncol 36: 3388–3395 Doi 10.1200/jco.2017.76.4720 [DOI] [PMC free article] [PubMed] [Google Scholar]
- 17.Jouvet A, Saint-Pierre G, Fauchon F, Privat K, Bouffet E, Ruchoux MM, Chauveinc L, Fèvre-Montange M (2000) Pineal parenchymal tumors: a correlation of histological features with prognosis in 66 cases. Brain Pathol 10: 49–60 Doi 10.1111/j.1750-3639.2000.tb00242.x [DOI] [PMC free article] [PubMed] [Google Scholar]
- 18.Lambo S, Gröbner SN, Rausch T, Waszak SM, Schmidt C, Gorthi A, Romero JC, Mauermann M, Brabetz S, Krausert S et al. (2019) The molecular landscape of ETMR at diagnosis and relapse. Nature 576: 274–280 Doi 10.1038/s41586-019-1815-x [DOI] [PMC free article] [PubMed] [Google Scholar]
- 19.Lee JC, Mazor T, Lao R, Wan E, Diallo AB, Hill NS, Thangaraj N, Wendelsdorf K, Samuel D, Kline CN et al. (2019) Recurrent KBTBD4 small in-frame insertions and absence of DROSHA deletion or DICER1 mutation differentiate pineal parenchymal tumor of intermediate differentiation (PPTID) from pineoblastoma. Acta Neuropathol 137: 851–854 Doi 10.1007/s00401-019-01990-5 [DOI] [PMC free article] [PubMed] [Google Scholar]
- 20.Li BK, Vasiljevic A, Dufour C, Yao F, Ho BLB, Lu M, Hwang EI, Gururangan S, Hansford JR, Fouladi M et al. (2020) Pineoblastoma segregates into molecular sub-groups with distinct clinico-pathologic features: a Rare Brain Tumor Consortium registry study. Acta Neuropathol 139: 223–241 Doi 10.1007/s00401-019-02111-y [DOI] [PMC free article] [PubMed] [Google Scholar]
- 21.Li X, Wang W, Xi Y, Gao M, Tran M, Aziz KE, Qin J, Li W, Chen J (2016) FOXR2 Interacts with MYC to Promote Its Transcriptional Activities and Tumorigenesis. Cell Reports 16: 487–497 Doi 10.1016/j.celrep.2016.06.004 [DOI] [PMC free article] [PubMed] [Google Scholar]
- 22.Liu APY, Gudenas B, Lin T, Orr BA, Klimo P Jr., Kumar R, Bouffet E, Gururangan S, Crawford JR, Kellie SJ et al. (2020) Risk-adapted therapy and biological heterogeneity in pineoblastoma: integrated clinico-pathological analysis from the prospective, multi-center SJMB03 and SJYC07 trials. Acta Neuropathol 139: 259–271 Doi 10.1007/s00401-019-02106-9 [DOI] [PMC free article] [PubMed] [Google Scholar]
- 23.Maaten Lvd, Hinton G (2008) Visualizing data using t-SNE. J Mach Learn Res 9: 2579–2605 [Google Scholar]
- 24.Mallick S, Benson R, Rath GK (2016) Patterns of care and survival outcomes in patients with pineal parenchymal tumor of intermediate differentiation: An individual patient data analysis. Radiother Oncol 121: 204–208 Doi 10.1016/j.radonc.2016.10.025 [DOI] [PubMed] [Google Scholar]
- 25.McInnes L, Healy J, Melville J (2018) Umap: Uniform manifold approximation and projection for dimension reduction. arXiv preprint arXiv:180203426: [Google Scholar]
- 26.Mermel CH, Schumacher SE, Hill B, Meyerson ML, Beroukhim R, Getz G (2011) GISTIC2. 0 facilitates sensitive and confident localization of the targets of focal somatic copy-number alteration in human cancers. Genome Biol 12: R41. [DOI] [PMC free article] [PubMed] [Google Scholar]
- 27.Mulhern RK, Palmer SL, Merchant TE, Wallace D, Kocak M, Brouwers P, Krull K, Chintagumpala M, Stargatt R, Ashley DM (2005) Neurocognitive consequences of risk-adapted therapy for childhood medulloblastoma. J Clin Oncol 23: 5511–5519 [DOI] [PubMed] [Google Scholar]
- 28.Mynarek M, Pizer B, Dufour C, van Vuurden D, Garami M, Massimino M, Fangusaro J, Davidson T, Gil-da-Costa MJ, Sterba J et al. (2017) Evaluation of age-dependent treatment strategies for children and young adults with pineoblastoma: analysis of pooled European Society for Paediatric Oncology (SIOP-E) and US Head Start data. Neuro Oncol 19: 576–585 Doi 10.1093/neuonc/now234 [DOI] [PMC free article] [PubMed] [Google Scholar]
- 29.Ostrom QT, Cioffi G, Gittleman H, Patil N, Waite K, Kruchko C, Barnholtz-Sloan JS (2019) CBTRUS Statistical Report: Primary Brain and Other Central Nervous System Tumors Diagnosed in the United States in 2012–2016. Neuro Oncol 21: v1–v100 Doi 10.1093/neuonc/noz150 [DOI] [PMC free article] [PubMed] [Google Scholar]
- 30.Parikh KA, Venable GT, Orr BA, Choudhri AF, Boop FA, Gajjar AJ, Klimo P Jr (2017) Pineoblastoma—The Experience at St. Jude Children’s Research Hospital. Neurosurgery 81: 120–128 Doi 10.1093/neuros/nyx005 [DOI] [PubMed] [Google Scholar]
- 31.Pfaff E, Aichmüller C, Sill M, Stichel D, Snuderl M, Karajannis MA, Schuhmann MU, Schittenhelm J, Hasselblatt M, Thomas C et al. (2020) Molecular subgrouping of primary pineal parenchymal tumors reveals distinct subtypes correlated with clinical parameters and genetic alterations. Acta Neuropathol 139: 243–257 Doi 10.1007/s00401-019-02101-0 [DOI] [PMC free article] [PubMed] [Google Scholar]
- 32.Pizer BL, Weston CL, Robinson KJ, Ellison DW, Ironside J, Saran F, Lashford LS, Tait D, Lucraft H, Walker DA et al. (2006) Analysis of patients with supratentorial primitive neuroectodermal tumours entered into the SIOP/UKCCSG PNET 3 study. Eur J Cancer 42: 1120–1128 Doi 10.1016/j.ejca.2006.01.039 [DOI] [PubMed] [Google Scholar]
- 33.Raleigh DR, Solomon DA, Lloyd SA, Lazar A, Garcia MA, Sneed PK, Clarke JL, McDermott MW, Berger MS, Tihan T (2017) Histopathologic review of pineal parenchymal tumors identifies novel morphologic subtypes and prognostic factors for outcome. Neuro Oncol 19: 78–88 [DOI] [PMC free article] [PubMed] [Google Scholar]
- 34.Reddy AT, Janss AJ, Phillips PC, Weiss HL, Packer RJ (2000) Outcome for children with supratentorial primitive neuroectodermal tumors treated with surgery, radiation, and chemotherapy. Cancer 88: 2189–2193 [DOI] [PubMed] [Google Scholar]
- 35.Sabbaghian N, Hamel N, Srivastava A, Albrecht S, Priest JR, Foulkes WD (2012) Germline DICER1 mutation and associated loss of heterozygosity in a pineoblastoma. J Med Genet 49: 417–419 [DOI] [PubMed] [Google Scholar]
- 36.Sahm F, Schrimpf D, Jones DTW, Meyer J, Kratz A, Reuss D, Capper D, Koelsche C, Korshunov A, Wiestler B et al. (2016) Next-generation sequencing in routine brain tumor diagnostics enables an integrated diagnosis and identifies actionable targets. Acta Neuropathol 131: 903–910 [DOI] [PubMed] [Google Scholar]
- 37.Schmitt-Hoffner F, van Rijn S, Hübner J-M, Lambo S, Mauermann M, Mack N, Schwalm B, Pfister S, Kool M (2020) ETMR-03. The role of FOXR2 in pediatric brain cancer. Neuro Oncol 22: iii323 [Google Scholar]
- 38.Snuderl M, Kannan K, Pfaff E, Wang S, Stafford JM, Serrano J, Heguy A, Ray K, Faustin A, Aminova O et al. (2018) Recurrent homozygous deletion of DROSHA and microduplication of PDE4DIP in pineoblastoma. Nat Commun 9: 2868 Doi 10.1038/s41467-018-05029-3 [DOI] [PMC free article] [PubMed] [Google Scholar]
- 39.Tate M, Sughrue ME, Rutkowski MJ, Kane AJ, Aranda D, McClinton L, McClinton L, Barani IJ, Parsa AT (2012) The long-term postsurgical prognosis of patients with pineoblastoma. Cancer 118: 173–179 Doi 10.1002/cncr.26300 [DOI] [PubMed] [Google Scholar]
- 40.Timmermann B, Kortmann R-D, Kühl J, Meisner C, Dieckmann K, Pietsch T, Bamberg M (2002) Role of Radiotherapy in the Treatment of Supratentorial Primitive Neuroectodermal Tumors in Childhood: Results of the Prospective German Brain Tumor Trials HIT 88/89 and 91. J Clin Oncol 20: 842–849 Doi 10.1200/jco.2002.20.3.842 [DOI] [PubMed] [Google Scholar]
- 41.Vasiljevic A, Fèvre-Montange M, Jouvet A (2018) 11 - Pineal Parenchymal Tumors. In: Perry A, Brat DJ (eds) Practical Surgical Neuropathology: A Diagnostic Approach (Second Edition). Elsevier, City, pp 219–232 [Google Scholar]
- 42.Wilkerson MD, Hayes DN (2010) ConsensusClusterPlus: a class discovery tool with confidence assessments and item tracking. Bioinformatics 26: 1572–1573 [DOI] [PMC free article] [PubMed] [Google Scholar]
- 43.Wong FL, Boice JD, Abramson DH, Tarone RE, Kleinerman RA, Stovall M, Goldman MB, Seddon JM, Tarbell N, Fraumeni JF (1997) Cancer incidence after retinoblastoma: radiation dose and sarcoma risk. JAMA 278: 1262–1267 [DOI] [PubMed] [Google Scholar]
- 44.Zeltzer PM, Boyett JM, Finlay JL, Albright AL, Rorke LB, Milstein JM, Allen JC, Stevens KR, Stanley P, Li H et al. (1999) Metastasis stage, adjuvant treatment, and residual tumor are prognostic factors for medulloblastoma in children: conclusions from the Children’s Cancer Group 921 randomized phase III study. J Clin Oncol 17: 832–845 Doi 10.1200/jco.1999.17.3.832 [DOI] [PubMed] [Google Scholar]
Associated Data
This section collects any data citations, data availability statements, or supplementary materials included in this article.
Supplementary Materials
Supplementary Figure 1. Characterizing heterogeneity of methylation profile among pineal parenchymal tumors based on (a) uniform manifold approximation and projection (UMAP), (b-c) nonnegative matrix factorization (NMF), (d) k-means, and (e) hierarchical clustering (HC).
Supplementary Figure 2. Gene-set enrichment analysis (GSEA) showing up and downregulated Gene Ontology (GO) terms in pineal parenchymal tumor groups.
Supplementary Figure 3. Progression-free (PFS) and overall survival (OS) of patients with molecularly classified pineoblastomas (a-b) who received craniospinal irradiation (CSI) and (c-d) focal/no radiotherapy (RT). Forest plot showing univariate cox regression on potential prognostic factors with (e) PFS and (f) OS in patients who received CSI. Bx, biopsy; chr, chromosome; CI, confidence interval; F, female; GTR, gross-total resection; HD, high-dose; HR, hazard ratio; M, male; M status, metastatic status; M0, non-metastatic; M+, metastatic; NTR, near-total resection; Std, standard-dose; STR, subtotal resection; y, year(s)
Supplementary Figure 4. Progression-free (PFS) and overall survival (OS) of patients with molecularly defined pineoblastomas by (a-b) age at diagnosis, (c-d) metastatic status, (e-f) extent of resection, (g-h) radiotherapy (RT) use, and (i-j) chemotherapy (chemo) use. Bx, biopsy; CSI, craniospinal irradiation; GTR, gross-total resection; M0, non-metastatic; M+, metastatic; NTR, near-total resection; STR, subtotal resection; y, year(s)
Supplementary Figure 5. (a) Progression-free (PFS) and (b) overall survival (OS) of patients with molecularly defined pineoblastomas by extent of surgery and metastatic status. Bx, biopsy; GTR, gross-total resection; M0, non-metastatic; M+, metastatic; NTR, near-total resection; STR, subtotal resection; y, year(s)
Supplementary Figure 6. Progression-free (PFS) and overall survival (OS) stratified by methylation grouping and clinical factors, including (a-b) age at diagnosis, (c-d) metastatic status, (e-f) extent of resection, (g-h) radiation (RT) use, and (i-j) chemotherapy use. Bx, biopsy; CSI, craniospinal irradiation; GTR, gross-total resection; HD, high-dose; M0, non-metastatic; M+, metastatic; NTR, near-total resection; y, year(s)
Supplementary Figure 7. Forest plot showing univariate cox regression on potential prognostic factors for (a) progression-free survival and (b) overall survival of patients with PB-miRNA1. Bx, biopsy; CI, confidence interval; CSI, craniospinal irradiation; F, female; GTR, gross-total resection; HD, high-dose; HR, hazard ratio; M, male; M status, metastatic status; M0, non-metastatic; M+, metastatic; NTR, near-total resection; RT, radiotherapy; Std, standard-dose; STR, subtotal resection; y, year(s)
Supplementary Figure 8. Progression-free (PFS) and overall survival (OS) in patients with (a-d) PB-miRNA1 and 2, (e-f) PB-RB1, (g-h) molecularly-defined PPTIDs stratified according to genotype.
Supplementary Figure 9. Progression-free (PFS) and overall survival (OS) in (a-b) patients with managed on the COG ACNS0332 and SJMB03 trials, and (c-d) further stratified by risk-group for those with PB-miRNA1 and 2 disease only. AR, average-risk; HR, high-risk
Supplementary Table 1. Availability of clinical and molecular data for the meta-analysis cohort
Supplementary Table 2. Summary of methylation group membership assignment for our study cohort based on t-stochastic neighbor embedding (t-SNE), uniform manifold approximation and projection (UMAP), nonnegative matrix factorization (NMF), k-means, and hierarchical clustering (HC)
Supplementary Table 3. Demographics, clinical characteristics and outcome of patients with PB-miRNA1a, 1b, PPTID-a and b
Supplementary Table 4. Comparison of clinical and molecular characteristics in patients with PPTID by methylation profiling according to KBTBD4 genotype
Supplementary Table 5. Comparison of clinical and molecular characteristics in patients with enrolled on COG ACNS0332 and SJMB03.
Supplementary Table 6. Pattern of failure based on disease group and radiation regimen
Supplementary Table 7. Characteristics of patients successfully salvaged after progression
Data Availability Statement
The data that support the findings of this study are available from the corresponding author upon reasonable request.