

Abstract
N, N’ N”-triethylenethiophosphoramide (thiotepa) and cyclophosphamide (CP) are alkylating agents used for a variety of malignant and non-malignant disorders. Both drugs are metabolized by cytochrome P450 enzymes to form active metabolites. To support pharmacokinetic studies of thiotepa and CP in children, we sought to develop assays to determine parent drug and metabolite concentration in small volume plasma samples. Liquid chromatography-tandem mass spectrometry (LC-MS/MS) was used for assay development. CP metabolite 4-hydroxycyclophosphamide (4OHCP) was converted to the more stable semicarbazone derivative (4OHCP-SCZ) for quantitation. Samples (10 μL) were extracted by solid-phase extraction and injected onto the LC-MS/MS system equipped with a pentafluorophenyl reverse phase column (2.1 × 50 mm, 2.7 μm). Electrospray ionization in positive mode was used for detection. Multiple reaction monitoring of the precursor-to-product ion transitions m/z 190→147 for thiotepa, 174→131 for tepa, 261→233 for CP, and 334→221 for 4OHCP-SCZ was selected for quantification. The ion transitions m/z 202→155 for thiotepa-d12, 186→139 for tepa-d12, 267→237 for CP-d4, and 340→114 for 4OHCP-d4-SCZ were selected for the internal standard (IS) corresponding to each analyte. The less abundant IS ions from 37Cl were used for CP-d4 and 4OHCP-d4-SCZ to overcome the cross-talk interference from the analytes. Under optimized conditions, retention times were 0.67 min for tepa and its IS, 2.50 min for thiotepa and its IS, 2.52 min for 4OHCP-SCZ and its IS, and 2.86 min for CP and its IS. Total run time was 5 min per sample. The calibration ranges were 2.5–2,000ng/mL for thiotepa and tepa, 20–10,000ng/mL for CP and 20–5,000 ng/mL for 4OHCP; Dilution integrity for samples above the calibration range was validated with 10-fold dilution for thiotepa/tepa and 20-fold dilution for CP/4OHCP. Recoveries ranged from 86.3–93.4% for thiotepa, 86.3–89.0% for tepa, 90.2–107% for CP, and 99.3–115% for 4OHCP-SCZ. The IS normalized matrix effect was within (100±7) % for all 4 analytes. Plasma samples at room temperature were stable for at least 60 hours for thiotepa, 6 days for tepa, and 24 hours for CP and 4OHCP-SCZ. Plasma samples for thiotepa/tepa were stable after 4 freeze-thaw cycles, and for CP/4OHCP-SCZ were stable after 3 freeze-thaw cycles. The assays were validated and applied to clinical studies requiring small sample volumes.
Keywords: Thiotepa, tepa, cyclophosphamide, 4-hydroxycyclophosphamide, plasma, pediatric
1. Introduction
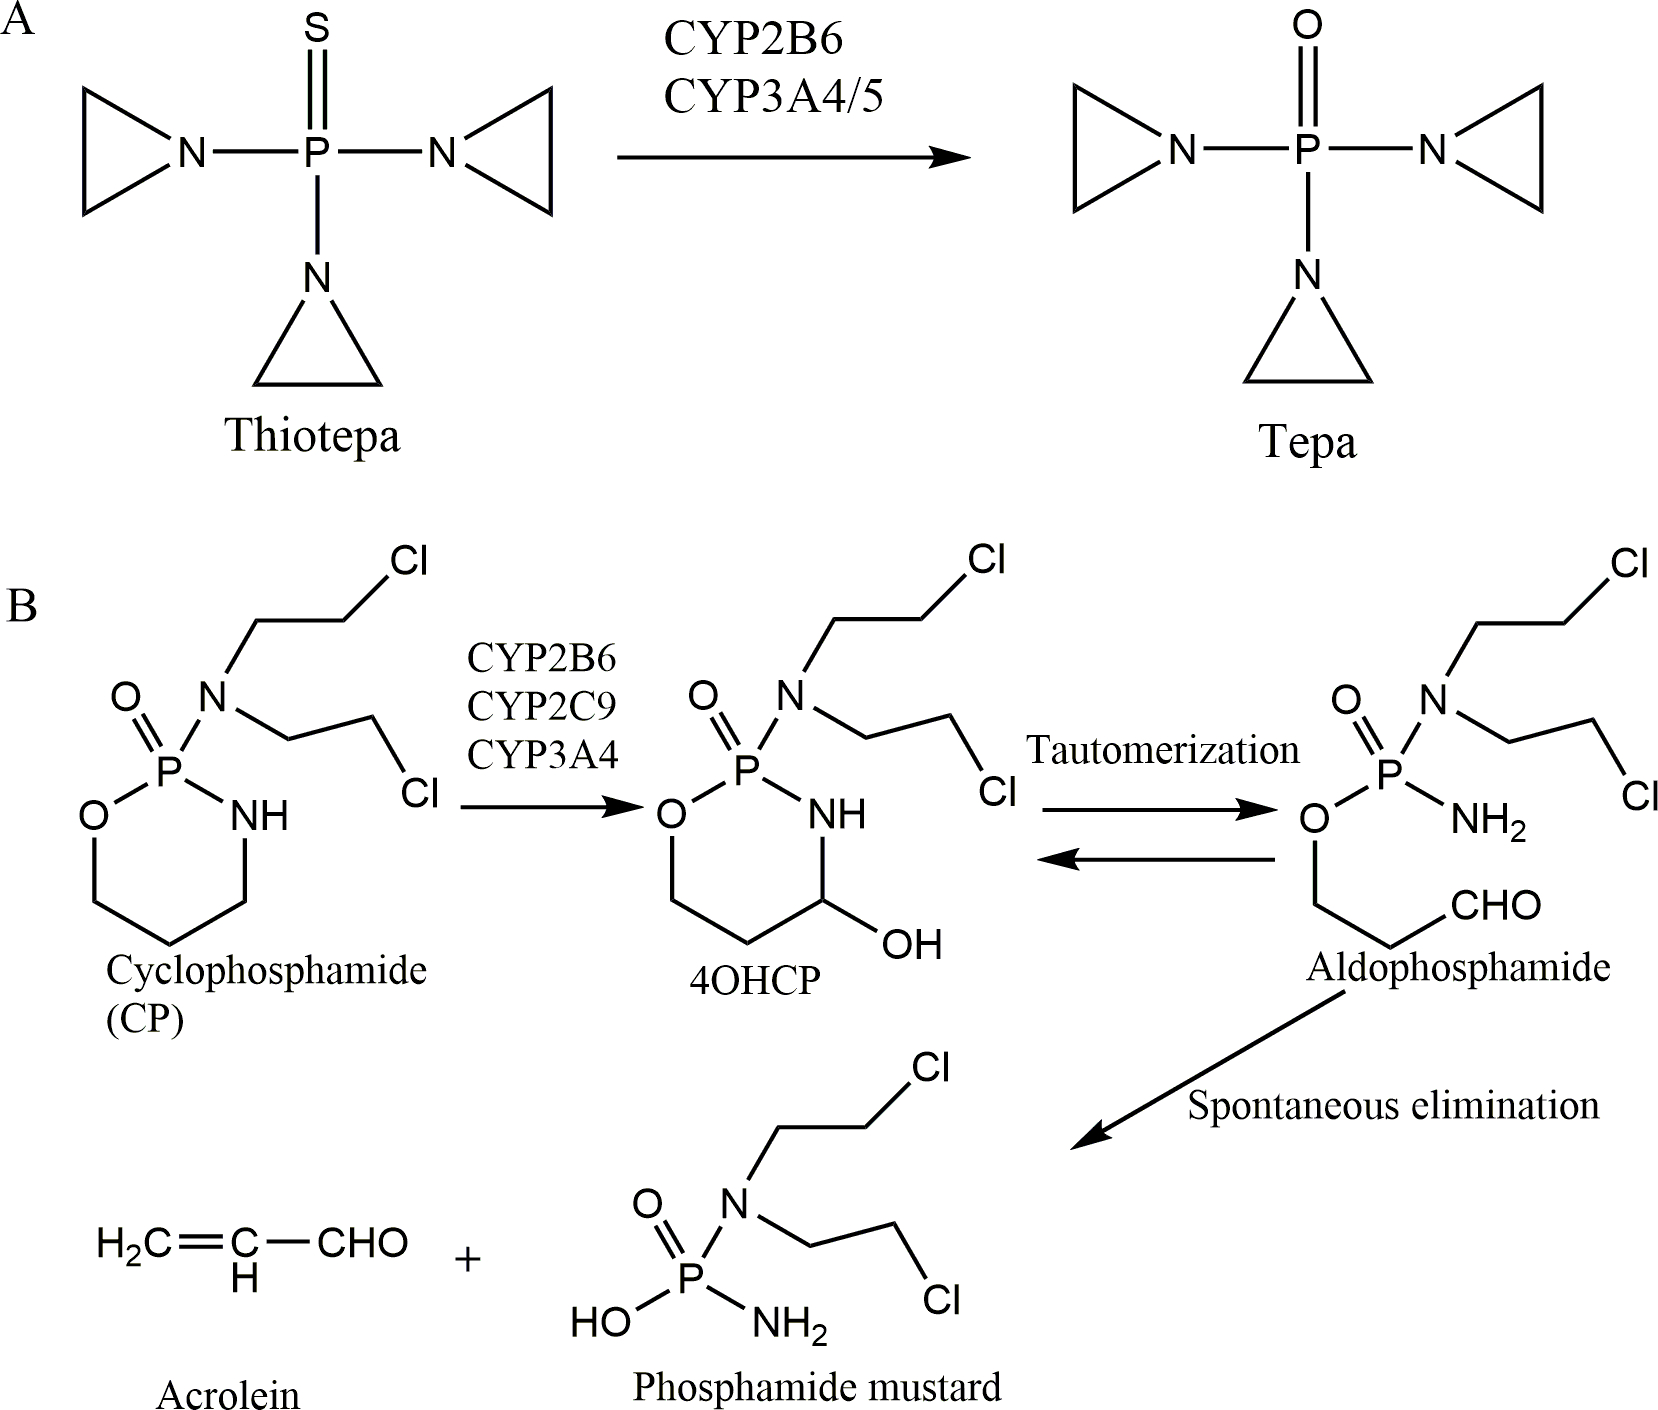
N, N’ N”-triethylenethiophosphoramide (thiotepa) and cyclophosphamide (CP) are alkylating agents with many clinical indications that include both malignant and non-malignant diseases[1–3]. Thiotepa is metabolized by cytochrome P450 enzymes to the metabolite N, N’ N”-triethylenephosphoramide (tepa) [4], which is also an alkylating agent. (Figure 1A). In contrast, CP is a prodrug that is mainly metabolized by hepatic P450 enzymes CYP2B6, 2C9, and 3A4 to its primary metabolite 4-hydroxycyclophosphamide (4OHCP), which is interconverted with its tautomer aldophosphamide and spontaneously degraded into phosphoramide mustard, the active alkylating agent (Figure 1B) [1]. The circulating phosphoramide mustard is ionized at physiological pH and cannot easily enter cells but 4OHCP can readily diffuse into cells. Thus plasma 4OHCP concentration is more relevant to therapeutic effect [1, 5]. 4OHCP is very unstable due to combination of chemical and enzymatic degradation [6].
Figure 1. Metabolism pathways of thiotepa (A) and cyclophosphamide (B).
The goal of this research was to develop assays to quantify thiotepa, tepa, CP and 4OHCP in micro-volume plasma samples to support clinical pharmacology studies of thiotepa and CP in neonates and pediatric patients in both inpatient and outpatient settings. Numerous assays have been reported for quantification of CP and 4OHCP with sample volumes unsuited for pediatric studies [6–15], and very few assays have been reported for quantification of thiotepa and tepa [15, 16]. Here we report two assays using the same sample preparation and liquid chromatography-tandem mass spectrometry (LC-MS/MS) platform for quantification of (1) thiotepa and tepa, and (2) CP and 4OHCP stabilized by SCZ. Both assays use only 10 μL plasma.
2. Materials and Methods
2.1. Materials
Thiotepa (MW 189.22, purity 99%), tepa (MW 173.15, purity, 96%), 4-hydroxycyclophosphamide preparation kit (4-hydroperoxycyclophosphamide and sodium thiosulfate), and internal standards thiotepa-d12, tepa-d12, cyclophosphamide-d4, and 4-hydroxycyclophosphamide-d4 preparation kit were purchased from Toronto Research Chemicals (Toronto, Ontario, Canada). Cyclophosphamide monohydrate was purchased from A.K. Scientific Inc. (Union City, CA, USA). Ammonium formate (NH4FA, certified ACS reagent), formic acid (FA, Optima™ LC/MS grade), acetonitrile (MeCN, Optima™ LC/MS grade), methanol (MeOH, HPLC grade), and water (Optima™ LC/MS grade) were purchased from Fisher Scientific Co. (Fair Lawn, NJ, USA). Blank human plasma (K2EDTA added as anticoagulant) was obtained from Biological Specialty Co (Colmar, PA, USA).
2.2. Instrumentation
Sciex API5000 tandem mass spectrometer was coupled with a Shimadzu Prominence 20ADXR UFLC pumps and SIL-20ACXR autosampler, managed with the software Analyst® 1.6.2. The autosampler was set to 15 °C. The liquid chromatography (LC) column was Poroshell 120 pentafluorophenyl (PFP) reverse phase column (50×2.1 mm, 2.7μm, Agilent Tech, Santa Clara, CA, USA) fitted with a guard column (5×2.1 mm, 2.7μm, Agilent Tech, Santa Clara, CA, USA), eluted with 10 mM NH4FA at pH4.0 (A) and MeCN with 0.1% FA (B) at a flow rate of 0.6 mL/min in a gradient mode: 4% B (0 −1min), from 4 to 47% B (1–3 min), from 47 to 90%B (3.00–3.01min), 90% B (3.01–3.50 min), from 90 to 4%B (3.50–3.51 min), and 4%B (3.51–4.51 min). Electrospray ionization in positive mode (ESI+) was used as the ion source in multiple reaction monitoring (MRM) mode. The mass spectrometry (MS) parameters were optimized by infusion of the analyte solutions (100 ng/mL) at 30 μL/min constantly while adjusting the parameters to achieve the maximal signal. The precursor→product ion transitions m/z 190→147 and m/z 202→155 for thiotepa and thiotepa-d12, m/z 174→131 and m/z 186→139 for tepa and tepa-d12, m/z 261→233 and m/z 267→237 for CP and CP-d4, m/z 334→221 and m/z 340→114 for 4-OHCP-SCZ and 4-OHCP-d4-SCZ were selected for quantitation. The optimized MS parameters are shown in Table 1.
Table 1.
Optimized MS Parameters.
| Source parameters | TEM, °C | I.S., v | CAD, psi | CUR, psi | Gas1, psi | Gas2, psi |
| Thiotepa/tepa | 600 | 5500 | 7 | 30 | 60 | 50 |
| CP/4OHCP | 500 | 2000 | 11 | 30 | 40 | 70 |
|
| ||||||
| Compound parameters | DP, v | EP, v | CE, v | CXP, v | Dwell time, ms | |
| 190/147 (thiotepa) | 50 | 10 | 17 | 13 | 50 | |
| 202/155 (thiotepa-d12) | 50 | 10 | 17 | 13 | 50 | |
| 174/131 (Tepa) | 50 | 10 | 19 | 13 | 50 | |
| 186/139 (Tepa-d12) | 50 | 10 | 19 | 13 | 50 | |
| 261/233 (CP) | 136 | 10 | 23 | 14 | 20 | |
| 267/237 (CP-d4) | 136 | 10 | 23 | 14 | 20 | |
| 334/221 (4OHCP-SCZ | 81 | 10 | 17 | 16 | 20 | |
| 340/114 (4OHCP-d4-SCZ) | 81 | 10 | 21 | 16 | 20 | |
TEM, source temperature; I.S., ionspray voltage; CUR, curtain gas, Gas1, nebulizer gas; gas2, auxiliary gas; CAD, collision-activated dissociation; DP, declustering potential; EP, entrance potential; CE, collision energy; CXP, collision cell exit potential.
2.3. Preparation of stock, calibration standards, and quality control samples
All stock and working solutions were prepared in water.
For thiotepa/tepa, 8-point combined calibrators (2.5/2.5, 5/5, 10/10, 50/50, 100/100, 500/500, 1000/1000 and 2000/2000 ng/mL thiotepa/tepa) were prepared in blank plasma from 10-fold concentrated working solutions and the combined quality control (QC) samples (3/3, 80/80, and 1600/1600 ng/mL thiotepa/tepa) were prepared in blank plasma from 50-fold concentrated working solutions diluted from a different stock solution. For CP/4OHCP, the combined calibrators (20/20, 50/50, 100/100, 500/500, 1000/1000, 2000/2000, 5000/5000 and 10000/0 ng/mL CP/4OHCP, 8 points for CP and 7 points for 4OHCP) were prepared in blank plasma from 20-fold working solutions and QC samples (60/60, 800/800, and 8000/4000 ng/mL CP/4OHCP) were prepared in blank plasma from 20-fold working solutions diluted from a different stock solution.
2.4. Sample preparation
Hydrophilic lipophilic balance (HLB) solid-phase extraction (SPE) micro-elution 96-well plates were used for both assays. The plate was preconditioned with 100μL MeOH and 100μL water sequentially. For thiotepa/tepa quantification, the internal standard solution (20 ng/mL thiotepa-d12 and tepa-d12 in water) was added to each well of an HLB SPE μ-elution plate using a repeat pipettor followed by the addition of 10 μL of plasma samples. After briefly mixing, the sample wells were drained with a mild vacuum, 50 μL water was added to each well and the wells were drained again. A collection plate was placed under the SPE plate, 15 μL MeCN was added to elute the samples under mild vacuum, and this was repeated with another 15 μL MeCN. Subsequently, 70 μL of water was added to the wells and drained under vacuum. The collection plate was covered with a pre-slit cap mat and placed it in the autosampler. Injection volume was 2 μL. For CP/4OHCP quantification, the plasma samples (10 μL) along with the internal standard solution (200 ng/mL CP-d4 and 4OHCP-d4-SCZ in water) underwent similar SPE as described above, except that the plate was washed with 100 μL water and eluted with 25 μL MeCN twice and the collection plate was added 150 μL water. The injection volume was 1 μL.
2.5. Validation
The assays were validated based on the guidelines of NIH-sponsored Clinical Pharmacology Quality Assurance Program and the FDA guidelines [17]. For calibration curves, linear regression was used whenever possible, however, more complex regression models were considered if simple regression was not adequate to establish the correlation of signal-concentration at the intended calibration range with acceptable errors (within ±15%) and correlation coefficient (>0.99). The lower limit of quantification (LLOQ) should have a signal/noise ratio ≥5 and intra-/inter-day precision <20% and accuracy within ±20%. Five or more replicates of validation (or QC) samples at LLOQ, low (≤3-fold of LLOQ), medium, and high (≥80% upper limit of quantification, ULOQ) concentrations were processed and analyzed along with a set of freshly spiked calibrators to determine the intra-day precision and accuracy. The process was repeated during 2 additional days to determine the inter-day precision and accuracy. Selectivity, matrix effect and recovery were evaluated with ≥6 different lots of human plasma with EDTA as the anticoagulant, based on 2012 CPQA guidelines for thiotepa and tepa[18] and the new 2017 guidelines for CP and 4OHCP[19]. Three sets of samples were prepared to evaluate matrix effect, recovery, and process efficiency. Set 1 samples were prepared by spiking 10 μL analytes in water at low, medium, and high concentrations and 10 μL internal standards in 80 μL 30% MeCN for thiotepa/tepa analysis or 180 μL 20% MeCN for CP/4OHCP analysis. Set 2 samples were spiked at the same concentration as Set 1 in extracted solutions from different lots of blank plasma, and Set 3 samples were prepared by spiking analytes in 6 lots of blank plasma at low, medium, and high concentrations and then processing the plasma samples as described above. Dilution integrity was evaluated by diluting the extra-high QC sample by up to 10- and 20-fold with blank plasma. Stability in plasma was evaluated at room temperature and/or 4°C overnight and after 3–4 freeze-thaw cycles by comparing the treated samples with untreated samples in plastic microcentrifuge tubes. Long term stability in plasma at −70 °C was tested for >1 month. To evaluate autosampler stability, the processed low and high QC samples were tested on the same day of processing as control and after 3 days in autosampler. Stock solution stability was evaluated at room temperature and −70 °C. All measurements were performed in at least triplicate.
2.6. Application to clinical sample analysis
This assay was applied to patient samples obtained from several clinical pharmacokinetic (PK) studies in neonates and pediatric patients undergoing hematopoietic stem cell transplantation (ClinicalTrials.gov number, NCT03609840). The studies were approved by the Institutional Review Board of the University of California, San Francisco, and written informed consent was obtained from parents or guardians of participating patients. Two to four blood samples per subject were collected within 24 hours of drug administration. Samples were placed on wet ice immediately after collection, then centrifuged at 3000–4000 g for 10 min at 4 °C to generate plasma samples. For CP/4OHCP analysis, an aliquot of 90 μL of each plasma sample was immediately mixed with 10 μL 2M SCZ to stabilize 4OHCP, and the remaining plasma was frozen for CP analysis. Specimens were centrifuged, aliquoted, and frozen at −70 °C within 20 minutes of the blood draw. The assays were used to analyze 90 plasma samples for thiotepa and tepa concentrations and 62 samples for CP and 4OHCP concentrations.
3. Results and discussion
3.1. Assay development
The natural isotope signal of CP at M+4 is 11% relative to the most abundant mass (M). In order to avoid interference from the parent drugs, the ions from 37Cl isotope in the deuterated internal standards were selected. The optimized MS parameters are shown in Table 1.
Previously published methods utilized a conventional C18 column[7, 15]. We chose the Poroshell 120 PFP column (50×2.1 mm, 2.7μm), which yields similar efficiency to sub-2 μm column but with ~50% lower backpressure to be compatible with the LC systems (maximal operation pressure is 9000 psi). With this core-shell column, a high flow rate (0.6 mL/min) and a shorter run time 4.5 min per sample) were achieved.
Since 4OHCP is unstable, 4OHCP is usually derivatized prior to analysis. Several compounds have been used to stabilize 4OH-CP, including phenylhydrazine[8, 9, 12], o-methylhydroxyamine[6, 14], and semicarbazide (SCZ) [13, 15]. Previous studies reported phenylhydrazine and o-methylhydroxyamine could be added to blood samples following collection, but it is unknown if these agents change drug distribution between plasma and blood cells, and the phenylhydrazone derivative is unstable in protic solvents[8, 12]. Here we chose SCZ as the stabilizing agent. Due to its instability, 4OHCP was generated in lab from its precursor 4OOHCP and converted to semicarbazide (SCZ) derivative immediately for stabilization. The reaction with SCZ was completed in 10 min at both 4 °C (on ice) and room temperature, while the yield at 40 °C 2hr was lower by ~9%, suggesting concurrent degradation of 4OHCP at 40 °C. For sample preparation, we chose HLB μ-elution plate suitable for microsample volume. The eluted samples were diluted with water to make organic content close to initial mobile phase solvents.
3.2. Assay validation
3.2.1. Calibration curves
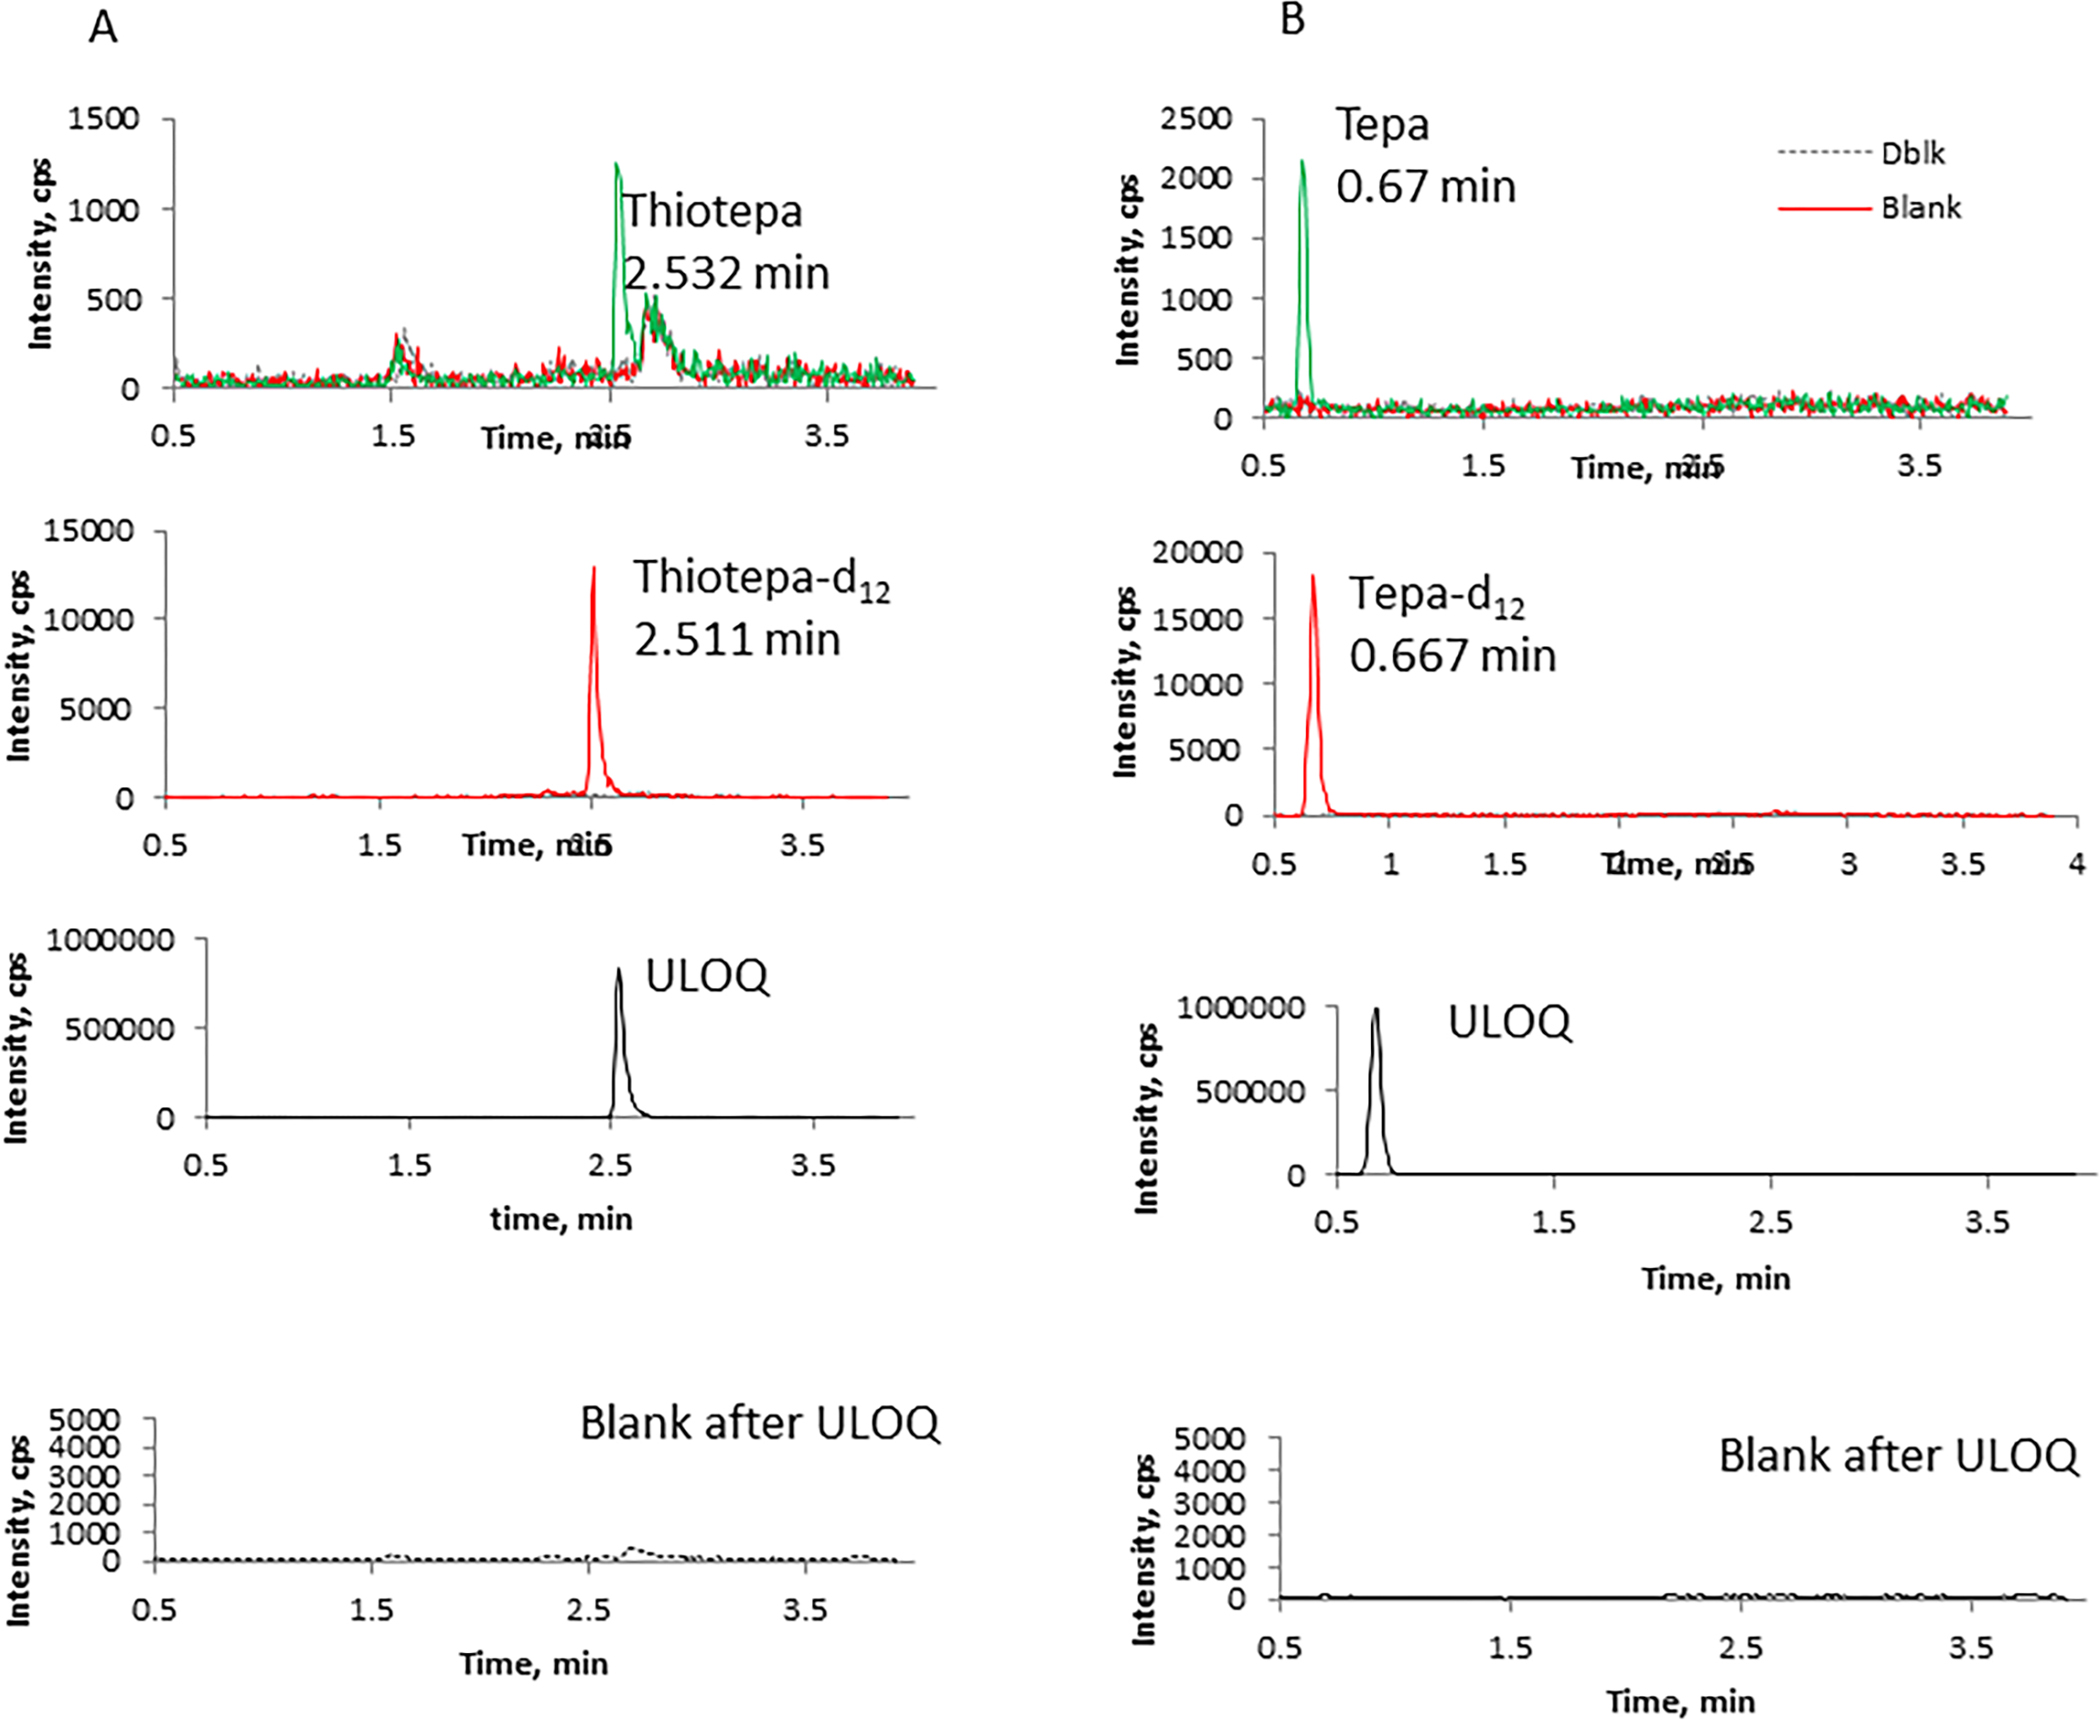
Linear regression weighted by 1/x was used to construct the standard curve for thiotepa and CP. However, linear regression resulted in failure of medium QCs frequently for tepa and 4OHCP (>115% accuracy). Comparison of linear and quadratic regression models during inter-/intra-day accuracy and precision experiments demonstrated that quadratic regression weighted by 1/x was better for tepa and 4OHCP. Therefore, quadratic regression was used for tepa and 4OHCP. The correlation coefficient (r) was typically > 0.9990. Representative chromatograms of the analytes from blank plasma extract, LLOQ, and blank plasma extract injected after the upper limit of quantitation (ULOQ) are shown in Figure 2. The signal/noise ratio at the LLOQ levels are ≥15.5 for thiotepa, ≥16.5 for tepa, ≥12 for CP, and ≥9.5 for 4OHCP.
Figure 2. Representative chromatograms of blank (red line), the LLOQ (green line) and double blank samples following ULOQ (dash line). Blank sample was processed with IS, double blank sample was processed without IS.

3.2.2. Precision and accuracy
Precision was calculated as the coefficient of variation (%CV). Accuracy was expressed as the percent deviation (%dev) from the nominal value and calculated with the following formula: %dev =(measured value- nominal value)/100. Precision and accuracy should be within 15% for low-, medium-, and high-QC samples and 20% for LLOQ. For thiotepa and tepa quantification, the intra-day precision (n = 6) over 3 days ranged from 2.1 to 7.8% for thiotepa and 1.0 to 8.6% for tepa at the three concentrations (3, 80, and 1600 ng/mL). Inter-day precisions ranged from 4.0 to 7.0% for thiotepa and 2.5 to 7.1% for tepa. The intra-day accuracy ranged from −3.0 to 11 % for thiotepa and −1.8 to 12% for tepa, and the inter-day accuracy was −0.7 to 7.2% for thiotepa and 1.2 to 12% for tepa. At the LLOQ 2.5 ng/mL level, the precision and accuracy were within 20%. All of them met the criteria (Table 2).
Table 2.
Intra- and inter-day precision and accuracy.
| Thiotepa | Intra-day | Inter-day | ||||||
|
| ||||||||
| Nominal, ng/mL | 2.50 | 3.00 | 80.0 | 1600 | 2.50 | 3.00 | 80.0 | 1600 |
|
| ||||||||
| %CV | 6.9–8.1 | 6.3–7.8 | 2.5–3.5 | 2.1–5.6 | 7.6 | 7.0 | 4.7 | 4.0 |
|
|
||||||||
| %dev | −2.7–3.3 | 1.9–8.4 | 1.9–11 | −3.0–1.0 | 0.98 | 5.7 | 7.2 | −0.7 |
|
|
||||||||
| n | 6 | 6 | 6 | 6 | 18 | 18 | 18 | 18 |
|
| ||||||||
| Tepa | Intra-day | Inter-day | ||||||
|
| ||||||||
| Nominal, ng/mL | 2.50 | 3.00 | 80.0 | 1600 | 2.50 | 3.00 | 80.0 | 1600 |
|
| ||||||||
| %RSD | 4.7–8.9 | 4.8–8.6 | 2.3–3.1 | 1.0–3.4 | 7.7 | 7.1 | 2.5 | 3.5 |
|
|
||||||||
| %dev | −4.9–2.9 | −1.8–4.7 | 11–12 | 2.3–7.9 | −1.7 | 1.2 | 12 | 4.3 |
|
|
||||||||
| n | 6 | 6 | 6 | 6 | 18 | 18 | 18 | 18 |
|
| ||||||||
| CP | Intra-day | Inter-day | ||||||
|
| ||||||||
| Nominal, ng/mL | 20 | 60 | 800 | 8000 | 20 | 60 | 800 | 8000 |
|
| ||||||||
| %RSD | 5.2–9.6 | 3.6–5.8 | 3.6–4.1 | 1.6–4.5 | 9.5 | 5.2 | 4.3 | 5.0 |
|
|
||||||||
| %dev | −17– −3.3 | 2.6–10 | 6.8–12 | −0.9–7.5 | −10.0 | 6.1 | 8.6 | 2.3 |
|
|
||||||||
| n | 6 | 6 (5) | 6 | 6 | 18 | 17 | 18 | 18 |
|
| ||||||||
| 4OHCP | Intra-day | Inter-day | ||||||
|
| ||||||||
| Nominal, ng/mL | 20 | 60 | 800 | 4000 | 20 | 60 | 800 | 4000 |
|
| ||||||||
| %RSD | 2.6–9.2 | 3.8–7.9 | 3.3–4.7 | 3.5–5.6 | 6.0 | 7.0 | 4.0 | 10 |
|
|
||||||||
| %dev | −1.7–2.7 | 1.7–11 | −1.6–2.0 | −13–9.1 | 0.6 | 5.3 | 0.8 | −0.7 |
|
|
||||||||
| n | 6 | 6 (5) | 6 | 6 | 18 | 17 | 18 | 18 |
For CP/4OHCP quantification, the intra-day precision (n = 6) over 3 days ranged from 1.6 to 5.8% for CP and 3.3 to 7.9% for 4OHCP at the low, medium, and high concentrations, and inter-day precisions ranged from 4.3 to 5.2% for CP and 4.0 to10% for 4OHCP. The intra-day accuracy ranged from −0.9 to 12% for CP and −13 to 11% for 4OHCP, and the inter-day accuracy was 2.3–8.6% for CP and −0.7–5.3% for 4OHCP. At the LLOQ 20 ng/mL level, the precision and accuracy were within 20% (Table 2).
3.2.3. Dilution integrity
An extra-high QC plasma sample at a nominal concentration of 4800 ng/mL for thiotepa and tepa was diluted with blank plasma by 3-, 5-, and 10-fold. Four replicates of the diluted samples were processed and analyzed. The mean values (n=4) were within 15% of the nominal concentration for both analytes. The %CV was 5.0%, 6.7%, and 5.6% for thiotepa, 5.8%, 3.8%, and 1.5% for tepa; %dev was 7.3%, 4.1%, and 2.7% for thiotepa, 8.3%, 13%, and 12% for tepa. Therefore, the samples can be diluted up to 10-fold without compromising sample integrity. For CP/4OHCP quantification, an extra-high QC plasma sample at 80000 ng/mL CP and 4OHCP was diluted with blank plasma by 20-fold. Four replicates of the diluted samples were processed and analyzed. The %CV was 4.3% for CP and 5.8% for 4OHCP, and %dev was 9.7% for CP and −7.6% for 4OHCP. The data support the samples can be diluted by 20-fold without compromising sample integrity.
3.2.4. Stability
Thiotepa and tepa were stable in plasma for at least 34 months at −70 °C, 60 hr at room temperature, 11 days at 4 °C, and up to 4 freeze-thaw cycles. The processed samples were stable in an autosampler for at least 3 days. The stock solutions were stable at −70 °C for at least 31 months and room temperature 22hr (Table 3).
Table 3.
Stability of thiotepa, tepa, CP, and 4OHCP (n=3).
| Conditions | Untreated ng/mL | Treated ng/mL | Remaining % | Untreated ng/mL | Treated ng/mL | Remaining % |
|---|---|---|---|---|---|---|
| Thiotepa | Tepa | |||||
| −70 °C, 34 months | 2.85±0.24 | 2.81±0.29 | 98.6 | 3.00 | 3.25±0.33 | 108 |
| 1560±150 | 1570±60 | 101 | 1440±80 | 1590±30 | 110 | |
| 22±3 °C, 60 hr | 3.01±0.11 | 3.08±0.25 | 102 | 2.76±0.02 | 3.18±0.07 | 115 |
| 1570±60 | 1370±60 | 87.3 | 1740±90 | 1550±20 | 89.1 | |
| 80 hr | 2.87±0.09 | 95.3 | 3.22±0.22 | 117 | ||
| 1300±40 | 82.8 | 1550±60 | 89.1 | |||
| 4 °C, 11 days | 3.01±0.11 | 3.14±0.21 | 104 | 2.76±0.02 | 2.95±0.22 | 107 |
| 1570±60 | 1380±50 | 87.9 | 1740±90 | 1590±70 | 91.4 | |
| Freeze-thaw 4-cycles | 3.01±0.11 | 3.42±0.10 | 114 | 2.76±0.02 | 3.23±0.16 | 117 |
| 1570±60 | 1550±40 | 98.7 | 1740±90 | 1780±50 | 102 | |
| Autosampler 3 days | 3.37±0.13 | 3.43±0.12 | 102 | 2.96±0.09 | 3.20±0.06 | 108 |
| 1590±60 | 1670±70 | 105 | 1630±60 | 1770±50 | 109 | |
| Stock solution | ||||||
| −70 °C, 31 months | (428±8)×103 | (421±10)×103 | 98.4 | (148±3)×104 | (158±6)×104 | 106 |
| 22±3 °C, 22hr | (651±9)×103 | (663±6)×103 | 102 | (911±18)×103 | (980±30)×103 | 108 |
| CP | 4OHCP | |||||
| −70 °C, 42 days | 63.1±2.3 | 68.4±3.9 | 108 | 61.0±2.3 | 64.2±3.5 | 105 |
| 8030±120 | 8490±530 | 106 | 4060±130 | 4390±200 | 108 | |
| 22±3 °C, 24hr | 67.5±3.5 | 64.8±5.3 | 96.0 | 65.6±6.9 | 62.7±4.8 | 95.6 |
| 7420±430 | 8330±480 | 112 | 4200±290 | 4380±280 | 104 | |
| Freeze-thaw 3 cycles | 64.8±4.1 | 65.5±5.5 | 101 | 61.4±2.6 | 69.7±0.2 | 114 |
| 8310±250 | 8140±230 | 98.0 | 4190±240 | 4190±150 | 100 | |
| Autosampler 80hr | 66.4±2.4 | 111 | 64.6±8.9 | 108 | ||
| 8600±140 | 108 | 3930±220 | 98.3 | |||
| Stock solution | ||||||
| −70 °C, 2 months | (106±7)× 104 | (98.9±5.3)×104 | 93.3 | |||
| −70 °C,16 months | (297±3)×104 | (300±2)×104 | 101 | |||
%remaining was calculated by comparing to the untreated values (100%).
CP and 4OHCP-SCZ were stable in plasma at −70 °C for at least 42 days, room temperature for at least 24hr, and 3 freeze-thaw cycles. Although degradation was observed for 4OHCP-SCZ in the processed samples after 2 days in the autosampler with significant reduction in low QC signal, the deuterated internal standard 4OHCP-d4-SCZ was also degraded compensating the signal loss in the samples. Therefore, after 3 days in autosampler, the injection volume of low QC samples was increased from 1 to 5 μL, and the concentration of low QC was still acceptable, with 7.7% deviation from nominal value. (Table 3).
To test the underivatized 4OHCP stability, we spiked 4OHCP directly into blood and plasma and tested at different time intervals, using the 5 min samples as controls. At 4 °C, 4OHCP was degraded in blood by 9–21% after 30 min, and 22–41% after 3 hr. Degradation in plasma was slower, with less than 15% degradation observed in 1 hr at 4 °C (Supplemental S2-Tables).
3.2.5. Matrix effect, recovery, and process efficiency
Three sets of samples each at three concentrations (low, medium, and high validation concentration levels) were prepared and analyzed to determine Matrix effect (ME), recovery (RE), and process efficiency (PE). The mean peak area and peak area ratio (analyte/IS) were calculated for each concentration in each set of samples and comparisons are presented in supplemental files S1-tables and S2-tables. ME, RE, and PE were calculated based on the following formulas and results presented in Table 4.
Table 4.
Matrix effect, recovery and process efficiency. (n=8 for thiotepa and tepa, n=3 for CP and 4OHCP)
| Analytes | Conc. (ng/ml) | Matrix effect | Recovery | PE | ||||
|---|---|---|---|---|---|---|---|---|
| analyte | IS | IS-normalized | analyte | IS | analyte | IS | ||
|
| ||||||||
| Thiotepa | Low (3) | 108 | 105 | 103 | 86.3 | 95.9 | 93.3 | 101 |
| Med (80) | 105 | 110 | 95.5 | 90.3 | 95.0 | 94.6 | 105 | |
| High (1600) | 106 | 111 | 95.5 | 93.4 | 98.1 | 99.2 | 109 | |
|
| ||||||||
| tepa | Low (3) | 121 | 119 | 102 | 88.3 | 94.5 | 107 | 112 |
| Med (80) | 120 | 120 | 100 | 86.3 | 92.7 | 104 | 112 | |
| High (1600) | 111 | 115 | 96.5 | 89.0 | 93.4 | 98.8 | 107 | |
|
| ||||||||
| CP | Low (60) | 105 | 98.9 | 106 | 107 | 103 | 112 | 102 |
| Med (800) | 101 | 100 | 101 | 103 | 101 | 103 | 101 | |
| High (8000) | 108 | 102 | 106 | 90.2 | 95.9 | 97.6 | 97.5 | |
|
| ||||||||
| 4OHCP | Low (60) | 105 | 98 | 107 | 113 | 107 | 118 | 104 |
| Med (800) | 103 | 100 | 103 | 115 | 102 | 118 | 102 | |
| High (4000) | 112 | 104 | 108 | 99.3 | 95.8 | 111 | 99.8 | |
| (1) |
| (2) |
| (3) |
Recovery (RE):
The recovery of analytes from plasma following sample preparation was assessed by comparing the peak areas from set 3 and set 2. The recoveries for thiotepa were 86.3, 90.3 and 93.4% at low-, medium-, and high-concentrations, respectively, and the recovery for the IS ranged from 95.0–98.1%. The recoveries ranged from 86.0–89.0% for tepa, 90.2–107% for CP, and 99.3–115% for 4OHCP (Table 4). The %CV of peak areas for recovery experiment was all within 13% (Supplemental S1 Tables and S2 Tables). The results demostrate the assay is highly reproducible across the concentration range with consistent and high recovery.
Matrix effect (ME):
The matrix effect of analytes from human EDTA plasma following sample preparation was assessed by comparing the peak areas from set 2 and set 1. The ME for tepa were 121, 120 and 111% at low, medium, and high concentration, respectively. and the IS-normalized ME 102, 100, and 96.5%, suggesting there is matrix effect for tepa, but the IS (tepa-d12) compensated the matrix effect very well. The ME for thiotepa, CP and 4OHCP ranged from 105–108%, 101–108%, and 103–112%, respectively. The IS normalized ME were within (100±8) % for all 4 analytes, suggesting matrix effect will not impact the assay performance. Additional data on matrix effect evaluation based on the guidelines of the NIH-supported Clinical Pharmacology Quality Assurance Program of the AIDS Clinical Trials Group are provided in the supplemental documents.
Process Efficiency (PE):
The PE of analytes from plasma following sample preparation was evaluated by comparing the peak areas from set 3 and set 1. The PE for thiotepa were 93.3, 94.6 and 99.2% at low, medium, and high concentrations, respectively. PE for the IS ranged from 101–109%. The PE for tepa, CP and 4OHCP ranged from 98.8–107%, 97.6–112%, and 111–118%, respectively.
3.2.6. Selectivity
To test assay selectivity, 6 lots of blank human EDTA plasma were processed without adding the ISs and analyzed along with a LLOQ sample. For thiotepa and tepa, two lots of heparin plasma were also processed (Figures 3 and 4). No significant signals were found at the retention times of analyte and IS for each analyte, indicating the assays are highly selective.
Figure 3. Chromatograms of six lots of blank plasma and LLOQ sample for thiotepa and tepa.

Figure 4. Chromatograms of six lots of blank plasma and LLOQ sample for CP and 4OHCP.

3.3. Analysis of clinical samples
The assays described in this report are currently being used to study the clinical pharmacology of thiotepa and CP in pediatric patients undergoing hematopoietic cell transplantation. A total of 152 plasma samples have been analyzed. Among them, 90 plasma samples were analyzed for thiotepa/tepa. Tepa concentrations were all quantifiable (> LLOQ) with 2 samples above the ULOQ; while thiotepa concentrations have a wide range (ND, 9280 ng/mL) with 6 samples <LLOQ and 43 samples >ULOQ. Sixty-two samples were analyzed for CP and 4OHCP. All samples are quantifiable for CP with 39 samples >ULOQ, while for 4OHCP 7 samples were <LLOQ and two samples were > ULOQ (Table 5). Since the assay for thiotepa/tepa was validated for up to 10-fold dilution and CP/4OHCP assay was validated for 20-fold dilution, all samples above ULOQ were quantifiable after dilution. The assays will also be applied in the outpatient setting for evaluation of drug levels in children receiving CP for treatment of pediatric rheumatologic disorders. Characterizing the PK of CP in these different patient populations, along with the exposure-response relationships is critical to ensuring optimally effective therapy while limiting severe, life-threatening drug-related toxicity. Once PK models that can better inform dosing are developed, these assays can be further used for therapeutic drug monitoring to guide effective and safe dosing in children.
Table 5.
Concentration range of clinical samples.
| Thiotepa | Tepa | CP | 4OHCP | |
|---|---|---|---|---|
| Concentration (range) | (ND, 9280) | (20.0, 2420) | (22.2, 109000) | (ND, 9890) |
| n | 90 | 90 | 62 | 62 |
Note: ND, not detectable. i.e., below 2.5 ng/mL for thiotepa, below 20ng/mL for 4OHCP.
4. Conclusions
Two assays for quantification of plasma concentrations of thiotepa, its metabolite tepa, CP and its metabolite 4OHCP, were developed using a micro-elution SPE plate and LC-MS/MS platform. These assays were validated based on guidelines from the FDA and the Clinical Pharmacology Quality Assurance Program of NIH-sponsored AIDS Clinical Trials Group, and performed well when used to quantify drug in clinical samples. Both assays require only 10 μL plasma sample, suitable for pediatric studies which have strict volume limits for blood draws. These small-volume assays, in combination with micro-sampling of blood via a finger prick with capillary tubes or the more advanced microsampling techniques such as Seventh Sense Tap™, will greatly facilitate clinical studies in pediatric population. With the highly sensitive LC-MS/MS system, these assays may also be modified for dried blood spot (DBS) samples. Considering the need for instant stabilization of 4OHCP, our future plan is to explore the DBS micro-sampling with SCZ pre-treated filter paper cards and modify the assay accordingly for the DBS samples.
Supplementary Material
Matrix effect evaluation and blood stability of CP and 4OHCP.
Matrix effect evaluation of thiotepa and tepa
Acknowledgments
We wish to thank the study participants and coordinators in these studies, and supporting staff at Drug Research Unit at UCSF. We also thank Dr. Danna Chen for the support in the analysis of thiotepa/tepa samples and her fellowship and Dr. Alexis Allyson Melton for the fund from the resource allocation program at UCSF.
Funding
This work was supported by the Department of Clinical Pharmacy and School of Pharmacy Dean’s Office fellowship (D.C.), the resource allocation program at UCSF (A. A. M.), and the National Institutes of Health (NIH) through Helen Diller Family Comprehensive Cancer Center at UCSF under grant number P30CA082103 (J.L.B), UCSF-CTSI under grant Number KL2 TR000143 (J.L.B) and UCSF-Gladstone Center for AIDS Research Pharmacology Core under grant number 5 P30 AI027763-30 7349 (F.A.).
Footnotes
Competing interests
The authors declare they have no competing interests.
References
- [1].de Jonge ME, Huitema AD, Rodenhuis S, Beijnen JH, Clinical pharmacokinetics of cyclophosphamide, Clin Pharmacokinet, 44 (2005) 1135–1164. doi: 10.2165/00003088-200544110-00003. [DOI] [PubMed] [Google Scholar]
- [2].Kokolo MB, Fergusson D, O’Neill J, Tay J, Tinmouth AT, Stewart D, Bredeson C, Effectiveness and safety of thiotepa as conditioning treatment prior to stem cell transplant in patients with central nervous system lymphoma, Leuk Lymphoma, 55 (2014) 2712–2720. doi: 10.3109/10428194.2014.889825. [DOI] [PubMed] [Google Scholar]
- [3].Teles KA, Medeiros-Souza P, Lima FAC, Araujo BG, Lima RAC, Cyclophosphamide administration routine in autoimmune rheumatic diseases: a review, Rev Bras Reumatol Engl Ed, 57 (2017) 596–604. doi: 10.1016/j.rbre.2016.09.008. [DOI] [PubMed] [Google Scholar]
- [4].Ekhart C, Doodeman VD, Rodenhuis S, Smits PH, Beijnen JH, Huitema AD, Polymorphisms of drug-metabolizing enzymes (GST, CYP2B6 and CYP3A) affect the pharmacokinetics of thiotepa and tepa, Br J Clin Pharmacol, 67 (2009) 50–60. doi: 10.1111/j.1365-2125.2008.03321.x. [DOI] [PMC free article] [PubMed] [Google Scholar]
- [5].Sukla S, Sladek S, Flockhart D, Desta Z, Nguyen A, Marsh S, Thorn C, Mcleod H, Wainer I, Dolan M, Cyclophosphamide Pathway, Pharmacodynamics., https://www.pharmgkb.org/pathway/PA2035. (Accessed May 31, 2022). [Google Scholar]
- [6].Sadagopan N, Cohen L, Roberts B, Collard W, Omer C, Liquid chromatography-tandem mass spectrometric quantitation of cyclophosphamide and its hydroxy metabolite in plasma and tissue for determination of tissue distribution, J Chromatogr B, 759 (2001) 277–284. doi: 10.1016/s0378-4347(01)00243-2. [DOI] [PubMed] [Google Scholar]
- [7].Ekhart C, Gebretensae A, Rosing H, Rodenhuis S, Beijnen JH, Huitema AD, Simultaneous quantification of cyclophosphamide and its active metabolite 4-hydroxycyclophosphamide in human plasma by high-performance liquid chromatography coupled with electrospray ionization tandem mass spectrometry (LC-MS/MS), J Chromatogr B, 854 (2007) 345–349. doi: 10.1016/j.jchromb.2007.04.024. [DOI] [PubMed] [Google Scholar]
- [8].Kalhorn TF, Howald WN, Cole S, Phillips B, Wang J, Slattery JT, McCune JS, Rapid quantitation of cyclophosphamide metabolites in plasma by liquid chromatography-mass spectrometry, J Chromatogr B, 835 (2006) 105–113. doi: 10.1016/j.jchromb.2006.03.022. [DOI] [PubMed] [Google Scholar]
- [9].Joy MS, La M, Wang J, Bridges AS, Hu Y, Hogan SL, Frye RF, Blaisdell J, Goldstein JA, Dooley MA, Brouwer KL, Falk RJ, Cyclophosphamide and 4-hydroxycyclophosphamide pharmacokinetics in patients with glomerulonephritis secondary to lupus and small vessel vasculitis, Br J Clin Pharmacol, 74 (2012) 445–455. doi: 10.1111/j.1365-2125.2012.04223.x. [DOI] [PMC free article] [PubMed] [Google Scholar]
- [10].Bai F, Fraga CH, Tagen M, Schaiquevich P, Hagedorn N, Stewart CF, Simultaneous determination of cyclophosphamide and carboxyethylphosphoramide mustard in human plasma using online extraction and electrospray tandem mass spectrometry (HTLC-ESI-MS/MS), J Chromatogr B, 877 (2009) 1709–1715. doi: 10.1016/j.jchromb.2009.04.025. [DOI] [PMC free article] [PubMed] [Google Scholar]
- [11].Attie de Castro F, Scatena Gdos S, Cass QB, Simoes BP, Lanchote VL, Analysis of cyclophosphamide and carboxyethylphosphoramide mustard enantiomers in human plasma and application to clinical pharmacokinetics, J Chromatogr B, 971 (2014) 14–19. doi: 10.1016/j.jchromb.2014.09.008. [DOI] [PubMed] [Google Scholar]
- [12].Hall OM, Peer CJ, Fitzhugh CD, Figg WD, A sensitive and rapid ultra high-performance liquid chromatography with tandem mass spectrometric assay for the simultaneous quantitation of cyclophosphamide and the 4-hydroxycyclophosphamide metabolite in human plasma, J Chromatogr B, 1086 (2018) 56–62. doi: 10.1016/j.jchromb.2018.04.016. [DOI] [PMC free article] [PubMed] [Google Scholar]
- [13].Huitema ADR, Tibben MM, Kerbusch T, Kettenes-van den Bosch JJ, Rodenhuis S, Beijnen JH, High performance liquid chromatographic determination of the stabilized cyclophosphamide metabolite 4-hydroxycyclophosphamide in plasma and red blood cells, J Liq Chromatogr Relat Technol, 23 (2000) 1725–1744. doi: Doi 10.1081/nc-100100448. [DOI] [Google Scholar]
- [14].Baumann F, Lorenz C, Jaehde U, Preiss R, Determination of cyclophosphamide and its metabolites in human plasma by high-performance liquid chromatography-mass spectrometry, J Chromatogr B, 729 (1999) 297–305. doi: Doi 10.1016/S0378-4347(99)00178-4. [DOI] [PubMed] [Google Scholar]
- [15].de Jonge ME, van Dam SM, Hillebrand MJ, Rosing H, Huitema AD, Rodenhuis S, Beijnen JH, Simultaneous quantification of cyclophosphamide, 4-hydroxycyclophosphamide, N, N’, N”-triethylenethiophosphoramide (thiotepa) and N, N’, N”-triethylenephosphoramide (tepa) in human plasma by high-performance liquid chromatography coupled with electrospray ionization tandem mass spectrometry, J Mass Spectrom, 39 (2004) 262–271. doi: 10.1002/jms.570. [DOI] [PubMed] [Google Scholar]
- [16].Huitema AD, Tibben MM, Kerbusch T, Zwikker JW, Rodenhuis S, Beijnen JH, Simultaneous determination of N,N’,N”-triethylenethiophosphoramide, cyclophosphamide and some of their metabolites in plasma using capillary gas chromatography, J Chromatogr B, 716 (1998) 177–186. doi: 10.1016/s0378-4347(98)00300-4. [DOI] [PubMed] [Google Scholar]
- [17].FDA, Bioanalytical Method Validation: Guidance for Industry. May, 2018, Center for Drug Evaluation and Research and Center for Veterinary Medicine, FDA, https://www.fda.gov/regulatory-information/search-fda-guidance-documents/bioanalytical-method-validation-guidance-industry. (Accessed 31 May, 2022). [Google Scholar]
- [18].CPQA, CPQA Guidelines for Chromatographic Method Development and Validation, v4.0, based on (and including) FDA Guidelines dated May 2001, Frontier Science, Amherst, NY, February, 2012. [Google Scholar]
- [19].CPQA, Clinical Pharmacology Quality Assurance (CPQA) guidelines for bioanalytical chromatographic method development, validation, and application, v1.0. Effective April 1, 2017., Frontier Science, Amherst, NY, 2017. [Google Scholar]
Associated Data
This section collects any data citations, data availability statements, or supplementary materials included in this article.
Supplementary Materials
Matrix effect evaluation and blood stability of CP and 4OHCP.
Matrix effect evaluation of thiotepa and tepa