

Abstract
Aim
The primary aim of this study was to in depth examine if the histological findings in a transplanted kidney biopsy can predict the prognosis for the graft and the patient. The secondary aim was to extend knowledge of the impact of time elapsed on biopsy findings.
Methods
Data from 1462 patients were merged from a kidney transplantation registry and a biopsy registry during 1 January 2007 and 30 September 2017. Kaplan–Meier analysis and multivariate Cox‐regression analysis were performed and hazard ratios (HR) with 95% confidence intervals (CI) were presented.
Results
Compared to normal biopsy findings, graft survival after biopsy (gsaBiopsy) was shorter for patients with glomerular diseases (HR 8.2, CI:3.2–21.1), rejections (HR 4.2, CI:1.7–10.3), chronic changes including IFTA (HR 3.2, CI:1.3–8.0), acute tubular injuries (HR 3.0, CI:1.2–7.8), and borderline changes (HR 2.9, CI:1.1–7.6). Sub‐analysis of rejections showed shorter gsaBiopsy for chronic TCMR (HR 4.7, CI:1.9–11.3), active ABMR (HR 3.6, CI:1.7–7.7) and chronic ABMR (HR 3.5, CI:2.0–6.0). Patients with TCMR Banff grade II (HR 0.35, CI:0.20–0.63) and grade I (HR 0.52, CI:0.29–0.93) had a better gsaBiopsy compared to all other types of rejections.
Conclusion
Shorter gsaBiopsy was noted in kidneys with glomerular diseases, rejections, acute tubular injuries and borderline changes. TCMR Banff rejections grade I and II were associated with a better prognosis.
Keywords: graft survival, histological findings, kidney biopsies
SUMMARY AT A GLANCE
This Swedish single centre study showed that the impact on allograft survival is dependent on the nature of the biopsy findings, with histological findings of glomerular disease, severe rejections and chronic changes being associated with more rapid allograft loss.
1. INTRODUCTION
Kidney transplantation is currently a preferred treatment for many patients with kidney failure requiring renal replacement therapy 1 ; however, long‐term survival is limited. 2 Although the short‐term graft survival has improved over the years, 3 long‐term survival of the kidney transplant has not changed extensively. 4 , 5 , 6 Unfortunately, no reliable prognostic markers have been identified to predict graft survival. Some studies show that a low estimated glomerular filtration rate after 1 year of transplantation may be correlated with long‐term graft failure. 7 , 8 Another study postulated that proteinuria could be a marker for prediction of graft survival; however, proteinuria can be influenced by different factors such as infections and recurrence of glomerular diseases in the kidney transplant. 9 A transplant kidney biopsy is currently the only diagnostic tool for correct diagnosis of organ dysfunction, both for guiding the treatment and as a prognostic tool for the clinician. The clinical benefit of biopsy findings may vary over time after transplantation based on, for example histological findings, classification and drug treatment. There is an imminent need for more in‐depth knowledge of pathological findings as well as for foremost strategies for treating chronic rejection and recurrent glomerulonephritis. Some important reasons for transplant loss are: interstitial fibrosis and tubular atrophy (IFTA) – former described as chronic renal allograft nephropathy (CAN), 10 chronic rejection, 11 subclinical rejections (especially antibody‐mediated), 12 , 13 , 14 transplant‐glomerulopathy, 9 and acute rejection (early and late). 15 , 16 A factor that appears important to consider is the time after kidney transplantation since it has an impact on biopsy findings. 13 , 14
Once graft loss develops, the question arises if transplant biopsy findings can explain the reasons for subsequent death. Possible risk factors for shortened patient survival after graft loss are acute rejection, infection, and thrombosis. 17 , 18
The primary aim of this study was to in depth examine if the histological result of a transplanted kidney biopsy can predict prognosis for the graft and the patient. The secondary aim was to extend knowledge of the impact of time elapsed on biopsy findings.
2. MATERIAL AND METHODS
This retrospective registry study included 1542 patients who had received a kidney transplant and had performed their first registered kidney transplant biopsy between 1 January 2007 and 30 September 2017. All patients had received their kidney transplant at the Transplant centre of Sahlgrenska University Hospital in Gothenburg, Sweden. A 5% of the patients received the transplant between 1977 and 1993, 15% between 1993 and 2003, and 80% between 2003 and 2017. In 86% of the patients, the biopsy was performed on the first transplant kidney. The definition for graft survival after biopsy is the time from the biopsy until loss of transplant function when either start of dialysis or re‐transplantation was necessary. Death of other causes was a censoring point in the model. Complete data entailing diagnosis and transplant‐survival were achieved for 1462 patients who were included in the final data analysis (Figure 1).
FIGURE 1.
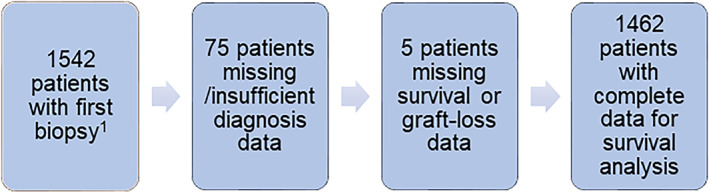
Flowchart showing the number of patients with the first biopsy that were included in the survival analysis. 1First registered biopsy in the biopsy registry
The data were part of a quality assessment registry (TIGER) that includes all kidney‐transplanted patients from 1965 onwards at the Sahlgrenska University Hospital in Gothenburg, Sweden. The TIGER data were merged with data from the Regional Biopsy Registry. 19 The Biopsy Registry data and TIGER data assessed in the present study included follow‐up data and outcomes up until September 2017. All biopsy assessments were made at the department of Pathology at Sahlgrenska University Hospital in accordance with the Banff 2007 classification and subsequent Banff updates as they became available progressively. 20 Most of the patients underwent indication biopsies (94%, n = 1371) whereas the remainder were protocol biopsies (6%, n = 91) in conjunction with other studies. Biopsies of kidneys from both deceased (DD) and living donors (LD) were Included. All biopsies performed in this time‐period were evaluated by one of three pathologists who were subspecialized in renal pathology. Data on donor specific antibodies (DSA) were not included since these were not determined routinely at the start of the study and had only been performed on indication since 2012. Only the main biopsy findings were reported in the present study and included in the statistical analysis. During the initial period of biopsy evaluation, the term chronic allograft nephropathy (CAN) was used, and from 2010 was diagnosed as IFTA. 10 The rejections were further divided into specific subcategories given in Table 1. Estimated glomerular filtration rate (eGFR) was calculated by the Chronic Kidney Disease Epidemiology Collaboration (CKD‐EPI) equation. 21
TABLE 1.
Characteristics of kidney transplant recipients (N = 1462) who underwent a renal transplant biopsy (first registered biopsy) between 2007 and 2017
| Variable | N = 1462 |
|---|---|
| Age a (years) | |
| Mean (SD) | 49.7 (15.2) |
| Median (IQR) | 52 (40–61) |
| Male, n (%) | 928 (63.4) |
| Living donor, n (%) | 506 (34.6) |
| Missing data concerning type of donor | 105 (7.2) |
| GFR b (ml/min/1.73m2) at time of kidney biopsy (KB), mean (SD) | 47.3 (21.6) |
| Groups of diagnoses, n (% of all biopsies) | |
| Normal biopsy findings | 88 (6.0) |
| Infections and tubulointerstitial nephritis (TIN) | 62 (4.2) |
| Acute tubular injuries (ATN and acute CNI‐toxicity) | 177 (12.1) |
| Chronic changes including IFTA | 335 (22.9) |
| Haematological diseases | 5 (0.3) |
| Glomerular diseases | 84 (5.7) |
| Minor abnormalities | 149 (10.2) |
| Borderline changes | 128 (8.8) |
| Rejections | 434 (29.7) |
| Subgroups of rejections (n = 434), n (% of rejections) | |
| Acute TCMR | 235 (54.1) |
| Chronic TCMR | 13 (3.0) |
| Active ABMR | 28 (6.5) |
| Chronic ABMR | 71 (16.4) |
| Combined active ABMR and acute TCMR | 5 (1.2) |
| Combined chronic ABMR and chronic TCMR | 82 (18.9) |
| Time between kidney transplantation (KT) and KB, median (IQR) | 4.6 (0.5–74) |
| KT‐KB time, categorical, n (%) | |
| <14 days | 364 (24.9) |
| 14–30 days | 94 (6.4) |
| 1–6 months | 247 (16.9) |
| 6–12 months | 69 (4.7) |
| 1–5 years | 208 (14.2) |
| 5–10 years | 157 (10.7) |
| >10 years | 222 (15.2) |
| Missing data about exact date of KT | 101 (6.9) |
| Follow‐up time after biopsy in years, median (IQR) | 5.5 (2.8–8.2) |
Abbreviations: ABMR, antibody‐mediated rejection; ATN, acute tubular necrosis; CAN, chronic allograft nephropathy; CNI, calcineurin inhibitor; IFTA, interstitial fibrosis and tubular atrophy; IQR, interquartile range; n, number; TCMR, T‐cell mediated rejection; TIN, infections and tubulointerstitial nephritis. Glomerular diseases: recurrent or de‐novo disease; Minor abnormalities were defined as minimal findings and none of the diagnosis above.
Age at biopsy.
Estimated glomerular filtration rate according to CKD‐EPI equation.
The maintenance immunosuppressive protocols have evolved. Since 1983, cyclosporine, azathioprine and prednisolone were used and gradually during the 10 years of 2007–2017 mainly basiliximab‐induction, low dose tacrolimus (Tac), mycophenolate mofetil (MMF) and prednisolone were employed. For 80% of the patients in the current study the basic treatment protocol included Tac, MMF, and prednisolone.
2.1. Data analysis
For categorical variables, the Chi‐square test was used for univariate comparisons. Graft and patient survival analyses were initially performed with Kaplan–Meier analysis with log‐rank tests comparing different groups. Different models with death censored graft loss as outcome were performed. Cox‐regression analysis, including age and gender as covariates, was performed and the results presented as hazard ratio (HR) and 95% confidence intervals (CI). All variables from Table 1 were univariately tested for association with graft survival. Age and eGFR were statistically significant but eGFR was not included in the model as covariate as it could be considered as outcome. Type of donor was not statistically significant for graft survival. Graft and patient survival was analysed only from the time of the biopsy in all performed models. Proportional hazard assumption was tested both graphically and by testing interaction between time and diagnosis group. There were no violations of the assumption. Some of the diagnoses were strongly related to specific time periods after transplantation. “Time after transplantation” was therefore not initially adjusted for in the main Cox‐regression model since it could imply inappropriate adjustment or adjustment for a factor laying in causal pathways. However, to explore the impact of time after transplantation as a possible confounder, we also performed a sensitivity analysis that is presented in the result section. A two‐sided p‐value of <.05 was considered as statistically significant. All analyses were performed using the statistical package IBM SPSS version 25.
3. RESULTS
Of the 1542 patients included, 36% were female and 64% male. The median age at biopsy was 52 years (quartiles 40–61 years). At the time of the biopsy mean eGFR was 42.8 ml/min/1.73m2. The median time between transplantation and the first registered transplant kidney biopsy was 4.6 months (IQR 0.5–74 months), but 24.9% of the biopsies were performed within 2 weeks and 52% within 6 months from transplantation. The follow‐up time after biopsy was on median 5.5 years (IQR 2.8–8.2 years). All histopathological diagnoses were grouped into nine main diagnostic categories as described in Table 1.
Rejection was diagnosed in 30% of all the biopsies. The rejections were further divided into subcategories where acute T‐cell mediated rejection (TCMR) was noted in 54% of all rejections (Table 1). Distribution of the nine main diagnostic categories according to type of donor is presented in Table 2.
TABLE 2.
Distribution of various histological findings according to type of kidney donor
| Diagnoses | Deceased donor (% within diagnosis) | Living donor (% within diagnosis) | Diagnoses (% within deceased donor) | Diagnoses (% within living donor) |
|---|---|---|---|---|
| Normal biopsy findings (n = 85) | 41% | 59% | 4.1% | 9.9% |
| Infections and TIN a (n = 57) | 51% | 49% | 3.4% | 5.5% |
| Acute tubular injuries b (n = 168) | 80% | 20% | 15.9% | 6.5% |
| Chronic changes incl. IFTA c (n = 311) | 61% | 39% | 22.4% | 23.7% |
| Haematological diseases (n = 3) | 33% | 67% | 0.1% | 0.4% |
| Glomerular diseases d (n = 75) | 57% | 43% | 5.1% | 6.3% |
| Minor abnormalities (n = 143) | 55% | 45% | 9.2% | 12.8% |
| Borderline changes (n = 122) | 72% | 28% | 10.3% | 6.7% |
| Rejections (n = 393) | 64% | 36% | 29.5% | 28.1% |
|
Total (n = 1357) Unknown date of transplantation e (n = 105) |
63% | 37% | 100% | 100% |
TIN is tubulointerstitial nephritis.
Acute tubular injuries is acute tubular necrosis (ATN) and acute CNI‐toxicity (calcineurin inhibitor).
Chronic changes (incl. chronic CNI‐toxicity and IFTA/CAN); IFTA, interstitial fibrosis and tubular atrophy; CAN, chronic allograft nephropathy.
Glomerular diseases: recurrent or de novo disease.
A total of 105 patients were missing data about type of donor, and therefore not included in the analysis.
3.1. Prevalence of various histological diagnoses at different time points after kidney transplantation
The distribution of various histological diagnoses in biopsies was associated to time after transplantation, but also in some cases to donor type. Certain diagnoses were more likely to be detected when performed early after transplantation, whereas others were more likely to be detected later on (p < .001). Mostly all of the acute tubular injuries (ATI) were detected within 14 days (49% of all biopsies at that time among DD and 23% among LD) or 14–30 days (19% of all at that time among DD and 10% among LD) (Figure 2). Of all ATI, 20% were found in LD kidneys (Table 2). Of those with ATI, acute CNI‐toxicity represented approximately 25%, both in DD and in LD. Glomerular diseases were likely to be detected within 1–5 years (8% of all at that time both among DD and LD), 5–10 years (15% both among DD and LD) and after 10 years (12% among DD and 17% among LD); there were nearly no cases before 1 year. Chronic changes including IFTA increased over time both among DD and LD from 12% within 14 days to 41% among biopsies after 10 years. Minor abnormalities were present in 6% of all biopsies performed within 14 days among DD and 15% among LD, around 20% of those performed within 14–30 days both among DD and LD and later there was a decrease to 2% in biopsies after 10 years both among DD and LD. For normal biopsy findings there was a peak at 6–12 months (11% among DD and 24% among LD), and for borderline there was a peak between 1 and 12 months (15%–18% among DD and 10%–4% among LD). A 20% of all normal biopsies were protocol biopsies. Infections and tubulointerstitial nephritis (TIN) including polyoma virus had the highest prevalence in biopsies at 6–12 months (11% among DD and 16% among LD), and when looking at polyoma virus (BK virus) nephropathy separately, the pattern was similar, but the peak was higher among LD. The prevalence of rejections among DD was between 23% and 32% during the first 5‐years, and then increased to 38% among biopsies at 5–10 years, while the prevalence of rejections among LD was initially higher within 14 days (36%) and after a decrease until 1 year (12%), we could see an increase at 5–10 years (38%) (Figure 2).
FIGURE 2.
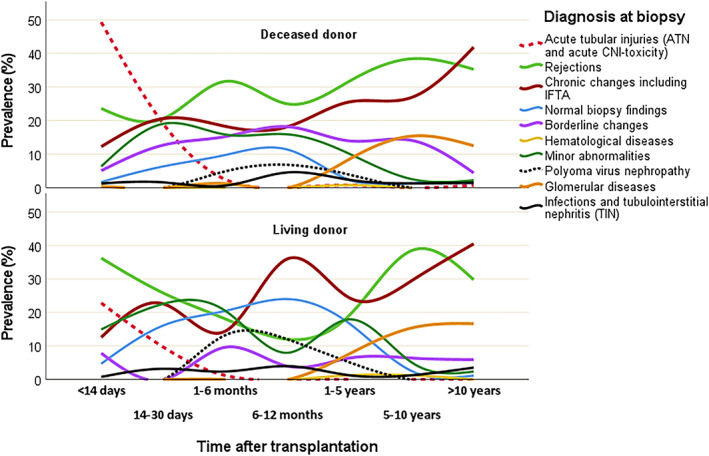
Prevalence of histological diagnoses over time after transplantation according to type of donor. Prevalences (percentages) calculated in relation to all biopsy findings at each time point
Among rejections, acute TCMR was the most dominant group during the first 5 years after transplantation. This group corresponded to 24% of all biopsies at <14 days with a prevalence peak at 1–6 months after transplantation (25% of all biopsies at that time). Active ABMR was at a low prevalence and was approximately evenly distributed during the entire time period after transplantation. Chronic rejection in the form of chronic TCMR was seen in a few cases as early as 6 months after transplantation, and its prevalence as an isolated entity remained low. Later on, chronic TCMR was seen in combination with chronic ABMR, and this combination became as prevalent as chronic ABMR alone in late transplant biopsies (Figure 3). Biopsy proven TCMR Banff grade II rejection had the highest prevalence among early biopsies (18.4% within 14 days and 9% within 1–6 months) and decreased slowly (4.3% within 6–12 months and 1.9% within 1–5 years), whereas TCMR Banff grade I, in contrast, had a low prevalence within 14 days (3%) and increased during 1 year after transplantation (9.6% within 1 month, 11% within 1–6 months and 13% within 6–12 months).
FIGURE 3.
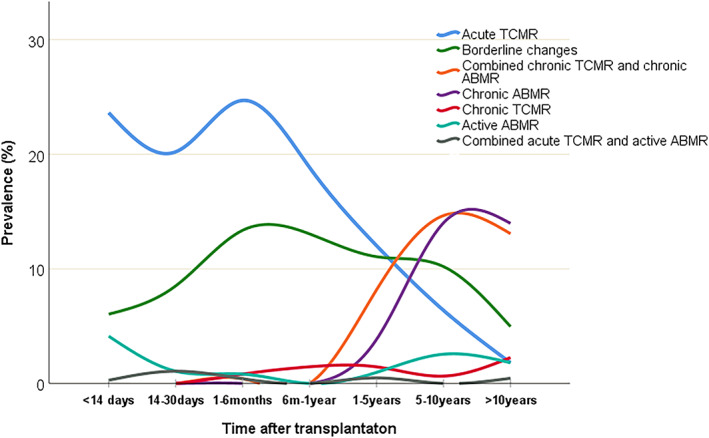
Prevalence of subgroups of rejections over time after transplantation. Percentages calculated in relation to all biopsy findings at each time point
The distribution of various histological findings according to type of biopsy (indication versus protocol biopsy) is shown in Table A (Supplementary material). Protocol biopsies showed higher prevalence of normal biopsy findings and minor abnormalities while prevalence of rejections was lower in this group.
3.2. Graft survival after biopsy
3.2.1. Main diagnoses
Graft survival after biopsy was analysed based on nine main diagnostic groups (Figure 4). The risk for graft loss (age and gender adjusted) was significantly higher for patients with glomerular diseases (HR 8.2, CI 3.2–21.1; p < .001), rejections (HR 4.2, CI 1.7–10.3; p = .002), chronic changes including IFTA (HR 3.2, CI 1.3–8.0; p = .012), acute tubular injuries (HR 3.0, CI 1.2–7.8; p = .023) and borderline changes (HR 2.9, CI 1.1–7.6; p = .034) compared to those with normal biopsy findings (Table 3).
FIGURE 4.
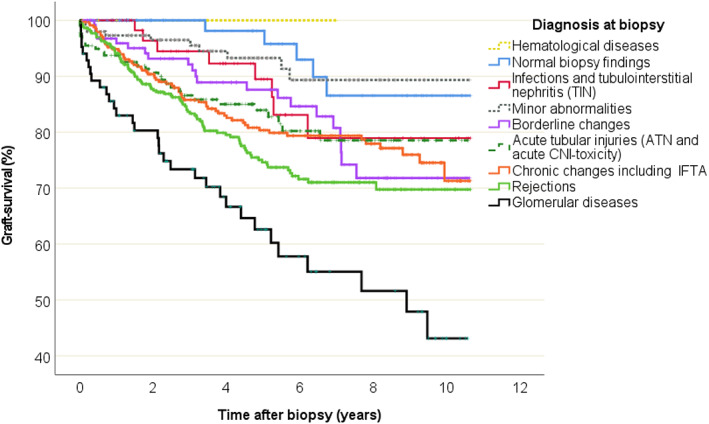
Graft survival data and Kaplan–Meier curves according to histological diagnosis based on biopsies
TABLE 3.
Cox regression analysis of death‐censored graft survival according to the histological diagnosis of biopsy, in univariate and adjusted model
| Graft survival (time to graft loss) | ||||
|---|---|---|---|---|
| Crude association | Adjusted association a | |||
| HR with 95% CI | p‐value | HR with 95% CI | p‐value | |
| Main diagnosis, (n) | ||||
| Normal biopsy findings (n = 88) | Ref. | — | Ref. | — |
| Infections and TIN b (n = 62) | 2.13 (0.70–6.52) | .184 | 2.17 (0.71–6.63) | .176 |
| Acute tubular injuries c (n = 177) | 2.96 (1.14–7.64) | .025 | 3.01 (1.16–7.78) | .023 |
| Chronic changes incl. IFTA d (n = 335) | 3.16 (1.27–7.85) | .013 | 3.21 (1.29–7.98) | .012 |
| Haematological diseases (n = 5) | n.a. | .953 | n.a. | .954 |
| Glomerular diseases (n = 84) | 7.98 (3.11–20.44) | <.001 | 8.23 (3.21–21.11) | <.001 |
| Minor abnormalities (n = 149) | 1.25 (0.43–3.66) | .683 | 1.26 (0.43–3.70) | .669 |
| Borderline changes (n = 128) | 2.83 (1.07–7.51) | .036 | 2.87 (1.08–7.62) | .034 |
| Rejections (n = 434) | 4.20 (1.73–10.29) | .002 | 4.20 (1.71–10.35) | .002 |
| Subgroups of rejections, (n) | ||||
| A) Acute TCMR (n = 235) | Ref. | — | Ref. | — |
| B) Chronic TCMR (n = 13) | 4.74 (1.97–11.41) | .001 | 4.70 (1.95–11.32) | .001 |
| C) Active ABMR (n = 28) | 3.64 (1.72–7.67) | .001 | 3.65 (1.72–7.72) | .001 |
| D) Chronic ABMR e (n = 71) | 3.37 (1.95–5.81) | <.001 | 3.47 (1.99–6.01) | <.001 |
| Combined A) and C) (n = 5) | n.a. | .972 | n.a. | .972 |
| Combined B) and D) (n = 82) | 3.89 (2.29–6.60) | <.001 | 3.92 (2.30–6.68) | <.001 |
Abbreviations: CI, confidence interval; HR, hazard ratio; n = number; n.a., not applicable‐zero events; Ref., reference category for calculation of HR.
Age and gender adjusted.
TIN is tubulointerstitial nephritis.
Acute tubular injuries: acute tubular necrosis (ATN) and acute CNI‐toxicity (calcineurin inhibitor).
Chronic changes (incl. chronic CNI‐toxicity and IFTA/CAN).
Chronic ABMR included transplant glomerulopathy (TGP).
ABMR, antibody‐mediated rejection; CAN, chronic allograft nephropathy; IFTA, interstitial fibrosis and tubular atrophy; Glomerular diseases: recurrent or de novo disease; TCMR, T‐cell‐mediated rejections.
During the follow up, among glomerular diseases, the worst prognosis was for vasculitis (57% graft loss) and IgA‐nephritis (48% graft loss). Among focal segmental glomerulosclerosis, diabetic nephropathy and unclear glomerulopathy graft loss varied between 24% and 33%. Other subgroups were too small (n < 5) to draw any conclusions about graft loss.
A sub‐analysis comparing glomerulonephritis (GN, n = 50 patients) versus other glomerular disease (GD, n = 33 patients, i.e. diabetic nephropathy etc.) found no difference in graft‐survival (p = .219, Log rank test), see Figure A (Supplementary material).
3.2.2. Subgroups of rejections
Graft survival analysis was performed (adjusted for age and gender) regarding the various subgroups of rejections (Figure 5).
FIGURE 5.
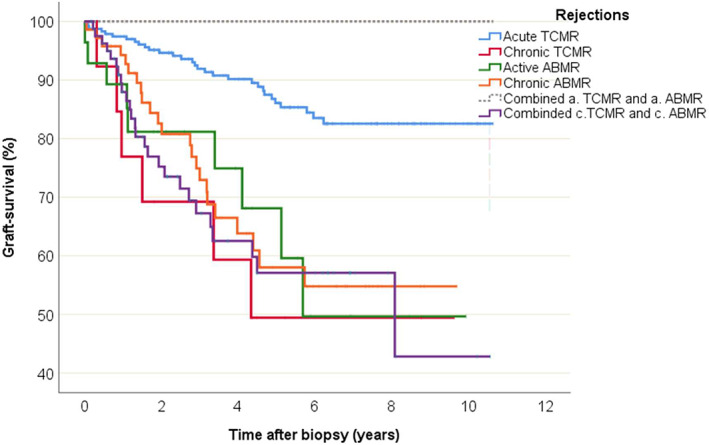
Graft survival data and Kaplan–Meier curves according to the subgroups of rejections found in the biopsies
The subgroups were compared to acute TCMR as the reference group. There was a higher risk for graft loss for chronic TCMR (HR 4.7, CI 1.9–11.3; p = .001), active ABMR (HR 3.6, CI 1.7–7.7; p = .001), chronic ABMR (HR 3.5, CI 2.0–6.0; p < .001), and combined chronic ABMR and chronic TCMR (HR 3.9, CI 2.3–6.7; p < .001) compared to acute TCMR (Table 3).
In a sub analysis, borderline changes showed a rate in graft survival that was similar to acute TCMR (p = .270) but was better in comparison to the other subgroups of rejections (p = .006 compared to chronic TCMR, p = .003 compared to active ABMR, p = .001 compared to chronic ABMR).
Compared to all other rejections, patients with a biopsy finding of TCMR Banff grade II rejection (HR 0.35, CI 0.20–0.63; p < .001) as well as patients with TCMR Banff grade I (HR 0.52, CI 0.29–0.93; p = .027) had lower risks for graft loss. Comparisons were sex and age adjusted (data not shown).
3.2.3. Sensitivity analysis – including time after transplantation in the model
After including “time after transplantation” in the Cox‐model together with main diagnosis, age and sex, the risk for graft loss was still significantly higher for patients with glomerular diseases (HR 5.4, CI 2.1–14.0; p < .001), rejections (HR 3.7, CI 1.5–9.2; p = .004), acute tubular injuries (HR 3.6, CI 1.4–9.4; p = .008) and borderline changes (HR 2.8, CI 1.1–7.4; p = .04) compared to normal biopsy findings. Chronic changes including IFTA no longer reached statistical significance (HR 2.4, CI 0.9–5.9; p = .066).
3.3. Patient survival
There were 163 patients (11%) who died during the follow‐up. The median age of these patients at biopsy time was 61 years. Death with a functioning transplant occurred in 8% (i.e., 121 of 1462 patients) after a median time of 70 months (mean 84 months) after transplantation and 32 months after biopsy (mean 37 months). Of the 42 patients who died after graft‐loss, nine (21%) died within 30 days after transplant failure. The most common causes of death among all patients were cardio‐vascular disease (30%), infections (19%) and cancers (14%).
4. DISCUSSION
In this study, we explored large set of kidney transplant biopsy data in regard to graft survival. The present analysis covers biopsy findings in a more recent era of transplantation compared to former studies. 2 , 14 , 22 The registry included both early and late biopsies, and thus we were able to examine the prognosis of common histological findings in a clinical setting of mainly indication biopsies.
Taken together, rejection was the most common finding overall, and the time dependent pattern of the predominant early acute TCMR and late occurrence of chronic ABMR was a pattern similar to that seen by Sellarés et al. 14
The present study showed that half of all kidney transplant biopsies were performed within 6 months after transplantation and the majority within 14 days. During the first period (<14 days), the majority of findings were acute tubular injuries (ATI, 40%), and of these, as much as 20% were in living donor related kidneys. ATI is mainly expected to be due to ischemic injury related to transplant delay in DD but not in LD. The relatively large proportion of LD with ATI suggest that pharmacological side effects by the induction therapy may contribute partly to such findings both in LD and DD.
Rejection (28%) and chronic changes (12%) were the subsequent most common findings within 14 days. Findings of rejection were found in around ¼ of all biopsies until 5 years; this increased to about 1/3 thereafter. This is in line with the study by Sellarés et al. 14 although these authors did not describe it as precisely as in the present study. De‐novo or recurrent glomerulonephritis was diagnosed mainly 5 years or more after transplantation. This was also similar to findings by Sellarés et al. 14
Chronic changes were interpreted as donor derived damages diagnosed in the transplant biopsy. Notable borderline changes and minor abnormalities, but also “normal findings”, represented 20%–45% of the findings before 5 years and decreased thereafter. Borderline changes and possibly minor abnormalities may indicate early stages of immunologically or pharmacologically‐induced changes that may transform into chronic damage subsequently, similarly for DD and LD. Here further diagnostic tools may help to clarify the pathophysiology. It may also be speculated that these biopsies were done to investigate early or non‐specific rise of serum creatinine.
Among the rejection diagnoses, acute TCMR was the dominant finding in the biopsies taken during the first years after transplantation as well as later on. This indicates that acute TCMR appears both more extensively and earlier than shown by Sellarés et al. and Arias‐Cabrales et al. 13 , 14 Acute TCMR was a dominant finding until approximately 2 years after transplantation when chronic TCMR and ABMR were more frequent. This suggests that immunosuppression must be focused on the T‐cell response during the first years to avoid progression to chronicity.
Chronic changes including IFTA were already found in 12% of biopsies within 14 days post‐transplant, making up more than 20% of biopsy findings at 5 years, and increased further thereafter. Early IFTA changes probably include undefined chronic changes in donor kidneys. It could also represent prior TCMR, as shown by Nankivell et al., 23 who found that TCMR preceded IFTA in a series of repeated transplant biopsies. Hence early IFTA on biopsy may warrant further investigation for underlying alloimmune activity causing ongoing injury.
Polyoma nephropathy was found in biopsies performed after 1 month and up until 5 years after transplantation; this was similar to that described by Sellarés et al. 14 The impact on graft survival was small and non‐significant compared to normal biopsy findings, which indicates a good prognosis, possibly related to early diagnosis in the modern era where monitoring of virus levels with Polymerase Chain Reaction is available.
Among the biopsies with a histologic finding of rejection, acute TCMR had the best outcome concerning time to graft loss (around 9 years on average), whereas active ABMR, chronic TCMR and chronic ABMR had a shorter time to graft loss (just over 6 years on average). This underpins the importance of diagnosing acute rejection early to prevent progression to chronic rejection.
Histological grading of transplant lesions according to the Banff criteria shows that more lesions are present in higher grades. 24 The present study showed that patients with TCMR Banff grade II had a better graft survival compared to all other rejections. This was in contrast to other findings where Banff grade I was shown to have significantly better outcome. 25 The reason for a better outcome could be that Banff grade II would imply a more intensive therapeutic measure than a finding of Banff grade I. Grade II is generally treated more aggressively with anti‐thymocyte globulin rather than steroids that are generally given to grade I rejections.
In later years, the entity of chronic TCMR has been identified by Banff, albeit in a small number of patients. Given our large study cohort we were able to identify a small cohort of chronic TCMR and ABMR, in contrast to Sellarés et al. 14
Once patients lose their transplant kidney function, every fifth patient died within a month, which indicates that such patients were at an increased risk for death. Risk factors might be the reduction of the immunosuppressives that allow increased immunological stress in conjunction with the uremic condition and transition period to an established dialysis program. Kaplan et al. 17 speculated that the higher death rate after graft loss could be related to the loss of a protective effect of the kidney transplant. They found that dialysis for more than 2 years prior to transplantation, infection related to graft loss, acute rejection and thrombosis were risk factors for death after graft loss. In addition, return to dialysis is associated with increased risk for morbidity. 26
A limitation of the study is the retrospective registry study design. Data of all transplanted patients were included in the TIGER registry. To motivate registration, the request of data had to be limited. Still responses could be sparse and intermediate visits not registered. However, intermediate follow‐up data within the frame of the TIGER varies between different centres. Some centres do not, or only sparsely, fill out and return the yearly questionnaire while other centres systematically complete the follow‐up questionnaires (centre‐effect). Another limitation is that most of the biopsies included were for cause biopsies, but the indications were unknown to us.
Although biopsy analyses could reveal several diagnostic findings, only the main diagnosis was used for data analysis. Interactive pathological mechanisms can thereby have been missed. Since protocol biopsies may reveal early changes that could influence therapy, such changes to larger extent are missed in the indication biopsies. On one hand, this would support more protocol biopsies but on the other hand an increased risk for adverse events appears by frequent biopsies. This favours more rapid decision for indication biopsies even upon early laboratory worsening. The study did not include doses and changes in pharmacological managements. It was assumed that each specific biopsy finding was handled according to established routines at the transplant centre. No data on donor characteristics, duration of dialysis, HLA matching and donor‐specific anti‐HLA antibody were included in the registry.
The strength of the present study is, however, the large number of biopsies and transplanted patients, which enabled analyses of sub‐diagnoses in relation to both graft survival and time between transplantation and performed biopsy.
In conclusion, shorter graft survival after biopsy was mainly noted in kidneys with glomerular diseases and in kidneys with rejections, acute tubular injuries, borderline changes and chronic changes. Banff rejections grade I and II were associated with a better prognosis. A significant proportion of deaths appeared within 1 month (21%) after loss of transplant function. The present study emphasizes the importance of timely made indication biopsies to be able to predict and plan future therapeutic measures based on histological findings.
CONFLICT OF INTEREST
The authors declare no conflicts of interest.
AUTHOR CONTRIBUTIONS
Salmir Nasic, Björn Peters, Bernd Stegmayr, and Johan Mölne participated in the design of the study, took part in interpretation of the data and in writing of the manuscript. Bernd Stegmayr and Björn Peters participated in recruiting of the subjects, Johan Mölne acquired data from pathology files and Salmir Nasic performed statistical analysis.
ETHICS STATEMENT
The Regional Ethical Review Board in Gothenburg, Sweden approved the study (DNR: T586‐14, EXP 2014‐07‐24).
Supporting information
Figure A (Supplementary material). Graft survival comparing glomerulonephritis versus other glomerular disease.
Table A (Supplementary material). Distribution of various histological findings according to type of biopsy. Supporting information.
ACKNOWLEDGEMENTS
The authors are grateful to the patients that consented and the staff that performed data collection enabling the present study. We also thank Lars Mjörnstedt who launched the TIGER registry and supported data analyses. We also gratefully acknowledge funding from the Research Fund at Skaraborg Hospital, Skövde, Sweden and the Healthcare Board, Region Västra Götaland, Sweden.
Nasic S, Mölne J, Stegmayr B, Peters B. Histological diagnosis from kidney transplant biopsy can contribute to prediction of graft survival. Nephrology. 2022;27(6):528‐536. doi: 10.1111/nep.14028
Funding information Region Västra Götaland; Skaraborg Hospital
REFERENCES
- 1. Canpolat T, Ozdemir BH, Torun D, Caliskan K, Haberal M. Four‐year analyses of renal graft biopsies: a single‐center pathology experience. Exp Clin Transplant. 2017;15(2):171‐178. [DOI] [PubMed] [Google Scholar]
- 2. Matas AJ, Fieberg A, Mannon RB, et al. Long‐term follow‐up of the DeKAF cross‐sectional cohort study. Am J Transplant. 2019;19(5):1432‐1443. [DOI] [PMC free article] [PubMed] [Google Scholar]
- 3. Saran R, Li Y, Robinson B, et al. US renal data system 2014 annual data report: epidemiology of kidney disease in the United States. Am J Kidney Dis. 2015;66:1‐305. [DOI] [PMC free article] [PubMed] [Google Scholar]
- 4. Lamb KE, Lodhi S, Meier‐Kriesche HU. Long‐term renal allograft survival in the United States: a critical reappraisal. Am J Transplant. 2011;11(3):450‐462. [DOI] [PubMed] [Google Scholar]
- 5. Meier‐Kriesche HU, Schold JD, Srinivas TR, Kaplan B. Lack of improvement in renal allograft survival despite a marked decrease in acute rejection rates over the most recent era. Am J Transplant. 2004;4(3):378‐383. [DOI] [PubMed] [Google Scholar]
- 6. Lodhi SA, Lamb KE, Meier‐Kriesche HU. Solid organ allograft survival improvement in the United States: the long‐term does not mirror the dramatic short‐term success. Am J Transplant. 2011;11(6):1226‐1235. [DOI] [PubMed] [Google Scholar]
- 7. Kaplan B, Schold J, Meier‐Kriesche HU. Poor predictive value of serum creatinine for renal allograft loss. Am J Transplant. 2003;3(12):1560‐1565. [DOI] [PubMed] [Google Scholar]
- 8. Pascual J, Marcen R, Zamora J, et al. Very early serum creatinine as a surrogate marker for graft survival beyond 10 years. J Nephrol. 2009;22(1):90‐98. [PubMed] [Google Scholar]
- 9. Stegall MD, Gaston RS, Cosio FG, Matas A. Through a glass darkly: seeking clarity in preventing late kidney transplant failure. J Am Soc Nephrol. 2015;26(1):20‐29. [DOI] [PMC free article] [PubMed] [Google Scholar]
- 10. Solez K, Colvin RB, Racusen LC, et al. Banff '05 meeting report: differential diagnosis of chronic allograft injury and elimination of chronic allograft nephropathy ('CAN'). Am J Transplant. 2007;7(3):518‐526. [DOI] [PubMed] [Google Scholar]
- 11. Nankivell BJ, Fenton‐Lee CA, Kuypers DR, et al. Effect of histological damage on long‐term kidney transplant outcome. Transplantation. 2001;71(4):515‐523. [DOI] [PubMed] [Google Scholar]
- 12. Loupy A, Vernerey D, Tinel C, et al. Subclinical rejection phenotypes at 1 year post‐transplant and outcome of kidney allografts. J Am Soc Nephrol. 2015;26(7):1721‐1731. [DOI] [PMC free article] [PubMed] [Google Scholar]
- 13. Arias‐Cabrales C, Redondo‐Pachon D, Perez‐Saez MJ, et al. Renal graft survival according to Banff 2013 classification in indication biopsies. Nefrologia: Publicacion Oficial de la Sociedad Espanola Nefrologia. 2016;36(6):660‐666. [DOI] [PubMed] [Google Scholar]
- 14. Sellares J, de Freitas DG, Mengel M, et al. Understanding the causes of kidney transplant failure: the dominant role of antibody‐mediated rejection and nonadherence. Am J Transplant. 2012;12(2):388‐399. [DOI] [PubMed] [Google Scholar]
- 15. Koo EH, Jang HR, Lee JE, et al. The impact of early and late acute rejection on graft survival in renal transplantation. Kidney Res Clin Pract. 2015;34(3):160‐164. [DOI] [PMC free article] [PubMed] [Google Scholar]
- 16. Krisl JC, Alloway RR, Shield AR, et al. Acute rejection clinically defined phenotypes correlate with long‐term renal allograft survival. Transplantation. 2015;99(10):2167‐2173. [DOI] [PubMed] [Google Scholar]
- 17. Kaplan B, Meier‐Kriesche HU. Death after graft loss: an important late study endpoint in kidney transplantation. Am J Transplant. 2002;2(10):970‐974. [DOI] [PubMed] [Google Scholar]
- 18. McCaughan JA, Patterson CC, Maxwell AP, et al. Factors influencing survival after kidney transplant failure. Transplant Res. 2014;3:18. [DOI] [PMC free article] [PubMed] [Google Scholar]
- 19. Peters B, Andersson Y, Stegmayr B, et al. A study of clinical complications and risk factors in 1001 native and transplant kidney biopsies in Sweden. Acta Radiol. 2014;55(7):890‐896. [DOI] [PubMed] [Google Scholar]
- 20. Solez K, Colvin RB, Racusen LC, et al. Banff 07 classification of renal allograft pathology: updates and future directions. Am J Transplant. 2008;8(4):753‐760. [DOI] [PubMed] [Google Scholar]
- 21. Levey AS, Stevens LA, Schmid CH, et al. A new equation to estimate glomerular filtration rate. Ann Intern Med. 2009;150(9):604‐612. [DOI] [PMC free article] [PubMed] [Google Scholar]
- 22. Naesens M, Kuypers DR, De Vusser K, et al. The histology of kidney transplant failure: a long‐term follow‐up study. Transplantation. 2014;98(4):427‐435. [DOI] [PubMed] [Google Scholar]
- 23. Nankivell BJ, Shingde M, Keung KL, et al. The causes, significance and consequences of inflammatory fibrosis in kidney transplantation: the Banff i‐IFTA lesion. Am J Transplant. 2018;18(2):364‐376. [DOI] [PubMed] [Google Scholar]
- 24. Roufosse C, Simmonds N, Clahsen‐van Groningen M, et al. A 2018 reference guide to the Banff classification of renal allograft pathology. Transplantation. 2018;102(11):1795‐1814. [DOI] [PMC free article] [PubMed] [Google Scholar]
- 25. Colvin RB. The renal allograft biopsy. Kidney Int. 1996;50(3):1069‐1082. [DOI] [PubMed] [Google Scholar]
- 26. Nankivell BJ, Kuypers DR. Diagnosis and prevention of chronic kidney allograft loss. Lancet. 2011;378(9800):1428‐1437. [DOI] [PubMed] [Google Scholar]
Associated Data
This section collects any data citations, data availability statements, or supplementary materials included in this article.
Supplementary Materials
Figure A (Supplementary material). Graft survival comparing glomerulonephritis versus other glomerular disease.
Table A (Supplementary material). Distribution of various histological findings according to type of biopsy. Supporting information.