

Summary
Secondary cell walls (SCWs) in stem xylem vessel and fibre cells enable plants to withstand the enormous compressive forces associated with upright growth. It remains unclear if xylem vessel and fibre cells can directly sense mechanical stimuli and modify their SCW during development.
We provide evidence that Arabidopsis SCW‐specific Fasciclin‐Like Arabinogalactan‐proteins 11 (FLA11) and 12 (FLA12) are possible cell surface sensors regulating SCW development in response to mechanical stimuli. Plants overexpressing FLA11 (OE‐FLA11) showed earlier SCW development compared to the wild‐type (WT) and altered SCW properties that phenocopy WT plants under compression stress. By contrast, OE‐FLA12 stems showed higher cellulose content compared to WT plants, similar to plants experiencing tensile stress.
fla11, OE‐FLA11, fla12, and OE‐FLA12 plants showed altered SCW responses to mechanical stress compared to the WT. Quantitative polymerase chain reaction (qPCR) and RNA‐seq analysis revealed the up‐regulation of genes and pathways involved in stress responses and SCW synthesis and regulation. Analysis of OE‐FLA11 nst1 nst3 plants suggests that FLA11 regulation of SCWs is reliant on classical transcriptional networks.
Our data support the involvement of FLA11 and FLA12 in SCW sensing complexes to fine‐tune both the initiation of SCW development and the balance of lignin and cellulose synthesis/deposition in SCWs during development and in response to mechanical stimuli.
Keywords: arabinogalactan‐protein (AGP), cell wall integrity (CWI), cellulose, Fasciclin‐Like AGP (FLA), lignin, mechanical stress, secondary cell wall (SCW)
Introduction
Secondary cell walls (SCWs) are deposited between the plasma membrane (PM) and primary cell walls (PCWs) following the cessation of cell expansion to increase mechanical strength and provide the ability to withstand significant compressive forces. Polysaccharides are the major components (c. two thirds of the mass) of SCWs of Arabidopsis, comprising largely cellulose and xylan, along with other minor components, including glycoproteins. Lignin (c. one third of the biomass), a complex comprised largely of phenylpropanoids, is also incorporated into most SCWs to provide waterproofing for the movement of water and solutes from the roots to aerial organs and provide additional strength. Secondary cell wall composition and structure can differ between cell types and species. For example, in Arabidopsis stems, interfascicular fibre (IF) cells have thicker walls with a lower lignin content and a higher syringyl : guaiacyl (S : G) lignin ratio than xylem vessel (XV) cells. Even in the same cell type, SCW composition and structures can change during growth and in response to (a)biotic stresses. Mechanical stresses such as bending and leaning can induce reaction wood formation in either the lower (in gymnosperms; compression wood) or upper (in angiosperms; tension wood) sides of the stem, which display altered wall structure and chemical composition compared to nonstressed wood walls (Mellerowicz & Gorshkova, 2012; Gardiner et al., 2014; Groover, 2016). In general, compression wood has lower cellulose content and higher lignin content, whereas tension wood has higher cellulose content and lower lignin content with a higher S : G ratio (Gardiner et al., 2014). The pathways leading to these changes in wood properties have fascinated plant biologists for decades.
The regulatory pathways controlling SCW initiation and assembly involve a transcription factor (TF) cascade that initiates changes in wall synthesis. In brief, in Arabidopsis, the NAM, ATAF1,2, and CUC2 (NAC) TFs, VASCULAR‐RELATED NAC‐DOMAIN 1–7 (VND), and NAC SECONDARY WALL THICKNENING PROMOTING FACTOR 1 and 3 (NST1 and SND1/NST3) are first tier master TFs. VNDs and NSTs regulate XV and IF wall thickening, respectively (Kubo et al., 2005; Zhong et al., 2006; Mitsuda et al., 2007; Nakano et al., 2015). R2R3‐MYB TFs, MYB46 and MYB83, are second tier master TFs that regulate SCW development (Zhong et al., 2007; McCarthy et al., 2009). MYB46 and MYB83 can either regulate downstream MYBs or directly regulate SCW synthesis genes (Nakano et al., 2015). Other regulators include epigenetic regulation, micro‐RNA, post‐transcriptional modifications, and environmental stimuli such as blue light and cold stress that can influence/interact with TFs to modulate SCW development (Zhang et al., 2018; McCahill & Hazen, 2019).
Plant cells have complex and precise cell wall integrity (CWI) sensing networks to facilitate cell wall modifications appropriate for growth and in response to environmental conditions. Several proteins are proposed to be involved in CWI in PCWs, including arabinogalactan‐proteins (AGPs), glycosylphosphatidylinositol (GPI)‐anchored proteins (GPI‐APs), DEFECTIVE KERNEL1 (DEK1), receptor‐like kinase (RLK) family members including Catharanthus roseus receptor‐like kinase (CrRLK1L), leucine‐rich repeat receptor kinases (LRR‐RLKs), L‐lectin RLKs, plant external response‐like kinases (PERKs), lysine‐motif containing receptor‐like kinases (LysM‐RLKs), and wall associated kinases/kinase‐likes (WAKs/WAKLs) (Roudier et al., 2002; Radutoiu et al., 2003; Bai et al., 2009; Bouwmeester & Govers, 2009; Ellis et al., 2010; Haswell et al., 2011; Wolf et al., 2012; Kohorn, 2016; Nissen et al., 2016; Smakowska‐Luzan et al., 2018). The identity of CWI sensors in SCWs is less clear. Arabidopsis SCW cellulose synthase mutant plants cesa4, cesa7, and cesa8 have enhanced resistance to the soil‐borne bacterium Plectosphaerella cucumerina and the necrotrophic fungus Ralstonia solanacearum, indicating that CWI pathways can regulate components of the SCW through CESAs (Hernandez‐Blanco et al., 2007). COBRA‐Like 4 and homologues in rice Brittle Culm 1 (BC1), which are both GPI‐APs predicted to be located at the outer surface of the PM, have been shown to interact with cellulose and can regulate microfibril angle (MFA) (Li et al., 2003; Liu et al., 2013). Vascular‐Related Receptor‐Like Kinase1 (AtVRLK1) has also been proposed to be a candidate sensor for the regulation of SCW development (Huang et al., 2018). AtVRLK1 encodes an LRR‐RLK that is specifically expressed in cells undergoing SCW development, and overexpression of AtVRLK1 showed reduced stem XV and IF wall thickness (Huang et al., 2018). Fasciclin‐Like Arabinogalactan‐proteins (FLAs) have been shown to be highly expressed during tension wood formation, and PtFLA6‐antisense plants showed defects in tension wood formation (Lafarguette et al., 2004; Wang et al., 2017). Increased gene expression in response to tension and the protein structure of FLAs indicates their possible role in sensing and transduction of signals during the early stages of tension wood formation. Precisely how these complex regulatory pathways fine‐tune SCW initiation and/or development is still not well understood.
Fasciclin‐Like Arabinogalactan‐proteins are a family of multi‐domain glycoproteins containing fasciclin 1 (FAS1)‐domains – which are related to immunoglobulin domains and are proposed to facilitate protein–protein interactions – and regions that direct the addition of large chains of arabinose and galactose‐containing sugars (arabinogalactans, AGs) to the protein backbone and could interact with wall carbohydrates and/or proteins. Many of these proteins also contain a glycosylphosphatidylinositol (GPI) membrane anchor, with which FLAs attach to the outer leaflet of the PM/wall interface (Bastiani et al., 1987; Elkins et al., 1990; Johnson et al., 2003; Tan et al., 2012; Yeats et al., 2018). Fasciclin‐Like Arabinogalactan‐proteins specific to SCWs have been identified and proposed to have roles regulating SCW development and biomechanical properties as inferred from co‐expression network analysis and mutant analyses (Persson et al., 2005; Dahiya et al., 2006; MacMillan et al., 2010, 2015; Wang et al., 2015, 2017). Overexpression of Eucalyptus FLA2 resulted in a reduction of cellulose microfibril angle (MFA) of 3° in the Eucalyptus xylem fibres, and the heterologous overexpression of Eucalyptus FLA3 in tobacco caused reduced flexural strength in the stem (MacMillan et al., 2015). Downregulation of PtFLA6 in Poplar stem caused repression of tension wood formation (Wang et al., 2017). In stems of Arabidopsis plants, both FLA11 and FLA12 showed high levels of expression in cells with SCWs; through studies of fla11 fla12 mutants, these genes have been shown to influence stem stiffness, cellulose content and microfibril angle (Persson et al., 2005; MacMillan et al., 2010). Arabidopsis fla11 fla12 double mutants showed reduced stem tensile strength and tensile modulus elasticity, as well as increased cellulose MFA (MacMillan et al., 2010). To date, the molecular mechanism(s) of FLA action in SCWs are largely unknown. Although FLAs are widely identified in almost all SCWs, especially in tension wood walls, fla11 fla12 mutants in Arabidopsis showed only weak phenotypes, and this fact, together with their low abundance in the wall and potential redundancy, due to the overlap of their roles with those of other FLAs, makes studies into the molecular mode(s) of action of FLAs challenging (Persson et al., 2005; MacMillan et al., 2010).
In this study, we show that FLA11 and FLA12 play roles in response to mechanical stress, including compression and tensile stress. Overexpression constructs of FLA11 and FLA12 driven by their endogenous promoters resulted in altered SCW development. Using a combination of microscopy, biochemistry, genetics and molecular biology, we show that OE‐FLA11 plants display earlier SCW development than WT plants, as well as increased SCW thickness, increased lignin content (with a lower S : G lignin ratio), reduced crystalline cellulose content, and changes in gene expression levels of SCW regulators and biosynthesis enzymes. Analysis of OE‐FLA11 nst1 nst3 plants suggests that FLA11 regulation of SCWs is reliant on classical transcriptional networks. FLA11 and FLA12 had different cellular and sub‐cellular locations, and OE‐FLA12 stems showed higher cellulose contents compared to WT plants. Our data suggests FLA11 and FLA12 are possible members of cell surface sensing complexes which regulate SCW development in response to different mechanical stimuli.
Materials and Methods
Plant materials, growth conditions and weight application
The fla11 mutant (SALK_046976) was obtained from the Arabidopsis Biological Resource Centre (Ohio State University), and fla12 mutants (SM.15162) (Tissier et al., 1999) were provided by Dr Colleen MacMillan, who ordered them from the Nottingham Arabidopsis Stock Centre (NASC). Plants were grown in controlled environment rooms under long‐day 16 h : 8 h, 22°C : 18°C, light : dark conditions. Developmental stages were measured according to the method described by Boyes et al. (2001). In brief, stage 6.0 plants had the first flower open at c. 4–5 wk post‐germination and a WT stem length of c. 5 cm. Stage 6.1 plants had six to eight flowers open at c. 5 wk old and a WT stem length of 12–15 cm. Stage 6.9 plants had 90% of flowers open at c. 6 wk old and a WT stem length of 30–35 cm.
For compression stress application to stage 6.0 plants, a 0.5 g lead sheet was applied to the second branch and the plants were kept upright using bamboo sticks for 2 d. For stage 6.1 plants, a 2.0 g lead sheet was applied to the first branch; two more 2.0 g lead sheets were added at the same position on the second and third days, and the plants were kept upright using bamboo sticks for 7 d. For stage 6.3 plants, a 5.0 g lead sheet was applied to the first branch for 7 d.
For tension stress application, a 2.0 g lead sheet was applied to stage 6.1 plants without the plant being kept upright.
Photographic images of the experimental set‐up for the modification of compression/tension stress are available in Supporting Information Fig. S1.
Vector construction and Agrobacterium transformation
A pGreenII0179 vector backbone (Hellens et al., 2000) was used for the construction of proFLA11::His‐YFP‐FLA11 and proFLA12::His‐YFP‐FLA12 vectors. The vectors include the octopine synthase (OCS) terminator after the FLA11 /FLA12 stop codon. The FLA11 (AT5G03170) coding sequence was amplified from Arabidopsis cDNA using primer pairs CAGGCGGAGGTGGGTCAcctaggCAGGCTCCAGCTCCAGGC and CATTAAAGCAGGACTCTAGATTATATCCACAGAGAAGAAGAAGCAG. proFLA11 was amplified from Arabidopsis gDNA using primers ACTATAGGGCGAATTGGGTACCcagcagcgtagatcttttgagtg and GAATGTTCTTGAAGTAGCCATGGtgttgtagttgttgtgtgtgtatgttg. The FLA12 (AT5G60490) coding sequence was amplified from Arabidopsis cDNA using primer pairs CAGGCGGAGGTGGGTCAcctaggCAGCCCTCTCCAGCCGTC and CATTAAAGCAGGACTCTAGATCACAAATAAAACCATGCGAGC. proFLA12 was amplified from Arabidopsis gDNA using primers ACTATAGGGCGAATTGGGTACCctcggaaaatagggcttttttg and GATGATGAGAGAATGTTCCATgggctctgttttcaagagtgttgatat. The promoter regions used for proFLA11 and proFLA12 are from the stop codon of the previous gene to the 5'UTR of FLA11/FLA12 (Dataset S1; MacMillan et al., 2010). The NEBuilder HiFi DNA Assembly Kit (New England Biolabs, Ipswich, MA, USA) was used to construct vectors according to the manufacturer’s instructions. All vectors were confirmed by sequencing and then transformed into Agrobacterium strain AGL1.
Arabidopsis plants (Col‐0) were transformed using the flower dip method (Clough & Bent, 1998). Plants were screened on ½ Murashige & Skoog (½MS) media plates with 1% sucrose and 35 mg l−1 hygromycin to identify those containing transgenes. The number of insertions and transgene copies (TC) were selected based on segregation ratios in the T2 generation. T2 and T3 plants were used for phenotyping analysis.
Quantitative polymerase chain reaction (qPCR)
RNA was extracted either from the top 2 cm of stem tissue at growth stage 6.0 or from whole stems at growth stage 9.0 using the RNeasy Kit (Qiagen). cDNA was synthesized using SuperScript IV Reverse Transcriptase (Invitrogen). Quantitative polymerase chain reaction analysis was conducted to measure the transcript levels of FLA11, FLA12, primary wall cellulose synthesis genes CESA1, CESA3, and CESA6, SCW cellulose synthesis genes CESA4, CESA7, and CESA8, xylan backbone synthesis genes IRX9, IRX10, and IRX14, lignin synthesis genes PAL1, PAL2, C4H, 4CL1, REF8, HCT, CCoAOMT1, CCR1, F5H1, COMT1, and CAD5, and SCW TFs NST1 and NST3, as outlined in Table S1. Transcript levels of each gene were assessed using a relative quantitative method (Livak & Schmittgen, 2001), with two or three biological replicates from two or three independent transformed lines, and three technical replicates in a QuantStudio 5 Real‐Time System with 384 wells (Thermo Fisher, Waltham, MA, USA) using PowerUp SYBR Green Master Mix (2X) Universal (A25742; Thermo Fisher) in 10 µl reactions. Transcript levels were normalized against housekeeping gene ACT2.
Quantification of plant stem growth kinematics, plant morphological analyses and stem bending test
Plant stem length was measured every 2 d to compare the kinematics of stem growth from stages 6.0 to 6.5 (Boyes et al., 2001). Arabidopsis main stems with a length of 2–3 cm were designated as ‘Day 1’ plants when stem growth occurred at a rate of greater than 1 cm d–1. At least six plants from three independent transgenic lines were quantified.
Primary root length, cotyledon area, rosette leaf radius, primary stem length, maximum branch radius, ratio of stem length to branch radius, branch angle, silique density, number of secondary stems, number of branches, silique length, and sepal length were measured for at least 10 plants from three independent transgenic lines.
To test the stem stiffness, plants with similar stem length were placed at an angle of 45° from horizontal. A 0.5 g steel ball was placed in the middle position of the stem to show bending angles.
Three‐point flexural tests were carried out using an Instron 4500 Universal Testing System (Series IX automated materials testing system; Instron, Norwood, MA, USA) as described by MacMillan et al. (2010).
Histological analysis
For histological analysis, samples of hand‐sectioned, fresh stems were stained with either Toluidine blue O, phloroglucinol‐HCL, or Mäule stain to visualise the cell walls, according to the methods outlined by Mitra & Loque (2014), with an Olympus BX53 microscope (Shinjuku, Tokyo, Japan) under bright field. At least three plant stems from three independent transformed lines were sectioned and measured for tissue organisation analyses.
For analysis of primary roots and pistils, phloroglucinol‐HCL staining was used. After staining, images were acquired with an Olympus BX53 microscope under bright field. At least three plants from three independent transgenic lines were sectioned and stained, with one representative image shown (Fig. S3).
A Zeiss LSM 780 laser scanning confocal microscope (Oberkochen, Germany) was used to detect lignin in fresh stem sections at growth stage 6.0 under ultraviolet (UV) light (excitation 405 nm, emission 440 nm, detection 404–476 nm). Yellow fluorescent protein (YFP) signals were detected in fresh stem sections using the Zeiss LSM 780 laser scanning confocal microscope (excitation 514 nm, emission 550 nm, detection 525–574 nm; LIMS Bio‐imaging platform, La Trobe University). At least three plants from three independent transgenic lines were imaged, with one representative image shown (Figs 1, 4).
Fig. 1.

Comparison of FLA11 and FLA12 tissue and sub‐cellular locations in Arabidopsis stems. (a–f) Yellow fluorescent protein (YFP) fluorescence signals in wild‐type (WT) proFLA11::HIS‐YFP‐FLA11 (a–c) and WT proFLA12::HIS‐YFP‐FLA12 (d–f) young stem transverse sections (5 cm below stem top of stage 6.3 plants); the strongest signal for YFP‐FLA11 was observed in the xylem vessel (XV) cell walls, whereas the strongest signal for YFP‐FLA12 was observed in the interfascicular fibre (IF) cell walls. (g–l) Yellow fluorescent protein fluorescence signals in WT proFLA11::YFP‐FLA11 (g–i) and WT proFLA12::YFP‐FLA12 (j–l) mature stem transverse sections (9 cm below stem top of stage 6.3 plants); both FLA11 and FLA12 were highly expressed in xylem vessel (XV) and interfascicular fibre (IF) cell walls. (m) Prediction of major transcription factors regulating FLA11 and FLA12 expression (see Supporting Information Dataset S2). (n–p) Sub‐cellular location of FLA11 and FLA12 in the base region of IF cells. Transmission‐election microscopy (TEM) immunolabelling detection of HIS tagged FLA11 and FLA12 in ultrathin, transverse sections at 1 cm from the stem base at stage 6.9 (Boyes et al., 2001) of IF cells from WT proFLA11::HIS‐YFP‐FLA11 (o) and WT proFLA12::HIS‐YFP‐FLA12 (p). FLA11 signals were found mostly in the SCWs of IF cell. HIS‐FLA12 was found at the interface between the plasma membrane (PM) and secondary cell wall (SCW) in OE‐FLA12. Arrows indicate gold particles. No signals were found in WT stems (n). Cyto, cytoplasm; ML, middle lamella; S1 and S2 are SCW layers. Bars: (a–l) 50 µm; (n–p) 500 nm.
Fig. 4.

OE‐FLA11 plants show earlier initiation of secondary cell walls (SCWs). Transverse sections taken at 2 cm from the top (red arrow) of stage 6.0 (Boyes et al., 2001) Arabidopsis wild‐type (WT) (a–d) and OE‐FLA11 2TC (two transgene copies) (e–h) stems visualised using bright field (b, f), yellow fluorescent protein (YFP) excitation (c, g), and ultraviolet (UV) light excitation (d, h). OE‐FLA11 2TC plants showed YFP signals, which indicated YFP‐FLA11 proteins in xylem (Xy) and interfascicular fibre (IF) cells. OE‐FLA11 2TC plant stems showed UV autofluorescence in Xy and IF cells, indicating the presence of phenolics (likely lignin) in SCWs. Pi, pith. Bars: (a, e) 2 cm; (b–d, f–h) 100 µm.
Transmission‐electron microscopy (TEM) and immunolabelling
Samples of a 2 mm region at the base of stems at growth stages 6.1 and 6.9 were chemically fixed, dehydrated, and embedded in LR white resin according to the method outlined by Wilson & Bacic (2012). Thin sections (c. 80 nm) were acquired for antibody labelling and post‐stained (Wilson & Bacic, 2012). For antibody labelling, samples were incubated with anti‐6x‐His tag monoclonal antibody (MA1‐21315; Invitrogen) with 1 : 100 dilutions for 1 h at room temperature, then overnight at 4°C. Samples were then washed and incubated with goat anti‐mouse 18 nm gold conjugated secondary antibody (115‐215‐166; Jackson ImmunoResearch, West Grove, PA, USA) with 1 : 20 dilutions for 1 h at room temperature. Detection of ultrastructure, and HIS‐YFP‐FLA11 and HIS‐YFP‐FLA12 subcellular location was performed for two biological replicates from two independent transformed lines. Grids were imaged using a JEOL (Tokyo, Japan) 2100 transmission‐electron microscope equipped with a Gatan (Pleasanton, CA, USA) Orius SC 200 charged‐coupled device (CCD) camera.
Fibre length and wall thickness analyses
To measure stem fibre length, Arabidopsis base stems (lower 2 cm length stem) were incubated with glacial acetic acid and hydrogen peroxide (1 : 1 v/v) for 12 h at 80°C (Wang et al., 2019). Fibres were stained with Gram’s safranin solution and imaged under bright field using an Olympus BX53 microscope. Each measurement contained c. 200 fibre cells from two plants from two independent transformed lines.
For measurement of IF wall thickness, TEM images were used. Primary IF cell layers that were close to the pith were used for quantification, with two biological repeats from two independent transformed lines.
Measurement of crystalline cellulose and lignin content and composition
Arabidopsis stems were harvested and alcohol insoluble reagent (AIR) was prepared (Pettolino et al., 2012). The Updegraff method was used for measurement of crystalline cellulose content (Updegraff, 1969). The acetyl bromide method, as described by Chang et al. (2008), was used to detect lignin content. Three biological replicates from three independent transformed lines were measured. Lignin monomer composition was estimated by thioacidolysis as described previously (Robinson & Mansfield, 2009). Three biological replicates from three independent transformed lines were measured.
Cell wall carbohydrate linkage analysis
De‐starched AIR samples prepared from stage 6.1 base stems (lower third of total stem) were carboxyl reduced and methylated for linkage analysis according to the method outlined by Pettolino et al. (2012). The resulting permethylated alditol acetates were separated and quantified by gas chromatography mass spectrometry (GC‐MS) as described by Pettolino et al. (2012). Polysaccharide composition was deduced from the linkage analyses. Three biological replicates from three independent transformed lines were measured.
Bioinformatics
The top 2 cm region of stem, just below the inflorescence of growth stage 6.0 plants were used for RNA‐seq analysis with three biological replicates each. Total RNA was extracted using the RNeasy Kit (Qiagen) according to the manufacturer’s instructions. mRNA libraries were prepared using True‐seq stranded mRNA preparation kits, and RNA sequencing was processed at the Australian Genome Research Facility (AGRF; Melbourne, Australia) with 2 × 150 bp paired end sequencing. Raw data were trimmed with Trimmomatic v.0.39 to remove adaptors (Bolger et al., 2014). Star (Dobin et al., 2013) was used for mapping data, with the genome index generated using the Arabidopsis genome sequence and GTF annotation files downloaded from EnsemblePlants (http://plants.ensembl.org/). HTSeq (Anders et al., 2015) was used for read counting. Rstudio (https://www.rstudio.com/) with the DESeq2 package (Love et al., 2014) was used to identify differentially expressed genes (DEGs) with a fold change > 2, P‐value < 0.05 and OE‐FLA11 (in up‐regulated DEGs) or WT (in down‐regulated DEGs) read counts > 100. An online Protein Analysis Through Evolutionary Relationships (PANTHER) overrepresentation test was used to obtain gene ontology (GO) biological process, sub‐cellular component, and KEGG (Kyoto Encyclopedia of Genes and Genomes) pathway predictions for DEG analysis (http://go.pantherdb.org/). Fisher’s Exact test was used, with the Bonferroni correction for multiple testing. The Arabidopsis reference list was used, which was obtained from The Arabidopsis Internet Resource (TAIR) (https://www.arabidopsis.org/tools/go_term_enrichment.jsp). Co‐expression networks of up‐regulated DEGs in OE‐FLA11 vs WT were analysed online using STRING (https://string‐db.org/). The STRING network edge indicates both functional and physical protein associations sourced from a combination of text‐mining, experiments, databases, co‐expression, neighborhood, gene fusion and co‐occurrence with medium confidence (0.4).
The online tool PlantRegMap was used to predict FLA11 and FLA12 promoter binding TFs (Tian et al., 2020).
Results
FLA11 and FLA12 have different expression profiles and sub‐cellular locations
Fasciclin‐Like Arabinogalactan‐proteins are highly expressed in tension wood cells of both Populus and hemp, suggesting that they have roles in regulating SCW development in response to mechanical stress (Wang et al., 2017; Petrova et al., 2021). In Arabidopsis, FLA11 and FLA12 are the most highly expressed FLAs in stem cells associated with SCWs; however, their roles in the response to mechanical stress remain unclear. Subtle differences in FLA11 and FLA12 expression profiles were revealed in young stems (MacMillan et al., 2010) and phylogenetic analysis showed that FLA11 and FLA12 fall into distinct clades (Shafee et al., 2020), suggesting they may have some independent function(s). To further investigate FLA11 and FLA12 expression profiles and protein location(s) in stems during development proFLA11::HIS‐YFP‐FLA11 and proFLA12::HIS‐YFP‐FLA12 vectors were constructed and transformed into WT plants. Visualisation of YFP signals in transverse sections of young stems (5 cm below stem top) of stage 6.3 plants (Boyes et al., 2001) showed strong fluorescent signals corresponding to HIS‐YFP‐FLA11 in XV cells, whereas the HIS‐YFP‐FLA12 signal was strongest in interfascicular fibre (IF) cells (Fig. 1a–f). This subtle difference is not obvious in relatively mature stems (9 cm below stem top) as both proFLA11::HIS‐YFP‐FLA11 and proFLA12::HIS‐YFP‐FLA12 showed strong signals in XV and IF regions (Fig. 1g–l). These results confirmed that the subtle differences of expression profile between FLA11 and FLA12 observed previously in promoter::GUS studies correlate to differences in protein levels (MacMillan et al., 2010). Analysis of proFLA11 and proFLA12 predicts both contain regions for binding SCW‐related MYBs; however, proFLA12 also contains regions that can be targeted by other TFs, including DNA‐binding with one finger (DOF) and TFs involved in the regulation of flowering (Fig. 1m). The sub‐cellular locations of FLAs/AGPs are proposed to be important for their functions and had not been determined for FLA11 or FLA12. FLA11 and FLA12 have similar predicted protein domain organisations; however, subtle differences in their sequences have been identified (Shafee et al., 2020). Immuno‐gold labelling was used to detect the HIS‐tag on FLA11 and FLA12 in ultrathin transverse sections taken from the base region of stems of plants at growth stage 6.9, when IF cells are still actively depositing SCWs (Smith et al., 2013). In HIS‐YFP‐FLA11 lines, immuno‐gold labelling was detected both at the PM–wall (SCW) interface and in the SCWs of IF cells, with the strongest signal observed in SCWs (Fig. 1o). Interestingly, in HIS‐YFP‐FLA12 lines the strongest signal was observed at the PM–SCW interface (Fig. 1p). The differences in expression profiles and sub‐cellular protein location led us to compare the biological functions of FLA11 and FLA12 individually.
FLA11 can modulate stem properties for stiffer stems
It remains unclear if FLA11 and FLA12 play direct roles in response to mechanical stress. To determine SCW changes associated with additional compression stress, weight was applied to WT stems at different stages of development (see Fig. S1 for photos illustrating the experimental set‐up). We observed that application of weight to young WT stems at growth stage 6.0 (Boyes et al., 2001) can trigger the earlier initiation of SCW development in IF cells and results in XVs with reduced diameters (Fig. 2a–l). Application of weight to stage 6.1 WT plants increased IF wall thickness (Fig. 2m–p) and caused an increase of stem wall lignin content and reduction of cellulose (Fig. S1). Weight application occasionally caused lodging and bending of stems, causing tensile stress, and cell wall analyses showed no changes in lignin content, and increased cellulose content (Fig. S1). Application of weight to stage 6.3 WT plants did not show obvious changes to either xylem or IF cellular structures, whereas phloem fibre (PhF) development was induced (Fig. 2q–t). Although plants were kept upright during weight application, a slight curvature was difficult to avoid, which may have triggered other responses such as gravitropism. This led us to generate transgenic plants and investigate stem development without additional weight application.
Fig. 2.

Mechanical compression stress influences stem secondary cell wall development and composition. (a–l) Development of stage 6.0 wild‐type (WT) Arabidopsis plant stems without (−) (a–f) or with (+) (g–l) weight application. Stem transverse sections stained with either Toluidine blue (a–c, g–i) or phloroglucinol‐HCL (d–f, j–l) showed that weight treatment can trigger the earlier thickening of interfascicular fibre (IF) secondary walls (arrows) and results in xylem vessels (XVs) with reduced diameters (asterisks) compared to WT plants without treatment. (m–p) Application of weight to stage 6.1 WT plant stems (o–p) results in thicker IF walls (arrows) compared to nontreated plants (m–n). (q–t) Application of weight to stage 6.3 WT plant stems (s–t) induced development of additional phloem fibres (PhF), as indicated by circles, compared to WT plants without treatment (q–r). Bar, 20 µm.
FLA11 overexpression (WT proFLA11::HIS‐YFP‐FLA11) and FLA12 overexpression (WT proFLA12::HIS‐YFP‐FLA12) plants were used to investigate whether FLA11 and FLA12 play roles during stem growth as the weight of the organ increases. Compression stress responses in the WT indicate that if FLA11 and FLA12 are involved, plants overexpressing FLA11 or FLA12 would be more sensitive to gravity and show SCW changes, including earlier initiation of SCW development, thicker IF walls, and changes in lignin and/or cellulose content (Fig. 2). Quantitative polymerase chain reaction experiments confirmed that FLA11 transcript levels in in young stems (growth stage 6.0; Boyes et al., 2001) of OE‐FLA11 were 15‐fold higher in plants with one transgene copy (1TC) and 65‐fold higher in plants with two transgene copies (2TC), relative to WT levels (Fig. 3a). FLA12 transcript levels in stems of OE‐FLA12 plants with two transgene copies were shown to be increased 8‐fold (Fig. 3c).
Fig. 3.

OE‐FLA11 plants show stiffer stems. (a) Quantitative polymerase chain reaction (qPCR) analysis of FLA11 transcript levels in stems at growth stage 6.0 of Arabidopsis wild‐type (WT) and OE‐FLA11 transgenic plants shows increased expression in OE‐FLA11 1TC (one transgene copy) and 2TC (two transgene copies) plants. (b) Phenotypes of mature plants at growth stage 6.9 (Boyes et al., 2001) show reduced stem length and altered branching in OE‐FLA11 transgenic plants with either 1TC or 2TC compared to WT. (c) Quantitative polymerase chain reaction analysis of FLA12 transcript levels in stems at growth stage 6.0 of WT and OE‐FLA12 transgenic plants shows increased levels of FLA12 in OE‐FLA12 2TC plants. (d) No obvious morphological difference was observed between OE‐FLA12 and WT plants. (e) Stem growth kinematic analysis shows slower growth rates in OE‐FLA11 plants in a dose‐dependent manner. (f) Application of a 0.5 g steel ball to WT and OE‐FLA11 mid stems, showing the different stiffness of stems in OE‐FLA11 and WT plants, as visualised by a lower degree of bending (red triangle) (see also Supporting Information Videos S1, S2). (g) OE‐FLA11 1TC plant matured dry base stems show lower flexural stiffness than WT plants and similar flexural strength. Bar, 10 cm. Data shown are average values ± SD (n ≥ 3 plants from three independent transformed lines). Asterisks indicate a significant difference compared to WT plants according to Student’s t‐test (*, P < 0.05).
A clear semi‐dwarf/dwarf phenotype was observed in OE‐FLA11 mature plants from > 10 independent insertion lines (Fig. 3b) compared to WT. No obvious differences from WT were seen in OE‐FLA12 lines (Fig. 3d). Reduction in stem length in OE‐FLA11 was correlated with increased expression of FLA11, suggesting a dosage dependent effect (Fig. 3a,b). Quantification of the kinematics of stem growth from stages 6.0 to 6.5 (Boyes et al., 2001) showed that the shorter stem length of OE‐FLA11 plants results from reduced elongation and slower growth rates (Fig. 3e ). Phenotyping analysis of overall growth showed the size of other organs, including rosette leaf, flower, and silique, was also reduced, whereas the number of secondary stems and branches increased (Fig. S2; Table S2). Stem bending tests indicated different stem mechanical properties in OE‐FLA11 plants compared to WT (Fig. 3f; Videos S1, S2). Three‐point bending tests of matured dry base stems showed that OE‐FLA11 1TC stems have lower flexural stiffness than WT plants and similar flexural strength (Fig. 3g).
Secondary cell wall development is altered in OE‐FLA11
Transverse sections of young stems (stage 6.0) taken at a position 2 cm from the top of the stem showed earlier initiation of stem SCW development in OE‐FLA11 plants than WT plants (Fig. 4). Phenolics, including polymeric lignin, present in SCWs will autofluorescence upon exposure to UV light. In young WT stems, little to no autofluorescence signal was detected in either metaxylem or IF precursor cells (Fig. 4d). By contrast, strong autofluorescence signals were observed in OE‐FLA11 2TC plants, in both xylem and IF fibre tissues (Fig. 4h). As the OE‐FLA11 construct contained a YFP reporter, the tissue localisation of FLA11 was investigated. Yellow fluorescent protein signals were present in XV and IF cells (Fig. 4g). The UV and YFP signals in OE‐FLA11 plants suggest SCW synthesis occurs prematurely compared to WT plants, similar to compression stress studies of WT plants, without any apparent changes to either XV or IF cell fate. Early SCW development was also observed in other organs, including primary roots and flower pistil vascular tissues in OE‐FLA11 plants, compared to WT plants (Fig. S3).
Given the severity of the OE‐FLA11 2TC phenotypes we chose to further investigate SCW structure and composition in OE‐FLA11 1TC lines that had a milder phenotype and a longer stem length, enabling a more direct comparison between mutant and WT at developmentally equivalent growth stages. Histological analyses of transverse sections of the stem (growth stages 6.1 and 6.9) were investigated for cellular differences. Fresh stem sections of WT and OE‐FLA11 1TC plants were stained with Toluidine blue O, which stains cells with lignified SCWs, such as XVs and IFs, blue and nonlignified PCWs pink/purple. Stage 6.1 base stems of OE‐FLA11 1TC have thicker IF walls than WT (Fig. S4). Stage 6.9 base stems of OE‐FLA11 1TC have more IF cell layers than WT and IF cambial cells are still dividing (compare Figs 5c and 5f; Table S3). An absence of SCWs in the phloem fibre cells was also observed in OE‐FLA11 1TC stems compared to WT, suggesting that XV and IF walls provide substantial mechanical support to the plant without the need to develop phloem fibres (compare Figs 5b and 5e). Transverse stem sections imaged by TEM confirmed the increased IF wall thickness (Fig. 5g–j) of 40% in OE‐FLA11 compared to WT (Fig. 5k). Interfascicular fibre walls in WT show the expected three layers, S1, S2 and S3, in their SCWs (Fig. 5h), whereas OE‐FLA11 1TC base stem IF walls displayed multiple inner layers leading to the highly thickened walls, which is likely to assist stems in maintaining integrity during compression stress (Fig. 5j). Interfascicular fibre length was found to be reduced in OE‐FLA11 1TC stems compared to WT at growth stage 6.9 (Fig. 5l).
Fig. 5.

FLA11 regulates stem fibre development. Toluidine blue O‐stained transverse sections, taken 1 cm from the base of stems of Arabidopsis wild‐type (WT) (a–c) and OE‐FLA11 1TC (one transgene copy) (d–f) plants at growth stage 6.9 (Boyes et al., 2001), show increased stem diameter in OE‐FLA11 1TC compared to WT. Images of vascular tissues showed that phloem fibre (PhF) cells had secondary cell walls (SCWs) in WT stems (b) but not OE‐FLA11 1TC stems (e). Higher‐magnification images of interfascicular fibre (IF) tissues showed more layers of IF from secondary growth (sIF) and the existence of IF cambial (IFC) cells in OE‐FLA11 1TC stems (f) compared to WT (c). (g–j) Transverse stem sections imaged by transmission‐electron microscopy (TEM) showed increased thickness of SCWs in IF of OE‐FLA11 1TC base stems (i, j) compared to WT (g, h). SCWs in IF of WT (h) have three discernible layers, S1, S2, and S3, whereas OE‐FLA11 1TC IFs showed multiple internal layers (ILs) (j). (k) IF wall thickness, quantified from stage 6.9 base stems. (l) IF length, quantified from base stems at growth stage 6.9. Data shown are average values ± SD (n = 2 plants from two independent transformed lines). Asterisks indicate a significant difference compared to WT plants according to Student’s t‐test (*, P < 0.05). Co, cortex; Ep, epidermis; Ph, phloem; Xy, xylem. Bars: (a, d) 100 µm; (b, c, e, f) 20 µm; (g, i) 5 µm; (h, j) 1 µm.
To investigate potential wall composition differences, measurement of crystalline cellulose and lignin content was undertaken. Increased lignin content (c. 37% (w/w)) and, interestingly, an 18% decrease in crystalline cellulose content was found in OE‐FLA11 1TC stems, relative to WT (Fig. 6g), similar to changes observed in response to compression stress (Fig. S1). Linkage analysis of AIR showed no significant changes in either the relative monosaccharide or polysaccharide composition of stem cell walls (Fig. S5; Table S4), although a trend towards reduced cellulose was detected. Transverse sections at the base of stage 6.9 fresh stems were stained with phloroglucinol‐HCL, which stains lignin a fuchsia colour (Mitra & Loque, 2014). A darker red colour was seen in IF walls of OE‐FLA11 1TC stems than in IF cells in the WT, suggesting increased lignin content in these SCWs (Fig. 6a–f). No obvious differences in phloroglucinol‐HCL staining in XV walls of OE‐FLA11 and WT was observed. As lignin composition is an important factor that affects SCW stiffness, Mäule staining, which stains S lignin units red, was used to investigate lignin composition (Mitra & Loque, 2014). A bright red colour is seen in IFs from WT plants using Mäule stain, indicating higher S lignin content compared to the brownish colour observed in XVs that contains more G units (compare Figs 6i and 6j). Mäule staining of OE‐FLA11 1TC shows SCWs with brown colouration in both XVs and IFs, indicating a lower S : G lignin ratio in OE‐FLA11 1TC walls than WT (compare Figs 6m and 6j). Mäule staining of stage 9.7 stems also showed a lower S : G lignin ratio in OE‐FLA11 1TC walls than WT (Fig. S6) and thioacidolysis of base stems (lower one third of total stem) at stage 9.7 showed a significant decrease in S : G ratio in OE‐FLA11 1TC walls compared to WT walls (Fig. 6n). These data indicate that FLA11 regulates both SCW wall lignin content and composition in stems.
Fig. 6.

OE‐FLA11 stems show lower crystalline cellulose but higher lignin content with a lower lignin S : G ratio. (a–f) Phloroglucinol‐HCL staining of transverse sections at 1 cm from the Arabidopsis wild‐type (WT) and OE‐FLA11 1TC (one transgene copy) stem base of stage 6.9 plants showed lignin in xylem vessel (XV) and interfascicular fibre (IF) cell walls. (g) Measurement of crystalline cellulose and lignin content in base stems (lower third of total stem) of WT and OE‐FLA11 1TC shows increased lignin content in stems at growth stage 6.9, whereas crystalline cellulose decreased. Data shown are average values ± SD (n = 3 plants from three independent transformed lines). Asterisks indicate a significant difference according to Student’s t‐test (*, P < 0.05). (h–m) Mäule staining of stems from WT (h–j) and OE‐FLA11 1TC (k–m) plants showed higher S‐lignin units (red colour) in WT IF secondary cell walls (j) compared to OE‐FLA11 1TC (m). (n) Thioacidolysis of lignin monomer content in base stems (lower third length of total stem) of WT and OE‐FLA11 1TC plants shows a decreased S : G lignin ratio in stems at stage 9.7 (Boyes et al., 2001) (n = 3 plants from three independent transformed lines). Asterisks indicate a significant difference according to Student’s t‐test (*, P < 0.05). ML, middle lamella; PW, primary wall. Bars: (a, d, h, k) 50 µm; (b, c, e, f, i, j, l, m) 10 µm.
In summary, our results show that the introduction of proFLA11::His‐YFP‐FLA11 into WT plants caused an increase in FLA11 expression, which triggered the early development of fibre and xylem SCWs in stems, primary roots, and flowers. The OE‐FLA11 plant stems are stiffer, with thicker IF walls and increased lignin and a lower S : G ratio.
FLA11 and FLA12 regulate stem secondary cell wall properties in response to mechanical stress
OE‐FLA11 plants appear to phenocopy WT plants under compression stress, whereas OE‐FLA12 plants showed no clear phenotypes. We further investigated the effects of compression stress on stem development and SCW composition of OE‐FLA11, OE‐FLA12, fla11 and fla12 mutant plants compared to WT plants. Compression stress to WT plants caused a c. 22% increase in lignin and a c. 25% decrease in crystalline cellulose content in stems, compared to nonstressed plants (Table 1; Fig. S2). Weight application did not result in changes in wall composition of OE‐FLA11 stems (Table 1). This suggests OE‐FLA11 is insensitive to the additional compression stress, and this is likely due to OE‐FLA11 stems already having stiffer stems with increased lignin and decreased cellulose content. Application of compression stress to fla11 mutant stems caused a moderate increase in lignin content (c. 9%) and a c. 22% decrease in cellulose content (Table 1), suggesting the mutant is less sensitive to compression stress.
Table 1.
Measurement of lignin and cellulose content in Arabidopsis wild‐type (WT), OE‐FLA11, fla11, OE‐FLA12 and fla12 plant stems, with or without weight application. 1
| Content (%) | WT | WT+ | OE‐FLA11 | OE‐FLA11+ | fla11 | fla11+ | OE‐FLA12 | OE‐FLA12+ | fla12 | fla12+ |
|---|---|---|---|---|---|---|---|---|---|---|
| Lignin | 15.6 ± 1.6 | 19.0 ± 3.8 | 21.1 ± 2.5 | 21.5 ± 4.1 | 16.7 ± 1.7 | 18.2 ± 1.0 | 17.7 ± 0.8 | 18.4 ± 2.5 | 20.9 ± 1.4 | 17.3 ± 1.0 |
| Cellulose | 47.8 ± 1.4 | 35.7 ± 1.7 | 40.9 ± 3.6 | 41.1 ± 4.6 | 41.0 ± 9.5 | 31.8 ± 5.2 | 53.6 ± 0.3 | 45.9 ± 4.5 | 44.9 ± 7.2 | 46.6 ± 5.7 |
Weight application of 6 g. ‘+’ indicates plants with weight application. Data shown are average values ± SD. N ≥ 3. Bold text indicates significant difference compared to plants with no weight applied, according to Student’s t‐test (P < 0.05).
We further investigated lignin and cellulose changes in OE‐FLA12 and fla12 mutant plant stems in response to compression stress. Additional weight applied to OE‐FLA12 stems led to a c. 14% decrease in cellulose content with no change in lignin content (Table 1). Interestingly, the cellulose content of OE‐FLA12 without compression stress was significantly increased compared to WT (Table 1; Fig. S1). A decrease in lignin content with no obvious changes in cellulose content was observed in fla12 mutant stems under compression stress (Table 1). Together, the analysis of cellulose and lignin content in OE‐FLA12 and fla12 mutant stems suggests that FLA12 has a role in regulating either cellulose synthesis or deposition. Analyses of OE‐FLA12 and fla12 mutant plants under compression stress did not support a role of FLA12 in regulating lignin synthesis under compression stress.
FLA11 regulation of secondary cell walls is reliant upon classical transcriptional networks
Our data support a role for FLA11 in regulating SCW development in response to compression stress. To investigate genes and pathways regulated by FLA11, RNA was extracted from the top 2 cm of stems (stage 6.0) from WT and OE‐FLA11 2TC plants. OE‐FLA11 2TC plants were used, as their stronger phenotypes compared to 1TC plants would assist in identifying the maximum differences from WT. Young stem tissue was chosen to minimise pleiotropic effects as 2TC plants did not appear to be under stress during these young stages and had more similar stem length to WT. RNA‐seq analysis showed over 1000 up‐regulated DEGs and c. 500 down‐regulated DEGs in OE‐FLA11 2TC compared to WT (Dataset S2; Table S5). The biological pathways with the highest fold change in up‐regulated DEGs were glucuronoxylan biosynthesis, plant‐type SCW biogenesis, regulation of SCW biogenesis, lignin biosynthesis, and systemic acquired resistance (Fig. 7a). The majority of SCW regulation master TFs (including VNDs/NSTs and MYBs), cellulose, xylan, and lignin synthesis genes were significantly up‐regulated in OE‐FLA11 compared to WT (Table S6). The biological pathways with the highest fold change in down‐regulated DEGs were DNA replication checkpoint, DNA replication initiation, stomatal complex development, ribosomal large subunit biogenesis, and ribosomal small subunit biogenesis (Fig. S7). Co‐expression network analysis of the top 500 up‐regulated DEGs showed two major clusters of genes: SCW synthesis and stress response (Fig. 7d), and this finding is consistent with the analysis of sub‐cellular component distribution (Fig. 7b) and predicted KEGG pathways (Fig. 7c).
Fig. 7.

RNA‐seq and quantitative polymerase chain reaction (qPCR) analysis of differentially expressed genes (DEGs) in OE‐FLA11 2TC (two transgene copies) young stems compared to wild‐type (WT) plants. The top 2 cm of stems of stage 6.0 (Boyes et al., 2001) Arabidopsis WT and OE‐FLA11 2TC plants were used for RNA‐seq and qPCR analysis. (a–c) Analysis of DEGs between OE‐FLA11 2TC and WT shows that a number of gene ontology (GO) biological processes (a), GO sub‐cellular components (b) and Kyoto Encyclopedia of Genes and Genomes (KEGG) pathways (c) are enriched in OE‐FLA11 2TC compared to WT. (d) Co‐expression network analysis of up‐regulated DEGs in OE‐FLA11 2TC young stems compared to WT. The top 500 ranked up‐regulated DEGs in OE‐FLA11 2TC stems (see Dataset S2) were used for co‐expression analysis using the online tool STRING. Four major gene clusters were manually selected based on GO biological processes, including genes involved in secondary cell wall (SCW) synthesis and regulation (yellow), lignin metabolic and phenylpropanoid metabolism (green), response to chitin and bacterium (red) and immune response (blue) and were further clustered as ‘SCW development’ and ‘Stress response’ based on their common biological functions. (e) Quantitative polymerase chain reaction analysis showed that relative expression levels of primary wall cellulose synthases CESA1, CESA3, and CESA6 are less changed/unchanged in young stems of OE‐FLA11 2TC compared to WT, whereas the expression levels of SCW cellulose synthase genes CESA4, CESA7 and CESA8, and xylan synthesis genes IRX9, IRX10 and IRX14 are increased. (f) Relative expression levels of genes involved in lignin biosynthesis are increased in OE‐FLA11 2TC stems compared to WT. Data shown are average values ± SD (n = 3 biological replicates from three independent transformed lines). Asterisks indicate a significant difference according to Student’s t‐test (*, P < 0.05).
Quantitative polymerase chain reaction analysis was used to confirm gene expression changes predicted by RNA‐seq. The expression of cellulose synthases (CESAs) and enzymes involved in the biosynthesis of xylan and monolignols were investigated (Brown et al., 2005, 2007; Persson et al., 2005; Barros et al., 2015). Transcript levels of the primary wall CESA1, CESA3 and CESA6 genes were either increased up to 2‐fold or unaltered, whereas the SCW CESA4 and CESA7 genes were up‐regulated 21‐fold and CESA8 was up‐regulated 7‐fold in OE‐FLA11 2TC plants compared to WT (Fig. 7e). Transcript levels of xylan backbone synthesis genes IRX9, IRX10, and IRX14, and genes encoding enzymes for monolignol synthesis, were also significantly increased in OE‐FLA11 2TC plants (Fig. 7e,f). Compared with the 5–8 times higher expression levels of monolignol biosynthesis genes PAL1, PAL2, C4H, and 4CL1, which catalyse phenylalanine metabolism to p‐coumaroyl CoA – a shared pathway for the synthesis of all lignin units – the relative expression level of F5H1 that is necessary for S‐lignin unit synthesis was lower: only c. 1.5 times higher than WT levels (Fig. 7f). This expression pattern is consistent with the reduced S : G lignin ratio in OE‐FLA11 plants (Fig. 6).
RNA‐seq and qPCR results support a role for FLA11 in regulating SCW development, possibly through the modulation of transcription regulatory networks, either at transcriptional or post‐transcriptional levels. To investigate whether FLA11 regulation pathways relied on the SCW NAC‐MYB transcription regulatory networks, OE‐FLA11 2TC was crossed with a nst1 nst3 double mutant to generate OE‐FLA11 2TC nst1 nst3 plants. NST1 and NST3 are first‐tier TFs that regulate IF SCW initiation and development, and mutants show lodging stem phenotypes with no SCWs in stem IF cells (Zhong et al., 2006; Mitsuda et al., 2007). It should be noted that NST1 and NST3 do not regulate SCW development in xylem vessels, and these SCWs can still be observed in nst1 nst3 mutants (Fig. 8e). Quantitative polymerase chain reaction analysis of mature plant stems confirmed the decrease in transcript levels of NST1 and NST3 in both the nst1 nst3 double mutant and OE‐FLA11 2TC nst1 nst3 plants compared to WT (Fig. 8a). Investigation of FLA11 transcripts showed increased levels in OE‐FLA11 2TC (as expected) and decreased levels in nst1 nst3 plant stems compared to WT (Fig. 8a). The 2‐fold increase of FLA11 expression levels in OE‐FLA11 stems compared to WT is lower than the 15–60‐fold increase in stage 6.0 plant stems (Fig. 3a), likely a consequence of little SCW development occurring in mature stems. FLA11 transcript levels in OE‐FLA11 2TC nst1 nst3 plants were c. 40% of those in WT plants, which could be due to increased levels in xylem vessels (Fig. 8a). As previously reported (Mitsuda et al., 2007), the nst1 nst3 double mutant displays a lodging stem phenotype and stem fibre cells lack SCWs, both in the xylem fibres and IF tissues. OE‐FLA11 2TC nst1 nst3 plants exhibited the reduced stem length phenotype observed for the OE‐FLA11 2TC plants; however, the stem also showed a lodging phenotype similar to the nst1 nst3 double mutant (Fig. 8b). Transverse sections of the base of the stem showed that OE‐FLA11 2TC nst1 nst3 plant stems did not have SCWs in their xylem fibres or IF cells, similar to the nst1 nst3 double mutant (Fig. 8c–j), and this is proposed to lead to the lodging phenotype (Mitsuda et al., 2007). This result indicates that OE‐FLA11 regulation of IF walls and stem stiffness phenotypes are largely reliant upon NST1 and NST3 regulated IF SCW development. OE‐FLA11 regulation of stem length appears to be independent of NST1 and NST3, and is likely a result of xylem vessel SCW pathways.
Fig. 8.
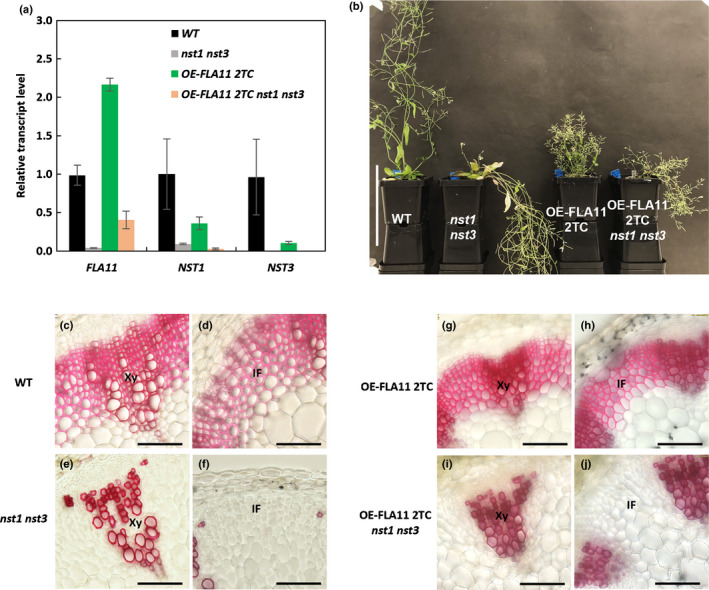
FLA11 regulation of stem fibre development is reliant upon NST1 and NST3. (a) Quantitative polymerase chain reaction (qPCR) analysis of FLA11, NST1, and NST3 transcript levels in stems of Arabidopsis wild‐type (WT), nst1 nst3, OE‐FLA11 2TC (two transgene copies) and OE‐FLA11 2TC nst1 nst3 plants at growth stage 6.9 (Boyes et al., 2001). Expression levels are relative to ACT2. Data shown are average values ± SD (n = 2 biological replicates from two independent crossed lines). (b) Morphological phenotypes of WT, nst1 nst3, OE‐FLA11 2TC, and OE‐FLA11 2TC nst1 nst3 plants at growth stage 6.9. The nst1 nst3 plant shows a lodging phenotype compared to the WT. The OE‐FLA11 2TC plant shows a reduced stem length phenotype compared to the WT. The OE‐FLA11 2TC nst1 nst3 plant shows both reduced stem length and lodging phenotypes compared to the WT. (c–j) Histological analyses of transverse sections at 1 cm from the stem base of WT (c–d), nst1 nst3 (e–f), OE‐FLA11 2TC and OE‐FLA11 2TC nst1 nst3 (i–j) plants stained with phloroglucinol‐HCL. Neither nst1 nst3 nor OE‐FLA11 2TC nst1 nst3 plant stems show lignified secondary cell walls (SCWs) in interfascicular fibre (IF) cells. Xy, xylem. Bars: (b) 10 cm; (c–j) 50 µm.
Discussion
Initiation of SCW development is regulated by complex transcriptional networks to optimise mechanical integrity during plant growth and development. How XV and IF cells precisely control their timing of SCW initiation and termination during development and in response to stress remains unclear. A number of studies have identified regulators of the SCW TF network that link changes in SCWs to environmental signals. For example, blue light signals have been found to regulate SCW development via regulation of NST1 activation (Zhang et al., 2018). The abscisic acid (ABA) signalling pathway has been shown to regulate SCW development via regulation of NST1 phosphorylation (Liu et al., 2021). These research studies supports a model in which SCW development is regulated by integrating both developmental and environmental signals as well as pathways sensing mechanical stimuli at the cell surface (Fig. 9). Our data support the role of FLA11 and FLA12 in fine‐tuning both the initiation of SCW development and synthesis of SCW component polymers in response to mechanical stress. FLA11 and FLA12 potentially act as cell surface sensors; however, we cannot exclude the possibility that FLA11 and FLA12 may be working directly as ligands to activate receptors or as transducers to regulate ligand–receptor interactions. FAS1‐domain containing proteins in mammals can act through different mechanisms depending on the context. For example, the FAS1 containing protein periostin can interact with extracellular matrix proteins and regulate collagen cross‐linking during fibrillogenesis (Kudo & Kii, 2018), whereas during allergic itch reactions, periostin directly interacts with integrin receptors to mediate cell adhesion (Mishra et al., 2020). More direct biochemical evidence would be needed to determine what specific roles FLA11 and FLA12 are playing and how these may differ depending on the tissue/developmental context.
Fig. 9.
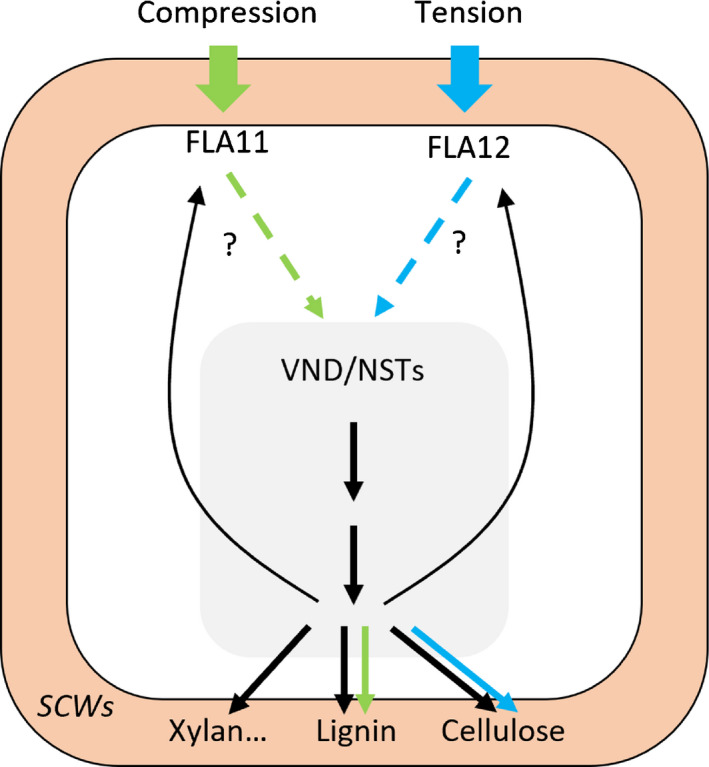
Working model of FLA11 and FLA12 regulation of secondary cell wall (SCW) development in response to mechanical stress. Initiation and development of SCWs are regulated by plant developmental signals which activate SCW master transcription factors (TFs). The SCW master TFs (VNDs/NSTs) activate SCW synthesis (black arrows) including polysaccharides, lignin (mostly G lignin and S lignin), and glycoproteins, including FLA11 and FLA12. The timing of SCW development can be regulated by mechanical compression and tension, which cause deformation of the plasma membrane (PM)/cell wall and trigger downstream signalling pathways. It is proposed that FLA11 and FLA12 function in cell wall integrity (CWI) sensing complexes that initiate signalling in response to compression and tensile stress, respectively. Activated FLA11 and FLA12 can modulate SCW TFs via unknown mechanisms that possibly include post‐translational modifications and modify SCW synthesis, resulting in slightly different outcomes: FLA11 pathways mostly enhance lignin synthesis, especially G lignin synthesis, whereas FLA12 mostly enhances cellulose synthesis. Dashed arrows indicate unknown pathways, solid arrows indicate known pathways.
Overexpressing FLA11 driven by its native promoter indicated that FLA11 is likely to function during SCW development to modulate expression/activity of TFs and enzymes involved in SCW biosynthesis to maintain stem integrity during growth as compression forces increase. The SCW TFs can also regulate FLA11 expression (Li et al., 2016), likely forming a feedback loop for the regulation of SCW development in response to mechanical stress. Based on the results in this study, we propose that FLA11 regulation of IF SCWs is dependent on the NST1 and NST3 pathways. A reduced stem length phenotype was still observed in OE‐FLA11 2TC nst1 nst3 plants, and it would be interesting to genetically test the relationship between FLA11 and VNDs in xylem vessels to determine if they act in the same pathway; however, this remains challenging because plants lacking xylem vessels are seedling lethal (McCarthy et al., 2009). Distinct expression profiles and biological roles for FLA11 and FLA12 were identified, with FLA11 regulating lignin composition and content and FLA12 regulating cellulose content, possibly in response to tensile stress. This study is the first confirmation of distinct roles and sub‐cellular locations for FLA11 and FLA12 and uncovers a previously unknown function of FLAs in lignin regulation.
Fasciclin‐Like Arabinogalactan‐proteins have been widely reported to show high levels of expression during tension wood formation, in which internal G‐layers are deposited that contain low levels of lignin (Joseleau et al., 2004; Bygdell et al., 2017; Wang et al., 2017). Here, we found that overexpressing FLA11 results in increased lignin content with altered composition, showing reduced S lignin content, typical of compression wood walls (Gardiner et al., 2014). Although OE‐FLA11 plants had shorter stem lengths, which would potentially reduce plant body weight and the compression stress to stems, OE‐FLA11 stems had more SCWs than WT, indicating a greater response of OE‐FLA11 plants to compression stress. In addition, weight application to OE‐FLA11 stems did not lead to more lignin in stems, suggesting that OE‐FLA11 plants are ‘insensitive’ to additional stress, likely because the plants are already acting as if under mechanical stress and are ‘saturated’ by these stress signals. Crystalline cellulose and lignin are two of the three major components of SCWs in most plant stem fibres. Crystalline cellulose makes a major contribution to wall tensile strength and lignin can increase wall rigidity and compressive strength (Doblin et al., 2010). The relative content of both crystalline cellulose and lignin are tightly regulated and coordinated (Gardiner et al., 2014). Variability in cellulose and lignin composition can be influenced by stresses (i.e. bending induced wall lignification in compression wood cells) to ensure appropriate wall biomechanical properties for plant growth and development (Groover, 2016). The correlation of FLA11 expression levels with lignin content/composition as well as transcriptional pathways associated with stress support a model in which FLA11 acts as part of a SCW sensor cluster to modulate wall properties and stem growth in response to compression stress. The correlation of FLA12 with cellulose synthesis suggests a role of FLA12 in regulating SCW development in response to tensile stress. What remains unclear are the features that functionally distinguish these two FLAs and the signalling pathways leading to transcriptional and SCW synthesis changes. Fasciclin‐Like Arabinogalactan‐proteins have been implicated in signalling pathways due to their cell surface locations and possible interactions with both cell wall (Tan et al., 2013) and receptor like kinases (RLKs); for example, it has been suggested that FLA4 (SOS5) functions with two LRR‐RLKs FEI1/FEI2 to regulate root development under salt stress (Shi et al., 2003; Xu et al., 2008; Harpaz‐Saad et al., 2011; Xue et al., 2017). Fasciclin‐Like Arabinogalactan‐proteins have been identified in complexes (McBride et al., 2017), and identification of the interacting proteins of FLA11/12 will help to improve our understanding of the signalling pathways that regulate SCW development in response to mechanical stimuli.
Both FLA11 and FLA12 sequences predict similar protein domain organisations, with an N‐terminal signal peptide, two AG‐glycan motifs flanking a single FAS1 domain, and a GPI‐anchor at the C‐terminal (Johnson et al., 2003). However, the protein sequence alignment showed < 50% similarity between FLA11 and FLA12, and bioinformatic analysis showed that FLA11 and FLA12 fall into different clades, indicating that FLA11 and FLA12 may have both independent and overlapping functions (Shafee et al., 2020). Comparison of FLA11 and FLA12 YFP signals in stems showed that FLA11 accumulated to slightly higher levels in xylem, whereas FLA12 accumulated to slightly higher levels in IFs in young stems (Fig. 1). The subtle differences between FLA11 and FLA12, in terms of both tissue locations and biological functions, support a model in which plants modulate the biomechanical properties of their SCW in different cells of the vasculature by regulating FLA11/FLA12 expression levels. The difference in sub‐cellular locations between FLA11 and FLA12 is potentially influenced by GPI‐anchor features/cleavage. How this might be regulated is yet to be determined and is an interesting avenue for future research, as GPI‐anchors have been shown to influence cell wall sensing via RLKs; for example, the RLK FERONIA location and activity is regulated by LORELEI and LORELEI‐like GPI‐anchored protein (Li et al., 2015; Liu et al., 2016). It would also be interesting to investigate FLA11 and FLA12 sub‐cellular locations in other cell types and at different developmental stages. Cells that have accumulated more FLA11 at the cell surface, such as stem XVs, were shown to initiate early SCW development and with a higher G lignin content than cells that have accumulated more FLA12, such as IFs. The changes observed in OE‐FLA11 stem stiffness, of growing and mature dried stems, open up possibilities for further exploration of the exact nature of FLA11 expression level on stem stiffness in actively growing stems and mature dried stems. Understanding the mechanism(s) by which plants fine‐tune both the regulation of the initiation of development of SCW and lignin and cellulose composition/content by manipulating FLAs will be a fascinating area of future study and will improve our ability to generate ‘designer’ wood for different applications.
Author contributions
YM, KLJ and AB designed the research; CPM provided the original vectors and plant lines, performed the three‐point bending test and discussed the research strategy and results with YM, KLJ and AB; YM and PH performed the polysaccharide analysis; YM and JR performed the TEM imaging; LdV and SDM performed the lignin monomer analyses; YM performed other experiments, analysed data and made the figures; YM, KLJ and AB wrote the manuscript with critical input from the other authors.
Supporting information
Dataset S1 proFLA11 and proFLA12 sequences and predicted major transcription factors regulating FLA11 and FLA12 expression.
Dataset S2 List of differentially expressed genes (DEGs).
Fig. S1 Mechanical stress influences stem secondary wall composition.
Fig. S2 Morphological analyses of wild‐type (WT) and OE‐FLA11 plants.
Fig. S3 Early development of xylem in root and pistil of OE‐FLA11 plants compared to WT plants.
Fig. S4 Histological analyses of transverse sections at 1 cm from the stem base of WT and OE‐FLA11 1TC plants at growth stage 6.1.
Fig. S5 Monosaccharide and polysaccharide composition of WT and OE‐FLA11 1TC stage 6.1 base stems.
Fig. S6 Mäule staining of WT and OE‐FLA11 1TC base stems from stage 9.7 plants.
Fig. S7 RNA‐seq analysis of down‐regulated DEGs in OE‐FLA11 2TC young stems, compared to WT plants.
Table S1 List of primers used for quantitative polymerase chain reaction (qPCR) experiments.
Table S2 Quantification of WT and OE‐FLA11 plant morphological features.
Table S3 Measurement of tissue organisation in WT and OE‐FLA11 base stems at growth stages 6.1 and 6.9.
Table S4 Polysaccharide composition derived from linkage analysis.
Table S5 List of top 50 up‐regulated differentially expressed genes (DEGs) in OE‐FLA11 stems, compared to WT plants.
Table S6 List of up‐regulated differentially expressed genes (DEGs) involved in SCW synthesis in OE‐FLA11 stems, compared to WT plants.
Video S1 OE‐FLA11 2TC plant (right) stems are stiffer than those of WT plants (left).
Video S2 OE‐FLA11 1TC plant (left) stems are stiffer than those of WT plants (right).
Please note: Wiley Blackwell are not responsible for the content or functionality of any Supporting Information supplied by the authors. Any queries (other than missing material) should be directed to the New Phytologist Central Office.
Acknowledgements
We acknowledge valuable discussions with Edgar Liu, Yihua Zhou (Chinese Academy of Sciences), Baocai Zhang (Chinese Academy of Sciences), Monika Doblin (La Trobe University), and Wei Zeng (Zhejiang Agriculture and Forestry University) during the project and sharing methods. We acknowledge the technical assistance of Matthew Welling (La Trobe University) for interpretation of RNA‐seq data and the support of the La Trobe University BioImaging platform. We acknowledge Zbigniew Stachurksi (ANU Engineering) for Instron access. YM acknowledges the support of a University of Melbourne Research Scholarship and the Albert Shimmins Fund for a writing‐up award. This work was supported by a grant from the Australia Research Council to the ARC Centre of Excellence in Plant Cell Walls (CE1101007) to AB and KLJ. KLJ was supported by a La Trobe Research Focus Area grant (no. 2000004372). AB and KLJ would like to acknowledge a start‐up grant from La Trobe University and also from Zhejiang A&F University for the Sino‐Australia Plant Cell Wall Research Centre. The authors declare no conflicts of interest.
Data availability
All data are available in the main text or the Supporting Information.
References
- Anders S, Pyl PT, Huber W. 2015. HTSeq–a Python framework to work with high‐throughput sequencing data. Bioinformatics 31: 166–169. [DOI] [PMC free article] [PubMed] [Google Scholar]
- Bai L, Zhang G, Zhou Y, Zhang Z, Wang W, Du Y, Wu Z, Song CP. 2009. Plasma membrane‐associated proline‐rich extensin‐like receptor kinase 4, a novel regulator of Ca signalling, is required for abscisic acid responses in Arabidopsis thaliana . The Plant Journal 60: 314–327. [DOI] [PubMed] [Google Scholar]
- Barros J, Serk H, Granlund I, Pesquet E. 2015. The cell biology of lignification in higher plants. Annals of Botany 115: 1053–1074. [DOI] [PMC free article] [PubMed] [Google Scholar]
- Bastiani MJ, Harrelson AL, Snow PM, Goodman CS. 1987. Expression of fasciclin I and II glycoproteins on subsets of axon pathways during neuronal development in the grasshopper. Cell 48: 745–755. [DOI] [PubMed] [Google Scholar]
- Bolger AM, Lohse M, Usadel B. 2014. Trimmomatic: a flexible trimmer for Illumina sequence data. Bioinformatics 30: 2114–2120. [DOI] [PMC free article] [PubMed] [Google Scholar]
- Bouwmeester K, Govers F. 2009. Arabidopsis L‐type lectin receptor kinases: phylogeny, classification, and expression profiles. Journal of Experimental Botany 60: 4383–4396. [DOI] [PubMed] [Google Scholar]
- Boyes DC, Zayed AM, Ascenzi R, McCaskill AJ, Hoffman NE, Davis KR, Görlach J. 2001. Growth stage‐based phenotypic analysis of Arabidopsis: a model for high throughput functional genomics in plants. Plant Cell 13: 1499–1510. [DOI] [PMC free article] [PubMed] [Google Scholar]
- Brown DM, Goubet F, Wong VW, Goodacre R, Stephens E, Dupree P, Turner SR. 2007. Comparison of five xylan synthesis mutants reveals new insight into the mechanisms of xylan synthesis. The Plant Journal 52: 1154–1168. [DOI] [PubMed] [Google Scholar]
- Brown DM, Zeef LA, Ellis J, Goodacre R, Turner SR. 2005. Identification of novel genes in Arabidopsis involved in secondary cell wall formation using expression profiling and reverse genetics. Plant Cell 17: 2281–2295. [DOI] [PMC free article] [PubMed] [Google Scholar]
- Bygdell J, Srivastava V, Obudulu O, Srivastava MK, Nilsson R, Sundberg B, Trygg J, Mellerowicz EJ, Wingsle G. 2017. Protein expression in tension wood formation monitored at high tissue resolution in Populus . Journal of Experimental Botany 68: 3405–3417. [DOI] [PMC free article] [PubMed] [Google Scholar]
- Chang XF, Chandra R, Berleth T, Beatson RP. 2008. Rapid, microscale, acetyl bromide‐based method for high‐throughput determination of lignin content in Arabidopsis thaliana . Journal of Agricultural and Food Chemistry 56: 6825–6834. [DOI] [PubMed] [Google Scholar]
- Clough SJ, Bent AF. 1998. Floral dip: a simplified method for Agrobacterium‐mediated transformation of Arabidopsis thaliana . The Plant Journal 16: 735–743. [DOI] [PubMed] [Google Scholar]
- Dahiya P, Findlay K, Roberts K, McCann MC. 2006. A fasciclin‐domain containing gene, ZeFLA11, is expressed exclusively in xylem elements that have reticulate wall thickenings in the stem vascular system of Zinnia elegans cv Envy. Planta 223: 1281–1291. [DOI] [PubMed] [Google Scholar]
- Dobin A, Davis CA, Schlesinger F, Drenkow J, Zaleski C, Jha S, Batut P, Chaisson M, Gingeras TR. 2013. Star: ultrafast universal RNA‐seq aligner. Bioinformatics 29: 15–21. [DOI] [PMC free article] [PubMed] [Google Scholar]
- Doblin MS, Pettolino F, Bacic A. 2010. Plant cell walls: the skeleton of the plant world. Functional Plant Biology 37: 357–381. [Google Scholar]
- Elkins T, Hortsch M, Bieber AJ, Snow PM, Goodman CS. 1990. Drosophila fasciclin I is a novel homophilic adhesion molecule that along with fasciclin III can mediate cell sorting. The Journal of Cell Biology 110: 1825–1832. [DOI] [PMC free article] [PubMed] [Google Scholar]
- Ellis M, Egelund J, Schultz CJ, Bacic A. 2010. Arabinogalactan‐proteins: key regulators at the cell surface? Plant Physiology 153: 403–419. [DOI] [PMC free article] [PubMed] [Google Scholar]
- Gardiner B, Barnett J, Saranpää P, Gril J. 2014. The biology of reaction wood. Springer Series in Wood Science. Heidelberg, Germany: Springer. [Google Scholar]
- Groover A. 2016. Gravitropisms and reaction woods of forest trees – evolution, functions and mechanisms. New Phytologist 211: 790–802. [DOI] [PubMed] [Google Scholar]
- Harpaz‐Saad S, McFarlane HE, Xu S, Divi UK, Forward B, Western TL, Kieber JJ. 2011. Cellulose synthesis via the FEI2 RLK/SOS5 pathway and cellulose synthase 5 is required for the structure of seed coat mucilage in Arabidopsis . The Plant Journal 68: 941–953. [DOI] [PubMed] [Google Scholar]
- Haswell ES, Phillips R, Rees DC. 2011. Mechanosensitive channels: what can they do and how do they do it? Structure 19: 1356–1369. [DOI] [PMC free article] [PubMed] [Google Scholar]
- Hellens RP, Edwards EA, Leyland NR, Bean S, Mullineaux PM. 2000. pGreen: a versatile and flexible binary Ti vector for Agrobacterium‐mediated plant transformation. Plant Molecular Biology 42: 819–832. [DOI] [PubMed] [Google Scholar]
- Hernandez‐Blanco C, Feng DX, Hu J, Sanchez‐Vallet A, Deslandes L, Llorente F, Berrocal‐Lobo M, Keller H, Barlet X, Sanchez‐Rodriguez C et al. 2007. Impairment of cellulose synthases required for Arabidopsis secondary cell wall formation enhances disease resistance. Plant Cell 19: 890–903. [DOI] [PMC free article] [PubMed] [Google Scholar]
- Huang C, Zhang R, Gui J, Zhong Y, Li L. 2018. The receptor‐like kinase AtVRLK1 regulates secondary cell wall thickening. Plant Physiology 177: 671–683. [DOI] [PMC free article] [PubMed] [Google Scholar]
- Johnson KL, Jones BJ, Bacic A, Schultz CJ. 2003. The fasciclin‐like arabinogalactan proteins of Arabidopsis. A multigene family of putative cell adhesion molecules. Plant Physiology 133: 1911–1925. [DOI] [PMC free article] [PubMed] [Google Scholar]
- Joseleau JP, Imai T, Kuroda K, Ruel K. 2004. Detection in situ and characterization of lignin in the G‐layer of tension wood fibres of Populus deltoides . Planta 219: 338–345. [DOI] [PubMed] [Google Scholar]
- Kohorn BD. 2016. Cell wall‐associated kinases and pectin perception. Journal of Experimental Botany 67: 489–494. [DOI] [PubMed] [Google Scholar]
- Kubo M, Udagawa M, Nishikubo N, Horiguchi G, Yamaguchi M, Ito J, Mimura T, Fukuda H, Demura T. 2005. Transcription switches for protoxylem and metaxylem vessel formation. Genes & Development 19: 1855–1860. [DOI] [PMC free article] [PubMed] [Google Scholar]
- Kudo A, Kii I. 2018. Periostin function in communication with extracellular matrices. Journal of Cell Communication and Signaling 12: 301–308. [DOI] [PMC free article] [PubMed] [Google Scholar]
- Lafarguette F, Leplé J‐C, Déjardin A, Laurans F, Costa G, Lesage‐Descauses M‐C, Pilate G. 2004. Poplar genes encoding fasciclin‐like arabinogalactan proteins are highly expressed in tension wood. New Phytologist 164: 107–121. [DOI] [PubMed] [Google Scholar]
- Li C, Yeh FL, Cheung AY, Duan Q, Kita D, Liu MC, Maman J, Luu EJ, Wu BW, Gates L et al. 2015. Glycosylphosphatidylinositol‐anchored proteins as chaperones and co‐receptors for FERONIA receptor kinase signaling in Arabidopsis . eLife 4: e06587. [DOI] [PMC free article] [PubMed] [Google Scholar]
- Li Y, Qian Q, Zhou Y, Yan M, Sun L, Zhang M, Fu Z, Wang Y, Han B, Pang X et al. 2003. BRITTLE CULM1, which encodes a COBRA‐like protein, affects the mechanical properties of rice plants. Plant Cell 15: 2020–2031. [DOI] [PMC free article] [PubMed] [Google Scholar]
- Li Z, Omranian N, Neumetzler L, Wang T, Herter T, Usadel B, Demura T, Giavalisco P, Nikoloski Z, Persson S. 2016. A transcriptional and metabolic framework for secondary wall formation in Arabidopsis . Plant Physiology 172: 1334–1351. [DOI] [PMC free article] [PubMed] [Google Scholar]
- Liu C, Yu H, Rao X, Li L, Dixon RA. 2021. Abscisic acid regulates secondary cell‐wall formation and lignin deposition in Arabidopsis thaliana through phosphorylation of NST1. Proceedings of the National Academy of Sciences, USA 118: e2010911118. [DOI] [PMC free article] [PubMed] [Google Scholar]
- Liu L, Shang‐Guan K, Zhang B, Liu X, Yan M, Zhang L, Shi Y, Zhang M, Qian Q, Li J et al. 2013. Brittle Culm1, a COBRA‐like protein, functions in cellulose assembly through binding cellulose microfibrils. PLoS Genetics 9: e1003704. [DOI] [PMC free article] [PubMed] [Google Scholar]
- Liu X, Castro C, Wang Y, Noble J, Ponvert N, Bundy M, Hoel C, Shpak E, Palanivelu R. 2016. The role of LORELEI in pollen tube reception at the interface of the Synergid cell and pollen tube requires the modified eight‐cysteine motif and the receptor‐like kinase FERONIA. Plant Cell 28: 1035–1052. [DOI] [PMC free article] [PubMed] [Google Scholar]
- Livak KJ, Schmittgen TD. 2001. Analysis of relative gene expression data using real‐time quantitative PCR and the 2(‐Delta Delta C(T)) Method. Methods 25: 402–408. [DOI] [PubMed] [Google Scholar]
- Love MI, Huber W, Anders S. 2014. Moderated estimation of fold change and dispersion for RNA‐seq data with DESeq2. Genome Biology 15: 550. [DOI] [PMC free article] [PubMed] [Google Scholar]
- MacMillan CP, Mansfield SD, Stachurski ZH, Evans R, Southerton SG. 2010. Fasciclin‐like arabinogalactan proteins: specialization for stem biomechanics and cell wall architecture in Arabidopsis and Eucalyptus . The Plant Journal 62: 689–703. [DOI] [PubMed] [Google Scholar]
- MacMillan CP, Taylor L, Bi Y, Southerton SG, Evans R, Spokevicius A. 2015. The fasciclin‐like arabinogalactan protein family of Eucalyptus grandis contains members that impact wood biology and biomechanics. New Phytologist 206: 1314–1327. [DOI] [PubMed] [Google Scholar]
- McBride Z, Chen D, Reick C, Xie J, Szymanski DB. 2017. Global analysis of membrane‐associated protein oligomerization using protein correlation profiling. Molecular & Cellular Proteomics 16: 1972–1989. [DOI] [PMC free article] [PubMed] [Google Scholar]
- McCahill IW, Hazen SP. 2019. Regulation of cell wall thickening by a Medley of mechanisms. Trends in Plant Science 24: 853–866. [DOI] [PubMed] [Google Scholar]
- McCarthy RL, Zhong R, Ye ZH. 2009. MYB83 is a direct target of SND1 and acts redundantly with MYB46 in the regulation of secondary cell wall biosynthesis in Arabidopsis . Plant and Cell Physiology 50: 1950–1964. [DOI] [PubMed] [Google Scholar]
- Mellerowicz EJ, Gorshkova TA. 2012. Tensional stress generation in gelatinous fibres: a review and possible mechanism based on cell‐wall structure and composition. Journal of Experimental Botany 63: 551–565. [DOI] [PubMed] [Google Scholar]
- Mishra SK, Wheeler JJ, Pitake S, Ding H, Jiang C, Fukuyama T, Paps JS, Ralph P, Coyne J, Parkington M et al. 2020. Periostin activation of integrin receptors on sensory neurons induces allergic itch. Cell Reports 31: 107472. [DOI] [PMC free article] [PubMed] [Google Scholar]
- Mitra P, Loque D. 2014. Histochemical staining of Arabidopsis thaliana secondary cell wall elements. Journal of Visualized Experiments: JoVE 87: e51381. [DOI] [PMC free article] [PubMed] [Google Scholar]
- Mitsuda N, Iwase A, Yamamoto H, Yoshida M, Seki M, Shinozaki K, Ohme‐Takagi M. 2007. NAC transcription factors, NST1 and NST3, are key regulators of the formation of secondary walls in woody tissues of Arabidopsis. Plant Cell 19: 270–280. [DOI] [PMC free article] [PubMed] [Google Scholar]
- Nakano Y, Yamaguchi M, Endo H, Rejab NA, Ohtani M. 2015. NAC‐MYB‐based transcriptional regulation of secondary cell wall biosynthesis in land plants. Frontiers in Plant Science 6: 288. [DOI] [PMC free article] [PubMed] [Google Scholar]
- Nissen KS, Willats WG, Malinovsky FG. 2016. Understanding CrRLK1L function: cell walls and growth control. Trends in Plant Science 21: 516–527. [DOI] [PubMed] [Google Scholar]
- Persson S, Wei H, Milne J, Page GP, Somerville CR. 2005. Identification of genes required for cellulose synthesis by regression analysis of public microarray data sets. Proceedings of the National Academy of Sciences, USA 102: 8633–8638. [DOI] [PMC free article] [PubMed] [Google Scholar]
- Petrova A, Kozlova L, Gorshkov O, Nazipova A, Ageeva M, Gorshkova T. 2021. Cell wall layer induced in xylem fibers of flax upon gravistimulation is similar to constitutively formed cell walls of bast fibers. Frontiers in Plant Science 12: 660375. [DOI] [PMC free article] [PubMed] [Google Scholar]
- Pettolino FA, Walsh C, Fincher GB, Bacic A. 2012. Determining the polysaccharide composition of plant cell walls. Nature Protocols 7: 1590–1607. [DOI] [PubMed] [Google Scholar]
- Radutoiu S, Madsen LH, Madsen EB, Felle HH, Umehara Y, Grønlund M, Sato S, Nakamura Y, Tabata S, Sandal N et al. 2003. Plant recognition of symbiotic bacteria requires two LysM receptor‐like kinases. Nature 425: 585. [DOI] [PubMed] [Google Scholar]
- Robinson AR, Mansfield SD. 2009. Rapid analysis of poplar lignin monomer composition by a streamlined thioacidolysis procedure and near‐infrared reflectance‐based prediction modeling. The Plant Journal 58: 706–714. [DOI] [PubMed] [Google Scholar]
- Roudier F, Schindelman G, DeSalle R, Benfey PN. 2002. The COBRA family of putative GPI‐anchored proteins in Arabidopsis. A new fellowship in expansion. Plant Physiology 130: 538–548. [DOI] [PMC free article] [PubMed] [Google Scholar]
- Shafee T, Bacic A, Johnson K. 2020. Evolution of sequence‐diverse disordered regions in a protein family: order within the chaos. Molecular Biology and Evolution 37: 2155–2172. [DOI] [PubMed] [Google Scholar]
- Shi H, Kim Y, Guo Y, Stevenson B, Zhu JK. 2003. The Arabidopsis SOS5 locus encodes a putative cell surface adhesion protein and is required for normal cell expansion. Plant Cell 15: 19–32. [DOI] [PMC free article] [PubMed] [Google Scholar]
- Smakowska‐Luzan E, Mott GA, Parys K, Stegmann M, Howton TC, Layeghifard M, Neuhold J, Lehner A, Kong J, Grünwald K et al. 2018. An extracellular network of Arabidopsis leucine‐rich repeat receptor kinases. Nature 553: 342–346. [DOI] [PMC free article] [PubMed] [Google Scholar]
- Smith RA, Schuetz M, Roach M, Mansfield SD, Ellis B, Samuels L. 2013. Neighboring parenchyma cells contribute to Arabidopsis xylem lignification, while lignification of interfascicular fibers is cell autonomous. Plant Cell 25: 3988–3999. [DOI] [PMC free article] [PubMed] [Google Scholar]
- Tan L, Eberhard S, Pattathil S, Warder C, Glushka J, Yuan C, Hao Z, Zhu X, Avci U, Miller JS et al. 2013. An Arabidopsis cell wall proteoglycan consists of pectin and arabinoxylan covalently linked to an arabinogalactan protein. Plant Cell 25: 270–287. [DOI] [PMC free article] [PubMed] [Google Scholar]
- Tan L, Showalter AM, Egelund J, Hernandez‐Sanchez A, Doblin MS, Bacic A. 2012. Arabinogalactan‐proteins and the research challenges for these enigmatic plant cell surface proteoglycans. Frontiers in Plant Science 3: 140. [DOI] [PMC free article] [PubMed] [Google Scholar]
- Tian F, Yang DC, Meng YQ, Jin J, Gao G. 2020. PlantRegMap: charting functional regulatory maps in plants. Nucleic Acids Research 48: D1104–D1113. [DOI] [PMC free article] [PubMed] [Google Scholar]
- Tissier AF, Marillonnet S, Klimyuk V, Patel K, Torres MA, Murphy G, Jones JD. 1999. Multiple independent defective suppressor‐mutator transposon insertions in Arabidopsis: a tool for functional genomics. Plant Cell 11: 1841–1852. [DOI] [PMC free article] [PubMed] [Google Scholar]
- Updegraff DM. 1969. Semimicro determination of cellulose inbiological materials. Analytical Biochemistry 32: 420–424. [DOI] [PubMed] [Google Scholar]
- Wang H, Jiang C, Wang C, Yang Y, Yang L, Gao X, Zhang H. 2015. Antisense expression of the fasciclin‐like arabinogalactan protein FLA6 gene in Populus inhibits expression of its homologous genes and alters stem biomechanics and cell wall composition in transgenic trees. Journal of Experimental Botany 66: 1291–1302. [DOI] [PMC free article] [PubMed] [Google Scholar]
- Wang H, Jin Y, Wang C, Li B, Jiang C, Sun Z, Zhang Z, Kong F, Zhang H. 2017. Fasciclin‐like arabinogalactan proteins, PtFLAs, play important roles in GA‐mediated tension wood formation in Populus . Scientific Reports 7: 6182. [DOI] [PMC free article] [PubMed] [Google Scholar]
- Wang S, Yang H, Mei J, Liu X, Wen Z, Zhang L, Xu Z, Zhang B, Zhou Y. 2019. Rice homeobox protein KNAT7 integrates the pathways regulating cell expansion and wall stiffness. Plant Physiology 181: 669–682. [DOI] [PMC free article] [PubMed] [Google Scholar]
- Wilson SM, Bacic A. 2012. Preparation of plant cells for transmission electron microscopy to optimize immunogold labeling of carbohydrate and protein epitopes. Nature Protocols 7: 1716–1727. [DOI] [PubMed] [Google Scholar]
- Wolf S, Hematy K, Hofte H. 2012. Growth control and cell wall signaling in plants. Annual Review of Plant Biology 63: 381–407. [DOI] [PubMed] [Google Scholar]
- Xu SL, Rahman A, Baskin TI, Kieber JJ. 2008. Two leucine‐rich repeat receptor kinases mediate signaling, linking cell wall biosynthesis and ACC synthase in Arabidopsis . Plant Cell 20: 3065–3079. [DOI] [PMC free article] [PubMed] [Google Scholar]
- Xue H, Veit C, Abas L, Tryfona T, Maresch D, Ricardi MM, Estevez JM, Strasser R, Seifert GJ. 2017. Arabidopsis thaliana FLA4 functions as a glycan‐stabilized soluble factor via its carboxy‐proximal Fasciclin 1 domain. The Plant Journal 91: 613–630. [DOI] [PMC free article] [PubMed] [Google Scholar]
- Yeats TH, Bacic A, Johnson KL. 2018. Plant glycosylphosphatidylinositol anchored proteins at the plasma membrane‐cell wall nexus. Journal of Integrative Plant Biology 60: 649–669. [DOI] [PubMed] [Google Scholar]
- Zhang Q, Xie Z, Zhang R, Xu P, Liu H, Yang H, Doblin MS, Bacic A, Li L. 2018. Blue light regulates secondary cell wall thickening via MYC2/MYC4 activation of the NST1‐directed transcriptional network in Arabidopsis . Plant Cell 30: 2512–2528. [DOI] [PMC free article] [PubMed] [Google Scholar]
- Zhong R, Demura T, Ye ZH. 2006. SND1, a NAC domain transcription factor, is a key regulator of secondary wall synthesis in fibers of Arabidopsis . Plant Cell 18: 3158–3170. [DOI] [PMC free article] [PubMed] [Google Scholar]
- Zhong R, Richardson EA, Ye ZH. 2007. The MYB46 transcription factor is a direct target of SND1 and regulates secondary wall biosynthesis in Arabidopsis . Plant Cell 19: 2776–2792. [DOI] [PMC free article] [PubMed] [Google Scholar]
Associated Data
This section collects any data citations, data availability statements, or supplementary materials included in this article.
Supplementary Materials
Dataset S1 proFLA11 and proFLA12 sequences and predicted major transcription factors regulating FLA11 and FLA12 expression.
Dataset S2 List of differentially expressed genes (DEGs).
Fig. S1 Mechanical stress influences stem secondary wall composition.
Fig. S2 Morphological analyses of wild‐type (WT) and OE‐FLA11 plants.
Fig. S3 Early development of xylem in root and pistil of OE‐FLA11 plants compared to WT plants.
Fig. S4 Histological analyses of transverse sections at 1 cm from the stem base of WT and OE‐FLA11 1TC plants at growth stage 6.1.
Fig. S5 Monosaccharide and polysaccharide composition of WT and OE‐FLA11 1TC stage 6.1 base stems.
Fig. S6 Mäule staining of WT and OE‐FLA11 1TC base stems from stage 9.7 plants.
Fig. S7 RNA‐seq analysis of down‐regulated DEGs in OE‐FLA11 2TC young stems, compared to WT plants.
Table S1 List of primers used for quantitative polymerase chain reaction (qPCR) experiments.
Table S2 Quantification of WT and OE‐FLA11 plant morphological features.
Table S3 Measurement of tissue organisation in WT and OE‐FLA11 base stems at growth stages 6.1 and 6.9.
Table S4 Polysaccharide composition derived from linkage analysis.
Table S5 List of top 50 up‐regulated differentially expressed genes (DEGs) in OE‐FLA11 stems, compared to WT plants.
Table S6 List of up‐regulated differentially expressed genes (DEGs) involved in SCW synthesis in OE‐FLA11 stems, compared to WT plants.
Video S1 OE‐FLA11 2TC plant (right) stems are stiffer than those of WT plants (left).
Video S2 OE‐FLA11 1TC plant (left) stems are stiffer than those of WT plants (right).
Please note: Wiley Blackwell are not responsible for the content or functionality of any Supporting Information supplied by the authors. Any queries (other than missing material) should be directed to the New Phytologist Central Office.
Data Availability Statement
All data are available in the main text or the Supporting Information.