

Abstract
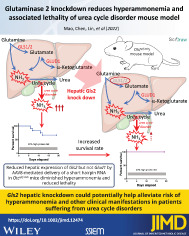
Amino acids, the building blocks of proteins in the cells and tissues, are of fundamental importance for cell survival, maintenance, and proliferation. The liver plays a critical role in amino acid metabolism and detoxication of byproducts such as ammonia. Urea cycle disorders with hyperammonemia remain difficult to treat and eventually necessitate liver transplantation. In this study, ornithine transcarbamylase deficient (Otc spf‐ash ) mouse model was used to test whether knockdown of a key glutamine metabolism enzyme glutaminase 2 (GLS2, gene name: Gls2) or glutamate dehydrogenase 1 (GLUD1, gene name: Glud1) could rescue the hyperammonemia and associated lethality induced by a high protein diet. We found that reduced hepatic expression of Gls2 but not Glud1 by AAV8‐mediated delivery of a short hairpin RNA in Otc spf‐ash mice diminished hyperammonemia and reduced lethality. Knockdown of Gls2 but not Glud1 in Otc spf‐ash mice exhibited reduced body weight loss and increased plasma glutamine concentration. These data suggest that Gls2 hepatic knockdown could potentially help alleviate risk for hyperammonemia and other clinical manifestations of patients suffering from defects in the urea cycle.
Keywords: chronic liver disease, glutamine, glutamate dehydrogenase 1, glutaminase 2, hyperammonemia, urea cycle disorders
Abbreviations
- ARG
arginase
- ASL
argininosuccinic acid lyase
- ASS1
argininosuccinic acid synthetase
- CPS1
carbamoylphosphate synthetase
- GCGR
glucagon receptor
- GLS
glutaminase
- GLUD
glutamate dehydrogenase
- HI/HA
hyperinsulinemic‐hyperammonemia (syndrome)
- NAGS
N‐acetyl glutamate synthase
- ORNT1
mitochondrial ornithine transporter
- OTC
ornithine transcarbamylase
- PCA
principal component analysis
- PP
periportal area
- shRNA
short hairpin RNA
- TPM
transcripts per million
- UCDs
urea cycle disorders
1. INTRODUCTION
Urea cycle disorders (UCDs) result from inherited deficiencies in the six enzymes of the urea cycle pathway: carbamoylphosphate synthetase 1 (CPS1), ornithine transcarbamylase (OTC), argininosuccinic acid synthetase (ASS1), argininosuccinic acid lyase (ASL), arginase (ARG), and N‐acetyl glutamate synthase (NAGS) or in the two transporters mitochondrial ornithine transporter (ORNT1) and aspartate/glutamate carrier (citrin). 1 , 2 , 3 UCDs are characterized by hyperammonemia and high lethality. Increased blood ammonia concentration is highly neurotoxic, leading to encephalopathy, coma, and eventual death if not recognized and treated rapidly. 1 , 2 , 3 OTC deficiency is the most prevalent urea cycle deficiency among patients. The gene is on the X chromosome and is expressed in the liver and small intestine. More than 340 pathological mutations have been identified. 4 A mouse model of OTC deficiency (Otc spf‐ash ) resembles patients with late‐onset OTC deficiency that retain partial OTC enzyme activity. 5 , 6
The liver plays an essential role in amino acid metabolism and allows for efficient detoxification of ammonia through urea synthesis. Glutamine, the most abundant amino acid in the human body, serves as a nontoxic transporter of ammonia in the blood circulation and as an amino, amide or carbon moiety donor for the synthesis of glucose, nucleotides, and amino acids. 7 , 8 As a key amino acid involved in nitrogen metabolism, the metabolism of glutamine in liver hepatocytes regulates the activity of the urea cycle due to its conversion to glutamate and free NH4 + by glutaminase (GLS) (Figure 1A). 8 Glutamate is further catalyzed to α‐ketoglutarate (KG) and another free NH4 + by glutamate dehydrogenase (GLUD). GLS2 and GLUD1 are the main liver isoforms for these two enzymes. Glutamate can also be converted to KG by transamination reactions. The glutaminase II pathway is an alternative pathway for generating KG and ammonia from glutamine, which converts glutamine to KG by an alternative mechanism. Glutamine is first converted to α‐ketoglutaramate (KGM). KGM is then hydrolyzed to KG and ammonia by an enzyme known as omega‐amidase. 7 For simplicity the conversion of glutamine to KG via the glutaminase II reaction 7 is not shown in Figure 1A. Current treatment options for UCDs are limited to dietary protein restriction and to nitrogen scavengers, which results in excretion of excess nitrogen. UCDs commonly necessitate liver transplantation. 9 , 10 , 11 , 12 Given the lack of effective therapeutic options for UCDs, there is a need to develop therapies to treat resulting conditions and prevent hyperammonemia. Hepatic Gls2 knock down was reported to ameliorate hyperglycemia due to reduced glutamine hydrolyses, 13 but it is not clear whether targeting hepatic Gls2 reduces NH4 + production to ameliorate urea cycle deficiency (Figure 1A). Similarly, activation mutations in the GLUD1 gene are the second most common cause of hyperinsulinism‐hyperammonemia (HI/HA) rare disease, 14 , 15 but whether hepatic GLUD1 knock down reduces NH4 + production in UCD patients is an open question. To further understand the roles of liver GLS2 and GLUD1 in urea cycle, we utilized AAV8‐mediated delivery of a short hairpin RNA (shRNA) to specifically knock down hepatic Gls2 or Glud1 in Otc spf‐ash (OTC) mice, to test their impacts on hyperammonemia and associated lethality while animals were challenged with a high protein diet.
FIGURE 1.
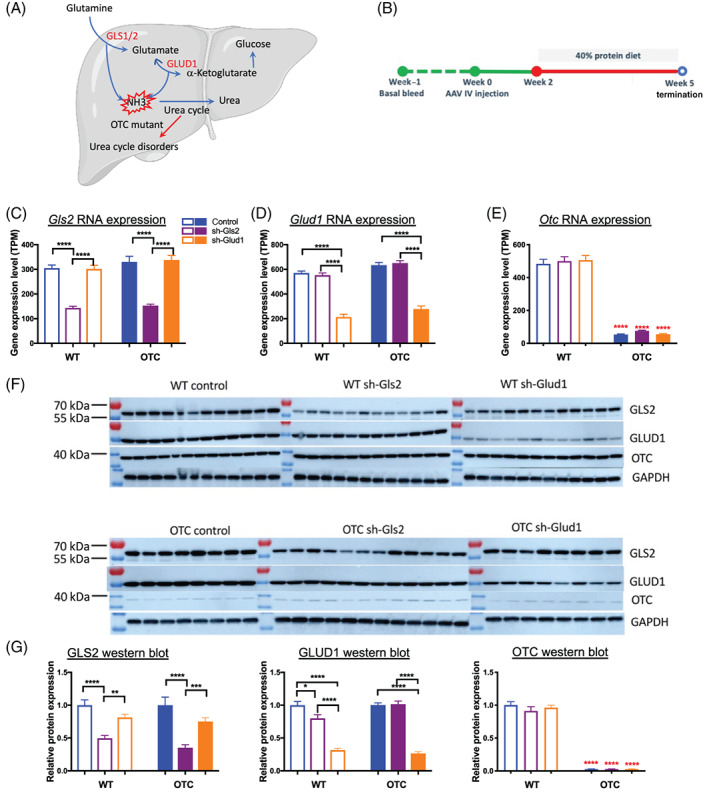
Hepatic Gls2 and Glud1 knockdown in mouse liver to target urea cycle disorders. Schematic of glutamine metabolism in the liver and mechanism of action of targeting GLS2 and GLUD1 to treat urea cycle disorders. For simplicity the conversion of glutamine to KG via the glutaminase II reaction 7 is not shown (A). Timeline of the study (B). Animals were injected AAV at week 0, were on high protein diet treatment at week 2 and were euthanized at week 5. Hepatic Gls2 and Glud1 knockdown at RNA and protein levels were confirmed by liver RNA‐seq and western blot (C, D, F, and G). Deficient Otc expression in OTC mice were confirmed by liver RNA‐seq and western blot (E, F, and G). N = 8‐13 per group. Data are mean ± SEM. Statistical analysis was conducted by two‐way ANOVA. Comparisons were made between sh‐Gls2, sh‐Glud1, and control within the same genotype (black asterisks), and comparisons were made between OTC and wildtype mice among the same treatment (red asterisks). OTC protein quantification was generated from a different set of blots with a loading control for normalization between blots. *P < .05, **P < .01, ***P < .001, ****P < .0001
2. RESULTS AND DISCUSSION
2.1. AAV shRNA‐Gls2 and AAV shRNA‐Glud1 knocked down Gls2 and Glud1 in mouse liver
Hepatic specific knockdown of genes was achieved by AAV8‐mediated I.V. injection delivery of a short hairpin RNA (shRNA). Both wildtype (WT) and Otc spf‐ash (OTC) mice were randomized into three groups for different treatments based on their plasma ammonia levels and body weights: control (shRNA‐scramble), sh‐Gls2 (shRNA‐Gls2) and sh‐Glud1 (shRNA‐Glud1) in WT and OTC mice (n = 12‐13 for each group). I.V. injection delivery of AAV were applied at week 0. All the mice were switched from standard chow diet (21% protein) to 40% high protein diet at week 2 till the end of the study at week 5 (Figure 1B).
Liver samples were collected at the end of the study for RNA sequencing to measure gene expression. Liver Gls2 RNA expression level was significantly reduced by shRNA‐Gls2 AAV from a mean of 316 transcripts per million (TPM) to 148 TPM across both wildtype and OTC mice, but not by shRNA‐Glud1 AAV (Figure 1C). Similarly, liver Glud1 RNA expression was significantly reduced by shRNA‐Glud1 AAV treatment from a mean of 599 TPM to 243 TPM across both wildtype and OTC mice, but not by shRNA‐Gls2 AAV (Figure 1D). As expected, liver Otc RNA expression was only a mean of 53 TPM in OTC mice compared to 484 TPM in wildtype mice and was not affected by either shRNA‐Gls2 or shRNA‐Glud1 (Figure 1E). The specific hepatic protein knockdown of GLS2 (65% and 51%, respectively) or GLUD1 (73% and 69%, respectively) in OTC and wildtype mouse by shRNA‐Gls2 AAV or shRNA‐Glud1 AAV was also confirmed by western blotting (Figure 1F‐G). As expected, <5% OTC protein remained in OTC mice and was not regulated by Gls2 or Glud1 knockdown (Figure 1F‐G).
2.2. Effects of hepatic Gls2 and Glud1 knockdown on survival, plasma ammonia, plasma amino acid levels, and body weight in OTC mice
OTC mice on standard chow diet (21% protein) did not show an obvious pathological phenotype, likely due to residual OTC expression. High protein diet exacerbated the disease with hyperammonia, body weight loss, and even death. 5 , 6 We then evaluated whether reduction in hepatic glutamine metabolism key enzymes, by knockdown of hepatic Gls2 and Glud1 gene expression, altered ammonia homeostasis in mice. To assess the impact of AAV shRNA‐Gls2 and AAV shRNA‐Glud1 on urea cycle disorder symptoms, the tolerance of OTC and WT mice on 3 weeks of 40% protein diet was conducted. Gls2 knockdown OTC mice increased survival rate to 100% during the course of the experiment, while the Glud1 knockdown OTC mice survival rate was 64.8% which is similar to the OTC control group survival rate 66.8% (Figure 2A). Plasma ammonia concentration was 79 μmol/L in wildtype control mice on standard chow. OTC mice plasma ammonia concentration on standard chow was 102 μmol/L and elevated to 264 and 210 μmol/L on high protein diet at week 3 and week 5, respectively. On average, Gls2 knockdown lowered plasma ammonia in OTC mice on high protein diet from 264 to 173 μmol/L at week 3 and from 210 to 140 μmol/L at week 5. By contrast, Glud1 knockdown in OTC mice did not change plasma ammonia level on high protein diet, which were 240 and 263 μmol/L at weeks 3 and 5, respectively (Figure 2B). High protein diet induced 27% body weight loss in OTC control mice over the course of the study, whereas wildtype mice maintained their body weights. Gls2 knockdown in OTC mice showed 20% body weight loss, which was less than the 27% observed in the OTC control group (Figure 2C). In wildtype mice, Gls2 or Glud1 knockdown did not affect plasma ammonia levels (P > .99), body weight (P = .98), or survival rate.
FIGURE 2.
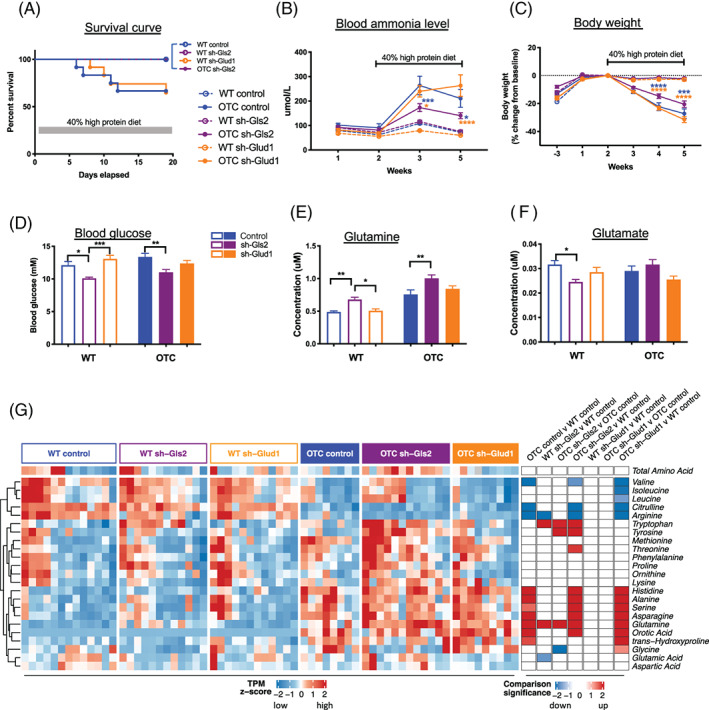
Hepatic Gls2 but not Glud1 knockdown reduces hyperammonemia and mortality in a urea cycle deficiency animal model of OTC mice on high protein diet. Survival curves (A) in OTC and wildtype (WT) mice administered IV injection of AAV shRNA‐Gls2 and shRNA‐Glud1 at week 0 and placed on high protein diet at week 2. Plasma ammonia levels (B), body weights (C), spot blood glucose at week 2 (D), terminal plasma glutamine/glutamate levels (E, F), terminal plasma amino acid and orotic acid concentration heatmap (G) in the treatment groups. N = 8‐13 per group. Data are mean ± SEM. Statistical analysis was conducted by two‐way ANOVA. Comparisons were made between OTC sh‐Gls2, OTC sh‐Glud1 and OTC control (B, C), and between treatments within the same genotype (D‐F). *P < .05, **P < .01, ***P < .001, ****P < .0001. Blue color indicates comparison to OTC control group and gold color indicates comparison to OTC sh‐Glud1 group. (G) Heatmaps showing (left) standardized plasma concentration of each amino acid in individual mouse, grouped by genotype and treatment categories, and (right) signed significance of categorical comparisons of each amino acid. Significance is log10 transformed P‐value from one‐way ANOVA, and sign denotes direction of change. Only significances of P < .05 are colored
Glutamine is an important precursor for gluconeogenesis, the process of glucose production from other non‐carbohydrate constituents. This central metabolic pathway predominantly occurring in the liver allows maintenance of blood glucose levels in fasting conditions following the depletion of glycogen stores. Consistent with previous findings, 13 we show that hepatic Gls2 knockdown treatment decreased blood glucose level from 13.37 mM in OTC control group to 11.02 mM (P = .007) (Figure 2D). Similarly, hepatic Gls2 knockdown also increased circulating glutamine levels in both OTC and wildtype mice, although circulating glutamate levels were only reduced in WT mice, but not in OTC mice (Figure 2E, F). Higher than 50% Gls2 knockdown efficacy in OTC mice may be needed to impact circulating glutamate concentration. The concentrations of several other amino acids were altered by Gls2 knockdown. For example, the concentrations of plasma tryptophan in both wildtype and OTC mice were increased (Figure 2G). Total circulating amino acid concentrations were not significantly altered in either wildtype or OTC mice.
It was shown that elevated plasma amino acid levels, especially glutamine level, promote an increase in pancreas weight, alpha‐cell mass, and circulating glucagon levels. 16 , 17 , 18 , 19 We now extend these observations to OTC mice and show similar increased plasma glucagon level in OTC mice with Gls2 knockdown, although alpha‐cell or beta‐cell mass or insulin level were not significantly increased (Figure S1). OTC control mice have lower plasma insulin concentration 0.15 μg/L compared to 0.98 μg/L in wildtype control mice (P = .009). Data on UCD patients' insulin concentrations is limited but caution has been advised for low dose continuous infusion of insulin to combat patients' catabolism since patients are often exquisitely sensitive to either glucose or insulin. 20 Further experiments are needed to understand the regulation of plasma insulin concentration in OTC mice or UCD patients.
These data show that hepatic Gls2 knockdown has beneficial effects on plasma ammonia level, body weight, and survival rate, and is associated with a profound increase in plasma glutamine level in OTC mice. It was reported that UCD patients benefit from decreased glutamine concentration in astrocytes associated with reduced circulating ammonia levels. 21 , 22 , 23 Hepatic Gls2 knockdown reduces circulating ammonia level and increases glutamine level. It will be interesting to measure glutamine concentration in brain under this condition and whether there is any consequence on cognitive function or brain tissue alteration. The safety concerns of Gls2 knockdown could be addressed by data from glucagon receptor (GCGR) knock out (KO) mouse or antagonist antibody treatments. In the Gcgr KO mouse liver, Gls2 mRNA was reduced by 3.4‐fold compared to wildtype mice. 24 Similarly, in the GCGR antibody treated mice, liver Gls2 mRNA was approximately reduced by 3‐fold and plasma glutamine was increased more than 2‐fold compared to control mice. 25 No energy expenditure or cognitive function regulations were reported in Gcgr KO mice or GCGR antagonists treated humans. 26 It was reported in a DIO mouse study that energy expenditure and locomotor activity were unchanged in GCGR‐blocking monoclonal antibody treated DIO mice compared to control antibody treated DIO mice. 27 Furthermore REGN1193, a GCGR‐blocking monoclonal antibody, has been evaluated for safety, tolerability, and PK/PD in healthy volunteers, and the only reported adverse effect from REGN1193 treated healthy volunteers was a transient elevation in serum hepatic aminotransferases. 28 Based on these observations we would postulate that ~50% liver Gls2 knockdown is safe and well tolerated in mice and humans.
2.3. Hepatic Gls2 and Glud1 knockdown induced gene expression changes in wildtype and OTC mice
We first visualized the liver transcriptomic data in reduced dimensions using principal component analysis (PCA) (Figure 3A). In PCA, each subsequent component is selected in an unsupervised manner to capture the greatest variability remaining in the dataset. The first principal component (PC1) separated mice between OTC and WT genotype and the second principal component (PC2) separated mice along Gls2 knockdown. These two components explained 33% and 19% of the total variance in the transcriptomics, respectively. The first principal component highly correlated with ammonia and body weight loss (Figure S2A,B). Thus, perturbation of ammonia homeostasis, due to OTC deficiency, was associated with the direction of largest variability in the dataset.
FIGURE 3.
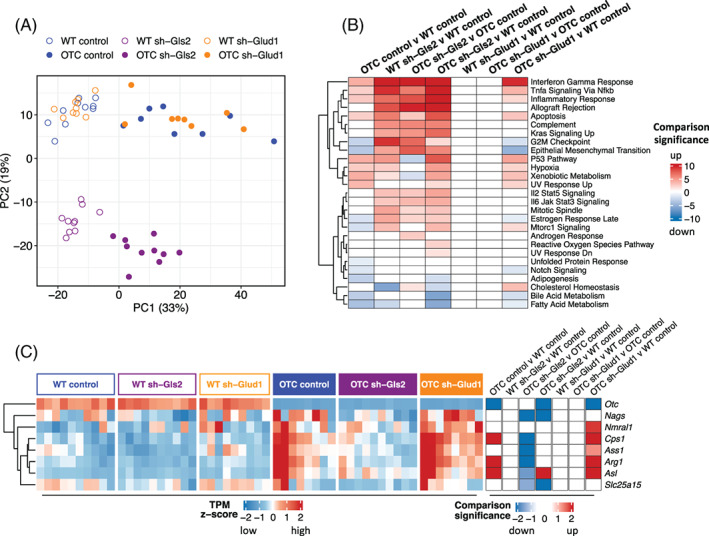
Liver RNA‐seq analysis with hepatic Gls2 and Glud1 knockdown in OTC and wildtype mice. (A) Principal component analysis plot of liver gene expression in mice. (B) Enrichment of differentially expressed genes in hallmark gene sets in categorical comparisons. Significance is log10 transformed P‐value from Fisher’s exact test, and sign indicates whether enriched genes are upregulated or downregulated in the comparison. P values were multiple‐comparison adjusted. Only significances of P < .05 are colored. (C) Heatmaps showing (left) standardized TPM of each urea cycle gene in individual mouse, grouped by genotype and treatment categories, and (right) signed significance of categorical comparisons of each gene. Significance is log10 transformed P‐value from DESeq2, and sign denotes direction of change. P values were multiple‐comparison adjusted. Only significances with P < .05 are colored
We next filtered for genes that were significantly differentially expressed with change across seven comparisons: OTC control vs WT control (639 up, 617 down), WT sh‐Gls2 vs WT control (931 up, 311 down), and OTC sh‐Gls2 vs OTC control (1108 up, 505 down), OTC sh‐Gls2 vs WT control (1651 up, 966 down), WT sh‐Glud1vs WT control (0 up, 2 down), OTC sh‐Glud1 vs OTC control (0 up, 2 down), and OTC sh‐Glud1 vs WT control (621 up, 628 down). Overall, there were many significantly differentially expressed genes with OTC deficiency and with Gls2 knockdown, but limited differences with Glud1 knockdown. To interpret these differentially expressed genes, we computed the significance of enrichment of these genes in the hallmark gene sets (Figure 3B). OTC deficiency decreased expression of fatty acid and bile metabolic processes in the liver. Gls2 knockdown increased immune activation and cell cycle genes in both wildtype and OTC mice. The upregulated genes include multiple proteasome genes: Psma, Psmb, Psmc, and Psmd families, Itgal, Ccr2, Cd68, and C1qb, which were not upregulated in Glud1 knockdown mouse liver. Glutamine is the most abundant amino acid in the body. In health and disease, the rate of glutamine consumption by immune cells and other rapidly dividing cells (eg, colonocytes or cancer cells) is similar or greater than glucose. 30 , 31 , 32 For this reason, glutamine is considered as “fuel for the immune system.” Increased immune activation and cell cycle genes with Gls2 knockdown may be related to increased plasma glutamine levels.
The four mice with the higher levels of ammonia and body weight loss had greater expression of the urea cycle genes (Figure S2C,D). We also found significant upregulation of urea cycle genes in OTC mice compared to wild type mice and significant downregulation of these genes with sh‐Gls2 treatment in OTC deficient mice (Figure 3C). These observations demonstrated increased expression of urea cycle genes with untreated hyperammonia due to OTC deficiency.
Overall, we found strong transcriptomic changes due to both OTC deficiency and hepatic Gls2 knockdown. Gls2 knockdown had signatures related to immune activation. In contrast, the limited gene set perturbation by Glud1 knockdown vs control, with the co‐clustering of these mice in the first two principal components, supported the experimental observation of the lack of protection by such treatment.
2.4. Gls2, Glud1, and Otc RNA distribution in mouse liver
RNA in situ hybridization confirmed restricted expression of hepatic Gls2 to the periportal area 33 around the portal vein in both OTC and wildtype mice (Figure 4A). Gls2 expression was reduced and maintained its PP zonation pattern with Gls2 knockdown (Figure 4A,D). Glud1 expression is detected in all hepatocytes without zonation pattern and knockdown reduced its expression in the whole lobule (Figure 4B,E). The difference in zonation expression pattern of Gls2 and Glud1 might offer clues as to how the knockdown provides UCDs protection. Otc expression is also detected in restricted periportal area 33 in wildtype mice but minimally detected in OTC mice (Figure 4C,F).
FIGURE 4.
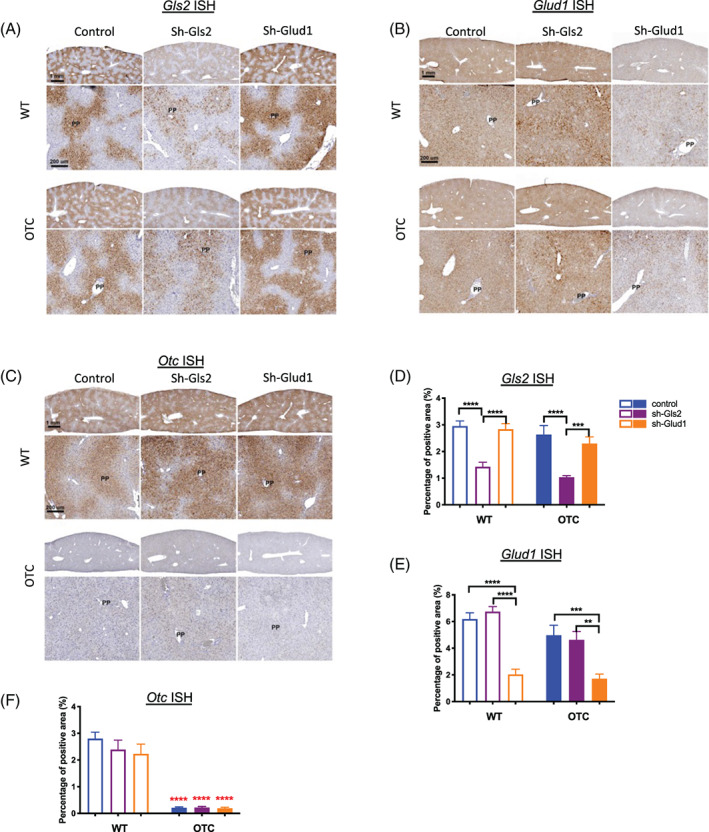
Liver Gls2, Glud1, and Otc mRNA distribution in the liver. Liver representative RNA‐ISH images of Gls2 (A), Glud1 (B), or Otc (C) and respective quantifications of RNA‐ISH positive area percentages (D, E, F) in all groups (N = 8‐13 per group). Top panel has the same magnification and scale bar indicates 1 mm. Bottom panel has the same magnification and scale bar indicates 200 μm. Data are mean ± SEM. Statistical analysis was conducted by two‐way ANOVA. Comparisons were made between sh‐Gls2, sh‐Glud1, and control within the same genotype (black asterisks), and comparisons were made between OTC and wildtype mouse among the same treatment (red asterisks). **P < .01, ***P < .001, ****P < .0001. Control group of this figure(blue) is different to other figures
Our data indicated that hepatic Glud1 knockdown did not improve ammonia detoxification in urea cycle deficient mice. GLUD1 plays a key role in nitrogen and glutamate metabolism and energy homeostasis. 12 This dehydrogenase is expressed at high levels in the liver, brain, pancreas, and kidney. Individuals carrying mutations that increase GLUD1 enzyme activity, such as S445L and G446V, suffer from HI/HA syndrome and display high insulin, hypoglycemia, and increased ammonia levels. 34 , 35 , 36 , 37 In the pancreatic cells, GLUD1 is involved in insulin secretion. GLUD1 appears to function in both the synthesis and catabolism of glutamate and perhaps in ammonia detoxification. The predominant flux of the reaction towards synthesis or catabolism of glutamate is tissue dependent. 38 Hepatic Glud1 knockdown did not improve ammonia detoxification in OTC deficient mice, indicating that catabolism of glutamate in OTC mouse liver might not be the predominant flux of GLUD1.
Recent research shows the existence of a liver–pancreatic alpha‐cell axis where glucagon acts as the messenger from pancreatic alpha‐cells to the liver and glutamine is the mediator from the liver to the alpha‐cells. 16 , 17 , 18 , 19 , 39 Disruption of the liver–alpha‐cell axis results in elevated plasma levels of glucagon and glutamine and alpha‐cell hyperplasia. 16 , 17 , 19 , 40 We extend these observations to the OTC mice. Interestingly, plasma glucagon levels were upregulated in OTC mice with hepatic Gls2 knockdown. This suggests that increased glucagon level is a potential safety concern which needs to be considered when using the hepatic Gls2 knockdown treatment.
A key finding of this study is that a ~50% RNA and protein knockdown of hepatic Gls2 reduced hyperammonemia and lethality of OTC mice on a high protein diet, a widely used mouse model of UCD. In contrast, a ~70% RNA and protein knockdown of hepatic Glud1 did not show protective effects on hyperammonemia and lethality caused by urea cycle deficiency. A more profound effect would be expected if Gls2 reduction is further increased which may exacerbate on‐target side effects in a negative way with increased circulating glucagon and glutamine levels leading to pancreas alpha cell hyperplasia. 16 , 17 , 18 , 19
In conclusion, we have shown that hepatic Gls2 but not Glud1 knockdown using AAV8 shRNA could help alleviate risk for hyperammonemia and other clinical manifestations of a UCD mouse model.
3. MATERIALS AND METHODS
3.1. In vivo studies
Age matched (15‐18 weeks old) male OTC mice (B6EiC3Sn a/A‐Otcspf‐ash/J, The Jackson Laboratory Stock No. 001811) and corresponding wildtype male mice (B6EiC3SnF1/J, the Jackson Laboratory Stock No. 001875) were housed in a controlled environment (12‐hour light/dark cycle, 22 ± 1°C, 60%‐70% humidity) and fed ad libitum with standard chow (21% protein, PicoLab Rodent Diet 20 EXT IRR 5R53, LabDiet) or 40% protein diet (LabDiet 5001 with 40% Protein, TestDiet). All mice were housed within an AAALAC‐accredited mouse production barrier facility at Regeneron Pharmaceuticals, Inc. in Tarrytown, NY. All procedures were performed with approval from Regeneron Pharmaceuticals' Institutional Animal Care and Use Committee in accordance with the Guide for the Care and Use of Laboratory Animals, eighth Edition and the AVMA Guidelines for Euthanasia of Animals: 2013 or 2020 Editions.
OTC mice and wildtype mice were injected with 2 to 3 × 10¹² GC/mouse AAV8‐sh‐scramble, AAV8‐sh‐Glud1 or AAV8‐sh‐Gls2, individually. Two weeks later, all the mice were put on the 40% protein diet for the duration of the study. Plasma was collected by submandibular bleed in EDTA tubes and snap frozen immediately to determine ammonia, insulin, and glucagon levels. Deaths of animals were recorded daily. Liver and pancreas were collected at the end of the study. All animals were euthanized in the morning at the end of the study.
An shRNA‐Gls2 targeting the mouse Gls2 gene was created that had the nucleotide sequence 5′‐CCGGGTGGTCAAACTGCTTCAAGATCTCGAGATCTTGAAGCAGTTTGACCACTTTTT‐3′ after the U6 promoter in an AAV8 vector. An shRNA‐Glud1 targeting the mouse Glud1 gene was created that had the nucleotide sequence 5′‐CCGGCCCAAAGCCAAGGTCTATGAACTCGAGTTCATAGACCTTGGCTTTGGGTTTTT‐3′ after the U6 promoter in an AAV8 vector. An shRNA‐scramble was created that had the nucleotide sequence 5′‐CCGGCAACAAGATGAAGAGCACCAACTCGAGTTGGTGCTCTTCATCTTGTTGTTTTT‐3′ after the U6 promoter in an AAV8 vector. AAV virus was produced by Vector Biolabs.
3.2. Blood chemistry
Plasma ammonia was assayed in a Siemens ADVIA Chemistry XPTB Clinical System (Siemens). Plasma glucagon and insulin concentration were measured by ELISA (Mercodia). For measurement of individual amino acid concentrations, plasma samples were spiked with stable labeled internal standards, extracted, and subjected to protein precipitation with methanol. After centrifugation, an aliquot of the supernatant was diluted and injected onto an Agilent 1290/AB Sciex QTrap 5500 LC‐MS/MS system equipped with a C18 reversed phase UHPLC column (Metabolon). All LC‐MS/MS raw data was collected using AB SCIEX Analyst 1.6.3 and processed using SCIEX OS‐MQ software v1.7.
3.3. Western blotting
Liver samples were homogenized in ice‐cold RIPA buffer (50 mM Tris‐HCl, pH 7.4, 150 mM NaCl, 1 mM EDTA, 0.25% deoxycholic acid, and 1% NP‐40) in the presence of protease and phosphatase inhibitor cocktails (Thermo‐Fisher). Total sample lysates were centrifuged for 15 minutes at 10 163 g and supernatant were mixed with 6x reducing SDS buffer (Alfa‐Aesar) and boiled at 100°C for 5 minutes. Protein samples (30 μg) were loaded and separated on gradient SDS‐PAGE gels (Bio‐Rad) and transferred to polyvinylidene difluoride membranes. The membranes were blocked for 1 h with 5% non‐fat milk in 1× TBS supplemented with 0.1% Tween20 (Bio‐Rad) and incubated with the following antibodies: GLS2 (Novus Biologicals, NBP1‐76544), GLUD1 (ThermoFisher Scientific, PA5‐19267), OTC (Abcam, ab203859), and GAPDH (Cell Signaling, 2118 L). Bound antibodies were detected using horseradish peroxidase‐conjugated anti‐rabbit or anti‐goat secondary antibodies (1:10 000; Jackson ImmunoResearch) and enhanced chemiluminescence substrate (Thermo‐Fisher). Band intensities were quantified with ImageJ software.
3.4. RNA‐seq preparation and analysis
Total RNA was purified from all samples using MagMAX‐96 for Microarrays Total RNA Isolation Kit (Ambion by Life Technologies) according to manufacturer’s specifications. Genomic DNA was removed using MagMAX Turbo DNase Buffer and TURBO DNase from the MagMAX kit listed above (Ambion by Life Technologies). Strand‐specific RNA‐seq libraries were prepared using KAPA Stranded mRNA‐Seq Library Preparation Kit (Kapa Biosystems). Twelve‐cycle PCR was performed to amplify libraries. Sequencing was performed on Illumina HiSeq 2000 (Illumina) by multiplexed single‐read run with 33 cycles. Raw BCL sequence data were converted to FASTQ format via Illumina Casava v1.8.2. Reads were decoded based on their barcodes, and read quality was evaluated with FastQC (http://www.bioinformatics.babraham.ac.uk/projects/fastqc/). Reads were mapped to the mouse transcriptome (NCBI GRCm38) using Array Studio (QIAGEN OmicSoft) allowing two mismatches. Reads mapped to the exons of a gene were summed at the gene level.
Transcriptomic analysis was performed using custom R code. For the PCA plot, the 1000 most variable genes were selected, and their TPM values were standardized prior to PCA. The DESeq2 package was used for differential gene expression analysis, 41 and significantly perturbed genes were defined as those with fold changes no less than 1.5 in either up or down direction and with Benjamini and Hochberg multiple‐comparison adjusted P ≤ .05.
Gene set enrichment analysis was performed on the hallmark gene sets (MSigDB v7.2), 42 using mouse gene symbols mapped to human gene symbols (https://github.com/ToledoEM/msigdf). 43 For each comparison, a Fisher’s exact test was used to calculate the significance of enrichment of genes perturbed up, and separately for genes perturbed down, in each hallmark gene set. P values were adjusted for multiple comparison using the Benjamini and Hochberg method. For each comparison and gene set, the more significant direction was recorded. A heatmap was drawn using the package ComplexHeatmap, 44 in which rows were hierarchically clustered by Euclidean distance. To reduce the number of gene sets displayed, gene sets without any P ≤ .05 comparison and gene sets that had >33% overlap with another more significant gene set were removed.
To explore perturbations to the urea cycle, standardized TPM values of genes in the Reactome urea cycle gene set (ID: R‐HSA‐70635) were plotted in a heatmap, excluding genes with mean TPM < 0.5. 45 The significance of differential gene expression was obtained from DESeq2 after multiple comparison adjustment.
3.5. Histology
Liver and pancreas were fixed in 10% neutral buffered formalin solution for 24 hours and then embedded in paraffin. Two sections of the pancreas from each animal were stained with an anti‐glucagon antibody (REGN745, monoclonal antibody generated in‐house) or an anti‐insulin (Dako) antibody, and areas of glucagon and insulin positive cells were measured using Halo digital imaging analysis software (Indica Labs). The percent of glucagon‐ and insulin‐positive areas in proportion to the whole pancreas area were calculated. For RNA‐ISH, liver sections were permeabilized and hybridized with mRNA probes to Gls2, Glud1, or Otc (ACD Bio). Following probe hybridization and amplification, mRNA was detected using RNAscope 2.5 HD Assay—brown Kit. Slides were scanned using Aperio AT2 Slide Scanner (Leica) and the images were analyzed using the Halo software (Indica Labs).
3.6. Statistics
Statistical analyses were performed utilizing GraphPad software Prism 8.0. All parameters were analyzed by one‐way or two‐way ANOVA followed by Sidak post hoc tests; a threshold of P ≤ .05 was considered statistically significant.
3.7. Animal rights
All institutional and national guidelines for the care and use of laboratory animals were followed. All mice were housed within an AAALAC‐accredited mouse production barrier facility at Regeneron Pharmaceuticals, Inc. in Tarrytown, NY. All procedures were performed with approval from Regeneron Pharmaceuticals' Institutional Animal Care and Use Committee in accordance with the Guide for the Care and Use of Laboratory Animals, eighth Edition and the AVMA Guidelines for Euthanasia of Animals: 2013 or 2020 Editions.
CONFLICT OF INTEREST
Xia Mao, Helen Chen, Allen Z. Lin, Michael E. Burczynski, Erqian Na, Gabor Halasz, Mark W. Sleeman, Andrew J. Murphy, Haruka Okamoto, Xiping Cheng are employees and shareholders of Regeneron Pharmaceuticals.
Sun Kim declares that she has no conflict of interest.
Supporting information
Figure S1 Gls2 knockdown induces increased plasma glucagon level but not alpha‐cell hyperplasia in OTC mice. Terminal plasma glucagon (A), insulin (B), and pancreas weights (C) of OTC and wildtype (WT) mice administered IV injection of AAV shRNA‐Gls2 and Glud1 at week 0, placed on high protein diet at week 2, and terminated at week 5. Representative immunohistochemistry images of pancreas section stained for glucagon or insulin (D, G). Percentage of glucagon and insulin IHC positive area were quantified (E, F). N = 8–13 per group. Top panel has the same magnification and scale bar indicates 1 mm. Bottom panel has the same magnification and scale bar indicates 100 μm. Data are mean ± SEM. Statistical analysis was conducted by two‐way ANOVA. Comparisons were made between treatments within the same genotypes. *P < .05.
Figure S2. Physiological parameters correlated with liver gene expression. Relationship across individual mouse of (A, C) terminal body weight and (B, D) terminal plasma ammonia concentration with (A, B) the first principal component and with (C, D) liver Ass1 gene expression.
ACKNOWLEDGMENTS
We would like to thank Angelos Papatheodorou and Ivory Mintah for the plasma ammonia assay.
Mao X, Chen H, Lin AZ, et al. Glutaminase 2 knockdown reduces hyperammonemia and associated lethality of urea cycle disorder mouse model. J Inherit Metab Dis. 2022;45(3):470-480. doi: 10.1002/jimd.12474
Communicating Editor: Johannes Häberle
DATA AVAILABILITY STATEMENT
The GEO accession number for the liver RNA‐seq data reported in this paper is GSE179342.
REFERENCES
- 1. Braissant O. Current concepts in the pathogenesis of urea cycle disorders. Mol Genet Metab. 2010;100(Suppl 1):S3‐S12. [DOI] [PubMed] [Google Scholar]
- 2. Lee B, Goss J. Long‐term correction of urea cycle disorders. J Pediatr. 2001;138(1 Suppl):S62‐S71. [DOI] [PubMed] [Google Scholar]
- 3. Leonard JV, McKiernan PJ. The role of liver transplantation in urea cycle disorders. Mol Genet Metab. 2004;81(Suppl 1):S74‐S78. [DOI] [PubMed] [Google Scholar]
- 4. Yamaguchi S, Brailey LL, Morizono H, Bale AE, Tuchman M. Mutations and polymorphisms in the human ornithine transcarbamylase (OTC) gene. Hum Mutat. 2006;27(7):626‐632. [DOI] [PubMed] [Google Scholar]
- 5. Qureshi IA, Letarte J, Ouellet R. Ornithine transcarbamylase deficiency in mutant mice I. studies on the characterization of enzyme defect and suitability as animal model of human disease. Pediatr Res. 1979;13(7):807‐811. [DOI] [PubMed] [Google Scholar]
- 6. Hodges PE, Rosenberg LE. The spfash mouse: a missense mutation in the ornithine transcarbamylase gene also causes aberrant mRNA splicing. Proc Natl Acad Sci U S A. 1989;86(11):4142‐4146. [DOI] [PMC free article] [PubMed] [Google Scholar]
- 7. Dorai T, Pinto JT, Denton TT, Krasnikov BF, Cooper AJL. The metabolic importance of the Glutaminase II pathway in Normal and cancerous cells. Anal Biochem. 2020;114083:114083. [DOI] [PubMed] [Google Scholar]
- 8. Haussinger D, Schliess F. Glutamine metabolism and signaling in the liver. Front Biosci. 2007;12:371‐391. [DOI] [PubMed] [Google Scholar]
- 9. Auron A, Brophy PD. Hyperammonemia in review: pathophysiology, diagnosis, and treatment. Pediatr Nephrol. 2012;27(2):207‐222. [DOI] [PubMed] [Google Scholar]
- 10. Haberle J, Boddaert N, Burlina A, et al. Suggested guidelines for the diagnosis and management of urea cycle disorders. Orphanet J Rare Dis. 2012;7:32. [DOI] [PMC free article] [PubMed] [Google Scholar]
- 11. Longo NHR. Glycerol Phenylbutyrate for the maintenance treatment of patients with deficiencies in enzymes of the urea cycle. Expert Opin Orphan Drugs. 2017;5(2):999‐1010. [Google Scholar]
- 12. Berry SA, Longo N, Diaz GA, et al. Safety and efficacy of glycerol phenylbutyrate for management of urea cycle disorders in patients aged 2 months to 2 years. Mol Genet Metab. 2017;122(3):46‐53. [DOI] [PubMed] [Google Scholar]
- 13. Miller RA, Shi Y, Lu W, et al. Targeting hepatic glutaminase activity to ameliorate hyperglycemia. Nat Med. 2018;24(4):518‐524. [DOI] [PMC free article] [PubMed] [Google Scholar]
- 14. Palladino AA, Stanley CA. The hyperinsulinism/hyperammonemia syndrome. Rev Endocr Metab Disord. 2010;11(3):171‐178. [DOI] [PubMed] [Google Scholar]
- 15. Galcheva S, Demirbilek H, Al‐Khawaga S, Hussain K. The genetic and molecular mechanisms of congenital hyperinsulinism. Front Endocrinol (Lausanne). 2019;10:111. [DOI] [PMC free article] [PubMed] [Google Scholar]
- 16. Dean ED, Li M, Prasad N, et al. Interrupted glucagon signaling reveals hepatic alpha cell axis and role for l‐glutamine in alpha cell proliferation. Cell Metab. 2017;25(6):1362‐1373 e1365. [DOI] [PMC free article] [PubMed] [Google Scholar]
- 17. Dean ED, Unger RH, Holland WL. Glucagon antagonism in islet cell proliferation. Proc Natl Acad Sci U S A. 2017;114(12):3006‐3008. [DOI] [PMC free article] [PubMed] [Google Scholar]
- 18. Wewer Albrechtsen NJ, Faerch K, Jensen TM, et al. Evidence of a liver‐alpha cell axis in humans: hepatic insulin resistance attenuates relationship between fasting plasma glucagon and glucagonotropic amino acids. Diabetologia. 2018;61(3):671‐680. [DOI] [PubMed] [Google Scholar]
- 19. Kim J, Okamoto H, Huang Z, et al. Amino acid transporter Slc38a5 controls glucagon receptor inhibition‐induced pancreatic alpha cell hyperplasia in mice. Cell Metab. 2017;25(6):1348‐1361 e1348. [DOI] [PMC free article] [PubMed] [Google Scholar]
- 20. Ah Mew N, Simpson KL, Gropman AL, Lanpher BC, Chapman KA, Summar ML. In: Adam MP, Ardinger HH, Pagon RA, et al., eds. Urea cycle disorders overview. Seattle, WA: GeneReviews([R]); 1993. [PubMed] [Google Scholar]
- 21. Brusilow SW, Koehler RC, Traystman RJ, Cooper AJ. Astrocyte glutamine synthetase: importance in hyperammonemic syndromes and potential target for therapy. Neurotherapeutics. 2010;7(4):452‐470. [DOI] [PMC free article] [PubMed] [Google Scholar]
- 22. Jeitner TM, Cooper AJ. Inhibition of human glutamine synthetase by l‐methionine‐S,R‐sulfoximine—relevance to the treatment of neurological diseases. Metab Brain Dis. 2014;29(4):983‐989. [DOI] [PMC free article] [PubMed] [Google Scholar]
- 23. Cooper AJ. Possible treatment of end‐stage hyperammonemic encephalopathy by inhibition of glutamine synthetase. Metab Brain Dis. 2013;28(2):119‐125. [DOI] [PMC free article] [PubMed] [Google Scholar]
- 24. Yang J, MacDougall ML, McDowell MT, et al. Polyomic profiling reveals significant hepatic metabolic alterations in glucagon‐receptor (GCGR) knockout mice: implications on anti‐glucagon therapies for diabetes. BMC Genomics. 2011;12:281. [DOI] [PMC free article] [PubMed] [Google Scholar]
- 25. Cavino K, Sung B, Su Q, et al. Glucagon receptor inhibition reduces Hyperammonemia and lethality in male mice with urea cycle disorder. Endocrinology. 2021;162(1). [DOI] [PubMed] [Google Scholar]
- 26. Scheen AJ, Paquot N, Lefebvre PJ. Investigational glucagon receptor antagonists in phase I and II clinical trials for diabetes. Expert Opin Investig Drugs. 2017;26(12):1373‐1389. [DOI] [PubMed] [Google Scholar]
- 27. Okamoto H, Kim J, Aglione J, et al. Glucagon receptor blockade with a human antibody normalizes blood glucose in diabetic mice and monkeys. Endocrinology. 2015;156(8):2781‐2794. [DOI] [PubMed] [Google Scholar]
- 28. Kostic A, King TA, Yang F, et al. A first‐in‐human pharmacodynamic and pharmacokinetic study of a fully human anti‐glucagon receptor monoclonal antibody in normal healthy volunteers. Diabetes Obes Metab. 2018;20(2):283‐291. [DOI] [PMC free article] [PubMed] [Google Scholar]
- 29. Stuart T, Butler A, Hoffman P, et al. Comprehensive integration of single‐cell data. Cell. 2019;177(7):1888‐1902 e1821. [DOI] [PMC free article] [PubMed] [Google Scholar]
- 30. Newsholme EA, Newsholme P, Curi R. The role of the citric acid cycle in cells of the immune system and its importance in sepsis, trauma and burns. Biochem Soc Symp. 1987;54:145‐162. [PubMed] [Google Scholar]
- 31. Curi R, Newsholme P, Newsholme EA. Intracellular distribution of some enzymes of the glutamine utilisation pathway in rat lymphocytes. Biochem Biophys Res Commun. 1986;138(1):318‐322. [DOI] [PubMed] [Google Scholar]
- 32. Newsholme P, Curi R, Gordon S, Newsholme EA. Metabolism of glucose, glutamine, long‐chain fatty acids and ketone bodies by murine macrophages. Biochem J. 1986;239(1):121‐125. [DOI] [PMC free article] [PubMed] [Google Scholar]
- 33. Zheng GX, Terry JM, Belgrader P, et al. Massively parallel digital transcriptional profiling of single cells. Nat Commun. 2017;8:14049. [DOI] [PMC free article] [PubMed] [Google Scholar]
- 34. Kapoor RR, Flanagan SE, Fulton P, et al. Hyperinsulinism‐hyperammonaemia syndrome: novel mutations in the GLUD1 gene and genotype‐phenotype correlations. Eur J Endocrinol. 2009;161(5):731‐735. [DOI] [PMC free article] [PubMed] [Google Scholar]
- 35. Kapoor RR, Gilbert C, Mohnike K, Blankenstein O, Fuechtner F, Hussain K. Congenital hyperinsulinism: [F]DOPA PET/CT scan of a focal lesion in the head of the pancreas. BMJ Case Rep 2009;2009:bcr2007121178, 2009. [DOI] [PMC free article] [PubMed] [Google Scholar]
- 36. Kapoor RR, James C, Hussain K. Hyperinsulinism in developmental syndromes. Endocr Dev. 2009;14:95‐113. [DOI] [PubMed] [Google Scholar]
- 37. Shimomura K, Flanagan SE, Zadek B, et al. Adjacent mutations in the gating loop of Kir6.2 produce neonatal diabetes and hyperinsulinism. EMBO Mol Med. 2009;1(3):166‐177. [DOI] [PMC free article] [PubMed] [Google Scholar]
- 38. Karaca M, Frigerio F, Maechler P. From pancreatic islets to central nervous system, the importance of glutamate dehydrogenase for the control of energy homeostasis. Neurochem Int. 2011;59(4):510‐517. [DOI] [PubMed] [Google Scholar]
- 39. Wewer Albrechtsen NJ, Junker AE, Christensen M, et al. Hyperglucagonemia correlates with plasma levels of non‐branched‐chain amino acids in patients with liver disease independent of type 2 diabetes. Am J Physiol Gastrointest Liver Physiol. 2018;314(1):G91‐G96. [DOI] [PubMed] [Google Scholar]
- 40. Galsgaard KD, Winther‐Sorensen M, Orskov C, et al. Disruption of glucagon receptor signaling causes hyperaminoacidemia exposing a possible liver‐alpha‐cell axis. Am J Physiol Endocrinol Metab. 2018;314(1):E93‐E103. [DOI] [PMC free article] [PubMed] [Google Scholar]
- 41. Love MI, Huber W, Anders S. Moderated estimation of fold change and dispersion for RNA‐seq data with DESeq2. Genome Biol. 2014;15(12):550. [DOI] [PMC free article] [PubMed] [Google Scholar]
- 42. Liberzon A, Birger C, Thorvaldsdottir H, Ghandi M, Mesirov JP, Tamayo P. The molecular signatures database (MSigDB) hallmark gene set collection. Cell Syst. 2015;1(6):417‐425. [DOI] [PMC free article] [PubMed] [Google Scholar]
- 43. Durinck S, Spellman PT, Birney E, Huber W. Mapping identifiers for the integration of genomic datasets with the R/bioconductor package biomaRt. Nat Protoc. 2009;4(8):1184‐1191. [DOI] [PMC free article] [PubMed] [Google Scholar]
- 44. Gu Z, Eils R, Schlesner M. Complex heatmaps reveal patterns and correlations in multidimensional genomic data. Bioinformatics. 2016;32(18):2847‐2849. [DOI] [PubMed] [Google Scholar]
- 45. Jassal B, Matthews L, Viteri G, et al. The reactome pathway knowledgebase. Nucleic Acids Res. 2020;48(D1):D498‐D503. [DOI] [PMC free article] [PubMed] [Google Scholar]
Associated Data
This section collects any data citations, data availability statements, or supplementary materials included in this article.
Supplementary Materials
Figure S1 Gls2 knockdown induces increased plasma glucagon level but not alpha‐cell hyperplasia in OTC mice. Terminal plasma glucagon (A), insulin (B), and pancreas weights (C) of OTC and wildtype (WT) mice administered IV injection of AAV shRNA‐Gls2 and Glud1 at week 0, placed on high protein diet at week 2, and terminated at week 5. Representative immunohistochemistry images of pancreas section stained for glucagon or insulin (D, G). Percentage of glucagon and insulin IHC positive area were quantified (E, F). N = 8–13 per group. Top panel has the same magnification and scale bar indicates 1 mm. Bottom panel has the same magnification and scale bar indicates 100 μm. Data are mean ± SEM. Statistical analysis was conducted by two‐way ANOVA. Comparisons were made between treatments within the same genotypes. *P < .05.
Figure S2. Physiological parameters correlated with liver gene expression. Relationship across individual mouse of (A, C) terminal body weight and (B, D) terminal plasma ammonia concentration with (A, B) the first principal component and with (C, D) liver Ass1 gene expression.
Data Availability Statement
The GEO accession number for the liver RNA‐seq data reported in this paper is GSE179342.