

Abstract
Sedative use can result in adverse drug reactions. Intensive care unit patients are especially at risk and pharmacokinetic modeling of drug concentrations is an approach to develop precision dosing strategies. However, limited blood sampling availability in critically ill children and need for multiple assays to quantify a variety of commonly used sedatives creates logistical challenges. The goal of this project was to develop a sensitive and selective assay for the simultaneous quantification of a panel of sedatives comprised of midazolam (MDZ), alpha hydroxymidazolam (1- OH MDZ), dexmedetomidine (DEX), morphine (MOR), morphine-3-glucuronide (M3G), morphine-6-glucuronide (M6G), fentanyl (FEN), norfentanyl (NF), and hydromorphone (HM) in small volume pediatric plasma samples. A sensitive and efficient ultra-high performance liquid chromatography-mass spectrometry (UPLC-MS/MS) method was developed following FDA guidance for bioanalytical validation. Minimal sample preparation consisting of simple protein precipitation extraction using acetonitrile with internal standards was utilized. Analyte separation was achieved using a gradient mixture of (A: 0.15% formic acid in water and B: Acetonitrile) and a Waters Acquity C18, 1.7 μm (2.1 × 100 mm) column. Assays were linear over the clinical concentration ranges: MDZ, MOR, HM: 0.5–125 ng/mL; 1-OH MDZ, M3G, M6G: 5–500 ng/mL; and DEX, FEN, NF: 0.05–7.5 ng/mL (R2> 0.99 for all). Assay run time was 10 min and required only 100 μL of plasma. Initial testing of samples from pediatric patients demonstrates adequacy of assay to measure sedatives and metabolites at clinical concentrations confidently in low volumes of plasma. This novel highly-sensitive and specific method to measure a total of nine different analytes (five sedatives, four metabolites) simultaneously enables comprehensive analysis of a panel of sedatives in small volumes such as in pediatric ICU patients.
Keywords: sedatives, delirium, LC-MS/MS, pediatrics, critical care, plasma
1. INTRODUCTION:
Adverse drug reactions (ADRs) pose a significant and detrimental health risk to patients [1]. ADRs prolong patient hospital stays and are associated with poor patient outcomes resulting in costs of $30 billion dollars to the U.S Healthcare system [2]. For example, ADRs resulting from sedative use are common among critically ill patients, occurring 17% and 34% in the pediatric and adult population, respectively [3]. Critically ill patients are more susceptible to ADRs due to high doses, prolonged administration, and the higher prevalence of organ failure that may affect pharmacokinetic parameters [3].
Pharmacokinetic modeling is an approach to develop precision sedative dosing strategies and requires the measurement of sedative drug concentrations [4]. Several published methods are available to measure sedatives individually or with one or two other analytes [5–9]. However, these assays require significant plasma volume to achieve necessary quantification, thereby making them unfeasible for measurements in children. Moorthy and colleagues have developed assays for midazolam [10] and dexmedetomidine [11], as well as their metabolites. Others have also successfully developed assays that measured dexmedetomidine in pediatric patients [11–14]. However, each of these assays been optimized for only one drug. The challenge is that these assays cannot be easily applied in situations of polypharmacy and in multi-site studies where differences in sedative selection (midazolam vs dexmedetomidine, morphine vs hydromorphone vs fentanyl) would require multiple assays, leading to more sample volume being required. Ashaman and colleagues developed a 96 well plate method in a assay measuring midazolam, morphine and their metabolites [15], however, it required two different extraction reagents and two assay preparations per sample. Ghassabian and colleagues had the most extensive panel of sedatives and their metabolites (midazolam, morphine, and fentanyl), but employed a specialized online solid phase extraction (SPE) system that had the ability to conduct a variety of SPE preparations simultaneously [16]. This system was not easily adaptable and would require highly specialized mass spectrometry systems.
Our objective was to develop a simple, efficient, and highly sensitive LC/MS assay that can comprehensively measure sedatives using only 100 μL of plasma. Specifically, we targeted commonly-used sedatives and their active metabolites: midazolam, 1-OH MDZ, dexmedetomidine, morphine, M3G, M6G, hydromorphone, fentanyl, and norfentanyl. To our knowledge, there is no published LC/MS assay that can measure these nine analytes simultaneously. We believe an assay addressing these needs could be used extensively for sedative concentration measurement in multi-site pediatric clinical trials and has broader applications in forensic analysis and drug screening.
2. METHODS:
2.1. Chemicals and Reagents:
Midazolam, midazolam-d4 maleate, alpha-hydoxymidazolam, alpha-hydroxymidazolam-d4, morphine, morphine-d3, morphine-3-beta-d-glucuronide, morphine-3-beta-d-glucuronide-d3, morphine-6-beta-d-glucuronide, morphine-6-beta-d-glucuronide-d3, hydromorphone, hydromorphone-d6, fentanyl, fentanyl-d5, norfentanyl, and norfentanyl-d5-oxalate were all purchased from Cerilliant (Round Rock, Texas). Dexmedetomidine HCl was purchased from Athenex Pharmaceuticals (Buffalo, New York) and dexmedetomidine-d4-L tartrate was purchased from Toronto Research Chemical (Toronto, Ontario). LC-MS grade reagents; methanol, acetonitrile, formic acid and water were purchased from Fisher Scientific (Pittsburgh, PA, USA). Six lots of human plasma was purchased from Lampire Biological Laboratories (Pipersville, Pa).
2.2. UPLC-MS/MS Instrumentation:
The ultra-high performance liquid chromatography (UPLC) system consisted of a Thermo Vanquish (Thermo Scientific, San Jose, California). For chromatographic separation of analytes, a Acquity BEH C18 (2.1 × 100 mm, 1.7 μm) column with a BEH C18 VanGuard pre-column (2.1 × 5 mm, 1.7 μm) was implemented. A gradient elution scheme was used to separate all analytes in a single 10 min run time injection, using 0.15% formic acid in water (mobile phase A) and acetonitrile (mobile phase B). Gradient initial conditions were 95% A for 1 min before a steady decline until 3.7 min to 25% A. The gradient remains the same until 4.5 min to allow for all analytes to elute. The column is then washed with 60% A until 7.9 min before equilibrating stationary phase to initial conditions until 10 min. The flow rate for the entire injection was kept at 0.2 mL/min while maintaining a column temperature of 50 °C and autosampler temperature of 10 °C.
For the detection and measurement of analytes, a TSQ Altis triple quadrupole mass spectrometer (Thermo Scientific, San Jose, California) with heated electrospray ionization (HESI) source was utilized. Analytes were detected using positive ionization mode with the following parameters: spray voltage = 4000 V, vaporization temperature = 275 °C, sheath gas pressure (Arb) = 35, Aux gas pressure (Arb) = 7. Analytes were detected using selected reaction monitoring (SRM). In this mode, the following parameters were set: chromatographic peak width: 6 sec, scan time: 0.05 sec, Q1 and Q3 (FWHM) = 0.70. For mass spectrometry transitions with optimized collision energy and tube lens values, see Table 1.
Table 1.
Mass spectrometry parameters of analytes of interest and their internal standards.
| Analyte | Parent Mass | Product Mass | Collision Energy | Tube Lens | Source Fragmentation |
|---|---|---|---|---|---|
| Midazolam | 326.3 | 291.2 | 26 | 131 | 35 |
| 1-OH MDZ | 342.2 | 203.1 | 26 | 112 | 25 |
| Dexmedetomidine | 201.2 | 95.1 | 17 | 54 | 16 |
| Morphine | 286.3 | 152.1 | 55 | 98 | 31 |
| Hydromorphone | 286.3 | 185.1 | 30 | 103 | 31 |
| M3G | 462.4 | 286.2 | 29 | 120 | 33 |
| M6G | 462.4 | 286.2 | 30 | 122 | 35 |
| Fentanyl | 337.4 | 188.2 | 22 | 88 | 27 |
| Norfentanyl | 233.3 | 84.1 | 18 | 54 | 18 |
| Internal Standard | Parent Mass | Product Mass | Collision Energy | Tube Lens | Source Fragmentation |
|---|---|---|---|---|---|
| Midazolam – D4 | 330.3 | 295.2 | 26 | 132 | 33 |
| 1-OH MDZ – D4 | 346.3 | 203.2 | 26 | 112 | 25 |
| Dexmedetomidine -D4 | 205.3 | 99.2 | 18 | 56 | 18 |
| Morphine -D3 | 289.3 | 152.2 | 55 | 98 | 35 |
| Hydromorphone-D6 | 292.3 | 185.2 | 31 | 105 | 37 |
| M3G-D3 | 465.4 | 289.3 | 30 | 110 | 14 |
| M6G-D3 | 465.4 | 289.3 | 32 | 139 | 33 |
| Fentanyl-D5 | 342.5 | 188.2 | 23 | 88 | 35 |
| Norfentanyl-D5 | 238.3 | 84.2 | 18 | 54 | 20 |
2.3. Preparation of Stock Solution, and Calibration and Quality Control Standards:
Stock solutions were prepared in mobile phase (90% [0.15% formic acid in water] with 10% [Acetonitrile]). Stock solution (A) contained 10 μg/mL of M3G, M6G, and 1-OH MDZ. Stock solution (B) contained 2.5 μg/mL of midazolam, morphine, and hydromorphone. Stock solution (C) contained 0.1 μg/mL of dexmedetomidine, fentanyl, and norfentanyl. The stocks were further diluted with mobile phase to make intermediate stocks prior to making standards by spiking in 100 μL of plasma to contain all nine analytes. Internal standards were also prepared in mobile phase in one working solution prior to precipitation to achieve at the concentrations of: (M3G-d3, M6G-d3, 1-OH MDZ-d4, midazolam-d4, morphine-d3, hydromorphone-d6, fentanyl-d5, norfentnayl-d5: 0.4 ng/mL), (dexmedetomidine-d4: 0.004 ng/mL). Quality Control standards (lowest limit of quantification (LLOQ), lowest calibrator (LC), middle calibrator (MC), and highest calibrator (HC)) were prepared by spiking human plasma at the following concentrations (in ng/mL): (M3G, M6G, 1-OH MDZ: LLOQ-5.0, LC-15, MC-60, HC-400), (midazolam, morphine, hydromorphone: LLOQ-0.5, LC-1.5, MC-30, HC-100), and (dexmedetomidine, fentanyl, norfentanyl: LLOQ-0.05, LC-0.15, MC-0.6, HC-6.0). Calibration ranges were selected based on previously published pediatric clinical studies. All stocks, calibration, and quality control standards were kept in storage at −80 °C until use.
2.4. Sample Processing:
Standards and quality control samples containing all analytes in 100 μL of plasma were prepared before the start of the validation process. Quality controls and standards were made independently from each other, using different lots of plasma and separate stocks. 500 μL of precipitation solution (acetonitrile with Internal Standard) was added to each QC and standard vial. All standards and QCs were then centrifuged at (room temperature, 12,000 × g) for 8 min. Supernatant was then collected and dried down at 38 °C with nitrogen flow until dry and reconstituted each with 75 μL of starting condition of mobile phase and vortexed. Samples are then centrifuged using the previously mentioned setting and 7.5 μL was injected for analysis.
2.5. Assay Development and Optimization
2.5.1. Mass Spectrometry
Analytes were prepared independently in mobile phase at 5 μg/mL and infused into the mass spectrometer at a flow rate of 200 μL/min. Parameters were optimized to obtain the parent ion and its product ion from fragmentations (See Supplemental Material, Section A). We optimized parameters for the highest intensities of mass spectrometry transitions and incorporated the most intense fragmentation into the instrument method (See Supplemental Material, Section C). We found this to be optimal for selectively and specificity when measuring multiple analytes simultaneously at the same time.
2.5.2. Chromatography
The nine analytes have significantly different physiochemical properties that impacted assays development. To elute the hydrophilic (M3G, M6G, morphine, hydromorphone) and hydrophobic (midazolam, 1-OH MDZ, dexmedetomidine, fentanyl, norfentanyl) analytes within a short injection time of 10 minutes, numerous of optimization experiments were performed (flow rate, gradient, injection volume). A C18 column was selected because all analytes are able to bind as long as gradient conditions were reflective of their polarity properties. Gradient and flow rate were optimized to conditions that provided the largest separation between M3G & M6G, as well as morphine and hydromorphone. The initial conditions of 95% A and 5% B to a 25% A and 75% B gave the best separation to baseline of these analytes.
2.5.3. Extraction and sample preparation
We developed a double protein precipitation method that is simple to execute with minimal costs to measure all analytes in a single preparation. This was optimal versus solid phase and liquid-liquid extraction approaches which may have required parallel methods to extract these analytes that have varying hydrophilic/hydrophobic properties. We found acetonitrile to be the best agent for protein precipitation with less noise when compared to methanol. Reconstitution in the acidic mobile phase removed any protein that may have been left behind, and allows for a clean injection to be placed into the instrument.
2.6. Assay Validation:
2.6.1. Calibration and Linearity
Calibration and linearity were determined following the FDA Bioanalytical Method Validation Guidance for Industry (May 2018, FDA-2013-D-1020). A nine-point curve of plasma-based standards were run in duplicate with the LLOQ ran in triplicate for three days. Concentration was determined by plotting the area ratios (absolute peak area of analyte / absolute peak area of internal standard for specific analyte) corresponding to each standard’s nominal concentration with (1/Y) weighting for all analytes.
2.6.2. Accuracy and Precision
QC samples of four concentration levels: LLOQ, LC, MC and HC, were used for accuracy and precision determination. Twelve replicates of each level for every analyte were ran on day one while six replicates were run on days two and three. Accuracy was defined as % deviation of the average calculated concentration against the nominal concentration of each analyte. Intra-day and Inter-day accuracy and precision was determined from the averages, standard deviations, and % CV (coefficient of variation) of all replicates.
2.6.3. Selectivity and Specificity
Six lots of plasma from different donors were analyzed in triplicate for potential interference of endogenous components. Response from plasma spiked with LLOQ were compared to response from the individual blank lots. Blank and zero calibrators were also compared to evaluate if there is interference between the internal standards and analytes.
2.6.4. Carry-over
To determine carry over, six vials of mobile phase was placed after the highest concentrated standards and HQC’s throughout the run. If an analyte was detected, it was reported as a percentage of the area of the LLOQ signal for said analyte. Carry-over criteria was defined by FDA guidance document if analyte signal area was >20% of LLOQ.
2.6.5. Dilution Analysis (Precision and Accuracy)
A sample with concentration twice as high as the highest calibrant was prepared of all analytes. This sample was then diluted with plasma by a factor of 2, 3, 5, or 10. Each dilution factor was evaluated with five replicates. Back calculations to determine analyte concentrations were conducted using the generated curves and multiplying by the appropriate dilution factor.
2.6.6. Bench top Stability
The stability of samples was evaluated at two different concentration levels (LC and HC). Three replicates of each concentration level in plasma were left out on the bench top at room temperature while being exposed to fluorescent light for four hours. Replicates were processed after two and four hours, and compared to their nominal concentration values.
2.6.7. Stability after Three Freeze/Thaw Cycles
Three replicates of LC and HC were stored at −80 °C and went through three freeze/thaw cycles. After each freeze/thaw (24 hours), they were processed and analyzed against their nominal concentrations.
2.6.8. Stability of Analytes Post-Processing
Vials of LC and HC were evaluated in triplicate for their stability initially and were then left at 10 °C in the autosampler. After 24 hours they were injected and analyzed again and the process was repeated for a 72-hour timepoint. Calculated concentrations were compared to nominal values to determine if they remain stable after post processing.
2.6.9. Recovery
Recovery of all analytes were assessed in triplicate through both post extracted spike LC, MC, and HC to their extracted counterpart. Post extracted spike is defined as processing blank plasma (from five different lots) and adding the analytes in the 75μL reconstituted mobile phase after dry down but before the second centrifugation.
2.6.10. Quantitative Matrix Effect
LC, MC, and HC were prepared in triplicate in water instead of plasma and followed the protein precipitation extraction process. Back calculated concentration values were then calculated and used to calculate matrix effect.
2.7. Method Application:
This UPLC-MS/MS method was used to measure these analytes in an Institutional Review Board-approve, multi-site, clinical study (NICHD 1R01HD099284) evaluating the pharmacokinetics of sedatives and analgesics and its relationship to delirium severity and occurrence in critical care pediatric patients.
3. RESULTS AND DISCUSSION:
3.6. Calibration and Linearity
All analytes achieved linearity with the following ranges: (M3G, M6G, 1-OH MDZ: 5 to 500 ng/mL), (Midazolam, Morphine, Hydromorphone: 0.5 to 125 ng/mL), and (dexmedetomidine, fentanyl, norfentanyl (0.05–7.5 ng/mL). The correlation coefficient (r) was greater than 0.9965 and curves were calculated using a (1/Y) weighting factor for linear regression analysis (See Supplemental Materials, Section D & E). All analytes in standards exceeded the 10:1 signal to noise ratios. The LLOQ for each analyte were less than 20% for inter and intraday accuracy and precision (bias and RSD respectively), while all other standards were less than 15%. This meets the FDA recommended guidelines for analytical assays (Bioanalytical Method Validation Guidance for Industry, May 2018).
3.7. Accuracy and Precision
As per FDA recommended guidelines, four levels were used to assess accuracy (% bias) and precision (% RSD). The levels consisted of: LLOQ, LC, MC, HC. The intraday and inter day accuracy and precision were remarkable for all analytes. All analytes meet FDA criteria of LLOQ <20% while other QCs were <15% (Table 2).
Table 2:
Accuracy (%bias) and Precision (RSD) for Quality Controls: HC, MC, LC, and LLOQ
| Analyte | QC Level | Concentration (ng/mL) | Intra-day | Inter-day | ||
|---|---|---|---|---|---|---|
| % Bias | RSD | % Bias | RSD | |||
| Midazolam | LLOQ | 0.50 | 4.2 | 5.4 | 6.0 | 5.5 |
| LC | 1.5 | −10.8 | 2.7 | −9.0 | 4.2 | |
| MC | 30 | −4.6 | 4.2 | −7.1 | 4.6 | |
| HC | 100 | −0.2 | 8.7 | −2.3 | 8.2 | |
| 1-OH MDZ | LLOQ | 5 | −0.1 | 6.1 | −0.2 | 6.3 |
| LC | 15 | −10.3 | 1.8 | −9.3 | 4.9 | |
| MC | 60 | −4.4 | 5.0 | −4.6 | 4.1 | |
| HC | 400 | −2.6 | 11.8 | −2.8 | 8.1 | |
| Dexmedetomidine | LLOQ | 0.05 | −1.0 | 9.4 | −2.7 | 7.6 |
| LC | 0.15 | −12.2 | 2.4 | −10.2 | 3.8 | |
| MC | 0.60 | 2.9 | 6.3 | −0.8 | 7.5 | |
| HC | 6.00 | −0.3 | 7.2 | −3.3 | 7.1 | |
| Morphine | LLOQ | 0.50 | 8.2 | 5.0 | 9.6 | 4.4 |
| LC | 1.50 | −11.1 | 3.1 | −9.3 | 5.8 | |
| MC | 30 | −4.9 | 2.6 | −7.6 | 4.0 | |
| HC | 100 | −3.2 | 7.2 | −4.5 | 6.7 | |
| Hydromorphone | LLOQ | 0.50 | 5.2 | 5.9 | 8.6 | 5.9 |
| LC | 1.50 | −10.3 | 4.0 | −7.7 | 5.9 | |
| MC | 30 | −2.0 | 3.6 | −4.7 | 4.3 | |
| HC | 100 | 0.3 | 6.6 | −3.2 | 7.0 | |
| M3G | LLOQ | 5 | −0.1 | 6.6 | 1.5 | 5.0 |
| LC | 15 | −13.9 | 0.9 | −12.0 | 3.6 | |
| MC | 60 | −4.2 | 2.7 | −8.3 | 4.5 | |
| HC | 400 | −2.5 | 7.0 | −5.4 | 7.1 | |
| M6G | LLOQ | 5 | 2.2 | 5.0 | 0.7 | 4.3 |
| LC | 15 | −12.1 | 2.3 | −10.6 | 3.8 | |
| MC | 60 | −2.3 | 2.7 | −5.7 | 4.2 | |
| HC | 400 | −1.9 | 7.8 | −3.5 | 7.8 | |
| Fentanyl | LLOQ | 0.05 | −0.2 | 8.3 | −2.9 | 8.5 |
| LC | 0.15 | −10.7 | 3.3 | −8.5 | 6.8 | |
| MC | 0.60 | −2.6 | 6.8 | −2.8 | 5.9 | |
| HC | 6.00 | −3.4 | 7.9 | −4.2 | 8.0 | |
| Norfentanyl | LLOQ | 0.05 | 2.6 | 8.0 | 2.2 | 6.7 |
| LC | 0.15 | −12.9 | 5.2 | −9.8 | 4.9 | |
| MC | 0.60 | 1.4 | 4.9 | −4.1 | 6.0 | |
| HC | 6.00 | 2.3 | 6.9 | −1.6 | 8.1 | |
3.8. Selectivity and Specificity
All six individual lots did not have any chromatographic peaks at the retention times of the measured analytes. Therefore, the criteria of having the signal in blanks be less than <20% of LLOQ response was meet. There were no interference peaks observed from the internal standards when comparing the blanks to zero calibrators.
3.9. Dilution Integrity
Dilution integrity assessment was performed to assess clinical samples that exceed the standard curve, dilution. We found that across all dilution factors, the accuracy and precision criteria set by the FDA was met. All analytes had a % bias of less than 14.4% and a % RSD of less than 8.8%.
3.10. Matrix Effect, Recovery, and Carryover
To determine percent recovery, the value of the extracted QC was compared to the post spike concentration. It was then reported as a percentage. All analytes had greater than 88% recovery with the exception of M3G and M6G (Table 3), for which 53–68% recovery was observed. Similarly, a matrix effect (dividing the post spike QC back calculated concentration by the water extracted counterpart concentration) was only observed for M3G and M6G (Table 3). Those analytes showed signific matrix enhancement of 28–65%. The matrix effect and decreased % recovery may be attributed to the high polarity nature of these metabolites, causing poor retention on the non-polar C18 column. However, we do not believe this negatively impact the measurement of M3G and M6G in clinical samples since the standards are consistently experiencing the same matrix effect and all levels of QCs pass consistently. Figure 1 shows LC of analytes with robust signal and clear separation of peaks thus allowing confidence in measurement (See supplemental Materials, section A for internal standards). No significant carryover was detected for dexmedetomidine, hydromorphone, morphine, M3G, M6G, fentanyl and Norfentanyl. Minor carryover was detected for midazolam and 1-OH MDZ, however they still met validation criteria of less than 20% of LLOQ. During assay development we saw significant carryover from the hydrophobic analytes. To reduce this, we lowered highest standard of midazolam, morphine, and hydromorphone to 125 ng/mL and increased wash to two additional minutes in the gradient. We do expect some clinical samples to exceed the higher end of the midazolam curve, however we plan to dilute those samples and repeat the analysis.
Table 3:
Matrix effect and % Recovery for Sedatives in human plasma
| Analyte | QC Level | Concentration (ng/mL) | Aqueous Sample (ng/mL) | Extracted Sample (ng/mL) | Post Extracted Sample (ng/mL) | % Matrix Effect | % Recovery |
|---|---|---|---|---|---|---|---|
| Midazolam | LC | 1.5 | 1.3 | 1.4 | 1.3 | 101.6 | 108.0 |
| MC | 30 | 27.9 | 26.8 | 27.6 | 98.9 | 97.4 | |
| HC | 100 | 102.9 | 103.1 | 106.1 | 103.2 | 97.3 | |
| 1-OH MDZ | LC | 15 | 15.6 | 14.9 | 16.0 | 102.3 | 93.2 |
| MC | 60 | 61.7 | 56.2 | 59.0 | 95.7 | 95.6 | |
| HC | 400 | 424.0 | 405.2 | 437.2 | 103.3 | 92.7 | |
| Dexmedetomidine | LC | 0.15 | 0.16 | 0.14 | 0.16 | 98.4 | 90.5 |
| MC | 0.60 | 0.64 | 0.55 | 0.62 | 97.0 | 88.6 | |
| HC | 6.00 | 6.03 | 5.81 | 5.52 | 91.5 | 105.3 | |
| Morphine | LC | 1.5 | 1.5 | 1.5 | 1.5 | 100.0 | 100.1 |
| MC | 30 | 31.1 | 27.0 | 28.0 | 90.2 | 96.5 | |
| HC | 100 | 106.3 | 99.6 | 111.4 | 104.8 | 89.4 | |
| Hydromorphone | LC | 1.5 | 1.6 | 1.5 | 1.6 | 95.9 | 96.4 |
| MC | 30 | 29.8 | 27.0 | 28.8 | 96.8 | 93.8 | |
| HC | 100 | 107.0 | 96.8 | 100.7 | 94.2 | 96.2 | |
| M3G | LC | 15 | 17.0 | 13.8 | 25.2 | 147.8 | 55.1 |
| MC | 60 | 64.5 | 54.9 | 104.8 | 162.3 | 53.1 | |
| HC | 400 | 418.4 | 386.4 | 693.7 | 165.8 | 56.0 | |
| M6G | LC | 15 | 16.6 | 14.3 | 21.3 | 128.0 | 67.6 |
| MC | 60 | 67.3 | 53.9 | 97.0 | 144.2 | 55.7 | |
| HC | 400 | 430.0 | 401.5 | 659.3 | 153.4 | 61.0 | |
| Fentanyl | LC | 0.15 | 0.16 | 0.15 | 0.16 | 100.2 | 93.1 |
| MC | 0.60 | 0.65 | 0.58 | 0.63 | 96.5 | 92.0 | |
| HC | 6.00 | 6.03 | 6.17 | 5.52 | 91.6 | 111.8 | |
| Norfentanyl | LC | 0.15 | 0.17 | 0.15 | 0.16 | 93.2 | 94.7 |
| MC | 0.60 | 0.68 | 0.54 | 0.59 | 87.7 | 90.7 | |
| HC | 6.00 | 6.00 | 5.92 | 5.73 | 95.9 | 103.4 |
Figure 1.
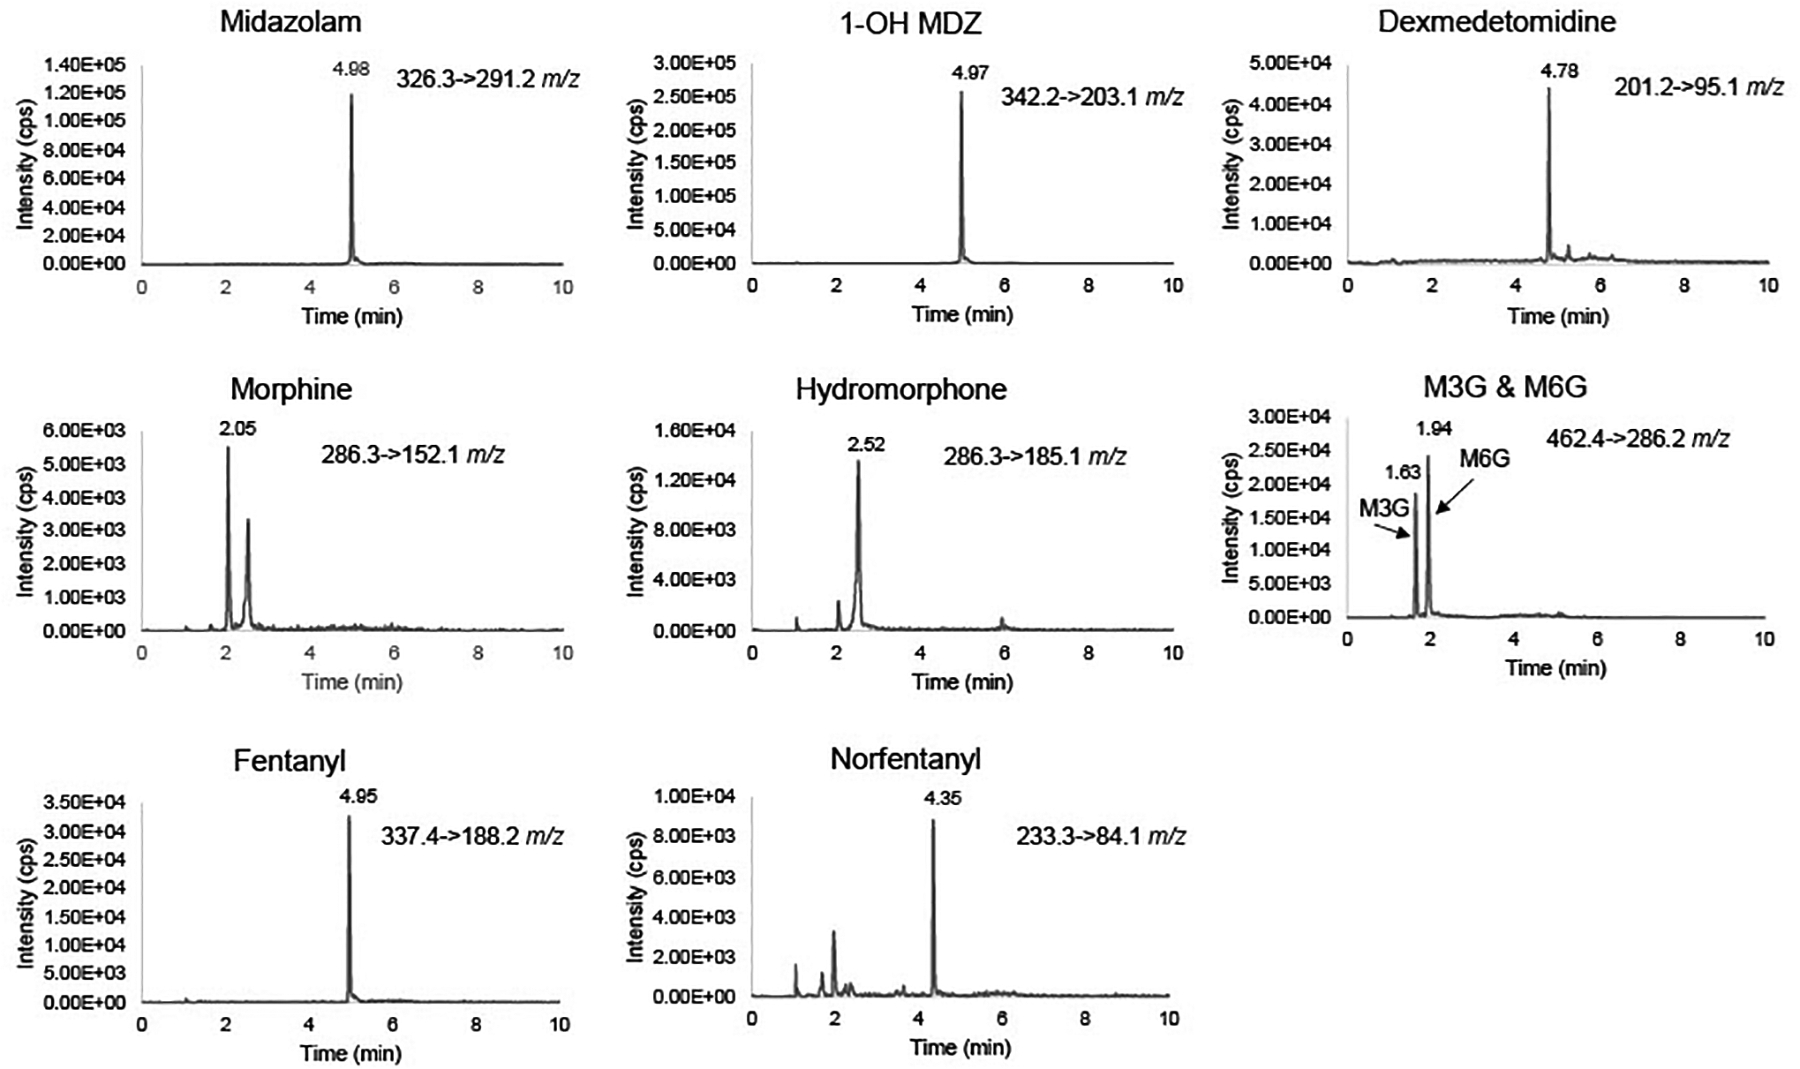
Representative chromatograms of sedatives at the lowest calibration quality standards (midazolam, morphine, hydromorphone: 1.5 ng/mL), (1-OH MDZ, M3G, M6G: 5 ng/mL), (dexmedetomidine, fentanyl, norfentanyl, 0.15 ng/mL).
3.11. Stability
Stability for bench top, freeze thaw, and autosampler was assessed for all analytes using LQC and HQC levels. As seen in Table 4, analytes in plasma were stable after three freeze thaw cycles and on bench top for up to 4 hours at LQC and HQC levels. Samples were also stable in the autosampler at 10 °C up to 72 hours with no significant changes in response in analytes and their respective internal standards (See Supplemental Materials, Section F). All stability tests had analytes measurements were within 15% of nominal QC concentrations (Table 4), thus showing stability in all.
Table 4:
Stability for sedatives in human plasma
| Analyte | QC Level | Concentration (ng/mL) | 4-hour Bench Top | Freeze-Thaw (After 3 cycles) | Autosampler (72 hours) | |||
|---|---|---|---|---|---|---|---|---|
| % Of Target | RSD | % Of Target | RSD | % Of Target | RSD | |||
| Midazolam | LC | 1.5 | 103.1 | 7.0 | 103.3 | 5.9 | 90.5 | 2.4 |
| HC | 100 | 99.0 | 4.1 | 107.4 | 4.3 | 96.3 | 7.8 | |
| 1-OH MDZ | LC | 15 | 101.3 | 1.0 | 100.2 | 0.5 | 87.8 | 3.9 |
| HC | 400 | 101.0 | 5.1 | 105.9 | 2.6 | 100.1 | 8.8 | |
| Dexmedetomidine | LC | 0.15 | 96.4 | 6.0 | 96.9 | 3.7 | 89.6 | 3.0 |
| HC | 6.00 | 94.6 | 4.7 | 109.6 | 5.9 | 97.9 | 2.0 | |
| Morphine | LC | 1.5 | 95.0 | 8.3 | 99.6 | 5.2 | 90.0 | 1.6 |
| HC | 100 | 99.9 | 2.3 | 109.8 | 4.7 | 96.5 | 6.3 | |
| Hydromorphone | LC | 1.50 | 96.6 | 3.8 | 97.4 | 1.6 | 93.3 | 5.5 |
| HC | 100 | 102.4 | 1.8 | 109.4 | 3.8 | 98.9 | 6.3 | |
| M3G | LC | 15 | 94.2 | 3.3 | 91.7 | 0.5 | 104.2 | 1.6 |
| HC | 400 | 102.1 | 1.7 | 106.9 | 2.5 | 97.3 | 9.9 | |
| M6G | LC | 15 | 98.4 | 2.7 | 97.5 | 6.4 | 98.7 | 6.7 |
| HC | 400 | 103.5 | 1.8 | 102.9 | 8.2 | 104.0 | 7.8 | |
| Fentanyl | LC | 0.15 | 91.8 | 4.9 | 103.8 | 6.5 | 92.3 | 1.7 |
| HC | 6.00 | 98.4 | 1.7 | 109.8 | 2.9 | 99.0 | 4.2 | |
| Norfentanyl | LC | 0.15 | 88.9 | 4.4 | 96.0 | 0.4 | 87.0 | 1.4 |
| HC | 6.00 | 101.9 | 2.7 | 109.0 | 4.4 | 103.7 | 8.7 | |
3.12. Clinical Application
The assay successfully measured sedatives in plasma from pediatric patients in a multisite delirium study. All clinical samples from seven patients fell within assay ranges with the exception that 20% of samples containing midazolam were over twice the highest calibrator and were reprocessed with dilution. We do not see this as an issue since we are able to dilute the samples up 10x, and therefore will be able to measure high clinically relevant sedative concentrations. Figure 2 show assay utility in measuring all analytes through three patients’ sedatives concentration vs time curves.
Figure 2.

Concentration-time curves of each analyte represented by three different critically-ill children.
4. CONCLUSIONS:
This validated UPLC MS/MS method can measure commonly used analgesics, sedatives and their metabolites in 100 μL of plasma. Measuring both hydrophilic and hydrophobic analytes in the same assay with a single preparation and injection of samples, conserves the limited plasma available from pediatric patients. The assay is simple, efficient, and very sensitive compared to other methods that have been published previously. The novel method has applications for drug concentration measurement in pharmacokinetic modeling, patient outcome associations, adverse event monitoring, dosing optimization studies, forensic analysis, and drug screening. This assay is currently being applied in a multisite clinical pharmacokinetic study that seeks to understand concentration-outcome relationships in critically ill children.
Supplementary Material
Highlights:
UPLC-MS/MS method for measurement of sedatives and their metabolites in plasma.
The FDA-validated assay is very sensitive, simple, and efficient.
Assay requires minimal plasma volume of 100 μL.
Successfully applied in a multi-site clinical study in pediatric patients.
FUNDING SOURCES:
This work is funded by NICHD 1R01HD099284-01(PI: Empey/Bell/Traube), NIH TL1 TR001858 (PI: Kraemer, Kevin) and NIH S10OD028540 (PI: Nolin, Thomas).
REFERENCES:
- [1].Elzagallaai AA, Greff M, Rieder MJ, Adverse Drug Reactions in Children: The Double-Edged Sword of Therapeutics, Clin Pharmacol Ther 101(6) (2017) 725–735. [DOI] [PubMed] [Google Scholar]
- [2].Sultana J, Cutroneo P, Trifirò G, Clinical and economic burden of adverse drug reactions, J Pharmacol Pharmacother 4(Suppl 1) (2013) S73–7. [DOI] [PMC free article] [PubMed] [Google Scholar]
- [3].Lisha J, Annalakshmi V, Maria J, Padmini D, Adverse Drug Reactions in Critical Care Settings: A Systematic Review, Curr Drug Saf 12(3) (2017) 147–161. [DOI] [PubMed] [Google Scholar]
- [4].Polasek TM, Shakib S, Rostami-Hodjegan A, Precision dosing in clinical medicine: present and future, Expert Review of Clinical Pharmacology 11(8) (2018) 743–746. [DOI] [PubMed] [Google Scholar]
- [5].Cox S, Bergman J, Hawkins S, Sladky K, Development of a method for the determination of hydromorphone in plasma by LC-MS, Biomed Chromatogr 32(12) (2018) e4357. [DOI] [PubMed] [Google Scholar]
- [6].Cui W, Liu Q, Xiong S, Qiao L, LC-MS/MS Method for Simultaneous Quantification of Dexmedetomidine, Dezocine, and Midazolam in Rat Plasma and Its Application to Their Pharmacokinetic Study, J Anal Methods Chem 2018 (2018) 3184759. [DOI] [PMC free article] [PubMed] [Google Scholar]
- [7].Rochani A, Lam E, Tanjuakio J, Hirose H, Kraft WK, Kaushal G, Simultaneous quantitative LC-MS method of ketamine, midazolam and their metabolites (dehydronorketamine, norketamine and 1hydroxymidazolam) for its application in patients on extracorporeal membrane oxygenation (ECMO) therapy, J Pharm Biomed Anal 178 (2020) 112947. [DOI] [PMC free article] [PubMed] [Google Scholar]
- [8].Szerkus O, Struck-Lewicka W, Kordalewska M, Bartosińska E, Bujak R, Borsuk A, Bienert A, Bartkowska-Śniatkowska A, Warzybok J, Wiczling P, Nasal A, Kaliszan R, Markuszewski MJ, Siluk D, HPLC-MS/MS method for dexmedetomidine quantification with Design of Experiments approach: application to pediatric pharmacokinetic study, Bioanalysis 9(4) (2017) 395–406. [DOI] [PubMed] [Google Scholar]
- [9].Tang F, Bada H, Ng CM, Leggas M, Validation of a HPLC/MS method for simultaneous quantification of clonidine, morphine and its metabolites in human plasma, Biomed Chromatogr 33(7) (2019) e4527. [DOI] [PMC free article] [PubMed] [Google Scholar]
- [10].Moorthy GS, Jogiraju H, Vedar C, Zuppa AF, Development and validation of a sensitive assay for analysis of midazolam, free and conjugated 1-hydroxymidazolam and 4-hydroxymidazolam in pediatric plasma: Application to Pediatric Pharmacokinetic Study, J Chromatogr B Analyt Technol Biomed Life Sci 1067 (2017) 1–9. [DOI] [PMC free article] [PubMed] [Google Scholar]
- [11].Moorthy GS, Vedar C, Moorthy AS, Prodell JL, Zuppa AF, An improved ultra-high-performance liquid chromatography-tandem mass spectrometric method for the quantitation of dexmedetomidine in small volume of pediatric plasma, Biomed Chromatogr 33(6) (2019) e4487. [DOI] [PubMed] [Google Scholar]
- [12].Lee JI, Su F, Shi H, Zuppa AF, Sensitive and specific liquid chromatography-tandem mass spectrometric method for the quantitation of dexmedetomidine in pediatric plasma, J Chromatogr B Analyt Technol Biomed Life Sci 852(1–2) (2007) 195–201. [DOI] [PubMed] [Google Scholar]
- [13].Inoue K, Sakamoto T, Fujita Y, Yoshizawa S, Tomita M, Min JZ, Todoroki K, Sobue K, Toyo’oka T, Development of a stable isotope dilution UPLC-MS/MS method for quantification of dexmedetomidine in a small amount of human plasma, Biomed Chromatogr 27(7) (2013) 853–8. [DOI] [PubMed] [Google Scholar]
- [14].Liu HC, Sun W, Wang CY, Ying WY, Zheng LD, Zeng RF, Wang Z, Ge RS, Determination of dexmedetomidine in children’s plasma by ultra-performance liquid chromatography tandem mass spectrometry and application to pharmacokinetic study, J Chromatogr B Analyt Technol Biomed Life Sci 1023–1024 (2016) 30–5. [DOI] [PubMed] [Google Scholar]
- [15].Ahsman MJ, van der Nagel BC, Mathot RA, Quantification of midazolam, morphine and metabolites in plasma using 96-well solid-phase extraction and ultra-performance liquid chromatography-tandem mass spectrometry, Biomed Chromatogr 24(9) (2010) 969–76. [DOI] [PubMed] [Google Scholar]
- [16].Ghassabian S, Moosavi SM, Valero YG, Shekar K, Fraser JF, Smith MT, High-throughput assay for simultaneous quantification of the plasma concentrations of morphine, fentanyl, midazolam and their major metabolites using automated SPE coupled to LC-MS/MS, J Chromatogr B Analyt Technol Biomed Life Sci 903 (2012) 126–33. [DOI] [PubMed] [Google Scholar]
Associated Data
This section collects any data citations, data availability statements, or supplementary materials included in this article.