

Abstract
Mucociliary clearance is an important phenomenon inside the respiratory system as a first defensive mechanism against pathogens. Therefore, any assumption considered for the mucociliary clearance and affects its functionality must be validated. The present research deals with the effects of boundary conditions on the movement of upper-convected Maxwell and high viscosity Newtonian mucus layers, numerically. Furthermore, the validity of replacing the viscoelastic mucus layer with a high viscosity Newtonian layer is evaluated. The airway surface liquid layer is considered a two-layer model including non-Newtonian mucus and Newtonian periciliary layers. Four cyclic boundary conditions are imposed at the mucus-periciliary interface as the cilia movement to obtain variations of mucociliary clearance. The upper boundary of the mucus layer is also exposed to different shear stress levels including free slip, cough, and sneeze conditions. By investigation of velocity variations inside mucus and periciliary layers, it is concluded the differences between viscoelastic and Newtonian mucus are not negligible. The maximum velocity differences between the two fluids are more than 52% and 215% during cough and sneeze, respectively. The results show there is a high order of dependency between the relaxation time and the imposed boundary conditions at the mucus-periciliary interface that leads to the invalidation of replacing two fluids with each other. Moreover, the results show substituting the viscoelastic mucus with a high viscosity Newtonian one depends on the mucus-periciliary interface boundary condition. If an independent time-varying boundary condition is used, the substitution leads to an error less than 7% under different shear stress levels. However, time-varying boundary condition shows 38% and 88% differences between high viscosity Newtonian and viscoelastic mucus layers. Furthermore, neglecting the recovery stroke leads to a velocity underestimation up to 50% by substituting viscoelastic mucus with a high viscosity Newtonian one. Therefore, replacing the viscoelastic mucus with a high viscosity Newtonian one is not acceptable for numerical simulations.
Introduction
The protective airway surface liquid (ASL) is a composition of two different fluids in which one of the fluids moves over the other one. The lower layer is a Newtonian fluid such as water called the periciliary layer and the other is a non-Newtonian mucus [1]. The mucus layer has different structures in the microscopic and macroscopic scales, low viscous fluid and non-Newtonian one, respectively [2]. The movement of the ASL layer is due to different mechanisms [3], however, the main mechanism is the cilia beating [4, 5]. Cilia beat inside the periciliary layer [6] and transport the mucus layer toward the stomach [mucociliary clearance (MCC)] [4, 5]. MCC is an important defensive mechanism against pathogens and harmful particles like viruses which has two major components: cilia and mucus. Cilia beating consists of two different effective and recovery strokes [7]. In the effective stroke, the tips of cilia attach the mucus layer and move it toward the posterior part of the nasopharynx [1], while they bend and detach the mucus layer and move back in the recovery stroke [8]. Therefore, this kind of cilia beating pattern causes a one-way movement of the mucus layer.
The complex structure of the ASL layer attracted much attention to evaluating the characteristics of the mucus and periciliary layers [1, 7, 9–14]. Physiological and biological investigations of the ASL layer have been conducted over 60 years. Some experimental studies investigated the ASL layer characteristics by simulating the mucus flow using cylindrical cultures [8, 10, 15–17]. Vasquez et al. [14] evaluated the velocity variation of the mucus-air interface inside a cylinder using Newtonian and viscoelastic mucus layers. They replaced the cilia movement with a rotational disk at the bottom plate. The experimental results showed the optimal viscosity value was 12 Pa s to replace the viscoelastic mucus with a high viscosity Newtonian one [18]. Inspired by biological discoveries, different mathematical models [19–27] and numerical simulations [9, 11, 28] were applied to specify the details of the ASL layer affected by different conditions. Mathematical models were developed to explore the main mechanisms of the MCC [29, 30]. The creation of metachronal waves using cilia beating patterns, stability of metachronal waves, the efficiency of MCC, and the force generation factor of the cilium were the targets of mathematical models. Some primitive mathematical models were developed based on the motion of the motile body (cilia) without considering the effects of fluid flow on the cilia [20, 27, 31, 32]. To this end, the movements of different creatures including polychaete worm [33] and sea-urchin spermatozoa were investigated [27, 34]. However, mathematical modeling of the cilia by considering the effects of fluid flow was related to another line of studies [4, 19, 26, 35, 36] called the resistance theory [7].
Numerical simulations were performed to obtain more details about the MCC process. Variations of the MCC process under the influence of drugs [1] and diseases [28], different mucus fluids [11, 12, 14, 17, 28, 37, 38], and cilia beating frequency [11, 17, 39, 40] were investigated by researchers. The effects of cystic fibrosis were investigated by Chatelin et al. [28] as a common disease numerically and experimentally. Cystic fibrosis was a genetic disease that alters MCC [41] by preventing normal hydration of mucus [28]. Cystic fibrosis led to the reduction and enhancement of surface liquid volume and mucus accumulation in the airway system, respectively [42]. Furthermore, viscoelastic [11, 14, 17], Power-Law [28], and Newtonian [12, 14] fluids were used as the mucus to evaluate the MCC process. Cilia beating frequency was another important factor for MCC [7, 11, 12, 43]. Numerical simulations illustrated the increment of the cilia beating frequency affected the rate of mucus flow greatly and was in linear relation with the MCC rate [11]. The effects of metachronal waves were also reviewed on the interaction between cilia and ASL layer to develop comprehensive multilayer models for the rate of MCC [44, 45].
The rate of MCC is determined using the saccharin test [12]. The importance of MCC variations affected by different nasal cavities was evaluated by some researchers [43, 46–48]. It was concluded a 3D shell surface models led to a closer prediction of MCC rate against the experimental data [12]. Cilia beating propelled the ASL layer with an average velocity of 5 mm min−1 inside the respiratory airways [49, 50]. Therefore, the inertia terms could be neglected and Stokes equations solved for the mucus flow. For numerical simulations, the ASL layer was modeled as a single-layer [12, 14, 51–53] or a two-layer [11, 17, 54–56] models based on hypotonic-defensin and modern hypotheses, respectively. The cilia movement was also replaced with continuous oscillating functions (sine or cosine) at the lower boundary of the periciliary layer. However, the real boundary condition is not a continuous oscillating function and also should be applied at the interface of the mucus-periciliary layer [1, 7, 14, 56]. Due to the low dynamic viscosity of air, free slip condition was always used at the mucus-air interface [8, 10, 13, 16, 17, 57].
Nowadays, most researchers deal with Covid-19 effects on the respiratory system [58–61]. The interaction between defensive organs of the body and Covid-19 is investigated to specify the impacts of Covid-19 on the human body [61]. The ASL layer is known as the first protective mechanism for trapping pathogens and harmful particles [60]. The body protects the organs against pathogens by producing immunoglobulin A as mucosal immunity [62].
Although many efforts have been made to study the functionality of the mucus layer, an important point in recent researches is the use of Newtonian fluid as mucus, while it is a viscoelastic fluid. Furthermore, some factors including type of mucus-periciliary interface stimulation and shear stress levels due to sneeze and cough strongly affect the velocity field of the mucus layer. Therefore, the validity of replacing the viscoelastic mucus layer with a high viscosity Newtonian layer should be evaluated. In the present study, two different cases Newtonian/Newtonian and viscoelastic/Newtonian are used to specify characteristics of the ASL layer. The upper-convected Maxwell (UCM) fluid is used as the viscoelastic mucus layer. Numerical simulations are performed using flow between two parallel plates in which the upper boundary of the mucus layer is exposed to free slip, cough, and sneeze conditions. Although the presence of the cilia is neglected inside the periciliary layer, the effects of cilia motion are replaced with four velocity profiles at the mucus-periciliary interface. The cyclic boundary conditions are continuous cyclic effective stroke, discrete constant effective and recovery strokes, discrete cyclic effective stroke along with constant recovery stroke, and the continuous constant effective stroke. The frequencies of velocity profiles are considered equal to 15 Hz (T = 1/15 s) and 30 Hz (T = 1/30 s) based on the cilia beating frequency [63–65]. For the viscoelastic mucus layer, the effects of relaxation time (λ) are examined on the velocity variation. Relaxation time is a characteristic time to show the combination of elastic and viscous properties [66]. Figure 1 indicates the configuration of our numerical model. In this research, the following subjects are investigated:
Evaluating the validity of replacing the viscoelastic mucus with a high viscosity Newtonian one under different mucus-periciliary interface motions and different shear stress levels at the upper boundary of the mucus layer.
Investigating velocities of both viscoelastic and Newtonian mucus layers under different shear stress levels at the upper boundary of the mucus layer due to sneeze and cough.
Investigating viscoelastic mucus flow direction during sneeze and cough.
Investigating the dependency between the relaxation time and the imposed boundary conditions at the mucus-periciliary interface.
Fig. 1.

Modeling of the MCC structure with two infinite parallel plates. a Upper airway system, b nasal cavity, c mucus layers
Governing equations
Incompressible unsteady Navier–Stokes equations that govern the fluid flow can be expressed as follows [67]:
| 1 |
| 2 |
where u is the velocity vector, t is time, ρ denotes density, σ is the Cauchy stress tensor, div indicates the divergence of a tensor or a vector, and is the material derivative. The Cauchy stress tensor is defined as [67]:
| 3 |
in which I is the unit tensor, τ is the extra stress tensor, and p denotes the pressure. In the present study, two different types of Newtonian and viscoelastic fluids are evaluated for the mucus layer. For the incompressible Newtonian fluid, τ is defined by [67]:
| 4 |
and, for the incompressible viscoelastic upper-convected Maxwell fluid τ is investigated by the following constitutive equation [67]:
| 5 |
where λ is the characteristic time constant so-called relaxation time, η is the dynamic viscosity of the fluid which is equal to 12 Pa s [18], and D is the deformation rate tensor determined by [67]:
| 6 |
where L is the velocity gradient. The symbol in Eq. (5) is the objective upper-convected time derivative can be expressed as [67]:
| 7 |
The following flowchart (Fig. 2) shows how to deal with the governing equations. Please note that the highlighted part is controlled by PIMPLE algorithm [68].
Fig. 2.

The procedure to deal with the governing equations
Physiology of the ASL layer
Mucosa has a polymeric structure and composes of two adjacent different fluids [11]. The lower fluid provides a one-way movement condition for the upper fluid through cilia rhythmic back and forth movement [4, 5]. High adhesion of upper fluid causes trapping pathogens and viruses and transfers them toward the posterior of the nasopharynx. The ASL thickness is 15 µm [43], which 67% relates to the height of the periciliary layer [1] and the rest belongs to the thickness of the mucus layer [12]. Mucus layer is a composition 2–3% glycoproteins and proteins, 1% mineral, 1% lipids, 0.02% DNA and 95% water [69, 70]. The body secretes about 0.5–1 ml cm−2 mucus over 24 h at a resting rate which moves at the velocity of 5–10 mm min−1 toward the esophagus [49, 50, 71, 72]. The mucus secretion depends on the density of goblet cells which is in the range of 5700–11,000 cells per ml [73]. Extra secretion of mucus through goblet cells due to allergenic factors or cold wards off pathogens and harmful particles outward the body via nostrils or mouth. This phenomenon is called Rhinorrhoea [74] and occurs owing to the disability of cilia in transferring extra mucus toward the stomach. Moreover, the mucosa contains disinfectant enzymes such as lysozyme which play an important role in destroying microbes [75]. Frequently, the effects of MCC (microscopic scale) are neglected on the airflow (macroscopic scale) for the numerical simulations inside the airway system [76, 77].
Boundary conditions
To simulate mucus flow between two parallel plates a no-slip boundary condition is set on the bottom plate. Free shear stress and atmospheric pressure conditions are set on the top plate and outlet boundary, respectively. Furthermore, different velocity profiles are imposed at the mucus-periciliary interface. Figure 3 shows different velocity profiles that are exerted on the interface.
Fig. 3.

Different velocity profiles exert on the mucus-periciliary interface. a Continuous constant effective stroke. b Discrete constant effective and recovery strokes. c Continuous cyclic effective stroke. d Discrete cyclic effective stroke along with constant recovery stroke
Velocity profile (a) is an effective stroke with constant velocity. This profile is considered as a permanent contact between the mucus layer and cilia without the recovery stroke.
To investigate the effects of recovery stroke on the movement of the mucus layer, a combination of effective and recovery strokes is evaluated [velocity profile (b)].
Gradual contact between the mucus layer and cilia is following the real movement of cilia [velocity profile (c)] [14]. However, the effect of recovery stroke is neglected to determine differences between velocity profiles (a) and (c).
Adding the recovery stroke to velocity profile (c) turns it into a complete pattern of cilia movement [velocity profile (d)]. Figure 4 shows different times to extract velocity variations of the ASL layer.
Fig. 4.

Different times to extract velocity variations of ASL layer
Figure 5 shows the configuration of the computational domain for numerical simulations along with boundary conditions.
Fig. 5.

Parallel plates with L/Dh = 100 along with boundary conditions
Numerical procedures
2-D unsteady incompressible Navier–Stokes equations are used for numerical simulation of mucus flow. The creeping flow of the ASL layer leads to the use of the central scheme for convection terms. To store flow variables the arrangement of a collocated grid is used [78, 79]. The multi-grid method along with the PIMPLE algorithm is used to increase the convergence rate of the equations and coupling of velocity–pressure, respectively. Moreover, the time step size is set to 10−5 to control the courant number less than one during the numerical simulations. The end of the simulations is set to reach the steady-state condition, and the residuals for flow variables are less than 10−9 in the convergence state. OpenFOAM 7 packages are used for numerical simulations.
To choose the suitable grid size and examine grid discretization uncertainty, the grid convergence index (GCI) is evaluated [80]. The maximum value of the GCI factor was less than 2% for the grid size of 5 × 10⁴ all over the computational domain for velocity variations.
Results and discussion
In the present study, two different Newtonian/Newtonian and viscoelastic/Newtonian cases are investigated. Velocity variations inside the ASL layer affected by different shear stress levels on the upper boundary of the mucus layer are discussed as results. Moreover, the assumption of substituting the viscoelastic mucus layer with a high viscous Newtonian layer is evaluated for further numerical simulations. All numerical simulations are performed for 5 s equivalent to 75 and 150 cycles for 15 Hz and 30 Hz cilia beating frequencies, respectively, and the results are presented for the last cycle. A validation study against the available data in Ref. [81] is shown in Fig. 6. As can be seen by increasing and decreasing the mucus layer height too much, the mucociliary clearance velocity reduces. The maximum difference between the present numerical simulation and the reference data is lower than 0.007%.
Fig. 6.
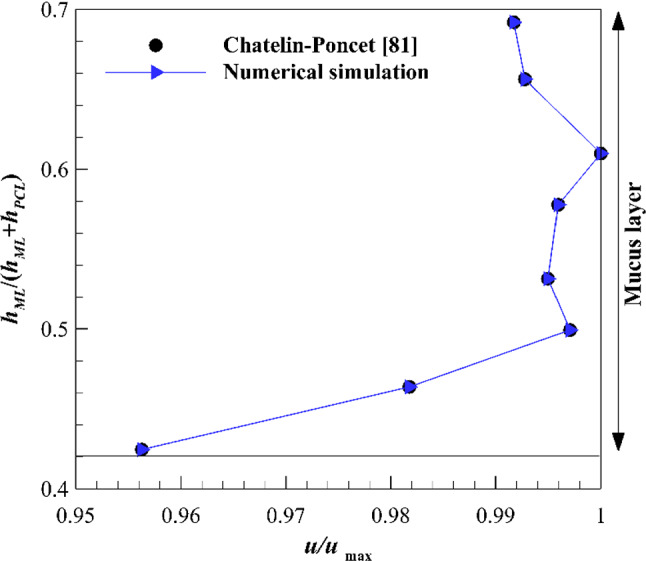
Validation of numerical results against the available data
Newtonian/Newtonian
In the primary case, the non-Newtonian mucus layer is substituted with a high viscosity Newtonian fluid. The optimal value of the dynamic viscosity is 12 Pa s to substitute the viscoelastic mucus layer with a Newtonian one [18].
The velocity variations inside the ASL layer are shown in Fig. 7 under the influence of constant effective stroke [velocity profile (a)] and free shear stress on the upper boundary of the mucus layer. The high viscosity of the Newtonian mucus layer and its low thickness lead to a high diffusion rate of interface velocity variations all over the mucus layer. Therefore, the velocity gradient is close to zero, and velocity distribution is nearly uniform inside the mucus layer. While the viscosity of the periciliary fluid (0.001 Pa s) is much smaller than the mucus viscosity (12 Pa s) and causes the low diffusion rate inside the periciliary layer and a linear velocity distribution is obtained. In the effective stroke, the effects of advection terms are negligible against diffusion terms due to the slight mucus flow between two infinite plates. Furthermore, there is sufficient time for the mucus flow to adjust the changes from the interface using the constant effective stroke.
Fig. 7.

Velocity variations of the ASL layer using velocity profile (a) along with free shear stress on the upper boundary of the mucus layer
The effects of recovery stroke on the velocity variations are investigated by applying velocity profile (b) at the interface of two layers (Fig. 8). When the interface is encountered zero velocity suddenly, both mucus and periciliary layers experience a sudden stop. The sudden stop is imposed on the whole mucus volume that moves at the same velocity with the interface at t/T ≤ 4/8 experience in contrast to the periciliary layer. The velocity inside the periciliary layer increases from zero to the interface velocity linearly (see Fig. 7) due to the fixed-bottom plate constraint and the periciliary low viscosity. Therefore, the sudden stop is only imposed on a part of the periciliary layer volume and both layers cease at a similar rate. In the recovery stroke, the interface velocity is zero, so the effects of advection terms are negligible against diffusion terms similar to the effective stroke.
Fig. 8.

Velocity variations of ASL layer using velocity profile (b) in the recovery stroke at different times along with free shear stress on the upper boundary of the mucus layer
Figure 9 shows velocity variations inside the ASL layer by imposing velocity profile (c) on the interface. By using the gradual effective stroke [velocity profile (c)], continuous velocity variation leads to inadequate time for the flow to adjust the interface variation. Therefore, the velocity distribution is neither uniform nor linear in the mucus and periciliary layers, respectively. On the other hand, the accelerating rate from t/T = 0 to t/T = 1/8 and decelerating rate from t/T = 3/8 to t/T = 4/8 are more than the accelerating rate from t/T = 1/8 to t/T = 2/8 and decelerating rate from t/T = 2/8 to t/T = 3/8, velocity variations inside ASL layer at t/T = 1/8 and t/T = 3/8 are more than velocity variation at t/T = 2/8. Differences between velocity variations at t/T = 1/8 and t/T = 3/8 relate to acceleration and deceleration at these times. At t/T = 1/8 interface velocity accelerates toward higher velocities at t/T = 2/8 (maximum velocity), then decelerates from t/T = 2/8 toward lower velocities at t/T = 3/8. Moreover, diffusion terms do not have enough time to propagate throughout the layers at the same rate as interface velocity variations. Therefore, at t/T = 1/8 and t/T = 3/8 velocities are lower and higher than interface velocity, respectively.
Fig. 9.

Velocity variations of ASL layer using velocity profile (c) affected by free shear stress on the upper boundary of mucus layer at different times
By adding recovery stroke to the gradual effective stroke [velocity profile (d)], both layers cease rapidly (Fig. 10) similar to Fig. 8. The rate of mucus cessation using recovery stroke of velocity profile (d) is more than recovery stroke of velocity profile (b). Because the mucus velocity tends to zero before entering the recovery stroke using the velocity profile (d). The similar deceleration rates of both layers are related to cessations of the whole mucus volume and a part of the periciliary volume under zero interface velocity.
Fig. 10.
Velocity variations of ASL layer using velocity profile (d) in the recovery stroke at different times along with free shear stress on the upper boundary of the mucus layer
Viscoelastic/Newtonian
To substitute a high viscosity Newtonian fluid with the viscoelastic one, the upper-convected Maxwell fluid is used. In this section, velocity variations of the mucus layer are only discussed, because the velocity variation of the periciliary fluid is the same as its velocity variation in the previous section.
Figure 11 indicates the effects of relaxation time variations on the mucus layer velocity under free shear stress at the mucus upper boundary and constant effective stroke [velocity profile (a)] at the bottom. By increasing the relaxation time (increasing Deborah number) fluid elasticity increases and the changes from the interface propagate with a phase shift throughout the mucus layer [66]. Maximum differences of the velocity fields for λ = 1, 5, and 10 are 3.5, 7, and 0.5%, respectively, which are negligible. Therefore, the velocity variations inside the mucus layer are independent of the relaxation time when there is enough time to adjust the interface velocity. The differences are calculated based on interface velocity [Eq. (8)].
| 8 |
Fig. 11.

Velocity variations of mucus layer using velocity profile (a) along with free shear stress on the upper boundary of mucus layer using different relaxation times
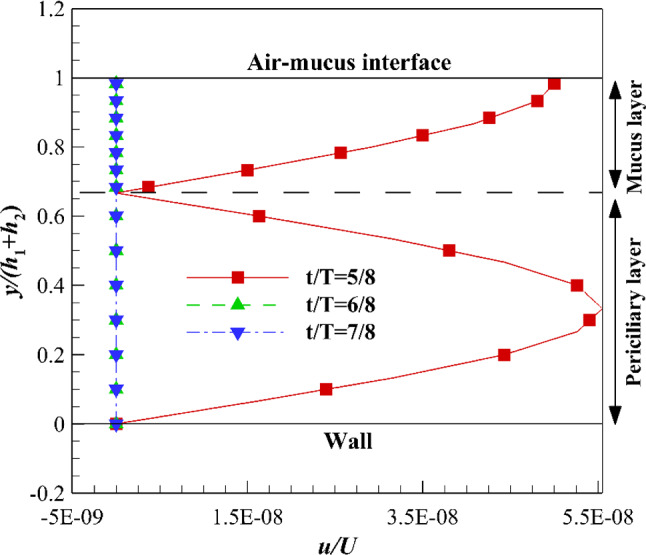
Velocity profile (b) is imposed on the lower boundary of the mucus layer to investigate the effects of elasticity on the velocity variations (Fig. 12). In contrast to velocity profile (a), the characteristic time of the process is so small (T = 1/15 s) using velocity profile (b), and the elasticity effects are clarified on the velocity variations. By increasing the relaxation time (increasing the elasticity), the response time of the flow reduces to the changes from the interface. It means flow reacts against the interface velocity variations with a larger phase shift than the lower relaxation time. Therefore, both λ = 5 and λ = 10 experience the interface velocity variations later than the λ = 1 at the beginning (Fig. 10a, t/T = 1/8). However, the flow has sufficient time to adjust the interface velocity variations over time (Fig. 12b, c) with different elasticities. Therefore, the velocity differences are reduced between different relaxation times over time but the location and the value of the maximum difference between velocities change continuously due to different elasticities (different relaxation times). Diagrams of the velocity variations inside the mucus layer could be divided into three different parts which are summarized in Table 1.
Fig. 12.

Velocity variations of mucus layer using velocity profile (b) affected by free shear stress on the upper boundary of mucus layer using different relaxation times. a t/T = 1/8, b t/T = 2/8, c t/T = 3/8, d t/T = 5/8, e t/T = 6/8, f t/T = 7/8
Table 1.
Division of velocity profile into three different regions
| Different regions | Ranges |
|---|---|
| Region close to the interface (A) | |
| Middle region (B) | |
| Region close to the upper plate (C) |
In region A, the effects of elasticities are not sensible (very close to the interface) and the flow responds to the changes from the interface at an acceptable rate. The transfer rate of interface velocity variations to the flow reduces by increasing the distance from the interface. Therefore, the phase changes happen at a greater distance from the interface (Regions B and C). In the effective stroke (Fig. 12a–c), the maximum differences in velocities occur at region B where the phase shift effects are obvious on the mucus layer velocity due to the interface velocity variations. In region C, the mucus flow is under the influence of velocity variation at the previous times due to the high delay of the flow in responding to the changes from the interface. Therefore, maximum differences in velocities occur in region C in the recovery stroke (Fig. 12d–f), but by the evolution of the mucus flow over time, the differences declined and tend to the region B (Fig. 12f). The maximum differences between velocities in both effective and recovery strokes at different times are given in Table 2. The differences are taken into account using Eq. (9).
| 9 |
Table 2.
Maximum differences between velocity profiles using profile (b) at different times (%)
| Different times | Effective stroke | Recovery stroke | ||
|---|---|---|---|---|
| Region B | Region C | Region B | Region C | |
| t/T = 1/8 | 10 | – | – | – |
| t/T = 2/8 | 5 | – | – | – |
| t/T = 3/8 | 8 | – | – | – |
| t/T = 5/8 | – | – | – | 10 |
| t/T = 6/8 | – | – | – | 4 |
| t/T = 7/8 | – | – | 5 | – |
Figure 13 shows the effects of gradual effective stroke [velocity profile (c)] on the mucus velocity variation over time. The frequency of velocity profile (c) (30 Hz) is twice the velocity profile (b) (15 Hz) frequency. Therefore, it is expected the mucus flow reaction to the changes from the interface reduces and differences between velocities increase. In other words, interface movement using velocity profile (c) is faster than velocity profile (b) and the flow cannot adapt to the interface velocity variations very well. Similar to profile (a) the effects of recovery stroke are neglected.
Fig. 13.

Velocity variations of mucus layer using velocity profile (c) affected by free shear stress on the upper boundary of mucus layer using different relaxation times. a t/T = 1/8, b t/T = 2/8, c t/T = 3/8
According to Fig. 13, there is no clear association between increased elasticity and velocity variations inside the mucus layer. In all three regions A, B, and C the effects of the elasticity are obvious but as mentioned before the maximum differences occur at a greater distance from the interface (regions B and C). Elasticity variations along with a continuous variation of interface velocity increase the limitation of flow adjustment with the changes from the interface. Therefore, the differences using velocity profile (c) are more than the differences using velocity profiles (a) and (b). The maximum differences between velocities are calculated using Eq. (9) given in Table 3.
Table 3.
Maximum differences between velocity profiles using profile (c) at different times (%)
| Different times | Effective stroke | |||||
|---|---|---|---|---|---|---|
| λ = 1 and λ = 5 | λ = 1 and λ = 10 | λ = 5 and λ = 10 | ||||
| Region B | Region C | Region B | Region C | Region B | Region C | |
| t/T = 1/8 | 7.1 | – | – | 18.6 | – | 24.3 |
| t/T = 2/8 | 8 | – | – | 15 | – | 18 |
| t/T = 3/8 | – | 9.3 | – | 21.4 | – | 25.7 |
Although the effects of acceleration and deceleration rates increase the differences between two times t/T = 1/8 and t/T = 3/8, the effects of elasticity are more significant. At both accelerating and decelerating phases, both regions A and B (closer to the interface) react to the interface velocity variations faster than region C. Therefore, the rate of velocity variations in regions A and B are smaller than velocity variations in region C (Table 3). The rate of velocity variation is in the highest order using velocity profile (c) due to its 30 Hz frequency so that the mucus layer cannot follow the interface velocity variation at an acceptable rate. Due to different phases of the mucus flow oscillation from the interface oscillation, regions B and C are encountered the highest variations.
Velocity profile (d) is imposed on the interface to investigate the effects of the complete pattern of cilia movement and elasticity on the velocity variation of the mucus layer. The frequency of velocity profile (d) is equal to 15 Hz. The lower frequency of velocity profile (d) than velocity profile (c) and the effects of recovery stroke provides more time for the mucus flow to adjust the interface velocity variation. Therefore, the trend of velocity variations is similar to Fig. 12 using velocity profile (d) (Fig. 14), but the maximum differences between velocities reduce over time. The differences in the velocity variations between t/T = 1/8 and t/T = 3/8 are related to different rates of acceleration and deceleration before these times. The mucus flow accelerates with a higher rate from t/T = 0 to t/T = 1/8 and decelerates with a lower rate from t/T = 2/8 to t/T = 3/8 than other times. Table 4 presents the maximum differences in the velocity variation over time.
Fig. 14.

Velocity variations of mucus layer using velocity profile (d) affected by free shear stress on the upper boundary of mucus layer using different relaxation times. a t/T = 1/8, b t/T = 2/8, c t/T = 3/8, d t/T = 5/8, e t/T = 6/8, f t/T = 7/8
Table 4.
Maximum differences between velocity profiles using profile (d) at different times (%)
| Different times | Effective stroke | Recovery stroke | ||
|---|---|---|---|---|
| Region B | Region C | Region B | Region C | |
| t/T = 1/8 | 8.6 | – | – | – |
| t/T = 2/8 | 7 | – | – | – |
| t/T = 3/8 | – | 5.7 | – | – |
| t/T = 5/8 | – | – | – | 5.5 |
| t/T = 6/8 | – | – | 2 | – |
| t/T = 7/8 | – | – | 3 | – |
By comparing the results of the velocity field using velocity profiles (b) (Fig. 12a–f) and (d) (Fig. 14a–f), the flow becomes independent from the relaxation times greater than 5 s. However, the results of the velocity field using velocity profiles (a) (Fig. 11) and (c) (Fig. 13a–c) show the flow dependency on different values of the relaxation time. Therefore, the velocity variations due to elasticity variations are in a high order of dependency on the type of stimulation imposed on the interface.
To clear the effects of frequency and recovery stroke on the mucus velocity over time, the velocity variations are investigated under the same relaxation time (λ = 10) using velocity profiles (c) and (d) (Fig. 15). λ = 10 is the optimal value of the relaxation time for the mucus layer in the single-mode [14]. According to Fig. 15a, the effects of the interface velocities are not transferred throughout the mucus layer over time and the velocity is constant approximately.
Fig. 15.

Velocity variations of mucus layer using different velocity profiles affected by free shear stress on the upper boundary of mucus layer at different times. a Velocity profile (c), b velocity profile (d)
The maximum velocity variation is in the range of 0.65 < u/U < 1 using velocity profile (c). However, the lower frequency of velocity profile (d) and the existence of recovery stroke provide more time for the flow to adjust changes from the interface. The maximum velocity variation is in the range of 0.1 < u/U < 1 using velocity profile (d). Therefore, the value of the frequency and recovery stroke have significant effects on the velocity variation.
According to the results, the substitution of viscoelastic mucus (λ = 10) with the high viscosity Newtonian fluid without considering the recovery stroke [velocity profile (c)] leads to a maximum error of more than 38%, while it is 88% in the presence of recovery stroke [velocity profile (d)]. It means neglecting the recovery stroke causes the underestimation of velocity up to 50%. The error is calculated using Eq. (10).
| 10 |
To estimate the effects of shear stress levels during cough and sneeze, a pipe with a diameter equal to the average diameter of a nasal cavity is used. The average diameter of the nasal cavity (1.6 cm) is obtained by the analysis of 460 CT scan images from the nostrils to the nasopharynx (Fig. 16). The images are spaced 0.5 mm with a resolution of 512 × 512 pixels and belong to a healthy Iranian 19-year-old female. During sneezing and coughing the maximum air velocity is 100 mph and 50 mph, respectively, based on the American Lung Association report. Therefore, the one-seventh velocity profile inside the pipe is used to evaluate the sneeze and cough shear stress levels. The shear stress levels are 1 and 2 Pa in coughing and sneezing, respectively, and imposed on the mucus upper boundary in an opposite direction than the mucus-periciliary interface movement.
Fig. 16.

Equivalent pipe with the nasal cavity
Figure 17 shows the differences between Newtonian and viscoelastic mucus layers for three different conditions including sneeze, cough, and free slip. According to Fig. 17a–c, different shear stress levels do not affect the Newtonian mucus velocity since it does not have the shear-thinning property of the mucus. On the other hand, mucus velocity experiences great variations when it is considered a viscoelastic UCM mucus. During both cough and sneeze the mucus velocity reduces but its direction can only change in sneezing. This is due to the mucus shear-thinning property against different shear stress levels. The differences between Newtonian and viscoelastic mucus layers are given in Table 5.
Fig. 17.

Velocity variations of mucus layer using velocity profile (c) under different shear stress levels on the upper boundary of mucus layer. a Free slip, b cough, c sneeze
Table 5.
Maximum differences between Newtonian and viscoelastic mucus layers using profile (c) at t/T = 2/8
| Shear stress | Error (%) |
|---|---|
| Free slip | 36 |
| Cough | 52 |
| Sneeze | 215 |
Concluding remarks
Velocity variations of mucus flow were investigated using two different mucus layers including a high viscosity Newtonian fluid and a viscoelastic UCM and the following results are obtained.
The high viscosity of the Newtonian mucus layer led to rapid propagation of changes from the interface throughout the mucus layer over time.
Different shear stress levels did not have any effects on the Newtonian mucus velocity.
Different cyclic motions of the mucus-periciliary interface [velocity profiles (b)–(d)] had significant effects on the viscoelastic mucus velocity field.
The elasticity variations did not have significant effects on the viscoelastic mucus velocity (7%) in the presence of independent time-varying boundary condition [velocity profile (a)].
By increasing the elasticity of the mucus layer, the flow did not have enough time to adjust the interface velocity, so the interface velocity is transferred into the mucus domain with a phase shift.
The maximum differences in velocities were 215% and 52% for sneezing and coughing, respectively, due to substituting viscoelastic mucus with a high viscosity Newtonian one.
In contrast to cough, the viscoelastic mucus flow direction was reversed under the influence of sneeze.
There was a high order of dependency between the relaxation time and the imposed boundary conditions at the mucus-periciliary interface that led to the invalidation of replacing viscoelastic mucus with a high viscosity Newtonian one.
Neglecting the recovery stroke caused the underestimation of velocity up to 50% using viscoelastic mucus.
Two opening subjects can be performed in the continuation of the present work. First, investigation of the interaction between described boundary conditions in the present work and the 5-mode nonlinear Giesekus mucus model to model mucus flow accurately. The second is substituting the zero recovery stroke with a nonzero one to consider the effect of separating cilia from the mucus layer.
Data Availability Statement
The datasets analyzed during the current study are available from the corresponding author on reasonable request.
References
- 1.Quraishi M, Jones N, Mason J. The rheology of nasal mucus: a review. Clin. Otolaryngol. Allied Sci. 1998;23(5):403–413. doi: 10.1046/j.1365-2273.1998.00172.x. [DOI] [PubMed] [Google Scholar]
- 2.Lai SK, et al. Micro-and macrorheology of mucus. Adv. Drug Deliv. Rev. 2009;61(2):86–100. doi: 10.1016/j.addr.2008.09.012. [DOI] [PMC free article] [PubMed] [Google Scholar]
- 3.Blake J. On the movement of mucus in the lung. J. Biomech. 1975;8(3–4):179–190. doi: 10.1016/0021-9290(75)90023-8. [DOI] [PubMed] [Google Scholar]
- 4.Blake JR. A spherical envelope approach to ciliary propulsion. J. Fluid Mech. 1971;46(1):199–208. doi: 10.1017/S002211207100048X. [DOI] [Google Scholar]
- 5.Brennen C. An oscillating-boundary-layer theory for ciliary propulsion. J. Fluid Mech. 1974;65(4):799–824. doi: 10.1017/S0022112074001662. [DOI] [Google Scholar]
- 6.Brennen C, Winet H. Fluid mechanics of propulsion by cilia and flagella. Annu. Rev. Fluid Mech. 1977;9(1):339–398. doi: 10.1146/annurev.fl.09.010177.002011. [DOI] [Google Scholar]
- 7.Xu L, Jiang Y. Mathematical modeling of mucociliary clearance: a mini-review. Cells. 2019;8(7):736. doi: 10.3390/cells8070736. [DOI] [PMC free article] [PubMed] [Google Scholar]
- 8.Lee W, et al. Muco-ciliary transport: effect of mucus viscosity, cilia beat frequency and cilia density. Comput. Fluids. 2011;49(1):214–221. doi: 10.1016/j.compfluid.2011.05.016. [DOI] [Google Scholar]
- 9.Chen X, et al. Effects of thermal airflow and mucus-layer interaction on hygroscopic droplet deposition in a simple mouth–throat model. Aerosol Sci. Technol. 2018;52(8):900–912. doi: 10.1080/02786826.2018.1476751. [DOI] [Google Scholar]
- 10.Lubkin D, Gaffney E, Blake J. A viscoelastic traction layer model of muco-ciliary transport. Bull. Math. Biol. 2007;69(1):289. doi: 10.1007/s11538-005-9036-x. [DOI] [PubMed] [Google Scholar]
- 11.Sedaghat M, et al. Effect of cilia beat frequency on muco-ciliary clearance. J. Biomed. Phys. Eng. 2016;6(4):265. [PMC free article] [PubMed] [Google Scholar]
- 12.Shang Y, Inthavong K, Tu J. Development of a computational fluid dynamics model for mucociliary clearance in the nasal cavity. J. Biomech. 2019;85:74–83. doi: 10.1016/j.jbiomech.2019.01.015. [DOI] [PubMed] [Google Scholar]
- 13.Smith D, Gaffney E, Blake J. Modelling mucociliary clearance. Respir. Physiol. Neurobiol. 2008;163(1–3):178–188. doi: 10.1016/j.resp.2008.03.006. [DOI] [PubMed] [Google Scholar]
- 14.Vasquez PA, et al. Modeling and simulation of mucus flow in human bronchial epithelial cell cultures—part I: idealized axisymmetric swirling flow. PLoS Comput. Biol. 2016;12(8):e1004872. doi: 10.1371/journal.pcbi.1004872. [DOI] [PMC free article] [PubMed] [Google Scholar]
- 15.Dillon RH, et al. Fluid dynamic models of flagellar and ciliary beating. Ann. N. Y. Acad. Sci. 2007;1101(1):494–505. doi: 10.1196/annals.1389.016. [DOI] [PubMed] [Google Scholar]
- 16.Mitran SM. Metachronal wave formation in a model of pulmonary cilia. Comput. Struct. 2007;85(11–14):763–774. doi: 10.1016/j.compstruc.2007.01.015. [DOI] [PMC free article] [PubMed] [Google Scholar]
- 17.Sedaghat M, et al. On the effect of mucus rheology on the muco-ciliary transport. Math. Biosci. 2016;272:44–53. doi: 10.1016/j.mbs.2015.11.010. [DOI] [PubMed] [Google Scholar]
- 18.Puchelle E, Zahm J, Quemada D. Rheological properties controlling mucociliary frequency and respiratory mucus transport. Biorheology. 1987;24(6):557–563. doi: 10.3233/BIR-1987-24606. [DOI] [PubMed] [Google Scholar]
- 19.Eloy C, Lauga E. Kinematics of the most efficient cilium. Phys. Rev. Lett. 2012;109(3):038101. doi: 10.1103/PhysRevLett.109.038101. [DOI] [PubMed] [Google Scholar]
- 20.Brokaw CJ. Microtubule sliding in swimming sperm flagella: direct and indirect measurements on sea urchin and tunicate spermatozoa. J. Cell Biol. 1991;114(6):1201–1215. doi: 10.1083/jcb.114.6.1201. [DOI] [PMC free article] [PubMed] [Google Scholar]
- 21.M. Lighthill, On waves generated in dispersive systems to travelling forcing effects, with applications to the dynamics of rotating fluids, in Hyperbolic Equations and Waves (Springer, 1970), pp. 124–152
- 22.Taylor GI. The action of waving cylindrical tails in propelling microscopic organisms. Proc. R. Soc. Lond. Ser. A Math. Phys. Sci. 1952;211(1105):225–239. [Google Scholar]
- 23.Brokaw C. Non-sinusoidal bending waves of sperm flagella. J. Exp. Biol. 1965;43(1):155–169. doi: 10.1242/jeb.43.1.155. [DOI] [PubMed] [Google Scholar]
- 24.H. Guo et al., Bistability in the Synchronization of Actuated Microfilaments (2017). arXiv:1708.02181
- 25.Cortez R, Fauci L, Medovikov A. The method of regularized Stokeslets in three dimensions: analysis, validation, and application to helical swimming. Phys. Fluids. 2005;17(3):031504. doi: 10.1063/1.1830486. [DOI] [Google Scholar]
- 26.Osterman N, Vilfan A. Finding the ciliary beating pattern with optimal efficiency. Proc. Natl. Acad. Sci. 2011;108(38):15727–15732. doi: 10.1073/pnas.1107889108. [DOI] [PMC free article] [PubMed] [Google Scholar]
- 27.Gueron S, Liron N. Ciliary motion modeling, and dynamic multicilia interactions. Biophys. J . 1992;63(4):1045–1058. doi: 10.1016/S0006-3495(92)81683-1. [DOI] [PMC free article] [PubMed] [Google Scholar]
- 28.Chatelin R, et al. Numerical and experimental investigation of mucociliary clearance breakdown in cystic fibrosis. J. Biomech. 2017;53:56–63. doi: 10.1016/j.jbiomech.2016.12.026. [DOI] [PubMed] [Google Scholar]
- 29.Fauci LJ, Dillon R. Biofluidmechanics of reproduction. Annu. Rev. Fluid Mech. 2006;38:371–394. doi: 10.1146/annurev.fluid.37.061903.175725. [DOI] [Google Scholar]
- 30.Lauga E, Powers TR. The hydrodynamics of swimming microorganisms. Rep. Prog. Phys. 2009;72(9):096601. doi: 10.1088/0034-4885/72/9/096601. [DOI] [Google Scholar]
- 31.Brokaw CJ. Bend propagation by a sliding filament model for flagella. J. Exp. Biol. 1971;55(2):289–304. doi: 10.1242/jeb.55.2.289. [DOI] [PubMed] [Google Scholar]
- 32.Machin K. Wave propagation along flagella. J. Exp. Biol. 1958;35(4):796–806. doi: 10.1242/jeb.35.4.796. [DOI] [Google Scholar]
- 33.Gray J. The kinetics of locomotion of Nereis diversicolor. J. Exp. Biol. 1939;23:101–120. doi: 10.1242/jeb.23.2.101. [DOI] [Google Scholar]
- 34.Gray J, Hancock G. The propulsion of sea-urchin spermatozoa. J. Exp. Biol. 1955;32(4):802–814. doi: 10.1242/jeb.32.4.802. [DOI] [Google Scholar]
- 35.Blake J. A model for the micro-structure in ciliated organisms. J. Fluid Mech. 1972;55(1):1–23. doi: 10.1017/S0022112072001612. [DOI] [Google Scholar]
- 36.Barton C, Raynor S. Analytical investigation of cilia induced mucous flow. Bull. Math. Biophys. 1967;29(3):419–428. doi: 10.1007/BF02476581. [DOI] [PubMed] [Google Scholar]
- 37.Sedaghat MH, et al. Nonlinear simulation of mucociliary clearance: a three-dimensional study. J. Nonnewton. Fluid Mech. 2022;300:104727. doi: 10.1016/j.jnnfm.2021.104727. [DOI] [Google Scholar]
- 38.Sedaghat MH, George UZ, Abouali O. A nonlinear viscoelastic model of mucociliary clearance. Rheol. Acta. 2021;60(6):371–384. doi: 10.1007/s00397-021-01274-4. [DOI] [Google Scholar]
- 39.Cicuta P. The use of biophysical approaches to understand ciliary beating. Biochem. Soc. Trans. 2020;48(1):221–229. doi: 10.1042/BST20190571. [DOI] [PMC free article] [PubMed] [Google Scholar]
- 40.George UZ, Pidaparti RM. Airway pressure gradient may decrease the beating amplitude of cilia. Front. Phys. 2019;7:157. doi: 10.3389/fphy.2019.00157. [DOI] [Google Scholar]
- 41.Farrell PM. The prevalence of cystic fibrosis in the European Union. J. Cyst. Fibros. 2008;7(5):450–453. doi: 10.1016/j.jcf.2008.03.007. [DOI] [PubMed] [Google Scholar]
- 42.Derichs N, et al. Hyperviscous airway periciliary and mucous liquid layers in cystic fibrosis measured by confocal fluorescence photobleaching. FASEB J. 2011;25(7):2325–2332. doi: 10.1096/fj.10-179549. [DOI] [PMC free article] [PubMed] [Google Scholar]
- 43.S. Gizurarson, The effect of cilia and the mucociliary clearance on successful drug delivery. Biol. Pharm. Bull. b14-00398 (2015) [DOI] [PubMed]
- 44.Snyder SH, Sklar PB, Pevsner JA. Molecular mechanisms of olfaction. J. Biol. Chem. 1988;263(28):13971–13974. doi: 10.1016/S0021-9258(18)68169-4. [DOI] [PubMed] [Google Scholar]
- 45.Hollenberg M. Mechanisms of receptor-mediated transmembrane signalling. Experientia. 1986;42(7):718–727. doi: 10.1007/BF01941517. [DOI] [PubMed] [Google Scholar]
- 46.Pires A, et al. Intranasal drug delivery: how, why and what for? J. Pharm. Pharm. Sci. 2009;12(3):288–311. doi: 10.18433/J3NC79. [DOI] [PubMed] [Google Scholar]
- 47.Corbo G, et al. Measurement of nasal mucociliary clearance. Arch. Dis. Child. 1989;64(4):546–550. doi: 10.1136/adc.64.4.546. [DOI] [PMC free article] [PubMed] [Google Scholar]
- 48.Chari S, et al. Computational analysis of a 3D mucociliary clearance model predicting nasal drug uptake. J. Aerosol Sci. 2021;155:105757. doi: 10.1016/j.jaerosci.2021.105757. [DOI] [Google Scholar]
- 49.Illum L. Nasal drug delivery—possibilities, problems and solutions. J. Control. Release. 2003;87(1–3):187–198. doi: 10.1016/S0168-3659(02)00363-2. [DOI] [PubMed] [Google Scholar]
- 50.Mistry A, Stolnik S, Illum L. Nanoparticles for direct nose-to-brain delivery of drugs. Int. J. Pharm. 2009;379(1):146–157. doi: 10.1016/j.ijpharm.2009.06.019. [DOI] [PubMed] [Google Scholar]
- 51.King M, Agarwal M, Shukla J. A planar model for mucociliary transport: effect of mucus viscoelasticity. Biorheology. 1993;30(1):49–61. [PubMed] [Google Scholar]
- 52.Satir P, Sleigh MA. The physiology of cilia and mucociliary interactions. Annu. Rev. Physiol. 1990;52(1):137–155. doi: 10.1146/annurev.ph.52.030190.001033. [DOI] [PubMed] [Google Scholar]
- 53.Sleigh M. The nature and action of respiratory tract cilia. Respir. Defense Mech. Part. 1977;1:247–288. [Google Scholar]
- 54.Ross S, Corrsin S. Results of an analytical model of mucociliary pumping. J. Appl. Physiol. 1974;37(3):333–340. doi: 10.1152/jappl.1974.37.3.333. [DOI] [PubMed] [Google Scholar]
- 55.Matar O, Craster R, Warner M. Surfactant transport on highly viscous surface films. J. Fluid Mech. 2002;466:85. doi: 10.1017/S0022112002001106. [DOI] [Google Scholar]
- 56.Zhu P-F, et al. Simulation study on the mass transport based on the ciliated dynamic system of the respiratory tract. Comput. Math. Methods Med. 2019;2019:012068. doi: 10.1155/2019/6036248. [DOI] [PMC free article] [PubMed] [Google Scholar]
- 57.Smith D, Gaffney E, Blake J. A model of tracer transport in airway surface liquid. Bull. Math. Biol. 2007;69(3):817–836. doi: 10.1007/s11538-006-9163-z. [DOI] [PubMed] [Google Scholar]
- 58.Zanin M, et al. The interaction between respiratory pathogens and mucus. Cell Host Microbe. 2016;19(2):159–168. doi: 10.1016/j.chom.2016.01.001. [DOI] [PMC free article] [PubMed] [Google Scholar]
- 59.Khashkhosha HK, Elhadi M. A hypothesis on the role of the human immune system in covid-19. Med. Hypotheses. 2020;143:110066. doi: 10.1016/j.mehy.2020.110066. [DOI] [PMC free article] [PubMed] [Google Scholar]
- 60.Sundararaman A, et al. Role of probiotics to combat viral infections with emphasis on COVID-19. Appl. Microb. Biotechnol. 2020;104:1–16. doi: 10.1007/s00253-020-10832-4. [DOI] [PMC free article] [PubMed] [Google Scholar]
- 61.Chowdhury MA, et al. Immune response in COVID-19: a review. J. Infect. Public Health. 2020;13:1619–1629. doi: 10.1016/j.jiph.2020.07.001. [DOI] [PMC free article] [PubMed] [Google Scholar]
- 62.Corthésy B. Multi-faceted functions of secretory IgA at mucosal surfaces. Front. Immunol. 2013;4:185. doi: 10.3389/fimmu.2013.00185. [DOI] [PMC free article] [PubMed] [Google Scholar]
- 63.Cornaz A-L, Buri P. Nasal mucosa as an absorption barrier. Eur. J. Pharm. Biopharm. 1994;40(5):261–270. [Google Scholar]
- 64.Ugwoke MI, Verbeke N, Kinget R. The biopharmaceutical aspects of nasal mucoadhesive drug delivery. J. Pharm. Pharmacol. 2001;53(1):3–22. doi: 10.1211/0022357011775145. [DOI] [PubMed] [Google Scholar]
- 65.Sanderson MJ, Sleigh MA. Ciliary activity of cultured rabbit tracheal epithelium: beat pattern and metachrony. J. Cell Sci. 1981;47(1):331–347. doi: 10.1242/jcs.47.1.331. [DOI] [PubMed] [Google Scholar]
- 66.Ma B, Wang Y, Kikker A. Analytical solutions of oscillating Couette–Poiseuille flows for the viscoelastic Oldroyd B fluid. Acta Mech. 2019;230(6):2249–2266. doi: 10.1007/s00707-019-02391-1. [DOI] [Google Scholar]
- 67.Oldroyd JG. On the formulation of rheological equations of state. Proc. R. Soc. Lond. Ser. A Math. Phys. Sci. 1950;200(1063):523–541. [Google Scholar]
- 68.Roohi E, Pendar M-R, Rahimi A. Simulation of three-dimensional cavitation behind a disk using various turbulence and mass transfer models. Appl. Math. Model. 2016;40(1):542–564. doi: 10.1016/j.apm.2015.06.002. [DOI] [Google Scholar]
- 69.Potter JL, et al. Studies on pulmonary secretions: II. Osmolality and the ionic environment of pulmonary secretions from patients with cystic fibrosis, bronchiectasis, and laryngectomy. Am. Rev. Respir. Dis. 1967;96(1):83–87. doi: 10.1164/arrd.1967.96.1.83. [DOI] [PubMed] [Google Scholar]
- 70.Matthews LW, et al. Studies on pulmonary secretions: I. The over-all chemical composition of pulmonary secretions from patients with cystic fibrosis, bronchiectasis, and laryngectomy. Am. Rev. Respir. Dis. 1963;88(2):199–204. doi: 10.1164/arrd.1963.88.2.199. [DOI] [PubMed] [Google Scholar]
- 71.Lale A, Mason J, Jones N. Mucociliary transport and its assessment: a review. Clin. Otolaryngol. Allied Sci. 1998;23(5):388–396. doi: 10.1046/j.1365-2273.1998.00173.x. [DOI] [PubMed] [Google Scholar]
- 72.Rusznak C, et al. The assessment of nasal mucociliary clearance and the effect of drugs. Respir. Med. 1994;88(2):89–101. doi: 10.1016/0954-6111(94)90020-5. [DOI] [PubMed] [Google Scholar]
- 73.Dalhamn T. Mucous flow and ciliary activity in the trachea of healthy rats and rats exposed to respiratory irritant gases (SO2, H3N, HCHO): a functional and morphologic (light microscopic and electron microscopic) study, with special reference to technique. Acta Physiol. Scand. Suppl. 1956;36(123):1. [PubMed] [Google Scholar]
- 74.Myon L, et al. Palatal necrosis due to cocaine abuse. Rev. Stomatol. Chir. Maxillofac. 2010;111(1):32. doi: 10.1016/j.stomax.2009.01.009. [DOI] [PubMed] [Google Scholar]
- 75.Singh PK, et al. A component of innate immunity prevents bacterial biofilm development. Nature. 2002;417(6888):552–555. doi: 10.1038/417552a. [DOI] [PubMed] [Google Scholar]
- 76.Bahmanzadeh H, et al. Numerical simulation of airflow and micro-particle deposition in human nasal airway pre-and post-virtual sphenoidotomy surgery. Comput. Biol. Med. 2015;61:8–18. doi: 10.1016/j.compbiomed.2015.03.015. [DOI] [PubMed] [Google Scholar]
- 77.Shang Y, Inthavong K, Tu J. Detailed micro-particle deposition patterns in the human nasal cavity influenced by the breathing zone. Comput. Fluids. 2015;114:141–150. doi: 10.1016/j.compfluid.2015.02.020. [DOI] [Google Scholar]
- 78.Round G. An explicit approximation for the friction factor-Reynolds number relation for rough and smooth pipes. Can. J. Chem. Eng. 1980;58(1):122–123. doi: 10.1002/cjce.5450580119. [DOI] [Google Scholar]
- 79.D. Flórez-Orrego et al. Experimental and CFD study of a single phase cone-shaped helical coiled heat exchanger: an empirical correlation, in Proceedings of the 25th International Conference on Efficiency, Cost, Optimization, Simulation and Environmental Impact of Energy Systems (2012).
- 80.Celik IB, Ghia U, Roache PJ. Procedure for estimation and reporting of uncertainty due to discretization in {CFD} applications. J. Fluids {Eng. Trans.} 2008;130(7):078001. doi: 10.1115/1.2960953. [DOI] [Google Scholar]
- 81.Chatelin R, Poncet P. A parametric study of mucociliary transport by numerical simulations of 3D non-homogeneous mucus. J. Biomech. 2016;49(9):1772–1780. doi: 10.1016/j.jbiomech.2016.04.009. [DOI] [PubMed] [Google Scholar]
Associated Data
This section collects any data citations, data availability statements, or supplementary materials included in this article.
Data Availability Statement
The datasets analyzed during the current study are available from the corresponding author on reasonable request.