Abstract
Variants in aminoacyl‐tRNA synthetases (ARSs) genes are associated to a broad spectrum of human inherited diseases. Patients with defective PheRS, encoded by FARSA and FARSB, display brain abnormalities, interstitial lung disease and facial dysmorphism. We investigated four children from two unrelated consanguineous families carrying two missense homozygous variants in FARSA with significantly reduced PheRS‐mediated aminoacylation activity. In addition to the core ARS‐phenotype, all patients showed an inflammatory profile associated with autoimmunity and interferon score, a clinical feature not ascribed to PheRS‐deficient patients to date. JAK inhibition improved lung disease in one patient. Our findings expand the genetic and clinical spectrum of FARSA‐related disease.
Keywords: ARSopathy, autoinflammation, FARSA
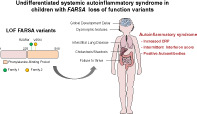
Undifferentiated systemic autoinflammatory syndrome in children with FARSA loss of function variants.

1. INTRODUCTION
Aminoacyl‐tRNA synthetases (ARSs) catalyse the loading of amino acids onto cognate transfer‐RNAs, an essential step for protein translation. They are ubiquitously expressed and highly evolutionarily conserved. 1 Thirty‐six ARSs exist: 16 function exclusively in the cytoplasm, 17 exclusively in mitochondria, and 3 in both compartments. 2 Variants in ARS genes result in a broad spectrum of human inherited diseases with recessive or dominant inheritance patterns. 1 , 2 While bi‐allelic variants in mitochondria‐localised ARS genes typically cause mitochondrial encephalopathy associated with myopathy and liver disease, deficiency in cytoplasm‐localised ARS genes cause a multisystem syndrome affecting primarily the lungs and the nervous system. 1 , 2
Cytosolic phenylanalyl‐tRNA synthetase PheRS is a heterotetramer of two FARSA subunits and two FARSB subunits. FARSA 3 , 4 and FARSB 4 , 5 , 6 defects were recently associated with a multisystem syndrome combining brain lesions, interstitial lung disease and facial dysmorphism. We report on additional four FARSA‐deficient patients a systemic inflammatory syndrome with autoimmune features, a pattern not ascribed in PheRS‐deficient patients to date.
2. METHODS
Methods are provided in the Supporting Information.
3. RESULTS
We investigated four patients from two unrelated consanguineous families. Clinical features are summarised in Table S1.
All patients displayed dysmorphic features, growth retardation, hypoalbuminemia (Figures S1 and 2). At birth, P1 and P2 presented with severe diarrhoea. Complete gastrointestinal work‐up did not reveal any abnormalities. All except P2 developed hepatomegaly. Liver biopsies revealed chronic portal hepatitis with moderate fibrosis and steatosis in P1 and P3 (Figure S2C).
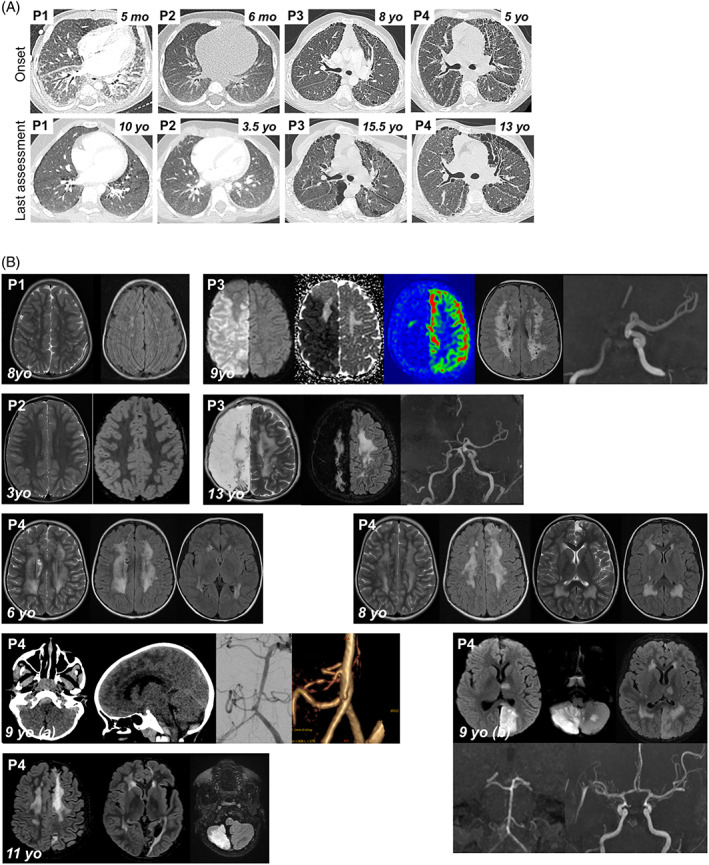
Cough, polypnea, digital clubbing (Figure S1B) started during the first months of life in P1 and P2. In P3‐P4, lung disease was only explored at the age of 6 and revealed severe interstitial lung disease (ILD) and fibrosis disease with chronic respiratory failure. Except in P2, all thoracic CT scan showed ILD that progressively evolved toward fibrosis (Figures 1A and S3). All patients had inflammatory bronchoalveolar lavage (Figure S2A) and polymorphic infiltrate and pulmonary interstitial/interalveolar cholesterol granulomas were found in P1 (Figure S2B) and P3 (not shown). Last pulmonary function tests for P1 and P4 showed a restrictive ventilatory defect with distension and reduced diffusing capacity.
FIGURE 1.

Clinical features of P1‐P4. (A) Pulmonary CT scan at disease onset and last assessment. P1: 5mo: Diffused ground glass opacities (GGO) with antero‐posterior density gradient and presence of sub‐pleural posterior consolidations. Thickening of interlobular septa in the lower lobes and of fissures; 10yo: Low‐density GGO, microcysts with subpleural distribution and along interlobular septa. P2: 6mo: normal; 3.5yo: Subpleural thickened interlobular septa in middle lobe. P3: 8yo: Mild pattern of fibrosing interstitial lung disease (ILD) with thickening, few cysts and no honeycombing; 15.5yo: confluence in large macrocysts. Pectus carinatum. P4: 5yo: Fibrosing ILD with thickening of intralobular lines, interlobular septa and fissures. Numerous subpleural microcysts with honeycombing especially in the left lung; 13yo: Fibrosis worsening with increase in size and number of cysts. Lung volumes are preserved despite worsening of thoracic deformation (pectus carinatum). (B) Brain MRIs. P1, 8yo: Bilateral punctiform subcortical and deep white matter hyperintensities on T2 weighted images (T2WI) and fluid‐attenuated inversion recovery (FLAIR) suggesting vascular leukoencephalopathy. P2, 3yo: Normal T2WI and FLAIR MRI. P3, 9yo: Acute right ischemic stroke: diffusion weighted imaging (DWI) hypersignal, decreased apparent diffusion coefficient, and decreased cerebral blood flow in arterial spin labelling in the middle and anterior cerebral artery territories. Time‐of‐flight MR angiogram showing occlusion of the terminal right internal carotid artery; bilateral diffuse subcortical and deep white matter hyperintensities on FLAIR images (chronic leukoencephalopathy). P3, 13yo: Leukoencephalomalacia resulting from extensive right hemisphere infarction, worsening of white matter changes on T2WI and FLAIR images. P4, 6yo: Bilateral diffuse deep white matter hyperintensities, with cavitation on T2WI and FLAIR images (chronic leukoencephalopathy). P4, 8yo: worsening of chronic leukoencephalopathy, and left frontal cortical atrophy, on T2WI and FLAIR images, suggestive of clinically asymptomatic ischemic injury. P4, 9yo: (A) Brain CT scan: Posterior fossa subarachnoid haemorrhage with ruptured aneurysm located on the right posterior inferior cerebellar artery. (B) 7 days later, acute stroke in vertebro‐basilar territory, including left cerebral posterior territory in DWI, secondary to diffuse vasospasm on Time‐of‐flight MR angiogram. P4, 11yo: Cortical and sub‐cortical ischemic sequelae of previous strokes within multiple arterial territories (left anterior cerebral artery, left posterior cerebral artery, cerebellum), worsening of diffuse white matter changes [Colour figure can be viewed at wileyonlinelibrary.com]
P1 and P2 reached normal developmental milestones, while P3 and P4 showed slight psychomotor delay in early infancy. Microcephaly was progressive (Figure S4) with normal initial brain MRI (Figure 1B). Follow‐up brain MRI showed vascular leukoencephalopathy, typically affecting bilateral watershed regions, without large artery abnormality in the Circle of Willis in P1, P3, P4, with progressive features of cavitating leukoencephalopathy at 8 years in P4. At 9 years, P3 presented with an extensive acute ischemic stroke related to right internal carotid artery occlusion. Subsequent right leukoencephalomalacia with unilateral brain atrophy developed, while severe vascular leukoencephalopathy progressed in the left hemisphere without intracranial large artery abnormality. At 9 years, P4 presented with a posterior fossa subarachnoid haemorrhage (SAH) related to a ruptured posterior inferior cerebellar artery aneurysm, complicated by cerebral infarction because of post‐SAH vasospasm.
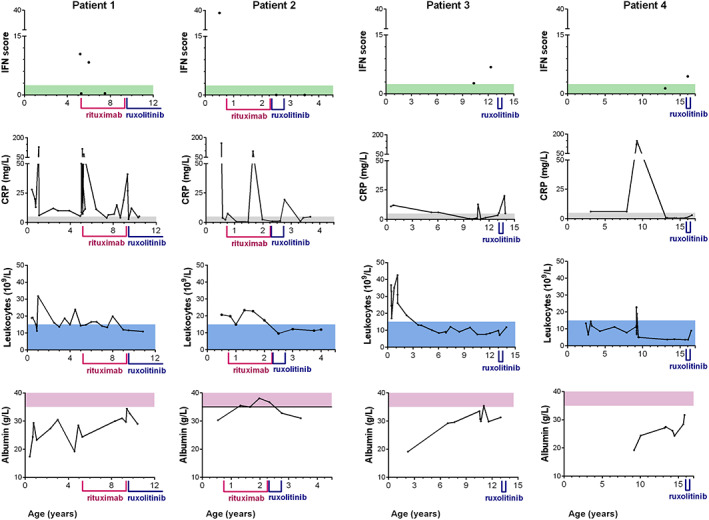
All patients displayed chronic inflammation with inflammatory manifestations. Since the first months of life, P1‐P3 presented chronic elevated C‐reactive protein (CRP) and leukocytosis without evidence of infections, associated with evidence of autoimmunity with positive rheumatoid factor, anti‐nuclear antibodies (ANA) and anti‐neutrophils cytoplasmic antibodies (ANCA). Chronic inflammation was not explored in P4 in early infancy in periods without infection. However, she displayed auto‐immune features with positive rheumatoid factor, ANA, and ANCA. Lymphocyte subsets were normal for all patients. In contrast, all patients displayed intermittent positive interferon (IFN) score with high serum levels of interferon‐α at least once, in absence of a detectable infection (Figure 2 and Table S1), which was also associated with increased IFN‐inducible chemokines (CCL2/CCL3) (only tested in P1–P2, Figure S5). From the age of 5, P1 presented with recurrent fever, associated once with aseptic osteomyelitis. Also, P1 developed diffuse intra‐alveolar haemorrhage (IAH) and was initially treated by pulse steroids between the ages of 2 and 5 years, which however did not prevent lung fibrosis (Figure 1A). Then, rituximab treatment allowed weaning off steroids. At 9 years, she relapsed with IAH, repeated respiratory infections, persistent exercise dyspnoea. Because of positive interferon score, JAK1/2 inhibitor (ruxolitinib) treatment was initiated at 11 years, with positive outcome. To prevent progression toward lung fibrosis, rituximab was started in P2 at 10 months. Treatment was switched to ruxolitinib at 2 years for 10 months but stopped because the appearance of alveolar proteinosis. Currently, he has not developed any IAH, and is not receiving any immunosuppressive treatment. When comparing chest CT scans of P1 and P2 at the same age, P2 showed less severe lung lesions, no sign of fibrosis, suggesting protection by the pre‐emptive treatment regimens (Figure S3). In P3 and P4, pulse steroid therapy was started at 13 and 11 years, respectively, without efficacy. Ruxolitinib was initiated in P3 and P4 at 15 and 12 years, respectively, but stopped after 6 months because of lack of efficiency, a result likely due to the already late stage pulmonary fibrosis observed in these patients.
FIGURE 2.

Biological markers in P1–P4. Follow up of interferon (IFN) score (normal <2.466); C‐reactive protein (CRP) (normal <5 mg/L); leukocytes (normal <15 × 109/L); albumin (normal >35 g/L) over time in P1–P4. Period of treatments by rituximab and ruxolitinib are indicated [Colour figure can be viewed at wileyonlinelibrary.com]
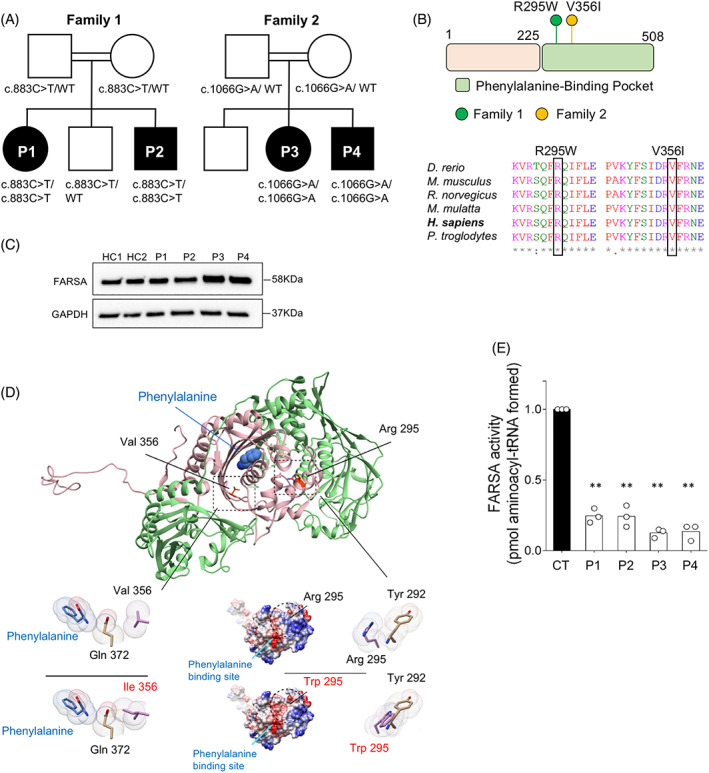
Whole exome sequencing identified homozygous missense variants in FARSA gene encoding phenylalanine‐tRNA synthetase α‐subunit: in P1–P2, NM_004461(FARSA):c.883C>T, p.R295W previously reported in a child who died at 1.3 years of age 4 and in P3–P4, a novel variant c.1066G>A, p.V356I (Figure 3A and Table S2). Sanger sequencing confirmed segregation of the variant in each family (Figure S6). Affected amino acids were highly conserved through evolution and scored as damaging by all prediction tools (Figure 3B).
FIGURE 3.

Autosomal recessive FARSA deficiency. (A) Familial segregation of c.883C>T (p.R295W) and c.1066G>A (p.V356I) variants. (B) Location and conservation status among orthologs of FARSA variants. (C) FARSA protein expression in EBV‐B cell lines from patients and controls (CT). (D) Human PheRS‐α is shown in pink, PheRS‐β in green and phenylalanine by sphere representation. Close‐up view of in silico mutagenesis of the p.V356I and p.R295W variants. Left panel: FARSA coulombic surface representation. Red surface indicates the lowest electrostatic potential energy, blue the highest. Location of the mutated residue and of the phenylalanine‐binding site are highlighted by a circle and a blue arrow, respectively. Right panel: close‐up view of in silico mutagenesis of the p.R295W variant. Van der Waals radii are represented for each atom; the mutated residues are displayed in pink. Orange stick indicates steric clash. (E) PheRS aminoacylation activity in cytosolic extract from EBV cell lines of patients and controls (CT). Activity is normalised to 1 in control extracts. Mean ± SD (n = 3); **, p < 0.005, two tailed t test [Colour figure can be viewed at wileyonlinelibrary.com]
FARSA encodes the 508‐amino acid α‐subunit of the PheRS complex and comprises an N‐terminal tRNA‐binding domain (residues 1–225) followed by the catalytic domain (Figure 3B). Western blot analysis in Epstein–Barr virus (EBV) transformed‐cell lines showed comparable levels of endogenous FARSA protein in patient cells and unrelated healthy controls (Figure 3C), suggesting that both variants did not impact FARSA stability but rather function. By forming a heterocomplex with the B subunit, FARSA conjugates phenylalanine to the cognate tRNA. Val356 is located in the deep phenylalanine‐binding pocket of the enzyme. Conformational analysis based on the crystal structure of FARSA 7 suggested that its replacement by the bulkier isoleucine resulted in a steric clash with Gln372, which interacts with the substrate phenylalanine, leading to local structural rearrangement of the phenylalanine‐binding pocket (Figure 3D). The Arg‐to‐Trp295 variant introduces a non‐charged and bulkier amino acid in a central α‐helix of the catalytic site (Helix4) that is close to the amino‐binding site (~11 Å), resulting in surface charge disruption and steric clashes, notably with Tyr292, likely affecting the α‐helix 6 which participates in the phenylalanine‐binding pocket (Figure 3D). Prediction of protein stability changes upon mutation using the Dynamut tool scored Val‐to‐Ile356 and Arg‐to‐Trp295 as energetically unfavourable and destabilising (ΔΔG = −0.6 kcal/mol; ΔΔG = −0.5 kcal/mol, respectively), overall indicating that those variants could possibly affect FARSA function.
Decreased phenylalanyl‐tRNA synthetase activity was detected in cytoplasmic extracts from EBV cell lines and/or fibroblasts derived from patients compared to control (Figures 3E and S7A). Compared to control (K m Phe = 33 ± 6 μM), a significant higher K m value for phenylalanine (4–9 folds) was observed in patient cytoplasmic extracts, overall indicating decreased ability of R295W and V356I mutants to bind the substrate (Figure S7B), overall indicating that these variants were LOF.
4. DISCUSSION
FARSA deficiency was recently reported in four patients presenting with brain abnormalities, ILD and facial dysmorphism. 3 , 4 We describe four supplementary patients from two unrelated families enlarging both the genetic and the phenotypic landscape of FARSA deficiency. The identified variants, p.R295W and p.V356I, were located in the phenylalanine‐binding pocket and severely impaired aminoacylation activity. Our data contrast with the recent findings from Schuch 4 reporting normal enzymatic activity for the R295W allele, a result likely due to distinct experimental setting, 8 , 9 which used saturating phelanine concentration (300 μM) largely above the K m that we have determined for the R295W mutant (~130 μM, Figure S4B).
All four patients share the core phenotype previously reported in PheRS‐deficient patients, including microcephaly associated with brain lesions such as calcifications and encephalomalacia, 3 , 4 , 5 , 6 with or without intra‐cerebral aneurysm. In our patients, multiple brain MRIs suggest the involvement of intracranial vessels, affecting both brain microvasculature, with typical progressive severe leukoencephalopathy of vascular distribution (watershed regions), and of large vessels with artery occlusion and/or aneurysm development. Initial normal brain MRI in these patients with further development of severe white matter injury leading to necrosis and cavitation, suggest a progressive vasculopathy and microcephaly.
All patients displayed autoimmunity with positive ANA and ANCA, chronic elevated CRP and leukocytosis without evidence of infection, and intermittent positive interferon score, features reminiscent of some Mendelian autoinflammatory diseases, 10 , 11 including TRNT1 deficiency. Variants in TRNT1 result in abnormal tRNA processing and were shown to drive constitutive activation of type I interferon signalling. 10 Inflammatory symptoms were also described in other ARSopathies (IARS, LARS, KARS, QARS, MARS) with notably chronic inflammation in early infancy with elevated CRP and intermittent leucocytosis, 2 , 12 indicating that they may have variable penetrance, and may therefore be overlooked. In P1, the inflammatory syndrome prompted to initiate immunosuppressive therapy first with pulse steroid therapy then with rituximab which induced transient remission. Owing to the positive interferon score, relapse at 9 years was treated with ruxolitinib with positive outcome.
In conclusion, autoimmune and inflammatory features with variable penetrance should be considered as a novel phenotypic feature of FARSA deficient patients. Chronic inflammation observed in these patients may account at least partially for the interstitial lung disease. Therefore, our findings may have important implications to guide not only molecular diagnosis but also clinical management of these patients.
CONFLICT OF INTEREST
The authors declare no competing interests.
PEER REVIEW
The peer review history for this article is available at https://publons.com/publon/10.1111/cge.14120.
Supporting information
Appendix S1. Facial features, including deep and narrow‐set eyes and prominent forehead and full cheeks, of patients carrying FARSA variants.
Appendix S2. Supporting Information.
FIGURE S1 Clinical features of FARSA deficient patients
(A) Facial features, including deep and narrow‐set eyesand prominent forehead and full cheeks, of patients carrying FARSA variants.
(B) Clubbing fingers in P1, P2 and P3.
FIGURE S2 Anatomopathology of lung and liver.
(A) BAL of P1‐P4 showing foamy macrophages (MGG 40X) and Oil Red O positive macrophages in P4.
(B) Open lung biopsy of P1 showing inflammatory interstitial pneumonia replacing normal alveolar parenchyma (HE, 5X) as well as numerous intraalveolar cholesterol granulomas (Giemsa, 20X).
(C) Liver biopsy of P1 showing portal inflammation with prominent periportal macro‐ and microvacuolar steatosis (HE, 20X).
FIGURE S3 Comparison of chest CT from P1 and P2 at similar ages (P1: 3.8 years‐old and P2 3.5 years old). Chest CT in P2 showed discrete and diffuse ground glass opacities, without lesions suggestive of lung fibrosis, whereas, at a similar age, chest CT in P1 already showed small cystic lesions especially in subpleural areas in both lungs (white arrows).
FIGURE S4 Head circumference growth over time in patients with homozygous FARSA variants.
FIGURE S5: Cytokines and chemokines mRNA expression in P1 and P2. Gene expression of cytokines and chemokines as revealed by RT‐qPCR, in blood from two controls and from P1 and P2 at different time points during disease course. All data were expressed as the mean ± SD.
FIGURE S6 Segregation analysis by Sanger sequencing.
Electropherograms showing familial segregation of the c.883C > T (p.R295W) mutant FARSA allele in family 1 and of alleles c.1066G > A (p.V356) in family 2, respectively.
FIGURE S7: Functional analysis of FARSA variants.
(A) PheRS aminoacylation activity in cytosolic extract from fibroblasts of patients and control (HC). Activity is normalised to 1 in control extracts. Mean ± SD (n = 2 or 3).
(B) Aminoacylation rate as a function of the concentration of the phenylalanine substrate. Data were fit to the Michaelis–Menten equation to derive the K m (Phe) value.
ACKNOWLEDGEMENTS
The work was supported by Institutional grants from INSERM, by the European grant ERC‐2013‐AdG‐339407‐IMMUNOBIOTA, by the Investissement d'Avenir grant ANR‐10‐IAHU‐01, by the Fondation Princesse Grace, by Fondation Maladies Rares (N.C.B.).
Charbit‐Henrion F, Goguyer‐Deschaumes R, Borensztajn K, et al. Systemic inflammatory syndrome in children with FARSA deficiency. Clinical Genetics. 2022;101(5‐6):552-558. doi: 10.1111/cge.14120
Fabienne Charbit‐Henrion, Roman Goguyer‐Deschaumes, Marianna Parlato, and Alice Hadchouel contributed equally to this study.
Funding information Fondation Maladies Rares; Investissement d'Avenir, Grant/Award Number: ANR‐10‐IAHU‐01; INSERM, Grant/Award Number: ERC‐2013‐AdG‐339407‐IMMUNOBIOTA
Contributor Information
Marianna Parlato, Email: marianna.parlato@inserm.fr.
Alice Hadchouel, Email: alice.hadchouel-duverge@aphp.fr.
DATA AVAILABILITY STATEMENT
The data that support the findings of this study are available on request from the corresponding author. The data are not publicly available due to privacy or ethical restrictions.
REFERENCES
- 1. Antonellis A, Green ED. The role of aminoacyl‐tRNA synthetases in genetic diseases. Annu Rev Genom Hum Genet. 2008;9(1):87‐107. [DOI] [PubMed] [Google Scholar]
- 2. Fuchs SA, Schene IF, Kok G, et al. Aminoacyl‐tRNA synthetase deficiencies in search of common themes. Genet Med. 2019;21(2):319‐330. [DOI] [PMC free article] [PubMed] [Google Scholar]
- 3. Krenke K, Szczałuba K, Bielecka T, et al. FARSA mutations mimic phenylalanyl‐tRNA synthetase deficiency caused by FARSB defects. Clin Genet. 2019;96(5):468‐472. [DOI] [PubMed] [Google Scholar]
- 4. Schuch LA, Forstner M, Rapp CK, et al. FARS1‐related disorders caused by bi‐allelic mutations in cytosolic phenylalanyl‐tRNA synthetase genes: look beyond the lungs! Clin Genet. 2021;99(6):789–801. [DOI] [PubMed] [Google Scholar]
- 5. Xu Z, Lo WS, Beck DB, et al. Bi‐allelic mutations in Phe‐tRNA synthetase associated with a multi‐system pulmonary disease support non‐translational function. Am J Hum Genet. 2018;103(1):100‐114. [DOI] [PMC free article] [PubMed] [Google Scholar]
- 6. Zadjali F, Al‐Yahyaee A, Al‐Nabhani M, et al. Homozygosity for FARSB mutation leads to Phe‐tRNA synthetase‐related disease of growth restriction, brain calcification, and interstitial lung disease. Hum Mutat. 2018;39(10):1355‐1359. [DOI] [PubMed] [Google Scholar]
- 7. Finarov I, Moor N, Kessler N, Klipcan L, Safro MG. Structure of human cytosolic phenylalanyl‐tRNA synthetase: evidence for kingdom‐specific design of the active sites and tRNA binding patterns. Structure. 2010;18(3):343‐353. [DOI] [PubMed] [Google Scholar]
- 8. Guex N, Peitsch MC. SWISS‐MODEL and the Swiss‐Pdb viewer: an environment for comparative protein modeling. Electrophoresis. 1997;18(15):2714‐2723. [DOI] [PubMed] [Google Scholar]
- 9. Pailliez JP, Waller JP. Phenylalanyl‐tRNA synthetases from sheep liver and yeast. Correlation between net charge and binding to ribosomes. J Biol Chem. 1984;259(24):15491‐15496. [PubMed] [Google Scholar]
- 10. Frémond ML, Melki I, Kracker S, et al. Comment on: ‘aberrant tRNA processing causes an autoinflammatory syndrome responsive to TNF inhibitors’ by Giannelou et al: mutations in TRNT1 result in a constitutive activation of type I interferon signalling. Ann Rheum Dis. 2019;78(8):e86. [DOI] [PubMed] [Google Scholar]
- 11. de Jesus AA, Hou Y, Brooks S, et al. Distinct interferon signatures and cytokine patterns define additional systemic autoinflammatory diseases. J Clin Investig. 2020;130(4):1669‐1682. [DOI] [PMC free article] [PubMed] [Google Scholar]
- 12. Enaud L, Hadchouel A, Coulomb A, et al. Pulmonary alveolar proteinosis in children on La Réunion Island: a new inherited disorder? Orphanet J Rare Dis. 2014;9(1):85. [DOI] [PMC free article] [PubMed] [Google Scholar]
Associated Data
This section collects any data citations, data availability statements, or supplementary materials included in this article.
Supplementary Materials
Appendix S1. Facial features, including deep and narrow‐set eyes and prominent forehead and full cheeks, of patients carrying FARSA variants.
Appendix S2. Supporting Information.
FIGURE S1 Clinical features of FARSA deficient patients
(A) Facial features, including deep and narrow‐set eyesand prominent forehead and full cheeks, of patients carrying FARSA variants.
(B) Clubbing fingers in P1, P2 and P3.
FIGURE S2 Anatomopathology of lung and liver.
(A) BAL of P1‐P4 showing foamy macrophages (MGG 40X) and Oil Red O positive macrophages in P4.
(B) Open lung biopsy of P1 showing inflammatory interstitial pneumonia replacing normal alveolar parenchyma (HE, 5X) as well as numerous intraalveolar cholesterol granulomas (Giemsa, 20X).
(C) Liver biopsy of P1 showing portal inflammation with prominent periportal macro‐ and microvacuolar steatosis (HE, 20X).
FIGURE S3 Comparison of chest CT from P1 and P2 at similar ages (P1: 3.8 years‐old and P2 3.5 years old). Chest CT in P2 showed discrete and diffuse ground glass opacities, without lesions suggestive of lung fibrosis, whereas, at a similar age, chest CT in P1 already showed small cystic lesions especially in subpleural areas in both lungs (white arrows).
FIGURE S4 Head circumference growth over time in patients with homozygous FARSA variants.
FIGURE S5: Cytokines and chemokines mRNA expression in P1 and P2. Gene expression of cytokines and chemokines as revealed by RT‐qPCR, in blood from two controls and from P1 and P2 at different time points during disease course. All data were expressed as the mean ± SD.
FIGURE S6 Segregation analysis by Sanger sequencing.
Electropherograms showing familial segregation of the c.883C > T (p.R295W) mutant FARSA allele in family 1 and of alleles c.1066G > A (p.V356) in family 2, respectively.
FIGURE S7: Functional analysis of FARSA variants.
(A) PheRS aminoacylation activity in cytosolic extract from fibroblasts of patients and control (HC). Activity is normalised to 1 in control extracts. Mean ± SD (n = 2 or 3).
(B) Aminoacylation rate as a function of the concentration of the phenylalanine substrate. Data were fit to the Michaelis–Menten equation to derive the K m (Phe) value.
Data Availability Statement
The data that support the findings of this study are available on request from the corresponding author. The data are not publicly available due to privacy or ethical restrictions.


