Abstract
Scarce data are available on methylphenidate (MPH) plasma concentrations reached after doses higher than 180 mg. The interindividual and intraindividual variability in the exposure of MPH and ritalinic acid (RA) enantiomers was examined in 28 patients with ADHD and substance use disorders, with MPH daily doses between 30 and 600 mg (median 160 mg). MPH and RA plasma concentrations were analysed with an enantioselective LC–MS/MS method. d‐MPH plasma concentration/dose varied 25‐fold between subjects but was reasonably stable within an individual. Twelve subjects had quantifiable l‐MPH plasma concentrations, which accounted for up to 48% of the total MPH plasma concentration. The less active l‐MPH enantiomer could, in individuals with low carboxylesterase 1 (CES1) activity, contribute significantly to the total MPH plasma drug concentration and hamper the estimation of the exposure to the more active d‐MPH enantiomer. However, the high correlation between the total (d + l) RA/MPH metabolic ratio and the d‐RA/d‐MPH metabolic ratio (r s = 0.94) indicates that the ratio based on non‐enantioselective analysis could be used as a marker of CES1 activity. Whether this holds true for subjects with aberrant metabolism due to genetic variants or during concomitant treatment with inhibitors or inducers of the enzyme remains to be studied.
Keywords: ADHD, metabolic ratios, methylphenidate, pharmacokinetics, ritalinic acid, substance use disorder
1. INTRODUCTION
Attention deficit hyperactivity disorder (ADHD) is a common psychiatric disorder affecting 6%–7% of children and 3%–5% of adults. 1 , 2 The prevalence of substance use disorder (SUD) in patients diagnosed with ADHD is high, up to 45%. 3 Approximately 21% of adults diagnosed with SUD have co‐occurring ADHD. 3 , 4 According to the Swedish Guidelines for treating ADHD, 5 central stimulants (methylphenidate [MPH] or amphetamine) are considered the first choice for treatment. The prevalence of MPH use (ages 5–9 years) in Sweden increased between 2006 and 2016, from 1.6 to 8.9/1000 inhabitants. 3 , 5 Most patients diagnosed with ADHD in Sweden (2015) received pharmacological treatment, commonly MPH, lisdexamfetamine or atomoxetine. 6 , 7 According to Swedishnationwide register‐based cohort studies, adults with ADHD and SUD used, on average, 40% higher MPH doses than patients with ADHD only. 8
MPH is usually administered as a racemic mixture (50:50) of d‐ and l‐threo‐MPH, although formulations of d‐threo‐MPH (dexmethylphenidate) only are also available. d‐threo‐MPH is considered to be up to 10 times more potent than l‐threo‐MPH as a catecholamine‐selective reuptake inhibitor in the brain. 9 , 10 Interindividual variability in drug exposure after MPH dosing is large, with up to 30‐fold differences in plasma concentrations 1 h post‐dose and up to sevenfold differences in maximum plasma concentrations. 11 , 12 The main elimination pathway is metabolism to the inactive metabolite ritalinic acid (RA) by the enzyme carboxylesterase 1 (CES1). 12 Genetic variants of CES1, associated with low enzyme activity and elevated plasma exposure of MPH, have been described. 11 , 13 , 14 CES1 shows higher catalytic activity towards l‐ than d‐MPH, 15 and the absolute bioavailability of l‐MPH after oral administration is only 1%–2%, compared to approximately 30% for d‐MPH. 16
Interindividual differences in the activity of CES1 could influence not only the total exposure of MPH per dose unit but also the enantiomeric ratio of MPH in plasma. Analysis of MPH in therapeutic drug monitoring (TDM) and toxicology laboratories is usually performed with non‐enantioselective methods. 17 Thus, a variable, and in some patients, significant contribution of the inactive l‐MPH to the total concentration would hamper the prediction of the individual's exposure to the active drug entity (d‐MPH) based on such analysis. No clear therapeutic plasma concentration range has been established for MPH. According to the Arbeitsgemeinschaft für Neuropsychopharmakologie und Pharmakopsychiatrie (AGNP) consensus guidelines for TDM in Neuropsychopharmacology, 17 , 18 the reference range of MPH (d + l) for adults is 12–79 ng/ml in samples taken 2 h after dosing for immediate release (20 mg) or 4–6 h after dosing for extended‐release formulations (40 mg). However, since many patients, especially those with concomitant SUD, are treated with much higher doses, the usefulness of these ranges is limited.
The majority of published data on MPH pharmacokinetics are from studies in healthy volunteers. 19 However, little is known about factors influencing the significant interindividual differences by clinically used doses or plasma concentrations achieved in adults with ADHD and concomitant SUD. 20 In addition, Stage et al 13 suggested that the ratio between d‐RA and d‐MPH (d‐RA/d‐MPH metabolic ratio [MR]) based on a single‐point plasma measurement could be used as a phenotypic marker of the individual's CES1 activity.
The aim of this study was to investigate the interindividual and intraindividual variability in the exposure of MPH and RA enantiomers in patients with ADHD and SUD and to relate the variability in dosage and exposure to the MPH MR and CES1 genotype.
2. METHODS AND MATERIALS
2.1. Study design
The study was conducted at the Stockholm Centre for Dependency Disorders, Sweden, and approved by the Swedish Medical Products Agency (EudraCT No 2013‐002720‐16). Ethical approval was obtained from the Stockholm Regional Ethics Review Board (2013‐002720‐16, 2014/1181‐31, with amendments (2016‐01‐28, 2016‐10‐26). The study was conducted in accordance with the Basic & Clinical Pharmacology & Toxicology policy for experimental and clinical studies, 21 the Declaration of Helsinki, 22 and the International Conference on Harmonization guidelines for Good Clinical Practice. Informed consent was obtained from all study subjects before inclusion.
About 200 patients treated with MPH from all out‐patient units were listed and, based primarily on logistic reasons such as the number of patients per unit, four out‐patient units were chosen as study sites. The recruitment of patients was consecutive and independent of the dose of MPH prescribed. Subjects were eligible if they were between 18 and 64 years of age, diagnosed with ADHD according to DSM‐IV or DSM‐5, had at least one non‐nicotine SUD according to the DSM‐IV or DSM‐5, and treated with MPH with a minimum duration of 14 days. Subjects who had participated in another clinical study during the previous 3 months were excluded. Patients who declined to participate continued with their usual care at the clinic. Twenty‐eight patients with ADHD and SUD were included between 2015 and 2017. The patients could participate in the study either on a single day (assessment of interindividual variability) or up to four separate days with 1‐ to 2‐week intervals (assessment of intraindividual variability). The patients continued treatment as usual during and after study visits.
At the first study visit, resting blood pressure and pulse rate, body weight, and Adult ADHD Self Report Scale (ASRS) scores of the previous week were recorded. The ASRS score is based on a self‐reported questionnaire of ADHD symptoms developed by the WHO and the Workgroup on Adult ADHD. 23 It is used as a screening tool for ADHD (symptoms during the last 6 months) but also to measure current symptom levels and for treatment follow‐up (symptoms during the previous week). 24 The maximum score is 72, and a screening score of more than 24 indicates that the subject is likely to have ADHD. 25
Medical and demographic data, including the history of SUD, were collected on a study‐specific record form. In addition, a blood sample for pharmacogenetic analysis was taken. Urine was collected for laboratory analysis of drugs of abuse (THC, amphetamines including methamphetamine, bensodiazepines, opioids, buprenorphine and cocaine) on each study visit. Drug screening and verification (in case of a positive screening result) were performed at the Department of Clinical Pharmacology, Karolinska University Hospital, using validated routine methods. The laboratory is accredited by SWEDAC, Swedish Board for Technical Accreditation, and CAP, College of American Pathologists.
The subjects were instructed not to take their MPH morning dose on the study visits. Instead, they received their prescribed MPH morning dose under supervision at the study unit. Venous blood samples were drawn before MPH intake and approximately 5 h post‐dose for drug concentration analysis. The exact times of drug intake and blood sampling were recorded. The subjects were free to leave the unit between the two sampling times.
2.2. Enantioselective determination of dl‐threo‐methylphenidate and dl‐threo‐ritalinic acid in plasma
Venous blood was collected into 3‐ml tubes containing an FC mixture, consisting of Na2EDTA, sodium fluoride, citric acid and sodium citrate (Vacuette, Greiner Bio‐One). The samples were centrifuged within 30 min (1500g for 10 min), after which plasma was transferred into polypropylene tubes (Nunc CryoTube vials, Thermo Scientific) and frozen within 15 min at −20°C. The frozen samples were then transported to the laboratory and analysed with a validated enantioselective LC–MS/MS at the Department of Clinical Pharmacology, Karolinska University Hospital.
The method was described earlier in a study of healthy subjects receiving a single dose of 20‐mg ritalin. 26 Briefly, sample preparation was performed by transferring aliquots of 200‐μl plasma to an Ostro 96‐well plate (25 mg, Waters, Milford, MA, USA). Protein precipitation was achieved by adding 600 μl of internal standard solution (0.1% formic acid and 15% methanol in acetonitrile containing the internal standards (±)‐threo‐MPH‐d4 (MPH‐d4) and (±)‐threo‐RA‐d4 (ritalinic acid‐d4); Cerilliant, Round Rock TX, USA). As much higher drug concentrations were achieved in the patients of the current study, the method was revalidated (with 50 and 150 μl of plasma volumes) for higher plasma concentrations, for example, 1 to 400 ng/ml for d‐ and l‐threo‐MPH and 10 to 4000 ng/ml for d‐ and l‐threo‐RA. The validation was performed according to the Guideline on bioanalytical method validation (EMEA/CHMP/EWP/192217/2009 Rev.1 Corr.2). The results successfully fulfilled all the criteria of the guideline. The tested concentrations were 1, 3, 100 and 320 ng/ml for d‐ and l‐threo‐MPH, and 10, 30, 1000 and 3200 ng/ml for d‐ and l‐threo‐RA. The between‐day precision reported as the coefficient of variation (CV) for the different enantiomers varied between 5.1% and 11.2%. The between‐day accuracy reported as the bias for the different enantiomers varied between −13.2% and 8.8%. In some samples, d‐ and l‐threo‐MPH were detectable, but below the lower limit of quantification (LLOQ) and in these cases, a value of half the LLOQ (0.5 ng/ml for MPH and 5 ng/ml for RA) was imputed.
2.3. Genotyping
DNA for CES1 genotyping was extracted from whole blood using the Purelink Genomic DNA Kit (Life Technologies, Rotterdam, Netherlands). For the determination of CES1 copy number variation (CNV), triplicates of 10 ng/μl of DNA samples were used in qPCR analyses with assays from Life Technologies (CES1 ID# Hs00139541_cn) and RNASP (Cat# 4403326) as a normalizing control gene. For the rs71647871 (G143E) single nucleotide polymorphism (SNP), a custom‐made TaqMan assay was designed (Cat#: 4331349, ID#: ANAAJ79) using the primers and probes described in Zhu et al. In addition, TaqMan Universal PCR master mix II (Cat#4440040, Life Technologies) was used and run on StepOne™ Real‐Time PCR System for all PCR reactions.
2.4. MRs of d‐RA/d‐MPH
The d‐RA/d‐MPH plasma concentration ratios were calculated in all post‐dose samples of the present study. Plasma concentration data for d‐RA and d‐MPH at different time points and the calculated area under the plasma concentration–time curve, AUC, of d‐MPH (AUC d‐MPH) were also retrieved from the single‐dose pharmacokinetic study of MPH (20 mg of Ritalin®) performed by us and published earlier. 26
2.5. Statistical analysis
GraphPad Prism 8 (GraphPad Software, Inc., San Diego, CA, USA) was used to draw graphs and for statistical analyses. For correlation analyses, Spearman correlation coefficients were calculated. For comparisons between two groups, the Mann–Whitney U test was used. A p value < 0.05 was considered significant. In calculations and analysis, plasma concentrations below LLOQ were given a value of half the LLOQ.
3. RESULTS
Twenty‐eight subjects (24 men and 4 women) diagnosed with ADHD and SUD were included. The clinical characteristics and MPH dosing data are shown in Table 1. The daily dose of MPH varied 20‐fold, and that adjusted for body weight 23‐fold. There was no correlation between body weight and daily MPH dose (r s = 0.12). Eleven subjects were prescribed daily doses higher than 180 mg, with a median dose of 324 mg (range 198−600 mg). Sixteen patients were prescribed extended‐release MPH (Ritalin® or Medikinet®), eight patients osmotic‐release oral system (OROS)‐MPH (Concerta®), two patients an immediate‐release formulation of MPH (Medikinet®), and two patients a combination of Ritalin® and Concerta®. Thirteen subjects were prescribed three or more MPH doses per day, and only two patients received MPH once a day in the morning. There were no changes in the dosing or formulations of MPH during the participation in the study.
TABLE 1.
Clinical characteristics of the 28 subjects (24 men and 4 women) with ADHD and SUD
| Median | Range | |
|---|---|---|
| Age (years) | 44.5 | 27–60 |
| Weight (kg) | 81 | 62–193 |
| MPH morning dose (mg) | 90 | 30–216 |
| MPH daily dose (mg) | 160 | 30–600 |
| Weight‐adjusted daily MPH dose (mg/kg) | 1.7 | 0.3–7.0 |
| Systolic blood pressure | 131 | 106–166 |
| Diastolic blood pressure | 85 | 65–113 |
| Pulse rate | 80 | 64–114 |
| Length of current MPH treatment (months) | 36 | 1–180 |
| Abstinence from drugs (months) | 30 | 1–120 |
| ASRS | 46 | 23–64 |
Abbreviations: ADHD, attention deficit hyperactivity disorder; ASRS, Adult ADHD Self Report Scale; MPH, methylphenidate; SUD, substance use disorder.
Twenty‐seven subjects had co‐medications, the most common being anxiolytics, sedatives or hypnotics (n = 13), antidepressants (n = 9), and neuroleptics (n = 9). Twelve patients were on opioid maintenance treatment, with either buprenorphine (n = 5) or methadone (n = 7). Thirteen subjects had other concomitant medication (self‐reported), including four with antiepileptics (lamotrigine, clonazepam or gabapentin), three with trihexyphenidyl, two with antihypertensive medications, two with omeprazole, as well as single cases of other drugs. None of these drugs have been reported to interact with MPH or the CES enzyme. Three subjects had verified positive urine analysis for drugs not prescribed (benzodiazepines, cocaine and buprenorphine). Five subjects reported minor cold, stomach pain, anxiety and aggressiveness during the study period.
The most common self‐reported preferred drug of abuse during the year before starting MPH treatment had been amphetamine (n = 16) or heroin (n = 10). Eight of the 11 subjects (73%) with MPH daily doses above 180 mg of self‐reported central stimulant use the year before starting ADHD treatment, compared to eight out of 17 (47%) with doses below 180 mg per day. The median daily MPH dose was 24% higher in patients with self‐reported central stimulant use during the year before starting ADHD treatment (180 mg, range 30–600 mg, n = 16), compared to those self‐reporting other, non‐central stimulant substance use (145 mg, range 80–484 mg, n = 12); however, this difference was not statistically significant.
The median ASRS score in this study cohort (n = 28) was 46 (range 23–64), and similar scores (median 44, range 23–64) were also found in the subgroup of 11 patients with MPH daily doses higher than 180 mg. Half of the patients in our study had been treated with MPH for more than 2 years (median 66 months), with a median ASRS score of 49. There was no correlation between the ASRS scores and the daily MPH dose nor treatment duration.
Of the 28 subjects, 21 were included in the analyses of MPH pharmacokinetics. Two subjects were excluded because of interference in the chromatogram, and three because they did not follow the instructions and took MPH doses between the morning and post‐dose sampling. In addition, two subjects were excluded because none of the enantiomers of MPH or RA could be detected in any of the samples taken. Thus, data from 21 subjects were available for analysis of interindividual variability, and of these, 12 were sampled repeatedly, allowing analysis of intraindividual variability.
Fifteen subjects had quantifiable, but in most cases low, pre‐dose d‐MPH plasma concentrations (median 2 ng/ml, range 0.5–89.3 ng/ml). Fourteen of these were prescribed MPH not only in the morning but also in the afternoon or the evening.
When all post‐dose samples with quantifiable concentrations were considered, d‐MPH plasma concentrations ranged between 8 and 472 ng/ml (median 31.6 ng/ml, n = 44). The post‐dose d‐MPH plasma concentrations in relation to the MPH morning dose per kilogram at the first visit of each subject are shown in Figure 1. Post‐dose d‐MPH plasma concentrations adjusted for the MPH morning dose (C/D) at all 44 visits of the 21 subjects varied 25‐fold, from 0.1 to 2.5 ng/ml/mg (median 0.4 ng/ml/mg), Figure 2. In most subjects with repeated sampling, the d‐MPH C/D was fairly stable over time. Twelve subjects had quantifiable l‐MPH plasma concentrations on 17 occasions (range 1.2–389 ng/ml, median 19.4 ng/ml) and the post‐dose l‐MPH C/D in these 17 samples varied from 0.01 to 1.94 ng/ml/mg (median 0.09 ng/ml/mg).
FIGURE 1.
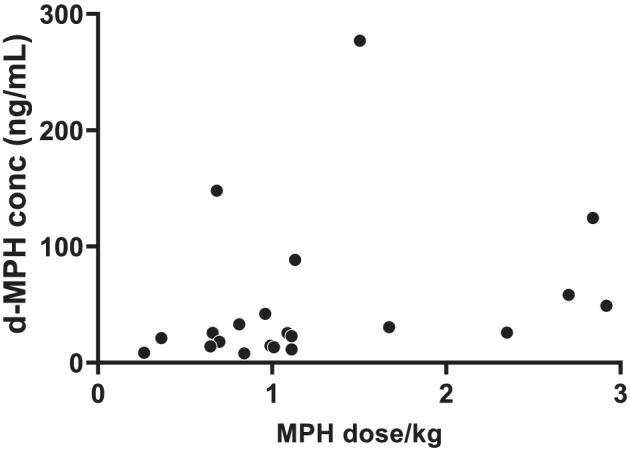
Post‐dose d‐MPH plasma concentrations in relation to MPH morning dose per kilogram (n = 21), r s = 0.50, p = 0.02. For subjects with several study visits, only data from the first one are included. MPH, methylphenidate
FIGURE 2.
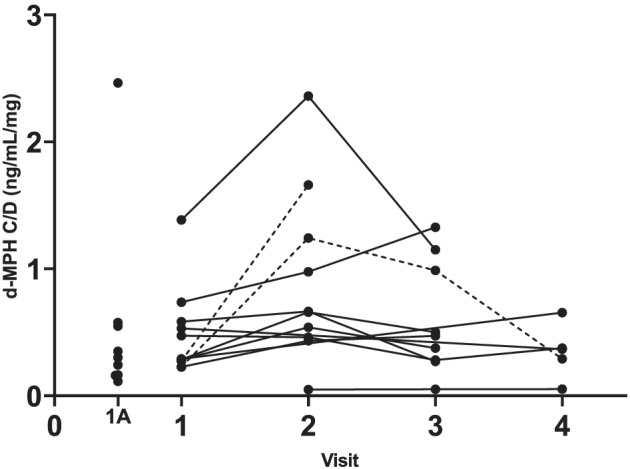
d‐MPH plasma concentrations adjusted for the MPH morning dose (C/D) in 12 subjects with repeated visits and nine subjects with one visit only (1A). Subjects with a ratio above 3 between the lowest and the highest C/D are shown with dotted lines. MPH, methylphenidate
Both d‐RA and l‐RA plasma concentrations were above the LLOQ in all 21 subjects post‐dose and all but two subjects pre‐dose. The post‐dose d‐RA plasma concentrations ranged between 126 and 3154 ng/ml (median 385 ng/ml, n = 44) and those of l‐RA between 106 and 2182 ng/ml (median 446 ng/ml, n = 44).
The d‐RA/d‐MPH MR calculated for the first visit of each subject varied about 100‐fold (range 0.5−48, median 16, n = 21). In 12 subjects with repeated samples, the ratio between the lowest and highest MR varied between 1.2 and 6 (median 1.8). In three subjects, this ratio was higher than 3 (3.2; 4.6; 6.0), Figure 3. One individual had consequently, on all three study visits, the lowest d‐RA/d‐MPH MR (≤0.8) of all subjects.
FIGURE 3.
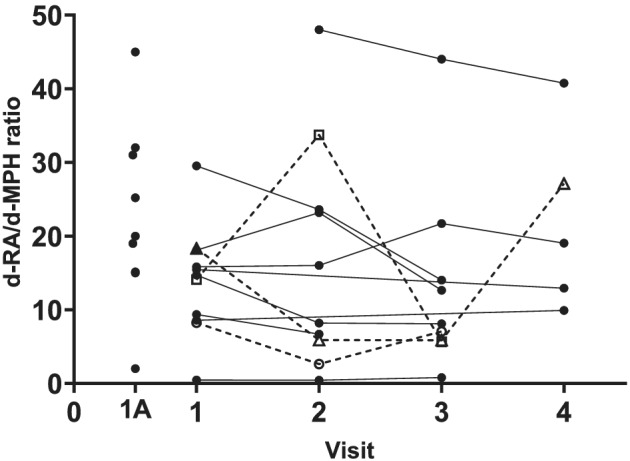
d‐RA/d‐MPH metabolic ratio (MR) in subjects with multiple samples (n = 12) and those with only one visit (1A, n = 9). Subjects with a ratio above 3 between the lowest and the highest C/D are shown with dotted lines. MPH, methylphenidate
The dose‐adjusted concentrations (C/D) of d‐ and l‐MPH were analysed in relation to the d‐RA/d‐MPH MR. The highest C/D ratios of both d‐ and l‐MPH were found among the subjects with the low MRs, Figure 4. Among subjects with higher MRs, no apparent impact of the MR on either d‐ or l‐MPH C/D could be seen. The subject with the very lowest MR (≤0.8) had consistently very high C/D ratios of both d‐MPH (1.39; 2.36; 1.15 ng/ml/mg) and l‐MPH (1.05; 1.94; 0.64 ng/ml/mg) and the highest plasma concentrations of both d‐MPH (277; 432; 230 ng/ml) and l‐MPH (210; 389; 128 ng/ml) on all three study visits.
FIGURE 4.
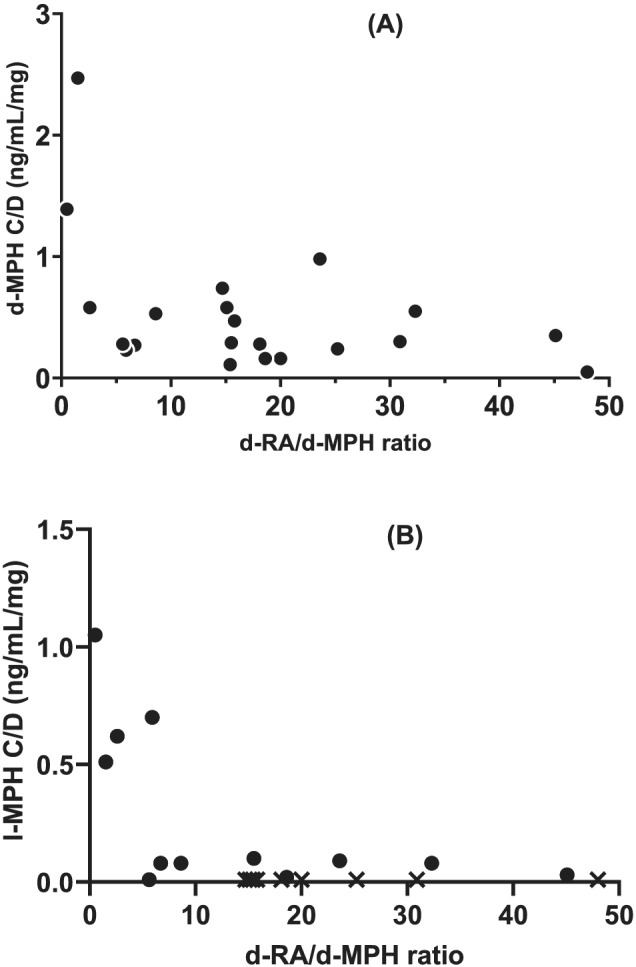
d‐RA/d‐MPH metabolic ratio (MR) in relation to (A) d‐MPH C/D (r s = −0.37, p = 0.1, n = 21) and (B) l‐MPH C/D (r s = −0.56, p = 0.06, n = 12). For l‐MPH, data from the first study visit with a plasma concentration above the LLOQ are included. d‐RA/d‐MPH MR in subjects with l‐MPH < LLOQ are shown as X (n = 9). MPH, methylphenidate
Due to the low number of female subjects (four), no statistical analysis of C/Ds of MPH and RA enantiomers or the d‐RA/d‐MPH MR between males and females was performed. However, there was no indication of any gender‐related differences in either the C/Ds or MRs of MPH and RA enantiomers. Neither were there any differences in these parameters between the various formulations of MPH used (data not shown).
Using data from a pharmacokinetic study in healthy subjects after a single dose of 20 mg of MPH (Ritalin®), 26 we established that the AUC of d‐MPH correlated with the 5‐h d‐RA/d‐MPH MR (r s = −0.87, p < 0.001, n = 12), Figure 5. The d‐RA/d‐MPH MR ranged in this cohort between 6 and 29 (median 17).
FIGURE 5.
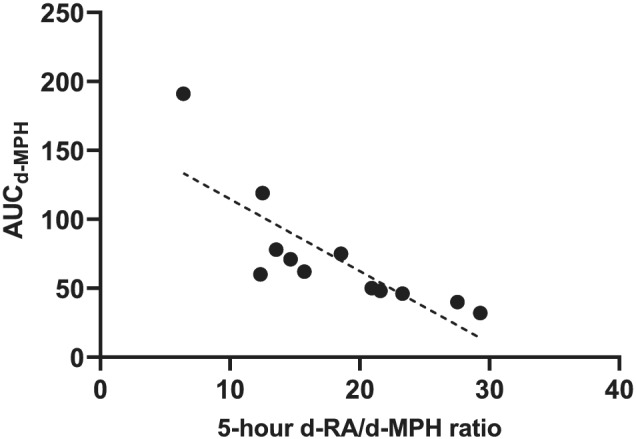
Five‐hour d‐RA/d‐MPH metabolic ratio (MR) versus AUC d‐MPH. Data from a study in healthy subjects (r s = −0.87, p = 0.004, n = 12). MPH, methylphenidate
The total MPH plasma concentrations were calculated as the sum of d‐ and l‐MPH to compare our results with published data using non‐enantioselective methods. As the l‐MPH plasma concentration in most cases was low compared to that of d‐MPH, it generally contributed little to the total MPH plasma concentration. d‐MPH and total MPH plasma concentrations were thus highly correlated (r s = 0.9974, n = 21). In 12 subjects with l‐MPH plasma concentrations above the LLOQ (1 ng/ml), on any study visit (n = 17), l‐MPH accounted for 2%–48% (median 17%) of the total MPH plasma concentration. The total (d + l)‐RA/(d + l)‐MPH MR and the d‐RA/d‐MPH MR were highly correlated (r s = 0.94), Figure 6.
FIGURE 6.
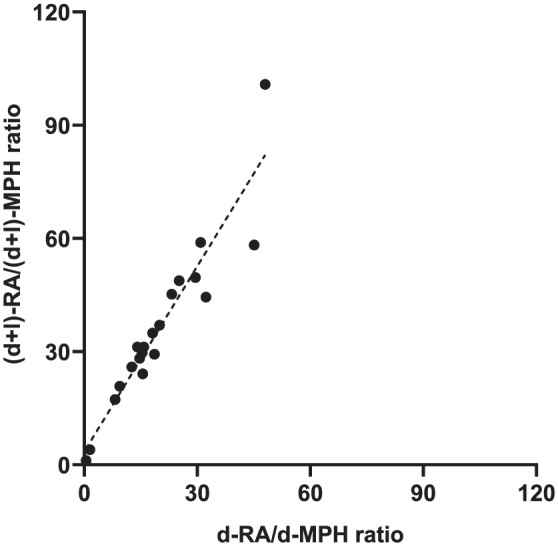
Correlation between d‐RA/d‐MPH metabolic ratio (MR) and (d + l)‐RA/(d + l)‐MPH MR. Data from the first sampling of each subject are included (r s = 0.94, p < 0.0001, n = 21). MPH, methylphenidate
All 28 subjects were genotyped for rs71647871 (G143E) and were homozygous for the G‐allele. One subject (3.6%) carried two CES1A2 (i.e., four copies of CES1), and ten subjects (36%) carried one CES1A2 (i.e., three copies of CES1). Of the 21 subjects with plasma concentration data, 15 had two, and 6 had three copies of CES1. There was no association between CNV and the d‐RA/d‐MPH MR or the C/D of d‐MPH (Figure S1).
4. DISCUSSION
To the best of our knowledge, this is the first study on MPH plasma concentrations reached after doses higher than 180 mg per day. Of the 28 adults with ADHD and concomitant SUD, 11 had doses higher than 180 mg, and only three subjects had doses 80 mg or lower. The patients were recruited consecutively, regardless of the MPH dose, as we aimed at a study cohort as representative of the population as possible. The daily doses of MPH (median 160 mg; range 30–600 mg) did not differ markedly from those in the entire patient population at the Stockholm Centre for Dependency Disorders, according to the Centre's latest available data from 2012 (Ritalin/Medikinet median in male/female 120/150 mg, range 8–600 mg, and Concerta median in male/female 90/113 mg, range 18–432 mg).
As expected, d‐MPH was the major enantiomer in plasma samples taken post‐dose, l‐MPH being quantifiable in only about a third of the samples. The dose‐adjusted d‐MPH plasma concentrations varied largely between individuals but were in most cases reasonably stable within an individual over time. The reasons for the larger variations seen in a few subjects are unknown. Still, they could be related to differences in absorption, distribution, metabolism or intake of extra, non‐declared MPH doses.
Even though l‐MPH was measurable in only 12 patients, it amounted to up to 48% of some individuals' total MPH plasma concentration. Thus, in such subjects, the analysis of MPH by routine, non‐enantioselective methods would overestimate the exposure to the active MPH d‐enantiomer (compared to subjects with no measurable l‐MPH where the total concentration indeed reflects that of d‐MPH). Therefore, studies in larger populations are warranted to explore the clinical relevance of this finding.
A Swedish register‐based study covering the years 2006–2009 showed that patients diagnosed with central stimulant SUD had a significantly increased probability of exceeding a dose of 72 mg/day. In our study, there was a tendency—but not statistically significant—for higher MPH daily doses in subjects with self‐reported central stimulant use compared to other drugs of abuse. Interestingly, the patients in our study had a median ASRS score of 46 (range, 19–64) when entering the study, suggesting that only a few patients had, based solely on the ARSR follow‐up score, an optimal ADHD symptom control. The ASRS scores were equally high in patients with MPH doses above 180 mg per day and those treated for more than 2 years. However, as we did not have data on individual ASRS scores before treatment start, we cannot rule out that the scores had been even higher and had decreased with treatment. In addition, the dual diagnosis population received a multimodal integrated approach, combining pharmacotherapy (for ADHD and SUD) with a non‐pharmacological intervention that targets both the ADHD and SUD with long‐term abstinence as a prioritized outcome rather than a change in self‐reported symptom scores.
The d‐RA/d‐MPH MR has been suggested as a measure of the activity of CES1, the enzyme catalysing the metabolism of MPH to RA. In the present study, the d‐RA/d‐MPH MR varied 80‐fold between individuals and was, with few exceptions, stable within an individual when measured on several occasions. To our knowledge, this is the first time the intraindividual variability of the d‐RA/d‐MPH MR has been studied.
In a single‐dose pharmacokinetic study (Ritalin® capsules 20 mg), the d‐RA/d‐MPH ratios in samples taken 1.5–12 h after dose correlated highly (r = 0.88−0.96) with the d‐RA AUC/d‐MPH AUC ratio. 26 Using data from that study, we now showed that the AUC of d‐MPH correlated with the 5‐h d‐RA/d‐MPH MR, indicating that a single‐point d‐RA/d‐MPH MR could predict d‐MPH exposure, at least after a single drug dose. Whether the same applies during continuous treatment at higher doses and often with multiple doses during the day needs to be explored. In this study, we analysed the d‐RA/d‐MPH MR and studied its relationship with plasma concentrations of MPH enantiomers in samples taken 5 h after the morning dose. Interestingly, the highest d‐MPH and l‐MPH C/D ratios were found in subjects with very low MRs. Apart from these subjects, no association between the MRs and the enantiomer C/D ratios was found, in contrast to the results in healthy volunteers after single low doses of MPH. 26 Accumulation of RA due to its longer half‐life could potentially influence the MR during continuous treatment. In such a case, it would be expected to result in higher MRs compared to data after the first MPH dose. However, no apparent difference in the MRs between the present study (median 16, range 0.5–48) and the single‐dose study (median 17, range 6–29) was found. Further studies are warranted comparing the MRs after single and repeated dosing and analysing the relationship between the first‐dose MR and the C/D of MPH enantiomers. Moreover, analysis of plasma concentrations in several samples taken over a dosing interval (instead of one single sample as in the present study) would significantly improve the prediction of drug exposure. However, such studies are challenging to conduct in a clinical setting.
Calculating the total MPH and RA plasma concentrations as the sum of the d‐ and l‐enantiomers in each sample allowed us to compare the total RA/MPH MR and the d‐RA/d‐MPH MR. These two ratios were highly correlated (r s = 0.94), indicating that the MR based on non‐enantioselective methods could also be used as a marker of CES1 activity and identify outliers with exceptionally high or low CES1 activity. However, whether this applies in subjects with aberrant metabolism due to genetic variants of CES1 or during concomitant treatment with inhibitors or inducers of the enzyme remains to be studied.
None of the subjects included in the present study reported concomitant use of therapeutic drugs identified as possible inducers or inhibitors of CES1. 14 The potential impact of ethanol and drugs of abuse, which are either substrates or inhibitors of CES1 such as cocaine, cannabinoids and possibly heroin, 14 should be considered in patients with concomitant SUD. However, only one of the 28 subjects had a positive urine test for cocaine at any of the study visits, indicating that this would not have been of importance for the results of this study.
SNPs and duplications in the CES1 gene (CES1A2) have been shown to influence the metabolism of MPH 11 and could theoretically explain interindividual variability in the pharmacokinetics and, consecutively, the response to MPH. The most studied SNP in CES1A1 is rs71647871 (also known as Gly143Glu or G143E), with an allele frequency of 2.6% for the 143E variant as shown in a Danish study of 200 subjects. 13 In that study, subjects with three or more copies of CES1 had increased metabolic activity of CES1 compared to those with only two copies. 13 In our study, all subjects were homozygous for the G‐allele of G143E. Thus, the presence of the E‐allele could not explain the individual with exceptionally low MR. Furthermore, there were no differences in MRs between subjects with two and those with three copies of CES1.
The current study has several limitations. Firstly, the study sample was small. Of about 200 subjects diagnosed with ADHD and SUD, 28 subjects were recruited. We did not actively exclude any patients but aimed at a consecutive inclusion at the study units. Many patients were prescribed MPH several times a day, some even at night, resulting in measurable MPH (and RA) plasma concentrations even pre‐dose in a proportion of the patients. In addition, different pharmaceutical formulations of MPH were used, in some cases concomitantly. The study was performed in out‐patients, and variable adherence to the prescribed dosing regimen may have influenced the results. Despite these limitations, we believe that the data, representing a natural clinical setting, may contribute to new knowledge on this group of patients not previously investigated.
In summary, structured monitoring of each individual's neuropsychological response to central stimulant therapy already at the beginning of treatment, combined with analysis of MPH plasma concentrations, could result in a better awareness of the treatment effect and an improved follow‐up and dosing. In addition, TDM of MPH, including the calculation of the MR early in the treatment, might be effective in identifying metabolic outliers, helping the clinician to be especially careful in dosing to avoid adverse events or to be able to increase the dose if needed.
CONFLICT OF INTEREST
The authors report no potential conflict of interest.
Supporting information
Figure S1. d‐RA/d‐MPH MR (A) and d‐MPH C/D (B) in subjects with two (n = 15) and three (n = 6) CES1 genes, respectively. Median with 95% confidence intervals are shown.
ACKNOWLEDGEMENTS
This study was supported by grants from the Stockholm County Council (ALF 2015‐0043 and ALF 2018‐0534), the Swedish Brain Foundation and the Swedish Research Council (2015‐02836). We thank Inger Engman, RN, for excellent assistance during the study.
Arvidsson M, Franck J, Ackehed G, et al. Plasma concentrations of methylphenidate enantiomers in adults with ADHD and substance use disorder, with focus on high doses and relationship to carboxylesterase activity. Basic Clin Pharmacol Toxicol. 2022;130(4):492-500. doi: 10.1111/bcpt.13707
Funding information Swedish Research Council, Grant/Award Number: 2015‐02836; Swedish Brain Foundation; Stockholm County Council, Grant/Award Numbers: ALF 2015‐0043, ALF 2018‐0534
REFERENCES
- 1. Fayyad J, De Graaf R, Kessler R, et al. Cross‐national prevalence and correlates of adult attention‐deficit hyperactivity disorder. Br J Psychiatry J Ment Sci. 2007;190(5):402‐409. [DOI] [PubMed] [Google Scholar]
- 2. Willcutt EG. The prevalence of DSM‐IV attention‐deficit/hyperactivity disorder: a meta‐analytic review. Neurotherapeutics. 2012;9(3):490‐499. [DOI] [PMC free article] [PubMed] [Google Scholar]
- 3. van de Glind G, Konstenius M, Koeter MWJ, et al. Variability in the prevalence of adult ADHD in treatment seeking substance use disorder patients: results from an international multi‐center study exploring DSM‐IV and DSM‐5 criteria. Drug Alcohol Depend. 2014;134:158‐166. [DOI] [PMC free article] [PubMed] [Google Scholar]
- 4. van Emmerik‐van Oortmerssen K, van de Glind G, van den Brink W, et al. Prevalence of attention‐deficit hyperactivity disorder in substance use disorder patients: a meta‐analysis and meta‐regression analysis. Drug Alcohol Depend. 2012;122(1‐2):11‐19. [DOI] [PubMed] [Google Scholar]
- 5. Bjerkeli PJ, Vicente RP, Mulinari S, Johnell K, Merlo J. Overuse of methylphenidate: an analysis of Swedish pharmacy dispensing data. Clin Epidemiol. 2018;10:1657‐1665. [DOI] [PMC free article] [PubMed] [Google Scholar]
- 6. Salmi P. Läkemedelsbehandling vid ADHD ‐behandlingsrekommendation. Information från Läkemedelsverket. 2016;25‐55. [Google Scholar]
- 7. Socialstyrelsen . Förskrivning av adhd‐läkemedel 2016. Utvecklingen av incidens och prevalens. 2016. Available from: https://www.socialstyrelsen.se/globalassets/sharepoint-dokument/artikelkatalog/ovrigt/2017-5-32.pdf
- 8. Skoglund C, Brandt L, D'Onofrio B, Larsson H, Franck J. Methylphenidate doses in attention deficit/hyperactivity disorder and comorbid substance use disorders. Eur Neuropsychopharmacol. 2017;27(11):1144‐1152. [DOI] [PubMed] [Google Scholar]
- 9. Patrick KS, Caldwell RW, Ferris RM, Breese GR. Pharmacology of the enantiomers of threo‐methylphenidate. J Pharmacol Exp Ther. 1987;241(1):152‐158. [PubMed] [Google Scholar]
- 10. Heal DJ, Pierce DM. Methylphenidate and its isomers: their role in the treatment of attention‐deficit hyperactivity disorder using a transdermal delivery system. CNS Drugs. 2006;20(9):713‐738. [DOI] [PubMed] [Google Scholar]
- 11. Zhu HJ, Patrick KS, Yuan HJ, et al. Two CES1 gene mutations lead to dysfunctional carboxylesterase 1 activity in man: clinical significance and molecular basis. Am J Hum Genet. 2008;82(6):1241‐1248. [DOI] [PMC free article] [PubMed] [Google Scholar]
- 12. Kimko HC, Cross JT, Abernethy DR. Pharmacokinetics and clinical effectiveness of methylphenidate. Clin Pharmacokinet. 1999;37(6):457‐470. [DOI] [PubMed] [Google Scholar]
- 13. Stage C, Dalhoff K, Rasmussen HB, et al. The impact of human CES1 genetic variation on enzyme activity assessed by ritalinic acid/methylphenidate ratios. Basic Clin Pharmacol Toxicol. 2019;125:54‐61. [DOI] [PubMed] [Google Scholar]
- 14. Her L, Zhu HJ. Carboxylesterase 1 and precision pharmacotherapy: pharmacogenetics and nongenetic regulators. Drug Metab Dispos. 2020;48(3):230‐244. [DOI] [PMC free article] [PubMed] [Google Scholar]
- 15. Sun Z, Murry DJ, Sanghani SP, et al. Methylphenidate is stereoselectively hydrolyzed by human carboxylesterase CES1A1. J Pharmacol Exp Ther. 2004;310(2):469‐476. [DOI] [PubMed] [Google Scholar]
- 16. Patrick KS, Straughn AB, Reeves OT 3rd, et al. Differential influences of ethanol on early exposure to racemic methylphenidate compared with dexmethylphenidate in humans. Drug Metab Dispos. 2013;41(1):197‐205. [DOI] [PMC free article] [PubMed] [Google Scholar]
- 17. Hiemke C, Bergemann N, Clement HW, et al. Consensus guidelines for therapeutic drug monitoring in neuropsychopharmacology: update 2017. Pharmacopsychiatry. 2018;51(01/02):e1 [DOI] [PubMed] [Google Scholar]
- 18. Hiemke C. Consensus guideline based therapeutic drug monitoring (TDM) in psychiatry and neurology. Curr Drug Deliv. 2016;13(3):353‐361. [DOI] [PubMed] [Google Scholar]
- 19. Diagnosis and management of ADHD in children, young people and adults: National Institute for Health and Clinical Excellence (NICE); 2018. Mar 14. NICE Guideline 58. Available from: https://www.nice.org.uk/guidance/ng87
- 20. Cherma MD, Josefsson M, Rydberg I, et al. Methylphenidate for treating ADHD: a naturalistic clinical study of methylphenidate blood concentrations in children and adults with optimized dosage. Eur J Drug Metab Pharmacokinet. 2017;42(2):295‐307. [DOI] [PMC free article] [PubMed] [Google Scholar]
- 21. Tveden‐Nyborg P, Bergmann TK, Jessen N, Simonsen U, Lykkesfeldt J. BCPT policy for experimental and clinical studies. Journal [Serial on the Internet]. 2020;128(1):4‐8. [DOI] [PubMed] [Google Scholar]
- 22. WMA . World Medical Association Declaration of Helsinki: ethical principles for medical research involving human subjects. Jama. 2013;310(20):2191‐2194. [DOI] [PubMed] [Google Scholar]
- 23. Kessler RC, Adler L, Ames M, et al. The World Health Organization Adult ADHD Self‐Report Scale (ASRS): a short screening scale for use in the general population. Psychol Med. 2005;35(2):245‐256. [DOI] [PubMed] [Google Scholar]
- 24. Ginsberg Y, Agestam M. När ska man använda de olika varianterna av självskattningsskalan ASRS? 2013 [updated 2013; cited 2022 Jan 21]. Available from: https://psykiatristod.se/download/18.583c5e8d16e44bc8c8f2ab7b/1573829135069/ASRS‐anvandningsanvisning.pdf
- 25. Adler LA, Spencer T, Faraone SV, et al. Validity of pilot Adult ADHD Self‐ Report Scale (ASRS) to rate adult ADHD symptoms. Ann Clin Psychiatry. 2006;18(3):145‐148. [DOI] [PubMed] [Google Scholar]
- 26. Arvidsson M, Dahl ML, Beck O, Ackehed G, Nordin K, Rosenborg S. Pharmacokinetics of methylphenidate and ritalinic acid in plasma correlations with exhaled breath and oral fluid in healthy volunteers. Eur J Clin Pharmacol. 2020;76(2):229‐237. [DOI] [PubMed] [Google Scholar]
Associated Data
This section collects any data citations, data availability statements, or supplementary materials included in this article.
Supplementary Materials
Figure S1. d‐RA/d‐MPH MR (A) and d‐MPH C/D (B) in subjects with two (n = 15) and three (n = 6) CES1 genes, respectively. Median with 95% confidence intervals are shown.


