

Summary
The CLAVATA pathway is a key regulator of stem cell function in the multicellular shoot tips of Arabidopsis, where it acts via the WUSCHEL transcription factor to modulate hormone homeostasis. Broad‐scale evolutionary comparisons have shown that CLAVATA is a conserved regulator of land plant stem cell function, but CLAVATA acts independently of WUSCHEL‐like (WOX) proteins in bryophytes. The relationship between CLAVATA, hormone homeostasis and the evolution of land plant stem cell functions is unknown.
Here we show that in the moss, Physcomitrella (Physcomitrium patens), CLAVATA affects stem cell activity by modulating hormone homeostasis. CLAVATA pathway genes are expressed in the tip cells of filamentous tissues, regulating cell identity, filament branching, plant spread and auxin synthesis. The receptor‐like kinase PpRPK2 plays the major role, and Pprpk2 mutants have abnormal responses to cytokinin, auxin and auxin transport inhibition, and show reduced expression of PIN auxin transporters.
We propose a model whereby PpRPK2 modulates auxin gradients in filaments to determine stem cell identity and overall plant form.
Our data indicate that CLAVATA‐mediated auxin homeostasis is a fundamental property of plant stem cell function, probably exhibited by the last shared common ancestor of land plants.
Keywords: CLAVATA, CLV‐WUS, evo‐devo, moss filament identity, physcomitrella, plant stem cell
Introduction
Organ size and shoot architecture are determined by the number and activity of stem cells in the growing shoot tips of flowering plants such as Arabidopsis (Fletcher, 2018). The size and integrity of Arabidopsis shoot tips is maintained by the action of a molecular feedback loop involving CLAVATA peptides and receptors and the WUSCHEL transcription factor (Schoof et al., 2000; Somssich et al., 2016). CLAVATA3 is expressed in stem cells in the outermost cell layers (Fletcher et al., 1999), encoding a protein that is processed to form a small diffusible peptide (Rojo et al., 2002; Lenhard & Laux, 2003; Kondo et al., 2006; Ohyama et al., 2009). The CLAVATA3 peptide acts as a ligand to the CLAVATA1 receptor which is active in inner cell layers of the shoot tip (Clark et al., 1997; Ogawa et al., 2008), and signalling via CLAVATA1 confines the expression of WUSCHEL to a few cells at the centre of the shoot tip (Schoof et al., 2000). In turn, the WUSCHEL protein moves to the outermost cell layers of the shoot tip (Yadav et al., 2011; Daum et al., 2014), promoting expression of CLAVATA3. Mutants with defective CLAVATA or WUSCHEL function respectively over‐proliferate cells in the shoot tips or are unable to maintain the stem cell population, resulting in enlargement of the tips or shoot termination (Laux et al., 1996; Clark et al., 1997). CLAVATA function depends on the maintenance of low levels of auxin signalling permissive to stem cell activity in the central zone of the shoot tips by WUSCHEL (Schoof et al., 2000; Ma et al., 2019).
Unlike Arabidopsis, the growing tips of mosses such as Physcomitrium patens comprise a single apical cell (Harrison, 2017). Spores germinate to form a branching mat of filamentous tissue termed the protonema, and tip growth in the apical cells of each protonemal filament extend plant spread (Menand et al., 2007a). When growth commences, filaments have chloronemal identity and serve a primarily photosynthetic function, having many large dark green chloroplasts, but later on, more rapidly growing foraging filaments with smaller pale chloroplasts develop (caulonemata) (Ashton et al., 1979). Whereas chloronemal apical cells cleave in a plane perpendicular to the main axis of growth, caulonemal apical cells cleave obliquely and generate cells that are longer than chloronemal cells (Ashton et al., 1979). The relative growth of chloronemata and caulonemata determines the size and shape of the plant, such that plants comprising only chloronemata are small and round, whereas plants with predominantly caulonemata are larger and have an irregular foraging fringe (Prigge et al., 2010).
Auxin promotes caulonemal differentiation via a TRANSPORT INHIBITOR RESPONSE (TIR1)/AUXIN‐SIGNALING F‐BOX (AFB) and AUX/IAA‐dependent mechanism (Prigge et al., 2010; Viaene et al., 2014; Lavy et al., 2016; Thelander et al., 2018). Protonemal apical cells are the site of cell fate decisions that affect overall plant shape, yet auxin reporters suggest that they have minimal auxin sensing (Thelander et al., 2019). Exogenously applied cytokinin has a converse effect to auxin, suppressing caulonemal differentiation. Cytokinin promotes AUX/IAA expression, and cytokinin‐induced expression depends on auxin signalling (Ashton et al., 1979; Prigge et al., 2010). Thus, a complex interplay between auxin and cytokinin regulates protonemal tip cell identity, the chloronema‐to‐caulonema transition and overall plant shape.
The P. patens CLAVATA pathway comprises four CLAVATA3‐like peptides encoded with some redundancy by nine genes (PpCLEs 1–9), two CLAVATA1‐like receptors (PpCLV1a and PpCLV1b), and a further receptor similar to Arabidopsis receptor‐like kinase RPK2 (PpRPK2) (Goad et al., 2017; Fletcher, 2018; Whitewoods et al., 2018). Whilst PpCLEs1–7 were identified from the V1.6 Physcomitrium genome, the sequences of PpCLE8 and PpCLE9 were identified using the V3 genome, and these genes encode the same peptides as PpCLE1, PpCLE2 and PpCLE3, as shown in Table 1 (Whitewoods et al., 2018). Previous work demonstrated that PpCLEs 1, 2 and 7 and PpCLV1a, PpCLV1b and PpRPK2 are highly expressed, and are required to establish stem cells that iterate shoot‐like structures (gametophores), affecting stem cell growth, identity and division plane orientations (Whitewoods et al., 2018). PpcleAmiR1‐3, PpcleAmiR4‐7, Ppclv1a1b and Pprpk2 mutants had striking defects in gametophore development but comparatively normal protonemal development (Whitewoods et al., 2018).
Table 1.
Peptide sequences encoded by Physcomitrium patens CLAVATA (CLV)/ENDOSPERM SURROUNDING REGION (ESR)‐related (CLE) genes.
| Gene names | Peptide sequence encoded |
|---|---|
| PpCLE1, PpCLE2 and PpCLE3, PpCLE8 and PpCLE9 | R M VP T GPNPLHN |
| PpCLE4 | R M VP S GPNPLHN |
| PpCLE5 and PpCLE6 | R L VP T GPNPLHN |
| PpCLE7 | R V VP T GPNPLHN |
Residues colour‐coded in blue vary between peptides.
There are three P. patens WUSCHEL‐like homeobox (WOX) genes, and previous work detected constitutive expression of PpWOX13LA and PpWOX13LB, but no expression of PpWOX13LC; PpWOX13LA and PpWOX13LB protein fusions showed elevated expression in protonemal stem cells and stem cells forming in a leaf regeneration assay (Sakakibara et al., 2014). Ppwox13lab mutants were unable to initiate growth in leaf regeneration assays but were otherwise indistinguishable from wild‐type plants during gametophyte development, and this divergence in phenotypes suggests that P. patens WOX and CLAVATA genes act independently (Sakakibara et al., 2014). Marchantia polymorpha CLAVATA pathway components (MpCLE2 and MpCLV1) likewise act in a WOX‐independent manner (Hirakawa et al., 2020). Thus, whilst CLAVATA is a conserved regulator of land plant stem cell function, WOX function appears inessential in bryophytes, raising questions about the evolution of the CLAVATA–WUSCHEL gene regulatory network and the regulation of stem cell function in bryophytes and the last shared common ancestor of land plants. Here we show that CLAVATA acts in protonemata to repress the chloronema to caulonema developmental transition and propose a model whereby CLAVATA regulates stem cell identity by modulating auxin homeostasis and PIN‐mediated auxin transport.
Materials and Methods
Plant growth
The Physcomitrium patens Gransden strain was used as the wild‐type (WT) for all experiments, and PpcleAmiR1‐3, PpcleAmiR4‐7, Ppclv1a, Ppclv1b, Ppclv1a1b, Pprpk2, PpCLE1::NGG, PpCLE2::NGG, PpCLE7::NGG, PpCLV1A::NGG, PpCLV1B::NGG and PpRPK2::NGG line generation strategies were described previously (Whitewoods et al., 2018) (CLV, CLAVATA; CLE, CLV/ENDOSPERM SURROUNDING REGION (ESR)‐related); RPK, receptor‐like kinase). Ppclv1a1brpk2 mutants were a gift from Joe Cammarata, Adrienne Roeder and Mike Scanlon, and were generated by CRISPR‐Cas9 editing PpRPK2 in a Ppclv1a1b mutant background (Cammarata et al., 2021). Plants were spot‐propagated on BCDAT media (0.5% Agar, 1 mM magnesium sulphate (MgSO4), 3.67 mM monopotassium phosphate (KH2PO4), 10 mM potassium nitrate (KNO3), 45 µM iron sulfate (FeSO4), 5 mM ammonium tartrate dibasic ((NH4)2C4H4O6), 0.5 mM CaCl2, 1 : 1000 dilution of Trace Elements Solution (0.614 mg l−1 H3BO3, 0.055 mg l−1 AlK(SO4)2.12H2O, 0.055 mg l−1 CuSO4.5H2O, 0.028 mg l−1 KBr, 0.028 mg l−1 LiCl, 0.389 mg l−1 MnCl2.4H2O, 0.055 mg l−1 CoCl2.6H2O, 0.055 mg l−1 ZnSO4.7H2O, 0.028 mg/LKI and 0.028 mg l−1 SnCl2.2H2O)) unless otherwise stated, and grown at 23°C in continuous light or at 22°C in long day conditions (16 h : 8 h, light : dark photperiod). Uniform 1 mm2 spots of 10–15‐d‐old filamentous tissue were used to inoculate growth experiments. To generate spores, protonemal homogenates were sown on peat plugs in Magenta vessels and grown at 23°C in continuous light for 8–10 wk before transfer to 16°C short day conditions (8 h : 16 h, light : dark). Mature sporogonia were harvested, incubated in 10% sodium hypochlorite for 5 min and washed three times with sterile water, then refrigerated or ruptured in sterile water and germinated in continuous light on BCDAT medium lacking Trace Elements Solution and with 10 mM CaCl2.
Pharmacological treatments
1 mM and 100 µM 1‐naphthaleneacetic acid (NAA) and 100 µM and 10 µM 6‐Benzylaminopurine (BAP) stock solutions were prepared in 70% ethanol. 100 mM stocks of l‐Kynurenine (L‐Kyn) were prepared using dimethyl sulfoxide (DMSO) as a solvent. 5 mM N‐1‐naphthylphthalamic acid (NPA) stocks were prepared in 1 ml DMSO made up to 50 ml with 70% EtOH. All reagents were added to warm growth media before pouring plates.
Phenotype analysis
Plant areas and perimeters were measured using fiji from images taken using a VHX‐1000 microscope (Keyence, Osaka, Japan) with a ×10 objective, excluding gametophores. These values were used to calculate the perimeter ratio, the ratio between the measured perimeter and the perimeter of a perfectly circular plant of the same area. For cell identity measurements, filaments protruding from the margins of 4‐wk‐old plants were dissected and stained with 0.3% Toluidine Blue for 2 min, rinsed in water and mounted on slides with coverslips before imaging with a DM2000 microscope (Leica, Wetzlar, Germany) using a ×40 objective or a VHX‐1000 microscope (Keyence) using a ×50–200 objective. The length and cell division angle of subapical cells of main filaments and of the second cell in branches with at least three cells were measured using fiji as described previously (Coudert et al., 2019).
Generation of promoter::NGG lines
Promoter sequences from PpCLE3 (2427 bp), PpCLE4 (2867 bp), PpCLE5 (1731 bp) and PpCLE6 (1458 bp) were PCR‐amplified using a proofreading polymerase and cloned directly into the SmaI site of a modified PIG1NGGII (Ishikawa et al., 2011) vector in which an NptII resistance cassette was substituted for the BSD cassette (Whitewoods et al., 2018). The promoter plus the first few amino acids of the peptide coding sequence were PCR‐amplified from PpCLE8 (3216 bp) and PpCLE9 (1799 bp) before insertion into PIG1NGGII to generate a translational fusion with the reporter gene. All constructs were linearized with PmeI before plant transformation. Lines were screened using a forward primer from the PIG1 targeting locus and a promoter‐specific reverse screening primer to check the 5′ integration site, and a CaMV terminator forward primer and reverse primer from the PIG1 locus were used to check the 3′ integration site. Southern analyses to verify targeting were undertaken using either a green fluorescent protein (GFP)–β‐glucuronidase (GUS) probe PCR‐amplified to incorporate a DIG label (PpCLE3, PpCLE4, PpCLE5, PpCLE6 and PpCLE9) or a probe against the 35S::NptII resistance cassette (PpCLE8) as illustrated in Supporting Information Fig. S1, and using methods described in Whitewoods et al., (2018). Primer sequences are listed in Table S1.
Nucleic acid extraction
DNA for PCR and Southern analysis was extracted using a modified CTAB protocol (Doyle & Doyle, 1990). RNA for expression analyses was extracted from 5 d‐old protonemata using a RNeasy Plant Mini Kit (Qiagen). Genomic DNA removal and cDNA synthesis were performed with a Quantitect Reverse Transcription kit (Qiagen).
Southern analysis
Southern blot analysis was carried out as described previously (Kamisugi et al., 2005). Genomic DNA (2.5 μg) was digested with HindIII (PpCLE3, PpCLE4, PpCLE5, PpCLE8 and PpCLE9) or ScaI (PpCLE6), and transferred to HyBond‐N‐Plus membrane for hybridization with the digoxygenin‐labelled GFP–GUS reporter sequence.
Expression analysis
Reverse transcription (RT)‐PCR was performed using a 1 : 10 dilution of cDNA as a template, and EcoTaq polymerase (Desai & Pfaffle, 1995). Where possible, primers were designed to span an intron or were placed on an intron–exon boundary, and a UBIQUITIN transcript was amplified as a positive control (Table S2). Quantitative (q)PCR was performed using a SYBR Green Quantitect kit and a Stratagene M×3005P bioanalyser with 95°C for 15 min, and then 94°C for 15 s, 60°C for 30 s, 72°C for 30 s cycling conditions for 40 cycles. Amplicon size was checked by dissociation curve. The efficiency of each primer pair was calculated on serial dilutions of WT cDNA, and only primer pairs with an efficiency between 90% and 110% were used in further experiments. To calculate fold‐change for each sample relative to the WT expression levels, the ΔΔCt method was used (Livak & Schmittgen, 2001). PINA, PINB, PINC, PIND and 60S genes were amplified using primers listed in Table S3.
Histochemical expression analysis
For whole plant expression analyses, plants were grown on BCDAT media containing 0.5% agar, cut out of plates and immersed in a staining solution which comprised 100 mM phosphate buffer (pH 7.0), 10 mM Tris‐HCl (pH 8.0), 1 mM ethylenediaminetetraacetic acid (EDTA), 0.05% Triton X‐100, 2 mM potassium ferricyanide, 2 mM potassium ferrocyanide and 1 mg ml−1 X‐Gluc (5‐bromo‐4‐chloro‐3‐indolyl‐β‐d‐glucuronic acid) dissolved in 10% (v/v) DMSO). Samples were incubated at 37°C for 7.5 h (PpCLE3::NGG, PpCLE4::NGG, PpCLE5::NGG, PpCLE6::NGG, PpCLV1b::NGG and PpRPK2::NGG), 15 h (PpCLE2::NGG, PpCLE8::NGG, PpCLE9::NGG and PpCLV1a::NGG) or 21 h (PpCLE1::NGG and PpCLE7::NGG) except for samples in Fig. 1(a), which were incubated for a third of the time with 0.5 mM potassium ferricyanide and 0.5 mM potassium ferrocyanide instead. Reactions were stopped by substituting the staining solution with ethanol. Samples were bleached overnight in 70% ethanol, rinsed in water then imaged using a Keyence VHX‐1000 digital microscope (whole plants) or a Leica DM2000 microscope (sporelings and filaments). For spore and sporeling expression analyses, plants were germinated on cellophane discs, moved to staining solution and imaged immediately after incubation.
Fig. 1.
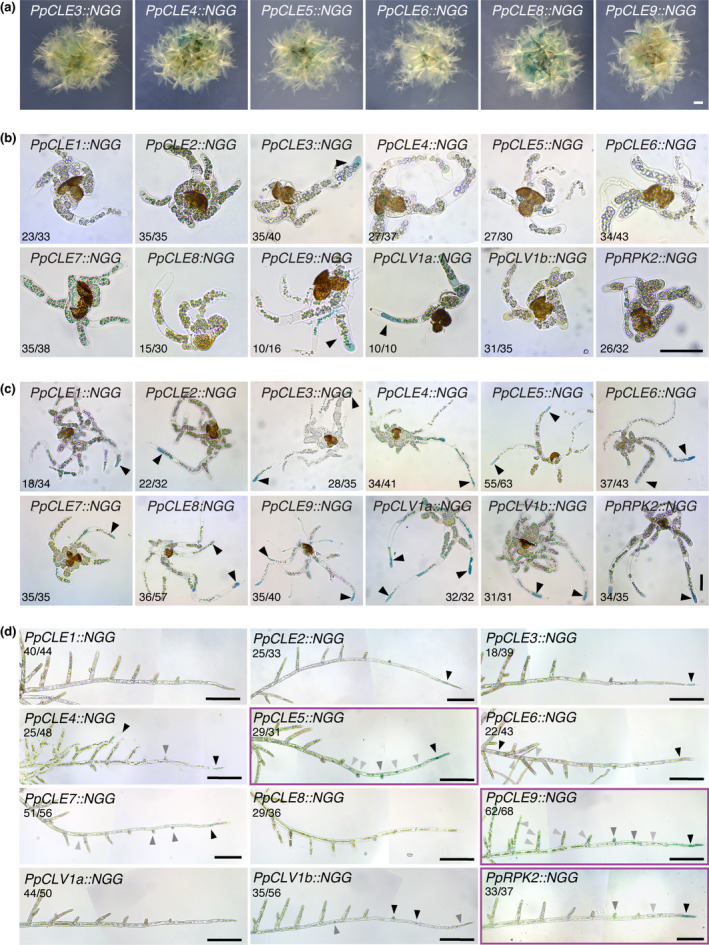
Caulonemal tip cells are likely sites of CLAVATA (CLV)/ENDOSPERM SURROUNDING REGION (ESR)‐related (CLE) peptide production and perception in Physcomitrium patens. (a) Micrographs showing expression patterns of newly generated PpCLE::NGG lines in whole plants, with signal in gametophores and protonemal tissues. Bar, 1 mm. (b) Micrographs of sporelings which comprised mainly chloronemata. PpCLE3::NGG, PpCLE9::NGG and PpCLV1a::NGG lines showed expression. The numbers in each panel indicate the proportion of sporelings displaying a similar expression pattern. Bar, 50 µm. (c) Micrographs of sporelings comprising a mix of chloronemata and caulonemata. All lines showed CLAVATA expression. The signal was absent or weak in chloronemal cells, but stronger and more frequently detected in caulonemal tip cells (black arrowheads). Numbers in each panel indicate the proportion of sporelings displaying a similar expression pattern. Bar, 50 µm. (d) Stitched light micrographs showing promoter::NGG reporter expression in foraging filaments. Although no signal was detected in the majority of PpCLE1::NGG, PpCLE8::NGG and PpCLV1a::NGG filaments, all other lines accumulated signal in caulonemal tip cells. Stain also was detected in a subset of lines in other caulonemal cells (PpCLE4::NGG, PpCLE5::NGG, PpCLE6::NGG, PpCLE9::NGG, PpCLV1b::NGG, PpRPK2::NGG), in new branch initials (PpCLE5::NGG, PpCLE7::NGG, PpCLE9::NGG, PpCLV1b::NGG, PpRPK2::NGG) or in chloronemal branch cells (PpCLE4::NGG, PpCLE9::NGG) (RPK, RECEPTOR‐LIKE KINASE). Both PpCLV1b::NGG and PpRPK2::NGG accumulated stain in caulonemal tip cells and new branch/bud initials but PpRPK2::NGG stained more strongly in caulonemal tip cells, and a subset of samples showed only this signal (4 of 37), whereas a subset of PpCLV1B::NGG samples accumulated signal only in the branch initials (12 of 56). Numbers in each panel indicate the proportion of filaments displaying a similar expression pattern. Tissue was stained for 7.5 h (PpCLE3::NGG, PpCLE4::NGG, PpCLE5::NGG, PpCLE6::NGG, PpCLE8::NGG, PpCLV1b::NGG and PpRPK2::NGG), 15 h (PpCLE2::NGG, PpCLE9::NGG and PpCLV1a::NGG) or 21 h (PpCLE1::NGG and PpCLE7::NGG). Black arrowheads indicate the strongest expression, grey arrows indicate weaker expression. Purple frames indicate lines with strong expression in caulonemal tip cells. Bar, 200 µm.
Hormone quantification
Hormone quantification by an ultra‐high performance liquid chromatography‐electrospray tandem mass spectrometry (UHPLC‐MS/MS) was undertaken using protonemal homogenates grown through three passages of 5 d in continuous light. Fifty milligrams of tissue were snap‐frozen in liquid nitrogen, and hormone extraction and quantification were undertaken as described by Novák et al., (2012) and Svaçinová et al. (2012).
Results
P. patens CLAVATA genes are expressed in protonemata
In order to investigate roles for CLAVATA in protonemal development, we first engineered promoter::NLSGFPGUS (promoter::NGG) reporter lines for PpCLE3, PpCLE4, PpCLE5, PpCLE6, PpCLE8 and PpCLE9 whose expression was uncharacterized in previous work (Whitewoods et al., 2018) (Fig. 1a, S1). Analysis of 3‐ to 4‐wk‐old plants revealed signal in protonemal tissues and gametophores for all promoter::NGG lines, and expression patterns were consistent between independently generated lines (not shown). To determine when CLAVATA expression first arises during development, spores from previously established PpCLE1::NGG, PpCLE2::NGG, PpCLE7::NGG, PpCLV1a::NGG, PpCLV1b::NGG and PpRPK2::NGG lines (Whitewoods et al., 2018), and newly engineered PpCLE3::NGG, PpCLE4::NGG, PpCLE5::NGG, PpCLE6::NGG, PpCLE8::NGG and PpCLE9::NGG lines were germinated and grown for 2–11 d before staining (Fig. 1b,c). PpCLV1a::NGG signal was detected at germination (Fig. S2), and PpCLE3::NGG, PpCLE9::NGG and PpCLV1a::NGG signal was detected in primary chloronemata (Fig. 1b). Following caulonemal differentiation, all lines showed signal in caulonemal tip cells (Fig. 1c).
Caulonemal filaments extending from the foraging fringe were dissected to observe expression at later developmental stages (Fig. 1d). No signal was detected in PpCLE1::NGG, PpCLE8::NGG or PpCLV1a::NGG lines, but the promoters of all remaining PpCLEs were active in caulonemal tip cells, and PpCLE5::NGG and PpCLE9::NGG lines showed the strongest signal. PpCLV1b::NGG lines frequently showed signal in side branch initials and the second and third cells from the tip, and PpRPK2::NGG lines showed strong signal in the majority of caulonemal tip cells. Taken together these expression data indicate roles for PpCLE5, PpCLE9 and PpRPK2 in CLE production and perception in caulonemal tip cells, and to a lesser extent indicate potential roles for PpCLV1b in caulonemal tip cells and branch initials.
P. patens clavata mutants have cell identity and plant shape defects
In order to investigate roles for CLAVATA in protonemal development, we first quantified overall plant spread in WT and mutant plants (Fig. 2a,b). We also quantified a measure of plant shape, the perimeter ratio, which reflects the circularity of plant spread. A perimeter ratio of 1 corresponds to a perfectly circular shape, and higher values indicate irregular plant shapes with no increase in area and increased production of caulonemata (Fig. 2b). Whilst PpcleAmiR1‐3 mutants had a similar size and shape to WT plants, PpcleAmiR4‐7 mutants had greater spread but similar perimeter ratios to the WT, implying increased but uniform protonemal growth (Fig. 2b). Amongst receptor mutants, Ppclv1a, Ppclv1b and Ppclv1a1b mutants sometimes had increased areas and perimeter ratios, but the size and shape differences from WT plants were subtle and variable between experimental replicates. By contrast, Pprpk2 and Ppclv1a1brpk2 mutants were consistently and significantly larger with higher perimeter ratios than WT plants, indicating higher caulonema production and a key role for PpRPK2 in plant size and shape determination (Fig. 2b).
Fig. 2.
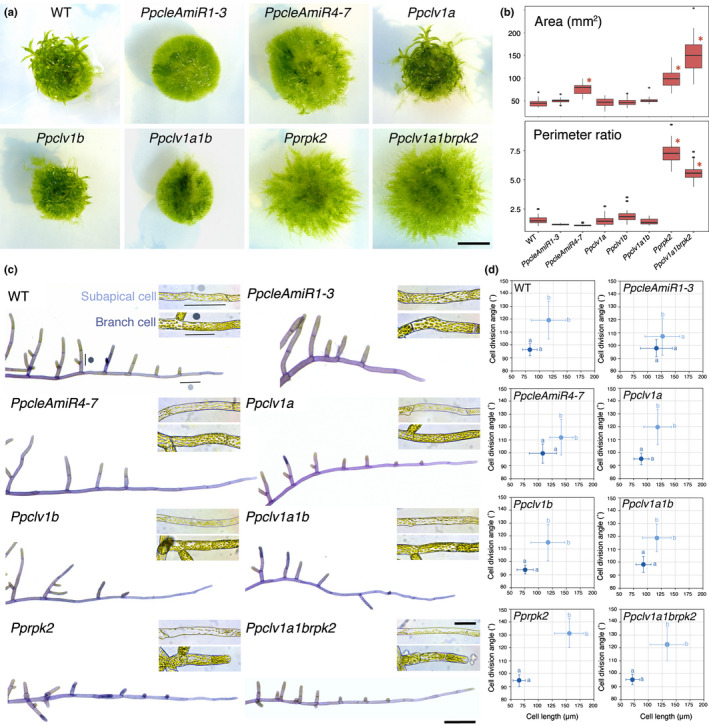
CLAVATA pathway components regulate plant shape and protonemal identity in Physcomitrium patens. (a) Images of 4‐wk‐old plants grown in continuous light showing overall morphology. Bar, 5 mm. (b) Plant spread in PpcleAmiR4‐7, Pprpk2 and Ppclv1a1brpk2 mutants was greater than wild‐type (WT) plant spread, and triple mutants were larger than Pprpk2 mutants (CLE, CLAVATA (CLV)/ENDOSPERM SURROUNDING REGION (ESR)‐related; RPK, RECEPTOR‐LIKE KINASE). Pprpk2 and Ppclv1a1brpk2 mutants had a higher perimeter ratio than WT plants. Data from one of three experimental replicates are shown (n = 32). In the boxplot, horizontal lines represent median values, boxes represent the interquartile range, whiskers represent largest and smallest values within 1.5× above or below 75th and 25th percentiles, respectively, and black circles represent outliers. Asterisks indicate significant difference from the WT (one‐way ANOVA and Tukey’s honestly significant difference test; P < 0.05). (c) Light micrographs of toluidine blue stained and dissected protonemal filaments, showing differences in apical dominance and cell morphology between genetic backgrounds. Insets show typical unstained subapical and branch cells from each line. Bars: 200 µm (main); 50 µm (inset). (d) Subapical cells (pale blue dots; caulonemal cells in WT) and branch cells (dark blue dots; chloronemal cells in WT) have distinct shapes in Wt plants, PpcleAmiR4‐7, Ppclv1a, Ppclv1b, Ppclv1a1b, Pprpk2 and Ppclv1a1brpk2 mutants, but PpcleAmiR1‐3 mutant cell types are less distinct. Subapical cell and branch cell measurements partially overlap in all lines except Pprpk2. Different letters indicate significant difference in cell length or division plane orientation, bars indicate SD (n ≥ 28; two‐way ANOVA P < 0.05).
In order to further investigate the cellular basis of plant spread and perimeter ratio differences between lines, protonemal morphology was quantified by measuring the length and cell division plane orientations of subapical cells of main filaments (subapical cells) and side branches (branch cells), as these report differences between caulonemal and chloronemal identity (Coudert et al., 2019) (Fig. 2c,d). Ppclv1a, Ppclv1b and Ppclv1a1b mutants showed no significant differences from WT plants with respect to subapical and branch cell length or cell division plane orientation in most experimental replicates (Fig. S3). However, although PpcleAmiR1‐3 mutants were the same overall size as wild‐type plants, their cell types showed mixed chloronemal and caulonemal identities, with less oblique cell divisions in subapical cells and longer branch cells than WT plants (Fig. S3). PpcleAmiR4‐7 mutant protonemata retained distinct cell identities but had longer subapical and branch cells than WT plants. Pprpk2 and sometimes Ppclv1a1brpk2 mutants had more distinct cell identities than WT plants, with longer and more oblique cell division plane orientations (Fig. S3).
More subtle differences in protonemal morphology also were observed following filament dissection (Fig. 2c). Wild‐type filaments initiate branches from the second subapical cell, and branch growth continues to give protonemata regular branching patterns (Fig. 2c). Branches close to the tip were longer in PpcleAmiR1‐3 mutants than WT branches in equivalent positions, and Pprpk2 and Ppclv1a1brpk2 mutants conversely had shorter branches (Fig. 2c, S4). Thus, CLE signalling regulates protonemal morphology in P. patens and PpRPK2 holds the main role as a repressor of plant spread, perimeter ratio and caulonemal identity.
Pprpk2 mutants are hypersensitive to cytokinin application
As Ppclv1a and Ppclv1b mutant phenotypes were variable, and PpcleAmiR mutant phenotypes reflect changes in expression of several PpCLEs (Fig. S5), we focused further functional analyses on Ppclv1a1b, Pprpk2 and Ppclv1a1brpk2 mutants. In WT plants, filament identity reflects a hormonal interplay between auxin and cytokinin, and cytokinin suppresses caulonemal identity (Ashton et al., 1979). We therefore reasoned that PpRPK2 could promote cytokinin biosynthesis or enhance plants' response to cytokinin. To test the hypothesis that PpRPK2 promotes cytokinin biosynthesis, we used LC‐MS/MS to quantify cytokinin concentrations in protonemal tissue from Ppclv1a1b, Pprpk2 and Ppclv1a1brpk2 mutants and WT controls. In flowering plants, cytokinin bases, and to a lesser extent ribosides are the active forms, whereas nucleotides and O‐glucosides (OG) are inactive and can function in storage (Kieber & Schaller, 2018). In P. patens isopentenyl adenine (iP), trans‐zeatin (tZ) and their corresponding ribosides were shown to have the highest biological activity in a bud induction assay (von Schwartzenberg et al., 2007), whereas neither cis‐zeatin (cZ), cis‐zeatin riboside (cZR) nor any of the ribotides had a bud inductive role. Twenty‐six types of cytokinin were assayed, including free bases as iP, tZ, cZ and dihydrozeatin (DHZ), and their ribotide (MP), riboside (R) and glycoside derivatives (Fig. S6). Thirteen types of cytokinins were detected, and although some mutant‐specific differences were present at the level of conjugates such as cZRMP, tZOG and tZROG, the only free base present at higher concentrations in mutants was cZ in Ppclv1a1b mutants. No difference in the overall level of cytokinin was detected. Thus, the hypothesis that PpRPK2 reduces plant spread by promoting cytokinin biosynthesis was rejected.
We next tested the hypothesis that PpRPK2 enhances plants' response to cytokinin. To this end, we grew mutants and WT plants on media containing a solvent control (0.07% EtOH) or 100 nM of the synthetic cytokinin 6‐benzylaminopurine (BAP), and analyzed their phenotypes after 4–5 wk of growth (Fig. 3). As expected, WT plants showed a decrease in plant spread in response to exogenously applied BAP (Fig. 3a,b). On average, the area of WT plants grown on 100 nM BAP was 26% ± 11% smaller than that of control plants, with no difference in perimeter ratio. The response to BAP treatment was sometimes weaker in PpcleAmiR1‐3 and Ppclv1a1b mutants than in controls, but Pprpk2 and Ppclv1a1brpk2 plants grown on 100 nM BAP consistently showed an enhanced response, with a 59% ± 3% and 43% ± 9% (respectively) decrease in plant spread and reductions in perimeter ratio (Fig. 3a,b).
Fig. 3.
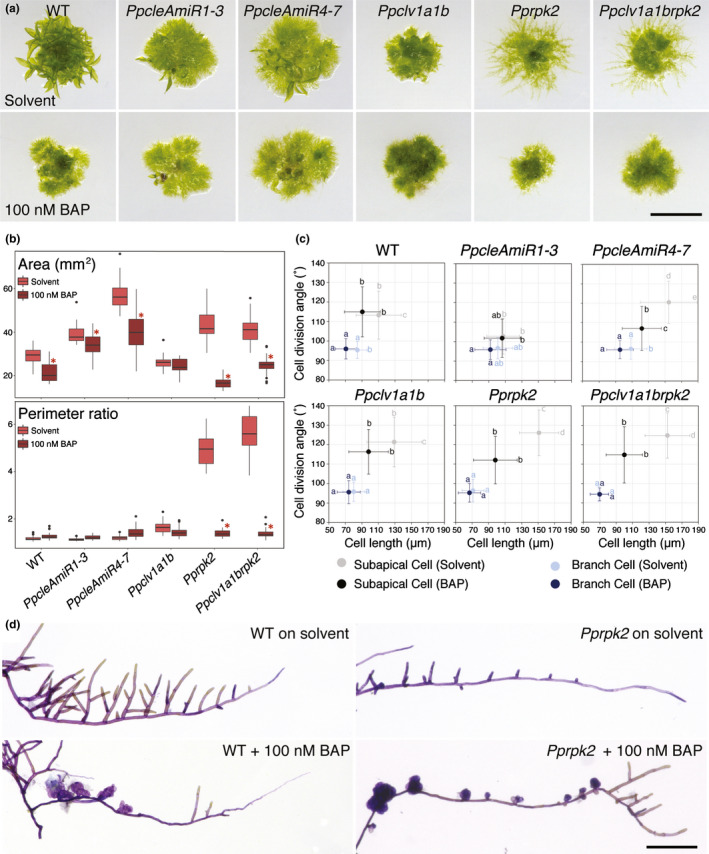
Cytokinin treatment disproportionally affects protonemal growth in Physcomitrium patens clavata mutants. (a) Micrographs of 4‐wk‐old plants grown on media containing a solvent control (EtOH) or cytokinin (100 nM 6‐Benzylaminopurine (BAP)). Bar, 5 mm. (b) Whilst Ppclv1a1b plant area was not significantly affected by cytokinin treatment, wild‐type, (WT) PpcleAmiR1‐3, PpcleAmiR4‐7, Pprpk2 and Ppclv1a1brpk2 plants showed decreased area, with the decrease being more conspicuous in Pprpk2 and Ppclv1a1brpk2 mutants (CLV, CLAVATA; (CLE, CLAVATA (CLV)/ENDOSPERM SURROUNDING REGION (ESR)‐related; RPK, RECEPTOR‐LIKE KINASE). The perimeter ratio did not change in response to cytokinin treatment in WT, PpcleAmiR1‐3, PpcleAmiR4‐7 or Ppclv1a1b plants, but strongly decreased in Pprpk2 and Ppclv1a1brpk2 mutants. In the boxplot, horizontal lines represent median values, boxes represent the interquartile range, whiskers represent largest and smallest values within 1.5× above or below 75th and 25th percentiles, respectively, and black circles represent outliers. Asterisks indicate significant difference to EtOH control (multi‐way ANOVA and Tukey's honestly significant difference (HSD) test; P < 0.05; n ≥ 30). (c) Graphs showing a reduction in subapical cell length in response to cytokinin application in WT and Ppclv1a1b plants, and a strong reduction in subapical cell length and division plane angles in PpcleAmiR4‐7, Pprpk2 and Ppclv1a1brpk2 mutants grown on 100 nM BAP. Letters indicate significant differences between groups, error bars indicate SD (n ≥ 90; multi‐way ANOVA and Tukey's HSD test; P < 0.05). (d) Micrographs of caulonemal filaments dissected from WT or Pprpk2 mutants grown on plates containing a solvent control (EtOH) or 100 nM BAP. Pprpk2 mutants treated with BAP produced a near constitutive overbudding phenotype. Bar, 200 µm.
In order to study cytokinin responses at the cellular level, we dissected foraging filaments from plants and measured cell lengths and division planes as described previously (Fig. 3c). In WT plants, BAP treatment reduced cell lengths in both subapical and branch cells, whereas division plane angles were unaffected. In Ppclv1a1b and PpcleAmiR1‐3 mutant subapical cells, responses to cytokinin were respectively similar to or weaker than WT responses. However, PpcleAmiR4‐7, Pprpk2 and Ppclv1a1brpk2 subapical cells showed a large reduction in both cell length and division plane angle following BAP treatment. Thus, Pprpk2 and Ppclv1a1brpk2 mutant plants have an enhanced response to cytokinin in caulonemal tip cells as well as in whole plants, refuting the hypothesis that PpRPK2 promotes plants' response to cytokinin. Pprpk2 mutants showed further evidence of cytokinin hypersensitivity in gametophore initiation, which is normally upregulated by cytokinin (Ashton et al., 1979). Whilst WT plants grown on BAP showed a higher frequency of gametophore initiation than untreated controls, Pprpk2 mutants grown on BAP showed almost constitutive gametophore initiation (Fig. 3d).
Auxin synthesis is not elevated in Pprpk2 mutants, but mutant increases in plant spread require auxin
Because auxin can enhance or suppress cytokinin activity in P. patens (Ashton et al., 1979), we hypothesized that cytokinin hyper‐sensitivity in Pprpk2 and Ppclv1a1brpk2 mutants could reflect differences in auxin biosynthesis. To test the dependence of clavata mutant phenotypes on auxin biosynthesis, we grew WT and mutant plants on media containing a pharmacological inhibitor of auxin synthesis (10 µM L‐Kyn) or a solvent control (0.01% DMSO) (Fig. 4a‐c). When grown on L‐Kyn, WT plants showed significantly smaller areas than plants grown on a solvent control. Area decreased in all clavata mutants except Ppclv1b, and decreases were largest in PpcleAmiR4‐7, Pprpk2 and Ppclv1a1brpk2 mutants (Fig. 4b). Perimeter ratios were consistently unaffected by L‐Kyn in WT, PpcleAmiR1‐3, PpcleAmiR4‐7 and Ppclv1a1b plants. Whilst Pprpk2 and Ppclv1a1brpk2 mutant perimeter ratios remained higher than WT values, perimeter ratios decreased significantly following L‐Kyn treatment in these mutants, indicating that their irregular shapes depend on auxin synthesis. To test the effect of L‐Kyn on cell identity, we dissected foraging filaments and measured cell length and cell division plane orientations. While no response to L‐Kyn was detected in branch cells, subapical cells of all lines were shorter and/or had division plane angles closer to 90° when plants were grown on L‐Kyn, and these differences were significant in PpcleAmiR4‐7, Ppclv1a1b and Pprpk2 mutants. Hence, WT and clavata mutant plants have a qualitatively similar response to auxin biosynthesis inhibition, and auxin synthesis is needed for the caulonemal overproliferation phenotype of Pprpk2 and Ppclv1a1brpk2 mutants.
Fig. 4.
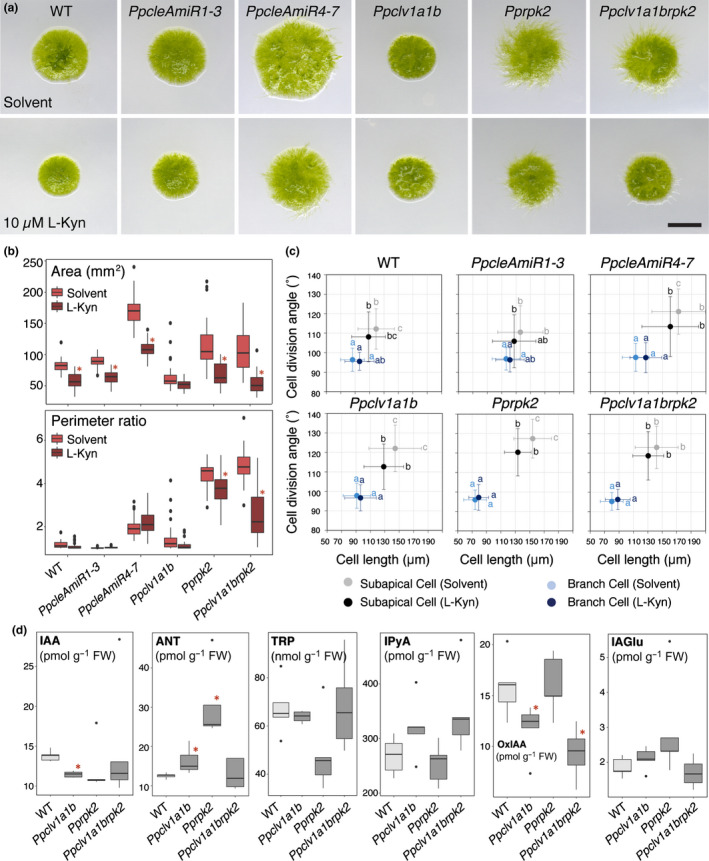
Physcomitrium patens rpk2 and clv1a1brpk2 mutant phenotypes depend on auxin synthesis, and mutants have synthesis defects (CLV, CLAVATA; RPK, RECEPTOR‐LIKE KINASE). (a) Micrographs of 4‐wk‐old plants grown on media containing a solvent control (DMSO) or a pharmacological inhibitor of auxin synthesis (10 µM l‐Kynurenine (L‐Kyn)). Bar, 5 mm. (b) Plant spread in all lines diminishes in response to L‐Kyn, but perimeter ratio values decreased only in Pprpk2 and Ppclv1a1brpk2 mutants (two‐way ANOVA and Tukey's honestly significant difference (HSD) test; n ≥ 30; *, P < 0.05 between treatment and control). (c) L‐Kyn treatment suppresses subapical cell length in Ppclv1a1b and Pprpk2 mutants, and suppresses oblique cell divisions in PpAmiR4‐7, Ppclv1a1b and Pprpk2 mutants. Letters indicate significant differences between groups, error bars indicate SD (multi‐way ANOVA and Tukey's HSD test, n ≥ 90, P < 0.05). (d) Quantification of auxin metabolites from wild‐type, Ppclv1a1b, Pprpk2 and Ppclv1a1brpk2 protonemal cultures showed that auxin levels were depleted in Ppclv1a1b and Pprpk2 mutants in 4 of 5 biological replicates. IAA, Indole‐3‐acetic acid; ANT, Anthranilate; TRP, Tryptophan; IPyA, Indole‐3‐pyruvic acid; OxIAA, 2‐oxindole‐3‐acetic acid; IAGlu, IAA‐glucose; Student’s T‐test; n = 5; *, P < 0.05.
As auxin promotes caulonemal development, we hypothesized that higher levels of auxin production could account for Pprpk2 and Ppclv1a1brpk2 mutant phenotypes. We therefore quantified biologically active auxin IAA, and its precursors anthranilate (ANT); l‐tryptophan (TRP); and indole‐3‐pyruvic acid (IPyA) and degradation products IAA‐glutamate (IAGlu) and 2‐oxindole‐3‐acetic acid (OxIAA) in protonemal tissues of WT and mutant plants. However, we found that Ppclv1a1b and four of five replicates of Pprpk2 tissue batches in fact had lower IAA concentrations than WT protonemata, whereas Ppclv1a1brpk2 IAA concentrations were variable (Fig. 4d). Ppclv1a1b and Pprpk2 protonemata contained more ANT than WT protonemata, and Ppclv1a1b and Ppclv1a1brpk2 mutant protonemata contained less OxIAA than WT samples. As Ppclv1a1b (and usually Pprpk2 mutant) protonemata contained less biologically active auxin (IAA) than WT protonemata, we rejected our hypothesis that higher levels of auxin synthesis contribute to Pprpk2 and Ppclv1a1brpk2 mutant phenotypes.
Pprpk2 mutants show abnormal developmental responses to auxin
Enhanced sensitivity to auxin could yield similar developmental outcomes to high auxin concentrations. To evaluate the response of clavata mutants to exogenous auxin, we grew plants on media containing either the synthetic auxin 1‐naphthaleneacetic acid (1 µM NAA) or a solvent control (0.07% EtOH) (Fig. 5a‐c). In line with previous studies (Ashton et al., 1979; Lavy et al., 2016), WT plant areas increased when grown with additional auxin, but perimeter ratios were unaffected. Although PpcleAmiR1‐3, PpcleAmiR4‐7 and Ppclv1a1b plants showed the same response as WT plants, Pprpk2 plants conversely showed both area and perimeter ratio decreases (Fig. 5a,b). At the cellular level, WT subapical cells showed a strong response to NAA application with division angles close to 90°. PpcleAmiR4‐7 and Ppclv1a1brpk2 mutants also showed significant reductions in division angle following auxin application, and Ppclv1a1b and Pprpk2 mutants showed significant reduction in subapical cell lengths.
Fig. 5.
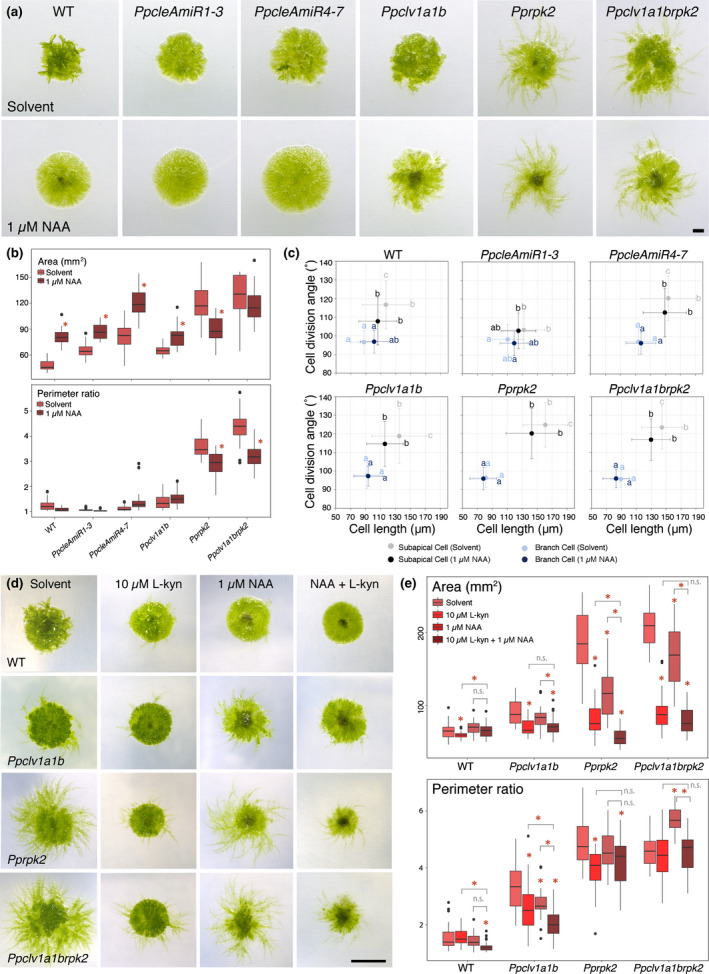
Physcomitrium patens rpk2 and clv1a1brpk2 mutants manifest an abnormal auxin response (CLV, CLAVATA; RPK, RECEPTOR‐LIKE KINASE). (a) Micrographs of 4‐wk‐old plants grown on media containing a solvent control (EtOH) or auxin (1 µM 1‐naphthaleneacetic acid (NAA)). Bar, 1 mm. (b) Quantitative analyses showed that Pprpk2 and Ppclv1a1brpk2 mutant plants show an auxin‐dependent decrease in plant spread and perimeter ratio, whilst all other backgrounds increased in area in response to auxin treatment and showed no change in perimeter ratio (two‐way ANOVA and Tukey's honestly significant difference (HSD) test. n ≥ 30; *, P < 0.05 between treatment and control). (c) Wild‐type (WT), PpcleAmiR4‐7 and Ppclv1a1brpk2 subapical cell division angles diminished following 1 µM NAA treatment, and Ppclv1a1b and Pprpk2 subapical cell lengths decreased, but branch cells and PpcleAmiR1‐3 mutant cells showed no change in length or cell division plane angle. Letters indicate significant differences between groups, error bars indicate SD (multi‐way ANOVA and Tukey's HSD test; n ≥ 90 for all other genotypes; P < 0.05). (d) Micrographs of 4‐wk‐old plants grown on media containing a solvent control (0.07% EtOH + 0.01% DMSO), 10 µM l‐Kynurenine (L‐Kyn), 1 µM NAA or a combination of 10 µM L‐Kyn and 1 µM NAA. Bar, 5 mm. (e) Quantitative analyses showed that whilst WT plant spread showed little response to exogenously applied auxin (1 µM NAA), auxin synthesis inhibitors (10 µM L‐Kyn) or a combination of 1 µM NAA and 10 µM L‐Kyn, Pprpk2 mutant spread strongly decreased in all treatments and the combined treatment led to the strongest decrease. The response of Ppclv1a1b and Ppclv1a1brpk2 mutants varied between experimental replicates, as did perimeter ratios. Asterisks above data indicate significant difference from untreated controls, asterisks above bars indicate significant difference between treatments of interest (n ≥ 30; one‐way ANOVA and Tukey’s HSD test on each genotype; P < 0.05). In boxplots, horizontal lines represent median values, boxes represent the interquartile range, whiskers represent largest and smallest values within 1.5× above or below 75th and 25th percentiles, respectively, and black circles represent outliers.
In order to further dissect the effects of auxin synthesis and auxin response, we uncoupled these two processes by growing plants on media containing either a solvent control (0.01% DMSO + 0.07% EtOH), 10 µM L‐Kyn (reduced synthesis), 1 µM NAA (response plus endogenous synthesis), or a combination of 10 µM L‐Kyn and 1 µM NAA (response in absence of synthesis). We reasoned that if mutant phenotypes are caused by enhanced auxin perception or response, mutants would respond in a similar way to saturating concentrations of exogenously applied auxin (1 µM NAA treatment) both with and without endogenous synthesis (combined treatment). Wild‐type plant spread increased in L‐Kyn + NAA treated plants relative to L‐Kyn treated plants, illustrating the normal response to exogenously applied auxin in the absence of auxin synthesis (Fig. 5d,e). Whilst responses to exogenous auxin in Ppclv1a1b and Ppclv1a1brpk2 mutants were variable between experimental replicates, Pprpk2 mutants grown on the combined treatment had reduced areas relative to either single treatment (Fig. 5d,e). These data did not fit our hypothesis that Pprpk2 mutants should respond similarly to exogenously applied auxin regardless of the concentration of endogenous auxin synthesis. Thus, increased auxin responsiveness was insufficient to fully account for the phenotype of Pprpk2 mutants.
Pprpk2 mutants are sensitive to auxin transport inhibition and have low PIN expression levels
The combined L‐Kyn + NAA treatment above would not only change the amount of auxin present, but also its spatial distribution. Therefore, we next hypothesized that local auxin gradients could be important in Pprpk2 mutant phenotype determination. Promoter fusions have shown that PIN auxin transporter genes are highly expressed in protonemal tip cells of P. patens, and the chloronemal‐to‐caulonemal transition is accelerated in pina pinb mutants but suppressed in PINA and PINB (and to a lesser extent PINC) overexpressors (Viaene et al., 2014). To investigate a potential contribution of auxin transport to Pprpk2 mutant phenotypes, we first took a pharmacological approach, assaying the sensitivity of mutants to transport inhibition. We used naphthylphthalamic acid (NPA) as NPA strongly inhibits PIN function in Arabidopsis and PIN function is conserved (Geldner et al., 2001; Abas et al., 2021). We grew WT plants, Ppclv1a1b, Pprpk2 and Ppclv1a1brpk2 mutants on media containing a solvent control, 5 µM NPA, 1 µM NAA, or a combination of 5 µM NPA and 1 µM NAA (Fig. 6a,b). As expected, WT plant spread increased following treatment with auxin in the single and combined treatments, but perimeter ratios decreased following NPA treatment. Whilst Ppclv1a1b mutants showed a similar response to WT plants, Pprpk2 and Ppclv1a1brpk2 mutants conversely showed mild growth suppression following treatment with 5 µM NPA or 1 µM NAA, and strong growth suppression following the combined treatment. We therefore concluded that Pprpk2 and Ppclv1a1brpk2 mutants were hypersensitive to auxin transport inhibition. To assay the molecular basis of sensitivity to auxin transport inhibition, we quantified PIN expression in protonemal tissues by qPCR (Fig. 6c). Whilst expression levels of the noncanonical PIND did not differ between WT and mutant samples, PINA expression was lower in Pprpk2 mutants and PINB expression was lower in all mutants than in WT tissue (Fig. 6c). PINC is expressed at around the PCR detection limit in WT protonemata (Bennett et al., 2014), and we were unable to detect expression in any mutant. Thus, lower canonical PIN expression may contribute to the generation of Pprpk2 mutant phenotypes by altering the auxin distribution.
Fig. 6.
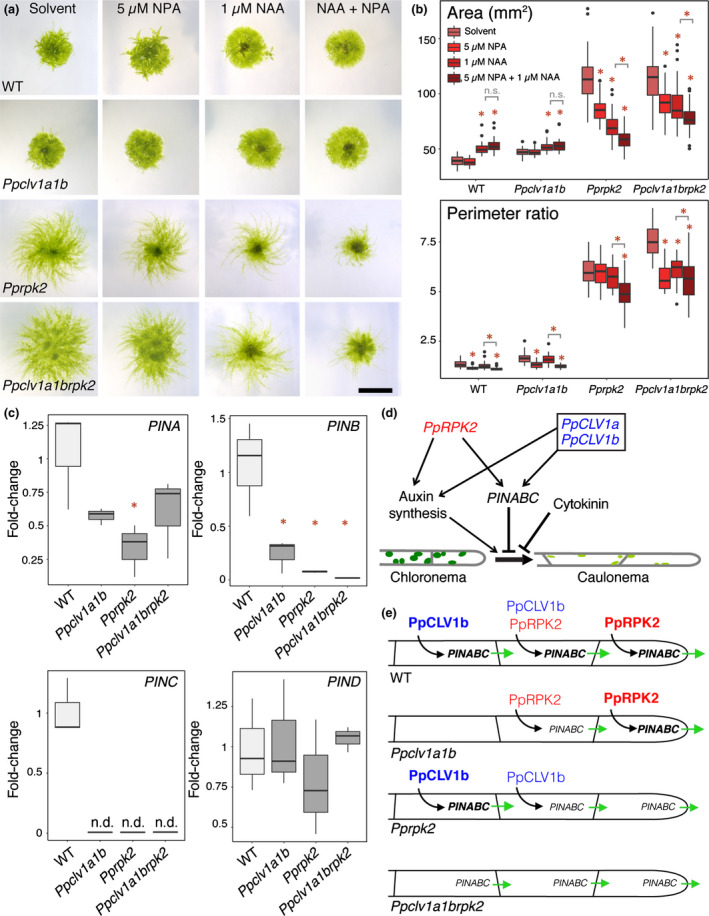
PIN‐mediated auxin transport is dampened in Physcomitrium patens clavata mutants. (a) Images of 4‐wk‐old plants grown on a solvent control, 5 µM N‐1‐naphthylphthalamic acid (NPA), 1 µM 1‐naphthaleneacetic acid (NAA) or a combination of 5 µM NPA and 1 µM NAA. Bar, 5 mm. (b) Quantitative analyses showed that Pprpk2 and Ppclv1a1brpk2 mutant plants showed auxin‐ and auxin transport‐dependent decreases in plant spread and perimeter ratio, whereas wild‐type (WT) and Ppclv1a1b plants showed auxin dependent increases in plant spread and transport‐dependent reductions in perimeter ratio (CLV, CLAVATA; RPK, RECEPTOR‐LIKE KINASE). In the boxplot, horizontal lines represent median values, boxes represent the interquartile range, whiskers represent largest and smallest values within 1.5× above or below 75th and 25th percentiles, respectively, and black circles represent outliers. Asterisks above data indicate significant difference from untreated plants of the same genotype, asterisks above bars indicate significant difference between treatments of interest (n ≥ 30; one‐way ANOVA and Tukey’s honestly significant difference (HSD) test on each genotype; P < 0.05). (c) Quantitative (q)PCR showed that PINA expression was depressed in Pprpk2 mutants relative to WT plants, and PINB and PINC expression were depressed in all mutants. PIND expression showed similar expression levels in WT plants and mutants. 60S was used as housekeeping control (n = 3; n.d., not determined; *, P < 0.05 between WT and mutant samples. No significant differences were found between mutants). (d) Model of the CLAVATA gene regulatory network involved in protonemal stem cell identity. Arrows indicate positive regulation and T bars indicate negative regulation. (e) Model of CLAVATA function in WT and clavata mutant plants. Black arrows indicate positive regulation of gene expression, green arrows indicate the level and direction of auxin fluxes, and the size and strength of the font reflect the strength of gene action.
Discussion
The data above led us to a model whereby CLAVATA controls auxin biosynthesis and the expression of PINA–C, but Physcomitrium patens RECEPTOR‐LIKE KINASE (PpRPK2) has the major role in suppressing the chloronema‐to‐caulonema developmental transition (Fig. 6d). Pprpk2 and Ppclv1a1b mutants show similar reductions in auxin concentrations and PIN expression (Figs 4d, 6c), but Pprpk2 mutants show a much more severe mutant phenotype relative to wild‐type (WT) plants (Fig. 2). As auxin synthesis promotes but auxin transport represses caulonemal development (Ashton et al., 1979; Viaene et al., 2014; Lavy et al., 2016), and CLAVATA promotes auxin synthesis and transport, our data point to a stronger role for auxin transport than synthesis in specifying caulonemal identity. PpRPK2 is most strongly expressed in tip cells, but PpCLV1a and PpCLV1b are respectively expressed at low levels or more strongly away from the tip (Fig. 1d). We propose that these differences in gene expression contribute to differences between Pprpk2 and Ppclv1a1brpk2 and Ppclv1a1b mutant phenotypes, and that PpRPK2 controls the auxin transport status of tip cells to affect plant growth (Fig. 6e). An altered auxin distribution in the tip cells of Pprpk2 mutants or subapical cells of Ppclv1a1b mutants would support our hypothesis. An alternative hypothesis is that PpCLV1a and PpCLV1b could act at least partially independently of PpRPK2, contributing to observed differences in mutant phenotypes between Ppcvl1a1b and Pprpk2 mutants, and there is some support for this hypothesis in recently published work (Cammarata et al., 2021; Demko et al., 2021).
Although protonemal tips cells are the distal site of phenotype determination, auxin signalling is concentrated at the centre of plants (proximally) (Menand et al., 2007b; Jang & Dolan, 2011). Gain‐of‐function pACT::PpPINGFP mutants do not produce caulonemata, and PINs are expressed most strongly in protonemal tip cells and a few subapical cells (Viaene et al., 2014). Our model for PpRPK2 function fits with these prior data by suggesting PIN expression levels are a primary determinant of protonemal morphology. Protonemal tip cells have low TRANSPORT INHIBITOR RESPONSE (TIR)/AUXIN‐SIGNALLING F‐BOX (AFB)‐mediated auxin sensing (Thelander et al., 2019), but can respond strongly to auxin if repressor ARF (PpARFb) levels are low, and PpARFb depletion by tasiRNAs in a subset of filaments patterns caulonema initiation and protonemal branching at plants' foraging fringe (Plavskin et al., 2016). PpCLE and PpRPK2 expression are highest in caulonemal tip cells, and as CLE peptides are diffusible, PpRPK2 could act in parallel or in sequence with PpARFb to pattern caulonema initiation (Fig. S7). As CLAVATA genes are not expressed in secondary chloronemata, we propose that differences in the auxin response between chloronemata and caulonemata in WT plants could reflect distinct domains of CLAVATA and PpARFb activity.
From an evolutionary perspective, our work suggests that roles for CLAVATA in modulating PIN activity, auxin response and stem cell identity (Pallakies & Simon, 2014; Han & Hwang, 2018; Racolta et al., 2018) are conserved within the land plants. In Arabidopsis, the WUSCHEL transcription factor acts downstream of CLAVATA to maintain low auxin conccentrations in stem cells of the central meristem zone. WUSCHEL belongs to the T3 clade of the WUSCHEL‐LIKE HOMEOBOX (WOX) gene family, and T3 WOXes arose from a (T2 + T3) WOX gene duplication pre‐dating the origin of vascular plants (Wu et al., 2019). Bryophytes lost the T2/T3 WOX precursor lineage (Wu et al., 2019), and remaining T1 WOX genes act independently of CLAVATA in bryophytes (Sakakibara et al., 2014; Hirakawa et al., 2020). Thus, it is likely that other transcription factors act in place of WUSCHEL to regulate PIN expression in P. patens. In Arabidopsis, the TDIF/PXY module regulates ARF action independently of WOX genes (Han & Hwang, 2018), and we propose that PpRPK2 could act via an ARF intermediary. Our data suggest that downstream components of the CLAVATA gene regulatory network have been remodelled during evolution. WUSCHEL could have been co‐opted into the CLAVATA gene regulatory network in euphyllophytes, or a T3 WUSCHEL precursor could have been co‐opted into the CLAVATA gene regulatory network in the last common ancestor of vascular plants. Alternatively, CLAVATA could have acted via a T2/T3 WOX precursor to regulate auxin homeostasis in the last common ancestor of land plants.
Author contributions
ZNV and JH conceived the project and designed the experiments; AC and YK engineered promoter::NGG fusion lines as part of the Leeds Moss Transformation Service; ON and AP performed hormonal quantification and data analysis. All remaining experimental work was performed by ZNV with help from CM, WL and AS and supervision from JH; ZNV and JH analysed the data, wrote the manuscript draft and incorporated feedback from all authors.
Supporting information
Fig. S1 Strategy for generation of promoter::NLSGUSGFP reporter lines.
Fig. S2 CLAVATA expression was undetectable WT plants and germinating spores of most promoter::NLSGUSGFP reporter lines.
Fig. S3 PpcleAmiR1‐3, PpcleAmiR4‐7 and Pprpk2 mutants have subapical cell length and division plane defects in protonemata.
Fig. S4 PpcleAmiR1‐3, Pprpk2 and Ppclv1a1brpk2 mutants had protonemal apical dominance defects.
Fig. S5 PpcleAmiR lines have altered levels of PpCLE1‐9 transcription.
Fig. S6 No difference in overall cytokinin levels between WT and clavata mutant lines was found.
Fig. S7 Model for activation of caulonemal development with PpRPK2 repression by PpARFb.
Table S1 List of primers used for promoter::NGG line generation.
Table S2 List of primers used for reverse transcription polymerase chain reaction (RT‐PCR) in PpcleAmiR lines (Fig. S5).
Table S3 List of primers used for quantitative polymerase chain reaction (Q‐PCR).
Please note: Wiley Blackwell are not responsible for the content or functionality of any Supporting Information supplied by the authors. Any queries (other than missing material) should be directed to the New Phytologist Central Office.
Acknowledgements
We thank the Gatsby Charitable Foundation and the Bristol Centre for Agricultural Innovation for funding Zoe Nemec‐Venza and Jill Harrison's work. We thank the ERDF for funding ‘Plants as a tool for sustainable global development’ (no. CZ.02.1.01/0.0/0.0/16_019/0000827), which supported hormone analyses. We thank Hana Martínková, Petra Amakorová and Kamila Wisnerová for their help with plant hormone analyses. We thank Joe Cammarata, Adrienne Roeder and Mike Scanlon for the gift of the Ppclv1a1brpk2 mutant and useful discussions about our work. We thank Lucia Primavesi for technical support and training. The authors declare no conflicts of interest.
Data availability
Data available on request from the authors.
References
- Abas L, Kolb M, Stadlmann J, Janacek DP, Lukic K, Schwechheimer C, Sazanov LA, Mach L, Friml J, Hammes UZ. 2021. Naphthylphthalamic acid associates with and inhibits PIN auxin transporters. Proceedings of the National Academy of Sciences, USA 118: e2020857118. [DOI] [PMC free article] [PubMed] [Google Scholar]
- Ashton NW, Grimsley NH, Cove DJ. 1979. Analysis of gametophytic development in the moss, Physcomitrella patens, using auxin and cytokinin resistant mutants. Planta 144: 427–435. [DOI] [PubMed] [Google Scholar]
- Bennett T, Liu M, Aoyama T, Bierfreund N, Braun M, Coudert Y, Dennis R, O’Connor D, Wang X, White C et al. 2014. Plasma membrane‐targeted PIN proteins drive shoot development in a moss. Current Biology 24: 2776–2785. [DOI] [PMC free article] [PubMed] [Google Scholar]
- Cammarata J, Farfan CM, Scanlon M, Roeder AHK. 2021. Cytokinin‐CLAVATA crosstalk is an ancient mechanism regulating shoot meristem homeostasis in land plants. BioRXiv doi: 10.1101/2021.08.03.454935. [DOI] [PMC free article] [PubMed] [Google Scholar]
- Clark SE, Williams RW, Meyerowitz EM. 1997. The CLAVATA1 gene encodes a putative receptor kinase that controls shoot and floral meristem size in Arabidopsis . Cell 89: 575–585. [DOI] [PubMed] [Google Scholar]
- Coudert Y, Novák O, Harrison CJ. 2019. A KNOX‐cytokinin regulatory module predates the origin of indeterminate vascular plants. Current Biology 29: 2743–2750. [DOI] [PubMed] [Google Scholar]
- Daum G, Medzihradszky A, Suzaki T, Lohmann JU. 2014. A mechanistic framework for noncell autonomous stem cell induction in Arabidopsis . Proceedings of the National Academy of Sciences, USA 111: 14619–14624. [DOI] [PMC free article] [PubMed] [Google Scholar]
- Demko V, Belova T, Messerer M, Hvidsten TR, Perroud P‐F, Ako AE, Johansen W, Mayer KFX, Olsen O‐A, Lang D. 2021. Calpain DEK1 acts as a developmental switch gatekeeping cell fate transitions. BioRXiv doi: 10.1101/2021.08.25.457637. [DOI] [PMC free article] [PubMed] [Google Scholar]
- Desai UJ, Pfaffle PK. 1995. Single‐step purification of a thermostable DNA polymerase expressed in Escherichia coli . BioTechniques 19: 780–782. [PubMed] [Google Scholar]
- Doyle JJ, Doyle JL. 1990. Isolation ofplant DNA from fresh tissue. Focus 12: 39–40. [Google Scholar]
- Fletcher JC. 2018. The CLV‐WUS stem cell signaling pathway: a roadmap to crop yield optimization. Plants 7: 87. [DOI] [PMC free article] [PubMed] [Google Scholar]
- Fletcher JC, Brand U, Running MP, Simon R, Meyerowitz EM. 1999. Signalling of cell fate decisions by CLAVATA3 in Arabidopsis shoot meristems. Science 283: 1911–1914. [DOI] [PubMed] [Google Scholar]
- Geldner N, Friml J, Stierhof YD, Jürgens G, Palme K. 2001. Auxin transport inhibitors block PIN1 cycling and vesicle trafficking. Nature 413: 425–428. [DOI] [PubMed] [Google Scholar]
- Goad DM, Zhu C, Kellogg EA. 2017. Comprehensive identification and clustering of CLV3/ESR‐related (CLE) genes in plants finds groups with potentially shared function. New Phytologist 216: 605–616. [DOI] [PubMed] [Google Scholar]
- Han S, Hwang I. 2018. Integration of multiple signaling pathways shapes the auxin response. Journal of Experimental Botany 69: 189–200. [DOI] [PubMed] [Google Scholar]
- Harrison CJ. 2017. Development and genetics in the evolution of land plant body plans. Philosophical Transactions of the Royal Society of London. Series B: Biological Sciences 372: e20150490. [DOI] [PMC free article] [PubMed] [Google Scholar]
- Hirakawa Y, Fujimoto T, Ishida S, Uchida N, Sawa S, Kiyosue T, Ishizaki K, Nishihama R, Kohchi T, Bowman JL. 2020. Induction of multichotomous branching by CLAVATA peptide in Marchantia polymorpha . Current Biology 30: 3833–3840. [DOI] [PubMed] [Google Scholar]
- Ishikawa M, Murata T, Sato Y, Nishiyama T, Hiwatashi Y, Imai A, Kimura M, Sugimoto N, Akita A, Oguri Y et al. 2011. Physcomitrella cyclin‐dependent kinase a links cell cycle reactivation to other cellular changes during reprogramming of leaf cells. Plant Cell 23: 2924–2938. [DOI] [PMC free article] [PubMed] [Google Scholar]
- Jang G, Dolan L. 2011. Auxin promotes the transition from chloronema to caulonema in moss protonema by positively regulating PpRSL1 and PpRSL2 in Physcomitrella patens . New Phytologist 192: 319–327. [DOI] [PubMed] [Google Scholar]
- Kamisugi Y, Cuming AC, Cove DJ. 2005. Parameters determining the efficiency of gene targeting in the moss Physcomitrella patens . Nucleic Acids Research 33: e173–e173. [DOI] [PMC free article] [PubMed] [Google Scholar]
- Kieber JJ, Schaller GE. 2018. Cytokinin signaling in plant development. Development 145. doi: 10.1242/dev.149344. [DOI] [PubMed] [Google Scholar]
- Kondo T, Sawa S, Kinoshita A, Mizuno S, Kakimoto T, Fukuda H, Sakagami Y. 2006. A plant peptide encoded by CLV3 identified by in situ MALDI‐TOF MS analysis. Science 313: 845–848. [DOI] [PubMed] [Google Scholar]
- Laux T, Mayer KX, Berger J, Jurgens G. 1996. The WUSCHEL gene is required for shoot and floral meristem integrity in Arabidopsis . Development 122: 87–96. [DOI] [PubMed] [Google Scholar]
- Lavy M, Prigge MJ, Tao S, Shain S, Kuo A, Kirchsteiger K, Estelle M. 2016. Constitutive auxin response in physcomitrella reveals complex interactions between Aux/IAA and ARF proteins eLife 5: e13325. [DOI] [PMC free article] [PubMed] [Google Scholar]
- Lenhard M, Laux T. 2003. Stem cell homeostasis in the Arabidopsis shoot meristem is regulated by intercellular movement of CLAVATA3 and its sequestration by CLAVATA1. Development 130: 3163–3173. [DOI] [PubMed] [Google Scholar]
- Livak KJ, Schmittgen TD. 2001. Analysis of relative gene expression data using real‐time quantitative PCR and the 2−ΔΔCT method. Methods 25: 402–408. [DOI] [PubMed] [Google Scholar]
- Ma Y, Miotk A, Šutiković Z, Ermakova O, Wenzl C, Medzihradszky A, Gaillochet C, Forner J, Utan G, Brackmann K et al. 2019. WUSCHEL acts as an auxin response rheostat to maintain apical stem cells in Arabidopsis . Nature Communications 10: 1–11. [DOI] [PMC free article] [PubMed] [Google Scholar]
- Menand B, Calder G, Dolan L. 2007a. Both chloronemal and caulonemal cells expand by tip growth in the moss Physcomitrella patens . Journal of Experimental Botany 58: 1843–1850. [DOI] [PubMed] [Google Scholar]
- Menand B, Keke Y, Jouannic S, Hoffmann L, Ryan E, Linstead P, Schaefer DG, Dolan L. 2007b. An ancient mechanism controls the development of cells with a rooting function in land plants. Science 316: 1477–1480. [DOI] [PubMed] [Google Scholar]
- Novák O, Hényková E, Sairanen I, Kowalczyk M, Pospíšil T, Ljung K. 2012. Tissue specific profiling of the Arabidopsis thaliana auxin metabolome. The Plant Journal 72: 523–536. [DOI] [PubMed] [Google Scholar]
- Ogawa M, Shinohara H, Sakagami Y, Matsubayashi Y. 2008. Arabidopsis CLV3 peptide directly binds CLV1 ectodomain. Science 319: 294–294. [DOI] [PubMed] [Google Scholar]
- Ohyama K, Shinohara H, Ogawa‐Ohnishi M, Matsubayashi Y. 2009. A glycopeptide regulating stem cell fate in Arabidopsis thaliana . Nature Chemical Biology 5: 578–580. [DOI] [PubMed] [Google Scholar]
- Pallakies H, Simon R. 2014. The CLE40 and CRN/CLV2 signaling pathways antagonistically control root meristem growth in Arabidopsis . Molecular Plant 7: 1619–1636. [DOI] [PubMed] [Google Scholar]
- Plavskin Y, Nagashima A, Perroud P‐F, Hasebe M, Quatrano RS, Atwal GS, Timmermans MC. 2016. Ancient trans‐acting siRNAs confer robustness and sensitivity onto the auxin response. Developmental Cell 36: 276–289. [DOI] [PMC free article] [PubMed] [Google Scholar]
- Prigge MJ, Lavy M, Ashton NW, Estelle M. 2010. Physcomitrella patens auxin‐resistant mutants affect conserved elements of an auxin‐signaling pathway. Current Biology 20: 1907–1912. [DOI] [PubMed] [Google Scholar]
- Racolta A, Nodine MD, Davies K, Lee C, Rowe S, Velazco Y, Wellington R, Tax FE. 2018. A common pathway of root growth control and response to CLE peptides through two receptor kinases in Arabidopsis . Genetics 208: 687–704. [DOI] [PMC free article] [PubMed] [Google Scholar]
- Rojo E, Sharma VK, Kovaleva V, Raikhel NV, Fletcher JC. 2002. CLV3 is localized to the extracellular space, where it activates the Arabidopsis CLAVATA stem cell signaling pathway. Plant Cell 14: 969–977. [DOI] [PMC free article] [PubMed] [Google Scholar]
- Sakakibara K, Reisewitz P, Aoyama T, Friedrich T, Ando S, Sato Y, Tamada Y, Nishiyama T, Hiwatashi Y, Kurata T. 2014. WOX13‐like genes are required for reprogramming of leaf and protoplast cells into stem cells in the moss Physcomitrella patens . Development 141: 1660–1670. [DOI] [PubMed] [Google Scholar]
- Schoof H, Lenhard M, Haecker A, Mayer KF, Jurgens G, Laux T. 2000. The stem cell population of Arabidopsis shoot meristems in maintained by a regulatory loop between the CLAVATA and WUSCHEL genes. Cell 100: 635–644. [DOI] [PubMed] [Google Scholar]
- von Schwartzenberg K, Fernández Núñez M, Blaschke H, Dobrev PI, Novák O, Motyka V, Strnad M. 2007. Cytokinins in the bryophyte Physcomitrella patens: analyses of activity, distribution, and cytokinin oxidase/dehydrogenase overexpression reveal the role of extracellular cytokinins. Plant Physiology 145: 786–800. [DOI] [PMC free article] [PubMed] [Google Scholar]
- Somssich M, Je BI, Simon R, Jackson D. 2016. CLAVATA‐WUSCHEL signaling in the shoot meristem. Development 143: 3238–3248. [DOI] [PubMed] [Google Scholar]
- Svaçinová J, Novák O, Plačková L, Lenobel R, Holík J, Strnad M, Doležal K. 2012. A new approach for cytokinin isolation from Arabidopsis tissues using miniaturized purification: pipette tip solid‐phase extraction. Plant Methods 8: 1–14. [DOI] [PMC free article] [PubMed] [Google Scholar]
- Thelander M, Landberg K, Sundberg E. 2018. Auxin‐mediated developmental control in the moss Physcomitrella patens . Journal of Experimental Botany 69: 277–290. [DOI] [PubMed] [Google Scholar]
- Thelander M, Landberg K, Sundberg E. 2019. Minimal auxin sensing levels in vegetative moss stem cells revealed by a ratiometric reporter. New Phytologist 224: 775–788. [DOI] [PubMed] [Google Scholar]
- Viaene T, Landberg K, Thelander M, Medvecka E, Pederson E, Feraru E, Cooper E, Karimi M, Delwiche C, Ljung K et al. 2014. Directional auxin transport mechanisms in early diverging land plants. Current Biology 24: 2786–2791. [DOI] [PubMed] [Google Scholar]
- Whitewoods CD, Cammarata J, Nemec Venza Z, Sang S, Crook AD, Aoyama T, Wang XY, Waller M, Kamisugi Y, Cuming AC et al. 2018. CLAVATA was a genetic novelty for the morphological innovation of 3D growth in land plants. Current Biology 28: 2365–2376. [DOI] [PMC free article] [PubMed] [Google Scholar]
- Wu C‐C, Li F‐W, Kramer EM. 2019. Large‐scale phylogenomic analysis suggests three ancient superclades of the WUSCHEL‐RELATED HOMEOBOX transcription factor family in plants. PLoS ONE 14: e0223521. [DOI] [PMC free article] [PubMed] [Google Scholar]
- Yadav RK, Perales M, Jrm G, Girke T, Jönsson H, Reddy GV. 2011. WUSCHEL protein movement mediates stem cell homeostasis in the Arabidopsis shoot apex. Genes & Development 25: 2025–2030. [DOI] [PMC free article] [PubMed] [Google Scholar]
Associated Data
This section collects any data citations, data availability statements, or supplementary materials included in this article.
Supplementary Materials
Fig. S1 Strategy for generation of promoter::NLSGUSGFP reporter lines.
Fig. S2 CLAVATA expression was undetectable WT plants and germinating spores of most promoter::NLSGUSGFP reporter lines.
Fig. S3 PpcleAmiR1‐3, PpcleAmiR4‐7 and Pprpk2 mutants have subapical cell length and division plane defects in protonemata.
Fig. S4 PpcleAmiR1‐3, Pprpk2 and Ppclv1a1brpk2 mutants had protonemal apical dominance defects.
Fig. S5 PpcleAmiR lines have altered levels of PpCLE1‐9 transcription.
Fig. S6 No difference in overall cytokinin levels between WT and clavata mutant lines was found.
Fig. S7 Model for activation of caulonemal development with PpRPK2 repression by PpARFb.
Table S1 List of primers used for promoter::NGG line generation.
Table S2 List of primers used for reverse transcription polymerase chain reaction (RT‐PCR) in PpcleAmiR lines (Fig. S5).
Table S3 List of primers used for quantitative polymerase chain reaction (Q‐PCR).
Please note: Wiley Blackwell are not responsible for the content or functionality of any Supporting Information supplied by the authors. Any queries (other than missing material) should be directed to the New Phytologist Central Office.
Data Availability Statement
Data available on request from the authors.