

Abstract
Objectives
Delirium frequently arises in older demented and non‐demented patients in postoperative, clinical settings. To date, the underlying pathophysiological mechanisms remain poorly understood. Monoamine neurotransmitter alterations have been linked to delirium and cognitive impairment. Our aim was to investigate if this holds true in cognitively normal and impaired patients experiencing delirium following hip surgery.
Methods
Monoamines and metabolites were measured in plasma samples of 181 individuals by means of reversed‐phase ultra‐high‐performance liquid chromatography with electrochemical detection. Delirium and delirium severity were scored with the Confusion Assessment Method and Delirium Rating Scale‐Revised‐1998. Cognitive function was assessed using the Informant Questionnaire on Cognitive Decline and the Mini‐Mental State Examination, multimorbidity with the Charlson Comorbidity Index.
Results
Plasma 5‐hydroxyindoleacetic acid (5‐HIAA), the major metabolite of serotonin (5‐HT), was significantly higher in delirious and non‐delirious cognitively impaired subjects as compared to control individuals without delirium and cognitive impairment (p < 0.001 and p = 0.007), which remained highly significant after excluding patients taking psychotropic medication (p < 0.0001 and p = 0.003). No significant differences were found for cognitively normal delirious patients, although serotonergic levels were numerically higher compared to control counterparts.
Conclusions
Our findings indicate a general serotonergic disturbance in delirious and non‐delirious postoperative patients suffering from cognitive impairment. We observed a similar, but less pronounced difference in delirious patients, which suggests serotonergic disturbances may be further aggravated by the co‐occurrence of delirium and cognitive impairment.
Keywords: ageing, biogenic amines, biomarker, cognitive impairment, delirium, HPLC, monoamine neurotransmitters, UPLC
Key points
Plasma 5‐HIAA was significantly higher in delirious and non‐delirious cognitively impaired patients compared to control individuals
5‐HIAA levels remained significantly higher after excluding patients using psychotropic medication
A numerical increase in plasma 5‐HIAA of delirious patients may still suggest an aggravating effect of delirium and cognitive impairment
1. INTRODUCTION
Delirium is a complex neurocognitive complication that is commonly but not exclusively observed in clinical, postoperative settings and in older patients. 1 , 2 Following the diagnostic criteria of the Diagnostic and Statistical Manual of Mental Disorders (DSM) (5th ed.; DSM‐5; American Psychiatric Association [APA], 2013) and the DSM‐based Confusion Assessment Method (CAM), a delirious episode arises acutely and can last from hours to several days. In this period, patients present with (1) altered baseline cognitive functioning, attention and awareness, (2) psychomotor disturbances presenting as: hypo‐ or hyperactivity with unpredictable fluctuations between one another, (3) circadian rhythm shifts, and (4) potential behavioral disturbances including depression, anxiety or fear, irritability, euphoria, apathy, or wondering perplexity. According to the aforementioned criteria, these symptoms should not be better explained by a secondary (neurocognitive) disorder. 3 , 4 Delirium can have far‐reaching adverse effects. It is associated with increased risk for other (postoperative) complications, such as falls, hospital‐acquired conditions, acute malnutrition and dehydration, which prolong the hospital stay. 5 Functional and cognitive decline following delirious episodes eventually leads to earlier institutionalization in a majority of patients. 1 , 6 , 7
Despite these well‐defined diagnostic criteria, the pathophysiological mechanisms underlying the symptoms of delirium are not yet fully understood and current treatments are merely symptomatic. 1 , 8 Dementia is recognized as a leading risk factor for delirium. On the other hand, a preceding delirious episode can induce permanent neuronal damage, exacerbate cognitive impairment and eventually provoke new episodes. 9 , 10 , 11 , 12 There is accumulating evidence that neurotransmission is altered not only in dementia, but also in delirium. For example, delirium has been associated with decreased acetylcholine levels. In addition, excess release of the monoamines (nor)epinephrine ((N)E) and dopamine (DA) and their corresponding metabolites, such as the norepinephrinergic 3‐methoxy‐4‐hydroxyphenylglycol (MHPG) as well as the dopaminergic homovanillic acid (HVA) and 3,4‐dihydroxyphenylacetic acid (DOPAC), have likewise been observed. Other neurotransmitters such as histamine, gamma‐aminobutyric acid and monoamine serotonin (5‐HT), as well as its metabolite 5‐hydroxyindoleacetic acid (5‐HIAA), seem to have fluctuating activity depending on varying etiological factors. 8 , 13 , 14 , 15 , 16 , 17 , 18 , 19 , 20 Recently, an extensive review integrated existing theories into a “system integration failure hypothesis”. 13 This theory postulates dysregulated neurotransmission and functional network dysconnectivity. Here, dysbalanced neurotransmission intersects with network dysconnectivity, as it presumably drives the inability to integrate information coming from functionally connected brain regions. Eventually, this results in ‘acute brain failure’: the clinical picture of delirium. 13
As mentioned before, the neurotransmitter hypothesis indicates that monoamine neurotransmitters are significantly altered along the delirium continuum. With no other delirium biomarkers available at this moment, 1 this study could not only increase pathophysiological insights, but also contribute to the development of novel neurochemical biomarkers in addition to the existing diagnostic tools. Eventually, this may improve diagnostic accuracy and accelerate treatment initiation, both of which may contribute to a favorable prognosis.
Given that there is a close relationship between delirium and cognitive impairment and based on the observation that monoaminergic neurotransmission is substantially dysregulated in delirium, this study aimed at investigating monoamine neurotransmitter levels in individuals with or without cognitive impairment and postoperative delirium following hip surgery.
2. MATERIALS AND METHODS
2.1. Study population and inclusion criteria
This study was based on the analysis of a subset of the study population and biosamples obtained by de Jonghe et al. 21 Samples were acquired from a subset of subjects previously included in a double‐blind randomized controlled trial investigating the effect of melatonin on the incidence of delirium in elderly, hospitalized patients (>65 years) who underwent emergent hip fracture surgery. The complete protocol of this trial has been described elsewhere. 22 The initial sample size consisted of 2860 plasma and serum samples, which was reduced to 536 plasma samples after excluding patients who received melatonin or for whom only serum samples were available. Patients were subsequently assigned to one of the four predefined groups. Groups 1 and 2 included samples from delirious patients with or without cognitive impairment (D+CI+ and D+CI−, respectively). Group 3 included cognitively impaired patients without postoperative delirium (D−CI+), whereas group 4 (D−CI−) comprised control individuals who were cognitively intact and did not experience postoperative delirium. Only one plasma sample per patient was included, depending on delirium score. Finally, only samples that were collected at least two days after the surgery were included, in order to minimize anesthetic effects on plasma monoaminergic levels. A flowchart of our study population and inclusion criteria is shown in Figure 1. Prescription medication use at baseline was recorded. Both general psychotropic medication use (medication targeting neurotransmitter systems, i.e. antipsychotics, antidepressants), specific classes of psychotropics or other types of nervous system medication that could influence delirium symptoms and subsequent scoring, were included for analysis. Blood sampling consistently took place at 11 am. For the study, written informed consent was obtained from all participants and approval of the Medical Ethics Committee of the Academic Medical Center, University of Amsterdam was obtained.
FIGURE 1.
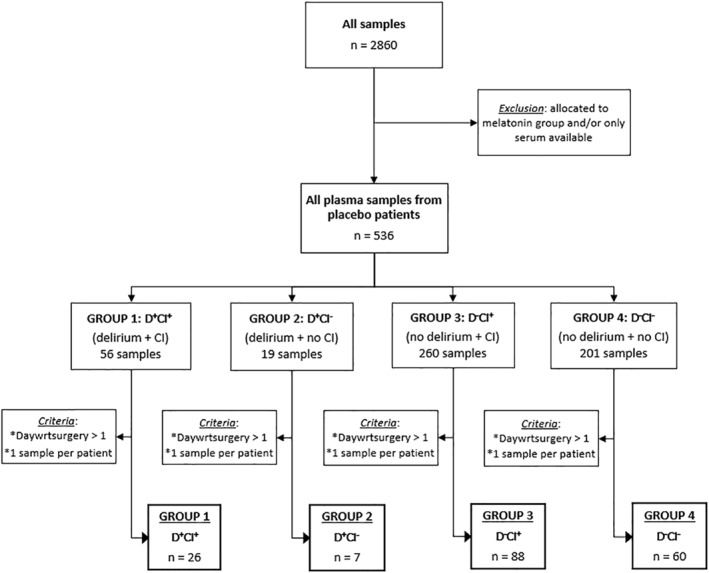
Study population selection. From a total of 2860 samples obtained from de Jonghe et al. 21 , 181 samples were included in the present study. Abbreviations: CI, cognitive impairment; D+CI+, delirium and cognitive impairment; D−CI+, no delirium but cognitive impairment; D+CI−, delirium but no cognitive impairment; D−CI−, no delirium or cognitive impairment; daywrtsurgery, day with regard to surgery
2.2. Assessment of cognitive impairment and delirium
Delirium and cognitive impairment were scored as described by de Jonghe et al. 21 Delirium was diagnosed applying the CAM. 4 Delirium severity was determined with the Delirium Rating Scale‐Revised‐1998 (DRS‐R‐98) and was expressed as maximal DRS‐R‐98 score during the entire delirium period. During hospitalization, patients were assessed daily for the presence of delirium based on all patient information, such as medical and nursing records for the previous 24 h. In addition, the Delirium Observation Screening Scale was completed for every patient every nursing shift. 23 For patients in which delirium did not manifest after eight days, assessments were terminated, whereas they were continued for delirious patients until their symptoms resolved or until discharge.
The presence of global cognitive impairment was confirmed by the Informant Questionnaire on Cognitive Decline (IQCODE), 24 , 25 and the Mini‐Mental State Examination (MMSE). 26 The Charlson Comorbidity Index (CCI) was performed to determine the number and severity of comorbidities. 27 In addition, patients were screened for cognitive impairment by their primary caregiver completing the shorter Informant Questionnaire on Cognitive Decline (IQCODE) form (16 instead of 26 items). 24 , 25 An MMSE was performed by a trained nurse. Eventually, patients were considered cognitively impaired if their IQCODE cut‐off score exceeded 3.4 points, if the MMSE score was 24 points or below, if they scored for dementia in the CCI, or if there was any record of dementia in their medical history.
2.3. RP‐UHPLC‐ECD
Plasma levels of monoamine neurotransmitters and their corresponding metabolites were determined using an Alexys Neurotransmitter Analyzer (Antec Leyden BV, Zoeterwoude, The Netherlands). This reversed‐phase ultra‐high‐performance liquid chromatography (RP‐UHPLC) setting, coupled to an Decade II electrochemical detection (ECD) device and equipped with a VT03 flow cell layer with a 0.7 mm glassy carbon working electrode and an in situ Ag/AgCl reference electrode (ISAAC), was optimized for monoamine detection and based on the protocol as applied and described by Janssens et al. 28 An LC110S pump delivered backpressure up to 700 bar to maintain an isocratic flow of 68 μl/min. Chromatograms were integrated using Clarity software (DataApex Ltd., v7.4, Prague, The Czech Republic). Optimal compound separation was achieved by means of a 15‐cm Waters Acquity column (BEH C18 column, 130Å, 1.7 μm, 1.0 mm diameter) and an 11% methanol mobile phase consisting of citric acid (100 mm), phosphoric acid (100 mm), octane‐1‐sulfonic acid sodium salt (OSA) (2.8 mm), KCl (8 mm) and ethylenediaminetetraacetic acid (EDTA) (0.1 mm), set at pH 3.0. As part of the sample preparation, Amicon Ultra Centrifugal filters (3 kDA; Millipore, Ireland) were washed twice by centrifugation (14,000 × g [4°C], 25 min) with 450 μl of sample preparation buffer. Per sample, 400 μl of plasma was transferred to the washed Amicon filters and centrifuged (40 min, 14,000 × g [4°C]). Of the obtained filtrate, a 1:4 and 1:20 diluted fraction were automatically injected onto the BEH C18 column via an Alexys AS110 Autosampler (5 μl sample loop) (Antec Leyden BV, Zoeterwoude, the Netherlands). Total runtime for each sample was under 15 min, in which MHPG, NE, E, DOPAC, 5‐HIAA, DA, HVA and 5‐HT were determined in that respective order. Each run consisted of randomized samples.
2.4. Statistical analysis
Shapiro‐Wilkinson normality test was first performed to test whether our data complied with those of a normally distributed study population. Due to a right‐skewed data distribution and limited number of patients in the D+CI− group, non‐parametric statistics were applied. Fisher's Exact Statistics were applied to compare demographical data across groups, including male to female ratios and patients taking/not taking psychotropic medication. For age comparison between the different groups, Welch's ANOVA analysis with post‐hoc Games‐Howell tests were used. Kruskal‐Wallis analyses with post‐hoc Dunn tests and adjusted Bonferroni correction were performed to compare monoaminergic levels between the four study groups. Statistics for NE and MHPG/NE turnover data were not performed as NE peaks were masked and could therefore not be reliably detected. The effect of psychotropic medication on neurochemical levels was investigated using Mann‐Whitney U tests. Through linear regression, we investigated the effect of several parameters on monoamine levels, including age, sex and anesthesia use. Data were analyzed using SPSS 24 software for Windows (IBM, Armonk, NY, USA) and GraphPad Prism 9.1.0 (GraphPad Software Inc, La Jolla, CA, USA).
3. RESULTS
3.1. Demographic data and medication use
Demographic data and use of psychotropic medication are summarized in Table 1. A total of 181 plasma samples from patients with emergent hip fracture were included and analyzed in this study (Figure 1). The mean age was 84 years (84.1 ± 6.9) with a minimum age of 65 years and the majority was female (66.3%). Age significantly differed among groups (Welch's F (3,27.1) = 10.4, p < 0.05). Further pairwise comparison between the different groups revealed that mean age was significantly lower in the D−CI− group (79.9 ± 7.8) compared to the D+CI+ (86.9 ± 5.2, p < 0.0001), D+CI− (86.1 ± 4.4, p = 0.036) and D−CI+ group (86.1 ± 5.5, p < 0.0001). However, upon Bonferroni correction (p < 0.00833 for six pairwise comparisons), this did not remain significant for the D+CI− group. We found that there was a significant effect of age and sex on 5‐HIAA levels (p = 0.038 and p = 0.021, respectively) in the D−CI− group, but not in the other groups. Medication use was recorded at baseline, and only the drugs relevant for this study are enlisted below. The number of patients taking versus not taking psychotropic medication significantly differed (p = 0.022), but pairwise comparisons did not following Bonferroni correction. The percentage of patients taking antipsychotics significantly differed between the D−CI+ and D−CI− group (D−CI+: 10%, D−CI−: 0%, p = 0.008), as did antidepressant use (D−CI+: 25%, D−CI−: 7%, p = 0.003). There was no significant difference in anesthesia type use between either of the groups.
TABLE 1.
Age is depicted as mean ± SD with minimum‐maximum ranges between parentheses and was compared using Welch's ANOVA statistics
| Parameter | D+CI+ (n = 26) | D+CI− (n = 7) | D−CI+ (n = 88) | D−CI− (n = 60) | Statistics |
|---|---|---|---|---|---|
| Age at sampling (y) | 86.9 ± 5.2 (77.7–99.0) | 86.1 ± 4.4 (77.8–90.1) | 86.1 ± 5.5 (69.7–97.1) | 79.9 ± 7.8 (65.0–97.2) | Welch's F = 10.4 |
| p = 0.0001 | |||||
| Sex (Male/Female) | 12/14 | 3/4 | 28/60 | 18/42 | Fisher's exact test: 2.7 |
| p > 0.05 | |||||
| Anesthesia type (General/Spinal) | 20/5 | 4/3 | 62/26 | 44/16 | Fisher's exact test: 1.8 |
| p > 0.05 | |||||
| Psychotropic medication (NO/YES) | 13/12 | 1/6 | 29/58 | 32/27 | Fisher's exact test: 9.3 |
| p = 0.022 | |||||
| Antiepileptics (NO/YES) | 25/1 | 7/0 | 85/3 | 58/2 | Fisher's exact test: 0.6 |
| p > 0.05 | |||||
| Anti‐dementia drugs (NO/YES) | 25/1 | 6/1 | 82/6 | 58/2 | Fisher's exact test: 2.4 |
| p > 0.05 | |||||
| Antipsychotics (NO/YES) | 25/1 | 7/0 | 79/9* | 60/0* | Fisher's exact test: 7.4 |
| p = 0.047 | |||||
| Antidepressants (NO/YES) | 20/6 | 6/1 | 66/22* | 56/4* | Fisher's exact test: 9.3 |
| p = 0.020 | |||||
| Anxiolytics, hypnotics, sedatives (NO/YES) | 23/3 | 4/3 | 59/29 | 45/15 | Fisher's exact test: 5.9 |
| p > 0.05 | |||||
| Anti‐Parkinsonian medication (NO/YES) | 25/1 | 5/2 | 85/3 | 57/3 | Fisher's exact test: 5.9 |
| p > 0.05 | |||||
| Anticholinergic medication (NO/YES) | 23/3 | 7/0 | 79/9 | 54/6 | Fisher's exact test: 0.4 |
| p > 0.05 | |||||
| Corticosteroids (NO/YES) | 25/1 | 6/1 | 83/5 | 56/3 | Fisher's exact test: 1.8 |
| p > 0.05 | |||||
| Hormones (NO/YES) | 26/0 | 6/1 | 83/5 | 54/6 | Fisher's exact test: 4.0 |
| p > 0.05 | |||||
| Analgesics (NO/YES) | 25/1 | 7/0 | 72/16 | 56/4 | Fisher's exact test: 6.2 |
| p > 0.05 | |||||
| Other nervous system drugs/antivertigo preparations (NO/YES) | 26/0 | 6/1 | 86/2 | 58/2 | Fisher's exact test: 3.7 |
| p > 0.05 |
Notes: Fisher's Exact test was performed to compare male/female ratios and patients not taking/taking psychotropic medication. Statistical results are enlisted in the rightmost column. Significant results following post‐hoc analysis with Bonferroni correction (p ≤ 0.00833 for six pairwise comparisons) are classified as p ≤ 0.00833 and are indicated by an asterisk.
Abbreviations: CI, cognitive impairment; D+CI+, delirium and cognitive impairment; D−CI+, no delirium but cognitive impairment; D+CI−, delirium but no cognitive impairment; D−CI−, no delirium or cognitive impairment.
3.2. Plasma monoamine levels
Monoaminergic data for each group are presented in Table 2. Norepinephrine levels could not be reliably detected; therefore, NE and MHPG/NE turnover data are not further discussed. The levels of the norepinephrinergic metabolite MHPG and the serotonergic metabolite 5‐HIAA, as well as 5‐HIAA/5‐HT ratios were significantly altered in plasma across groups (H(3) = 8.3, p = 0.040 for MHPG; H(3) = 14.6, p = 0.002 for 5‐HIAA; H(3) = 9.4, p = 0.025 for 5‐HIAA/5‐HT). The 5‐HIAA/5‐HT ratio reflects the serotonergic turnover and is a good measurement for the activity of the serotonergic system. Plasma MHPG, 5‐HIAA and 5‐HIAA/5‐HT ratios were all significantly higher in the D+CI+ group as opposed to the D−CI− group (p = 0.030 for MHPG, p < 0.001 for 5‐HIAA, p = 0.013 for 5‐HIAA/5‐HT), with only 5‐HIAA remaining significant after adjusted post‐hoc Bonferroni correction (p = 0.003). Plasma MHPG, 5‐HIAA levels and 5‐HIAA/5‐HT ratios were also significantly higher in the D−CI+ compared to the D−CI− group (p = 0.017 for MHPG, p = 0.006 for 5‐HIAA, p = 0.010 for 5‐HIAA/5‐HT), however, post‐hoc correction only revealed significant increases for 5‐HIAA (p = 0.038). All post‐hoc comparisons are shown in Table 2, serotonergic results are depicted in Figure 2.
TABLE 2.
Plasma monoamine and metabolite levels and ratios are represented as median with interquartile ranges between brackets
| Parameter | D+CI+ (n = 26) | D+CI− (n = 7) | D−CI+ (n = 88) | D−CI− (n = 60) | Kruskal‐Wallis |
|---|---|---|---|---|---|
| MHPG (ng/ml) | 51.7 (29.8–81.4) | 35.0 (20.0–52.8) | 47.4 (32.5–64.7) | 36.4 (24.0–59.2) | H = 8.3 |
| (n = 26) | (n = 7) | (n = 88) | (n = 60) | p = 0.040 | |
| E (ng/ml) | 7.9 (3.1–15.1) | 11.8 (5.9–18.6) | 9.7 (3.8–17.0) | 8.8 (5.5–14.5) | H = 0.3 |
| (n = 22) | (n = 5) | (n = 65) | (n = 47) | p > 0.05 | |
| DOPAC (ng/ml) | 6.7 (7.1–11.5) | 12.8 (3.8–25.2) | 6.0 (4.0–10.0) | 5.9 (4.3–8.6) | H = 0.9 |
| (n = 23) | (n = 6) | (n = 79) | (n = 54) | p > 0.05 | |
| 5‐HIAA (ng/ml) | 8.1 (7.1–11.4) | 10.0 (5.4–24.0) | 7.4 (5.4–10.7) | 6.1 (4.6–8.0) | H = 14.6 |
| (n = 26)a | (n = 5) | (n = 86)b | (n = 58)a,b | p = 0.002 | |
| DA (ng/ml) | 1.3 (1.0–1.7) | 1.4 (1.0–2.3) | 1.3 (1.1–1.6) | 1.3 (1.0–1.5) | H = 1.2 |
| (n = 24) | (n = 6) | (n = 73) | (n = 53) | p > 0.05 | |
| HVA (ng/ml) | 13.7 (10.3–25.8) | 20.0 (8.6–40.5) | 12.2 (8.6–19.4) | 10.2 (7.8–16.6) | H = 6.7 |
| (n = 26) | (n = 7) | (n = 88) | (n = 60) | p > 0.05 | |
| 5‐HT (ng/ml) | 22.3 (17.6–30.3) | 16.7 (11.5–72.0) | 22.8 (14.5–36.3) | 25.3 (17.2–39.9) | H = 1.1 |
| (n = 25) | (n = 7) | (n = 88) | (n = 59) | p > 0.05 | |
| DOPAC/DA | 5.5 (3.32–10.8) | 10.3 (2.7–29.3) | 6.4 (3.5–10.3) | 4.9 (3.3–9.3) | H = 1.5 |
| (n = 22) | (n = 5) | (n = 68) | (n = 48) | p > 0.05 | |
| HVA/DA | 12.8 (8.9–16.4) | 13.5 (6.2–96.8) | 9.6 (7.7–16.1) | 8.9 (6.9–14.8) | H = 2.3 |
| (n = 24) | (n = 6) | (n = 73) | (n = 53) | p > 0.05 | |
| HVA/5‐HIAA | 1.6 (1.3–2.6) | 1.3 (1.0–2.7) | 1.6 (1.2–2.0) | 1.7 (1.4–2.3) | H = 3.9 |
| (n = 26) | (n = 5) | (n = 86) | (n = 58) | p > 0.05 | |
| 5‐HIAA/5‐HT | 0.4 (0.3–0.5) | 0.4 (0.2–0.8) | 0.4 (0.2–0.6) | 0.3 (0.2–0.4) | H = 9.4 |
| (n = 25)a | (n = 5) | (n = 86) | (n = 57)a | p = 0.025 |
Notes: Kruskal‐Wallis with post‐hoc Mann Whitney U tests were performed to compare levels of monoamines, corresponding metabolites and ratios between different groups (D+CI+, D+CI−, D−CI+ and D−CI−). Statistical results are enlisted in the rightmost column. Significant results following post‐hoc analysis with Bonferroni correction (p ≤ 0.00833 for six pairwise comparisons) are classified as p ≤ 0.00833, p ≤ 0.001 and p ≤ 0.0001 and are indicated by one, two or three superscript letters, respectively. The letters a and b denote significant differences between aD+CI+ and D−CI− or bD−CI+ and D−CI−.
Abbreviations: 5‐HIAA, 5‐hydroxyindoleacetic acid; 5‐HT, 5‐hydroxytryptamine(serotonin); CI, cognitive impairment; DA,dopamine; D+CI−, delirium but no cognitive impairment; D+CI+, delirium and cognitive impairment; D−CI−, no delirium or cognitive impairment; D−CI+,no delirium but cognitive impairment; DOPAC, 3, 4‐dihydroxyphenylacetic acid; E,epinephrine; HVA, homovanillicacid; MHPG, 3‐methoxy‐4‐hydroxyphenylglycol.
FIGURE 2.
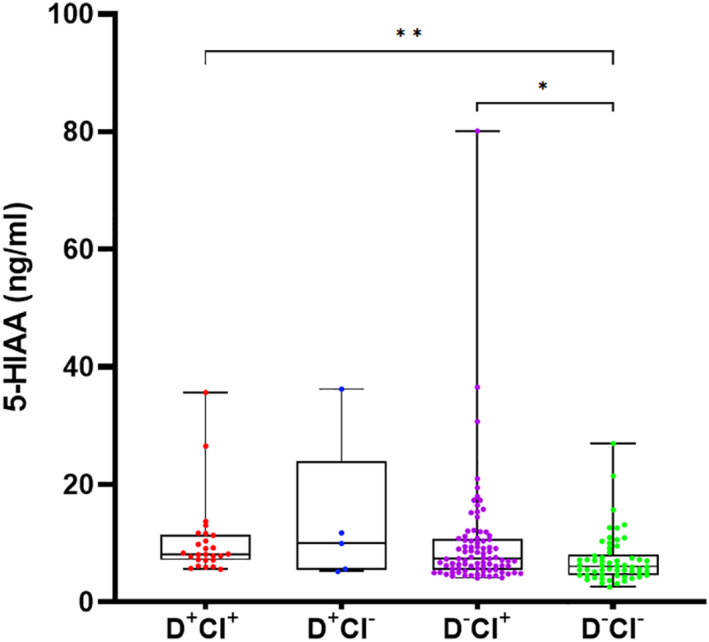
Boxplots visualizing plasma 5‐HIAA levels across all four groups. Data which remained statistically significant following post‐hoc Bonferroni correction are denoted by asterisks (* for p ≤ 0.00833, ** for p ≤ 0.001, respectively). Abbreviations: 5‐HIAA, 5‐hydroxyindoleacetic acid; CI, cognitive impairment; D+CI+, delirium and cognitive impairment; D−CI+, no delirium but cognitive impairment; D+CI−, delirium but no cognitive impairment; D−CI−, no delirium or cognitive impairment
3.3. Effect of psychotropic medication and anesthesia on monoamine levels
The potential influence of psychotropic medication use on monoamine and metabolite levels was investigated and test results are summarized in Table 3. The overall use of psychotropic medication was associated with a significant decrease in plasma HVA levels (U = 3186.0, p = 0.046), but it did not affect any of the other monoamines or metabolites (p > 0.05). With regard to antidepressants, no significant effects could be detected (p > 0.05). The use of antipsychotics did not affect plasma monoaminergic levels either, with the exception of DA (p = 0.020) and the DOPAC/DA ratio (p = 0.046), which were, respectively, increased and decreased in patients taking antipsychotics. We also investigated monoamine levels in patients free from psychotropic medication and found that there were significant differences between the four groups for plasma 5‐HIAA levels (H(3) = 18.3, p = 0.0004). 5‐HIAA levels were significantly higher in the D+CI+ (U = 51.0, p < 0.0001) and D−CI+ group (U = 256.0, p = 0.003) compared to control individuals (D−CI−) (Figure 3). Next, we checked our data for associations of psychotropic medication with both sex and delirium/cognitive impairment scores. Here, we found that antidepressants and sex were associated in the D−CI+ group (p = 0.028, Fisher exact test), but after Bonferroni correction (p < 0.0125 for four pairwise comparisons), this did not remain statistically significant. We could not detect associations between the general use of psychotropic mediation and the presence of delirium (p = 0.846, Fisher exact test) and cognitive impairment (p = 0.070, Fisher exact test), but we did for the use of antipsychotics (p = 0.008, Fisher's exact test) and antidepressants (p = 0.003, Fisher's exact test) in cognitive impairment. The type of anesthesia (general vs. spinal) had an effect on 5‐HIAA levels in the D+CI+ group (p = 0.016), but not in the other groups.
TABLE 3.
Plasma monoamine and metabolite levels and ratios are represented as median with interquartile ranges between brackets
| Parameter | Psychotropic medication use (yes vs. no) | Anti‐depressant use (yes vs. no) | Anti‐psychotic use (yes vs. no) | D+CI+ (n = 13) | D+CI− (n = 1) | D−CI+ (n = 29) | D−CI−(n = 32) | Kruskal‐Wallis (psychotropic medication free) |
|---|---|---|---|---|---|---|---|---|
| MHPG (ng/ml) | U = 3685.0 | U = 2376.0 | U = 678.0 | 48.0 (30.9–67.5) | 33.6 (n = 1) | 49.0 (37.0–71.2) | 32.3 (26.2–54.7) | H = 6.4 |
| p > 0.05 | p > 0.05 | p > 0.05 | (n = 13) | (n = 29) | (n = 32) | p > 0.05 | ||
| E (ng/ml) | U = 2347.0 | U = 1315.0 | U = 536.0 | 6.1 (4.6–13.7) | 11.9 (n = 1) | 8.5 (3.6–25.7) | 8.5 (5.1–18.7) | H = 0.3 |
| p > 0.05 | p > 0.05 | p > 0.05 | (n = 11) | (n = 22) | (n = 26) | p > 0.05 | ||
| DOPAC (ng/ml) | U = 3112.0 | U = 1862.0 | U = 546.0 | 6.7 (4.3–11.8) | 4.2 (n = 1) | 6.8 (3.5–12.7) | 6.2 (4.3–9.0) | H = 1.0 |
| p > 0.05 | p > 0.05 | p > 0.05 | (n = 11) | (n = 27) | (n = 31) | p > 0.05 | ||
| 5‐HIAA (ng/ml) | U = 3166.0 | U = 2267.0 | U = 642.0 | 8.2 (7.9–10.1) | 5.2 (n = 1) | 7.5 (6.3–10.2) | 5.6 (4.6–7.0) | H = 18.3 |
| p > 0.05 | p > 0.05 | p > 0.05 | (n = 13)a | (n = 29)b | (n = 32)a,b | p < 0.001 | ||
| DA (ng/ml) | U = 2736.0 | U = 1600.0 | U = 355.0 | 1.3 (0.8–1.7) | 1.2 (n = 1) | 1.3 (1.1–1.8) | 1.3 (0.9–1.5) | H = 0.9 |
| p > 0.05 | p > 0.05 | p < 0.05 | (n = 13) | (n = 26) | (n = 28) | p > 0.05 | ||
| HVA (ng/ml) | U = 3186.0 | U = 2176.0 | U = 689.0 | 12.5 (8.9–26.0) | 8.6 (n = 1) | 12.8 (8.1–19.8) | 10.0 (7.7–13.1) | H = 4.6 |
| p < 0.05 | p > 0.05 | p > 0.05 | (n = 13) | (n = 29) | (n = 32) | p > 0.05 | ||
| 5‐HT (ng/ml) | U = 3468.0 | U = 2209.0 | U = 603.0 | 24.3 (16.9–30.3) | 16.7 (n = 1) | 24.8 (13.5–40.5) | 21.7 (15.0–29.5) | H = 0.9 |
| p > 0.05 | p > 0.05 | p > 0.05 | (n = 13) | (n = 29) | (n = 31) | p > 0.05 | ||
| DOPAC/DA | U = 2356.0 | U = 1353.0 | U = 259.0 | 7.4 (3.4–13.2) | 3.4 (n = 1) | 5.4 (2.4–12.5) | 4.7 (3.3–10.1) | H = 1.6 |
| p > 0.05 | p > 0.05 | p < 0.05 | (n = 11) | (n = 24) | (n = 27) | p > 0.05 | ||
| HVA/DA | U = 2579.0 | U = 1484.0 | U = 653.0 | 13.2 (8.2–19.4) | 7.0 (n = 1) | 9.4 (6.9–17.7) | 8.3 (6.0–14.6) | H = 2.4 |
| p > 0.05 | p > 0.05 | p > 0.05 | (n = 13) | (n = 26) | (n = 28) | p > 0.05 | ||
| HVA/5‐HIAA | U = 3574.0 | U = 2327.0 | U = 695.000 | 1.6 (1.0–2.7) | 1.7 (n = 1) | 1.5 (1.2–2.2) | 1.7 (1.4–2.2) | H = 0.9 |
| p > 0.05 | p > 0.05 | p > 0.05 | (n = 13) | (n = 29) | (n = 32) | p > 0.05 | ||
| 5‐HIAA/5‐HT | U = 3461.0 | U = 2240.0 | U = 606.000 | 0.4 (0.3–0.5) | 0.3 (n = 1) | 0.3 (0.2–0.7) | 0.3 (0.2–0.4) | H = 2.5 |
| p > 0.05 | p > 0.05 | p > 0.05 | (n = 13) | (n = 29) | (n = 31) | p > 0.05 |
Notes: Mann Whitney U tests were performed to compare levels of monoamines, corresponding metabolites and ratios between patients taking/not taking psychotropic medication, antidepressants and antipsychotics (left three columns). Kruskal‐Wallis with post‐hoc Mann Whitney U tests were performed to compare levels of monoamines, corresponding metabolites and ratios between different groups (D+CI+, D+CI−, D−CI+ and D−CI−), including only patients free of psychotropic medication. Statistical results are enlisted in the rightmost column. Significant results following post‐hoc analysis with Bonferroni correction (p ≤ 0.00833 for six pairwise comparisons) are classified as p ≤ 0.00833, p ≤ 0.001 and p ≤ 0.0001 and are indicated by one, two or three superscript letters, respectively. The letters a,b denote significant differences between D+CI+ and D−CI− (psychotropic medication free)a and D−CI+ and D−CI− (psychotropic medication free)b.
Abbreviations: 5‐HIAA, 5‐hydroxyindoleacetic acid; 5‐HT, 5‐hydroxytryptamine (serotonin); CI, cognitive impairment; DA, dopamine;D+CI−, delirium but no cognitive impairment; D+CI+, delirium and cognitive impairment; D−CI−, no delirium or cognitive impairment; D−CI+, no delirium but cognitive impairment; DOPAC, 3,4‐dihydroxyphenylacetic acid; E, epinephrine; HVA, homovanillicacid; MHPG,3‐methoxy‐4‐hydroxyphenylglycol.
FIGURE 3.
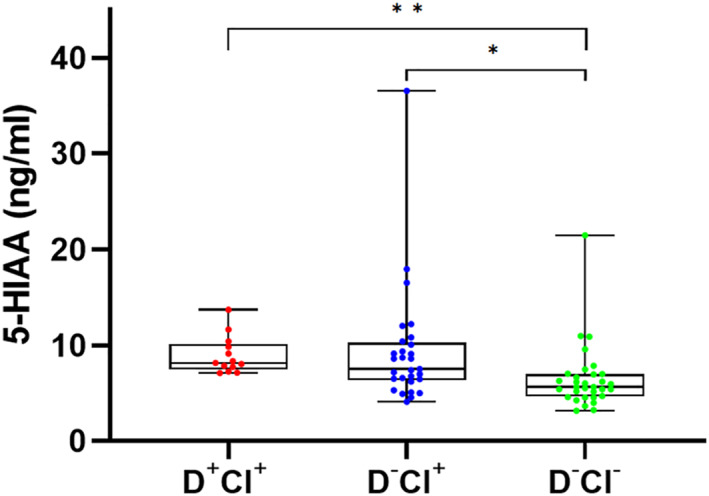
Boxplots visualizing plasma 5‐HIAA levels across psychotropic medication‐free patients in D+CI+, D−CI+ and D−CI− groups. Data which remained statistically significant following post‐hoc Bonferroni correction are denoted by asterisks (* for p ≤ 0.00833, ** for p ≤ 0.0001, respectively). D+CI− group was not included as it consisted of only one patient free from psychotropic medication. Abbreviations: 5‐HIAA, 5‐hydroxyindoleacetic acid; CI, cognitive impairment; D+CI+, delirium and cognitive impairment; D−CI+, no delirium but cognitive impairment; D+CI−, delirium but no cognitive impairment; D−CI−, no delirium or cognitive impairment
4. DISCUSSION
Monoaminergic alterations represent a significant part of the underlying pathophysiology of delirium. Therefore, our aim was to investigate plasma monoamine levels in control individuals and in patients experiencing either delirium (D+CI−), cognitive impairment (D−CI+) or both (D+CI+) following hip surgery under general anesthesia. We applied RP‐UHPLC‐ECD analysis to ensure optimal detection of these monoaminergic compounds within a feasible time frame. Clinical diagnosis of delirium and preexistent global cognitive impairment was performed by well‐trained staff using several measurement tools to minimize misdiagnosis. 21 Furthermore, we ensured that surgical anesthesia did not affect clinical diagnoses and monoamine levels by only including samples collected at least two days post‐surgery. We expected to see a general increase in norepinephrinergic and dopaminergic concentrations and an increase or decrease in 5‐HT metabolism consistent with existing literature. 8 , 16 , 29 Additionally, we hypothesized to see a monoaminergic link between cognitive impairment and delirium. The results indicate a general serotonergic disturbance in postoperative patients suffering from cognitive impairment, and a potentially similar phenomenon in patients suffering from postoperative delirium.
Plasma 5‐HIAA levels were significantly higher in D+CI+ and D−CI+ groups compared to control counterparts. The difference between these phenotypes was even more prominent in patients free of psychotropic medication. In the first place, this suggests a connection between 5‐HIAA and cognitive deficits, which supports earlier research linking serotonergic disturbances to cognitive impairment. 30 There were no significant differences between serotonergic levels of the D+CI− and the other groups. However, our findings might point to an additional effect of delirium superimposed on preexisting cognitive impairment, since 5‐HIAA levels in this group were also higher compared to control individuals, with increasing levels in the D+CI+ group. This would be consistent with Van der Cammen et al., who found elevated plasma 5‐HIAA levels in hospitalized delirious Alzheimer's disease (AD) patients but not in community‐based non‐delirious AD patients, compared to community‐based controls. This suggests the change in 5‐HIAA concentrations may be attributed to the presence of delirium rather than AD. 31 On the other hand, the inclusion of both hospitalized and community‐based patients may have influenced their findings, as delirium more likely occurs in postsurgical, hospitalized settings. 1 , 32 Two other delirium studies observed increased 5‐HIAA levels in CSF, one in humans and the other in experimental rats. Firstly, Banki and Vojnik reported increased CSF 5‐HIAA and blood 5‐HT levels in 11 women experiencing delirium tremens (currently referred to as a feature of alcohol withdrawal delirium) and nine schizophrenic females with clozapine‐induced acute delirium. 33 However, their study population only comprised female patients and delirium diagnosis criteria have been refined multiple times since, which may have affected their conclusions. Delirium is often underrecognized and there is discordance in diagnosing delirium, especially using different, earlier versions of the DSM manual. 34 Secondly, Qui et al. reported increased CSF 5‐HIAA levels in delirious rats. 35 In contrast, several other studies found CSF 5‐HIAA levels to remain unaltered or decreased rather than increased. 36 , 37 , 38 However, all these studies focused on CSF instead of plasma analysis. It is not entirely clear if 5‐HIAA can freely diffuse over the blood brain barrier or blood‐CSF barrier and if it reflects central rather than peripheral activity. 18 , 39 , 40 , 41 , 42 , 43 Therefore, changes in CSF 5‐HIAA may not be accurately reflected in plasma. In addition, serotonergic activity seems to depend on the delirium subtype, with decreased and elevated 5‐HT levels being observed in the hyperactive and hypoactive form of delirium, respectively. 19 Importantly, we also found a significant effect of age and sex on 5‐HIAA levels in the D−CI− group. For age, this is not unexpected since ageing can be associated to changes in monoaminergic neurotransmitter systems and mean age was significantly lower in the D−CI− group compared to the other groups. A possible explanation for the sex‐related dissimilarity in 5‐HIAA levels may lie in the difference of sex and stress hormone regulation between males and females, as sex hormones have been reported to differentially affect neurotransmission. 44
The levels of the norepinephrinergic metabolite MHPG were found to be higher in already cognitively impaired patients compared to the control group and seemed unaffected by psychotropic medication. This supports the findings of Lawlor et al., who found correlations between plasma MHPG levels and the severity of cognitive impairment in AD patients free from psychotropic medication. 45 In our study, no significant difference in plasma MHPG levels was detected between D+CI+ and D−CI+, although median plasma MHPG seemed higher in D+CI+ compared to D−CI+ and D−CI− patients. As mentioned before, there is an intimate connection between delirium and cognitive impairment. This reciprocal relationship could signify that an additional effect of delirium is underlying the higher MHPG levels observed in the D+CI+ compared to the D−CI+ and D−CI− groups. This is in agreement with several other studies. For example, Nakamura and colleagues found correlations between plasma MHPG concentrations and delirium. Plasma MHPG decreased as delirium improved in patients after mianserin (quadricyclic antidepressant and sedative) or haloperidol administration. 46 Other studies mentioned temporarily increased MHPG levels in patients with alcoholic delirium, 35 , 47 , 48 , 49 which decreased again in one study when the antipsychotic clozapine was administered. 48
Importantly, a number of pitfalls need to be considered in this study. Our results should not be readily generalized to all individuals experiencing delirium, as this study was conducted in a specific group of hospitalized elderly patients within a postoperative setting. It is also important to notice that the duration of a delirium episode can be short, enabling some patients to be assigned to different groups. In addition, the D+CI− group only comprised seven subjects. This reduced our statistical power and could explain why we did not detect significant differences between D+CI− and the other groups, or a monoaminergic link between cognitive impairment and delirium. Moreover, the intention of de Jonghe et al. was to examine the effect of melatonin on delirium. 21 Hence, patients taking psychotropic medication were not excluded, although statistical analysis revealed this did not affect our neurochemical observations. In contrast, the type of anesthesia did affect monoamine levels, in particular 5‐HIAA levels, in the D+CI+ group, although we attempted to minimize anesthesia effects by only including samples collected at least two days post‐surgery. We must also consider the possibility that these neurochemical findings are not related to cognitive impairment, but to hip fracture. We did not find a direct link between hip surgery or fracture and 5‐HIAA in the literature. However, there are strong indications that increased urinary 5‐HIAA levels are associated to decreased (hip) bone mineral density, 50 whereas improvements in bone mineral density were linked to reduced risk for hip fractures. 51 However, hip surgery is a common factor across all patients (as opposed to cognitive impairment), irrespective of delirium, and should therefore not bias our outcome. Since our study population consisted of postoperative patients, we must also consider the possibility that other pathological events such as perioperative covert stroke may have influenced the development of delirium, as well as neurochemical levels. Interestingly, it seems to be linked to an increased delirium incidence. 52 For this reason, we cannot exclude that this may have affected our results. Pre‐analytical confounding factors must also be taken into account. For example, the long sample storage time and previous thaw‐freeze cycle may have led to differential monoamine degradation due to compound‐specific differences in degradation speed. Other potentially confounding factors that were not investigated include stress, diet, sleep factors and the etiology of cognitive impairment. Patients in postoperative environments, with or without the presence of delirium, might experience considerable stress, which in turn could lead to increased peripheral (N)E and MHPG release. L‐tryptophan, the precursor to 5‐HT, is an essential amino acid derived from dietary uptake. 53 The influence of dietary intake on monoaminergic levels was not investigated. Yet, this effect should be minimal, since all patients received the same diet in the hospital. Interindividual differences in sleep/wake‐cycle regulation could have affected our results as well, considering disruptions in sleep biology are an important risk factor for delirium, whereas sleep regulation is also directly linked to the serotonergic system via multiple pathways. 54 , 55 , 56 Disparities in 5‐HIAA levels among cognitively impaired patients may also result from different etiologies of cognitive decline, such as Alzheimer's disease, vascular dementia etc. Unfortunately, since the assessment of cognitive function was based on MMSE and IQCODE scores without further work‐up to reveal a clinical diagnosis, we were unable to explore this. Finally, serotonergic findings could have been more accurate if we had used the platelet‐rich plasma fraction to obtain 5‐HT. 57 However, obtaining this fraction requires fresh plasma, which was not available in this study.
5. CONCLUSION
It has since long been hypothesized that delirium is characterized, among others, by alterations in monoamine neurotransmitter levels. In summary, this study set out to unravel whether this holds true in both cognitively normal and impaired elderly patients experiencing delirium post‐surgery. Furthermore, we hypothesized a monoaminergic link between delirium and preexistent cognitive impairment. Although we did not find any statistical differences for non‐cognitively impaired patients experiencing delirium, we were able to demonstrate serotonergic alterations in plasma for the cognitively impaired group and the group of patients suffering from both preexistent cognitive impairment and delirium. Our findings suggest a change in serotonergic neurotransmission in patients suffering from cognitive impairment and possibly also in patients suffering from delirium.
We are aware that our research has some limitations. Nevertheless, our research could serve as a base for future studies on delirium and the interplay between delirium and preexistent cognitive impairment. We recommend the use of larger age‐matched and medication‐free populations. Further research could determine whether the findings presented here are valid and can be reproduced in other patient populations. We strongly encourage future studies to further investigate the biomarker potential of plasma monoamines and metabolites as a means to improve pathophysiological insights and diagnostic accuracy of delirium, as it is an easily applicable, non‐invasive approach.
CONFLICT OF INTEREST
The authors declare no conflicts of interest.
ACKNOWLEDGMENTS
This work was supported by the Research Foundation Flanders (FWO), the Medical Research Foundation Antwerp, the Thomas Riellaerts research fund, Neurosearch Antwerp, and the Alzheimer Center of the University Medical Center Groningen.
Heylen A, Vermeiren Y, De Rooij SE, et al. Plasma 5‐HIAA activity indicative of serotonergic disturbances in cognitively impaired, elderly patients experiencing postoperative delirium. Int J Geriatr Psychiatry. 2022;1‐12. 10.1002/gps.5677
DATA AVAILABILITY STATEMENT
The data that support the findings of this study are available from the corresponding author upon reasonable request.
REFERENCES
- 1. Fong TG, Tulebaev SR, Inouye SK. Delirium in elderly adults: diagnosis, prevention and treatment. Nat Rev Neurol. 2009;5(4):210‐220. 10.1038/nrneurol.2009.24 [DOI] [PMC free article] [PubMed] [Google Scholar]
- 2. Vasilevskis EE, Han JH, Hughes CG, Ely EW. Epidemiology and risk factors for delirium across hospital settings. Best Pract Res Clin Anaesthesiol. 2012;26(3):277‐287. 10.1016/j.bpa.2012.07.003 [DOI] [PMC free article] [PubMed] [Google Scholar]
- 3. APA . Diagnostic and Statistical Manual of Mental Disorders. 5th ed. American Psychiatric Association; 2013. [Google Scholar]
- 4. Inouye SK, van Dyck CH, Alessi CA, Balkin S, Siegal AP, Horwitz RI. Clarifying confusion: the confusion assessment method. A new method for detection of delirium. Ann Intern Med. 1990;113(12):941‐948. 10.7326/0003-4819-113-12-941 [DOI] [PubMed] [Google Scholar]
- 5. Dharmarajan K, Swami S, Gou RY, Jones RN, Inouye SK. Pathway from delirium to death: potential in‐hospital mediators of excess mortality. J Am Geriatr Soc. 2017;65(5):1026‐1033. 10.1111/jgs.14743 [DOI] [PMC free article] [PubMed] [Google Scholar]
- 6. Witlox J, Eurelings LS, de Jonghe JF, Kalisvaart KJ, Eikelenboom P, van Gool WA. Delirium in elderly patients and the risk of postdischarge mortality, institutionalization, and dementia: a meta‐analysis. JAMA. 2010;304(4):443‐451. 10.1001/jama.2010.1013 [DOI] [PubMed] [Google Scholar]
- 7. Bickel H, Gradinger R, Kochs E, Förstl H. High risk of cognitive and functional decline after postoperative delirium. A three‐year prospective study. Dement Geriatr Cognit Disord. 2008;26(1):26‐31. 10.1159/000140804 [DOI] [PubMed] [Google Scholar]
- 8. Trzepacz PT. Is there a final common neural pathway in delirium? Focus on acetylcholine and dopamine. Semin Clin Neuropsychiatry. 2000;5(2):132‐148. https://pubmed.ncbi.nlm.nih.gov/10837102/ [DOI] [PubMed] [Google Scholar]
- 9. Fong TG, Jones RN, Shi P, et al. Delirium accelerates cognitive decline in Alzheimer disease. Neurology. 2009;72(18):1570‐1575. 10.1212/WNL.0b013e3181a4129a [DOI] [PMC free article] [PubMed] [Google Scholar]
- 10. Davis DH, Muniz Terrera G, Keage H, et al. Delirium is a strong risk factor for dementia in the oldest‐old: a population‐based cohort study. Brain. 2012;135(Pt 9):2809‐2816. 10.1093/brain/aws190 [DOI] [PMC free article] [PubMed] [Google Scholar]
- 11. Maclullich AM, Anand A, Davis DH, et al. New horizons in the pathogenesis, assessment and management of delirium. Age Ageing. 2013;42(6):667‐674. 10.1093/ageing/aft148 [DOI] [PMC free article] [PubMed] [Google Scholar]
- 12. Fong TG, Davis D, Growdon ME, Albuquerque A, Inouye SK. The interface between delirium and dementia in elderly adults [published correction appears in Lancet Neurol. 2015 Aug;14(8):788]. Lancet Neurol 2015;14(8):823‐832. 10.1016/S1474-4422(15)00101-5 [DOI] [PMC free article] [PubMed] [Google Scholar]
- 13. Maldonado JR. Delirium pathophysiology: an updated hypothesis of the etiology of acute brain failure. Int J Geriatr Psychiatr. 2018;33(11):1428‐1457. 10.1002/gps.4823 [DOI] [PubMed] [Google Scholar]
- 14. van der Mast RC. Pathophysiology of delirium. J Geriatr Psychiatr Neurol. 1998;11(3):138‐145. 10.1177/089198879801100304 [DOI] [PubMed] [Google Scholar]
- 15. Maldonado JR. Neuropathogenesis of delirium: review of current etiologic theories and common pathways. Am J Geriatr Psychiatr. 2013;21(12):1190‐1222. 10.1016/j.jagp.2013.09.005 [DOI] [PubMed] [Google Scholar]
- 16. Hshieh TT, Fong TG, Marcantonio ER, Inouye SK. Cholinergic deficiency hypothesis in delirium: a synthesis of current evidence. J Gerontol A Biol Sci Med Sci. 2008;63(7):764‐772. 10.1093/gerona/63.7.764 [DOI] [PMC free article] [PubMed] [Google Scholar]
- 17. Yudofsky SC, Hales RE. The American psychiatric publishing textbook of neuropsychiatry and behavioral neurosciences, fifth edition. Am J Psychiatry. 2008;165(2):267‐268. [DOI] [PubMed] [Google Scholar]
- 18. Inouye SK, Westendorp RG, Saczynski JS. Delirium in elderly people. Lancet. 2014;383(9920):911‐922. 10.1016/S0140-6736(13)60688-1 [DOI] [PMC free article] [PubMed] [Google Scholar]
- 19. Isik AT, Grossberg GT. Delirium in Elderly Patients. Springer International Publishing; 2017:135. [Google Scholar]
- 20. Watne LO, Idland AV, Fekkes D, et al. Increased CSF levels of aromatic amino acids in hip fracture patients with delirium suggests higher monoaminergic activity. BMC Geriatr. 2016;16:149. 10.1186/s12877-016-0324-0 [DOI] [PMC free article] [PubMed] [Google Scholar]
- 21. de Jonghe A, van Munster BC, Goslings JC, et al. Effect of melatonin on incidence of delirium among patients with hip fracture: a multicentre, double‐blind randomized controlled trial. CMAJ (Can Med Assoc J). 2014;186(14):E547‐E556. 10.1503/cmaj.140495 [DOI] [PMC free article] [PubMed] [Google Scholar]
- 22. de Jonghe A, van Munster BC, van Oosten HE, et al. The effects of melatonin versus placebo on delirium in hip fracture patients: study protocol of a randomised, placebo‐controlled, double blind trial. BMC Geriatr. 2011;11:34. 10.1186/1471-2318-11-34 [DOI] [PMC free article] [PubMed] [Google Scholar]
- 23. Schuurmans MJ, Shortridge‐Baggett LM, Duursma SA. The delirium observation screening Scale: a screening instrument for delirium. Res Theor Nurs Pract. 2003;17(1):31‐50. 10.1891/rtnp.17.1.31.53169 [DOI] [PubMed] [Google Scholar]
- 24. Jorm AF. A short form of the informant Questionnaire on cognitive decline in the elderly (IQCODE): development and cross‐validation [published correction appears in psychol med 1995 mar;25(2):437]. Psychol Med. 1994;24(1):145‐153. 10.1017/s003329170002691x [DOI] [PubMed] [Google Scholar]
- 25. de Jonghe JF. Differentiating between demented and psychiatric patients with the Dutch version of the IQCODE. Int J Geriatr Psychiatr. 1997;12(4):462‐465. 10.1002/(sici)1099-1166(199704)12:4<462::aid-gps510>3.0.co;2-q [DOI] [PubMed] [Google Scholar]
- 26. Folstein MF, Folstein SE, McHugh PR. Mini‐mental state. A practical method for grading the cognitive state of patients for the clinician. J Psychiatr Res. 1975;12(3):189‐198. 10.1016/0022-3956(75)90026-6 [DOI] [PubMed] [Google Scholar]
- 27. Charlson ME, Pompei P, Ales KL, MacKenzie CR. A new method of classifying prognostic comorbidity in longitudinal studies: development and validation. J Chron Dis. 1987;40(5):373‐383. 10.1016/0021-9681(87)90171-8 [DOI] [PubMed] [Google Scholar]
- 28. Janssens J, Vermeiren Y, van Faassen M, van der Ley C, Kema IP, De Deyn PP. Monoaminergic and kynurenergic characterization of frontotemporal dementia and amyotrophic lateral sclerosis in cerebrospinal fluid and serum. Neurochem Res. 2020;45(5):1191‐1201. 10.1007/s11064-020-03002-5 [DOI] [PMC free article] [PubMed] [Google Scholar]
- 29. Yudofsky SC, Hales RE. The American psychiatric publishing textbook of neuropsychiatry and behavioral neurosciences, fifth edition. Am J Psychiatr. 2008;165(2):267‐268. 10.1176/appi.ajp.2007.07101662 [DOI] [PubMed] [Google Scholar]
- 30. Ciranna L. Serotonin as a modulator of glutamate‐ and GABA‐mediated neurotransmission: implications in physiological functions and in pathology. Curr Neuropharmacol. 2006;4(2):101‐114. 10.2174/157015906776359540 [DOI] [PMC free article] [PubMed] [Google Scholar]
- 31. van der Cammen TJ, Tiemeier H, Engelhart MJ, Fekkes D. Abnormal neurotransmitter metabolite levels in Alzheimer patients with a delirium. Int J Geriatr Psychiatr. 2006;21(9):838‐843. 10.1002/gps.1569 [DOI] [PubMed] [Google Scholar]
- 32. Isaia G, Astengo MA, Tibaldi V, et al. Delirium in elderly home‐treated patients: a prospective study with 6‐month follow‐up. Age (Dordr). 2009;31(2):109‐117. 10.1007/s11357-009-9086-3 [DOI] [PMC free article] [PubMed] [Google Scholar]
- 33. Banki CM, Vojnik M. Comparative simultaneous measurement of cerebrospinal fluid 5‐hydroxyindoleacetic acid and blood serotonin levels in delirium tremens and clozapine‐induced delirious reaction. J Neurol Neurosurg Psychiatry. 1978;41(5):420‐424. 10.1136/jnnp.41.5.420 [DOI] [PMC free article] [PubMed] [Google Scholar]
- 34. Trzepacz PT, Meagher DJ, Franco JG. Comparison of diagnostic classification systems for delirium with new research criteria that incorporate the three core domains. J Psychosom Res. 2016;84:60‐68. 10.1016/j.jpsychores.2016.03.011 [DOI] [PubMed] [Google Scholar]
- 35. Qiu Y, Huang X, Huang L, et al. 5‐HT(1A) receptor antagonist improves behavior performance of delirium rats through inhibiting PI3K/Akt/mTOR activation‐induced NLRP3 activity. IUBMB Life. 2016;68(4):311‐319. 10.1002/iub.1491 [DOI] [PubMed] [Google Scholar]
- 36. Fujimoto A, Nagao T, Ebara T, Sato M, Otsuki S. Cerebrospinal fluid monoamine metabolites during alcohol withdrawal syndrome and recovered state. Biol Psychiatr. 1983;18(10):1141‐1152. [PubMed] [Google Scholar]
- 37. Koponen HJ, Lepola U, Leinonen E. A long‐term follow‐up study of cerebrospinal fluid 5‐hydroxyindoleacetic acid in delirium. Eur Arch Psychiatr Clin Neurosci. 1994;244(3):131‐134. 10.1007/BF02191886 [DOI] [PubMed] [Google Scholar]
- 38. Couvreur G, Demougeot C, Maugras C, Marie C, Beley P, Giroud M. 5‐Hydroxyindolacetic acid and homovanillic acid are not involved in the cerebrospinal fluid after a seizure in patients with Delirium Tremens. Neurol Res. 2002;24(6):599‐600. 10.1179/016164102101200429 [DOI] [PubMed] [Google Scholar]
- 39. Burns D, Brunswick D, London J, Mendels J. The kinetics of 5‐hydroxyindoleacetic acid excretion from rat brain and CSF: preliminary studies and multicompartment analysis. In: Berl S, Clarke DD, Schneider D, eds. Metabolic Compartmentation and Neurotransmission. Springer; 1975:577‐584. [Google Scholar]
- 40. Bulat M, Supek Z. The penetration of 5‐hydroxytryptamine through the blood‐brain barrier. J Neurochem. 1967;14(3):265‐271. 10.1111/j.1471-4159.1967.tb09523.x [DOI] [PubMed] [Google Scholar]
- 41. Celada P, Artigas F. Plasma 5‐hydroxyindoleacetic acid as an indicator of monoamine oxidase‐A inhibition in rat brain and peripheral tissues. J Neurochem. 1993;61(6):2191‐2198. 10.1111/j.1471-4159.1993.tb07459.x [DOI] [PubMed] [Google Scholar]
- 42. Lambert GW, Kaye DM, Cox HS, et al. Regional 5‐hydroxyindoleacetic acid production in humans. Life Sci 1995;57(3):255‐267. 10.1016/0024-3205(95)00269-c [DOI] [PubMed] [Google Scholar]
- 43. Lexchin JL, Cude‐Simpson KD, Stancer HC. Brain and blood indole metabolites after peripheral administration of(14)C‐5‐HT in rat. Neurochem Res. 1977;2(1):39‐50. 10.1007/BF00966020 [DOI] [PubMed] [Google Scholar]
- 44. Barth C, Villringer A, Sacher J. Sex hormones affect neurotransmitters and shape the adult female brain during hormonal transition periods. Front Neurosci. 2015;9:37. 10.3389/fnins.2015.00037 [DOI] [PMC free article] [PubMed] [Google Scholar]
- 45. Lawlor BA, Bierer LM, Ryan TM, et al. Plasma 3‐methoxy‐4‐hydroxyphenylglycol (MHPG) and clinical symptoms in Alzheimer's disease. Biol Psychiatr. 1995;38(3):185‐188. 10.1016/0006-3223(94)00259-6 [DOI] [PubMed] [Google Scholar]
- 46. Nakamura J, Uchimura N, Yamada S, Nakazawa Y. Does plasma free‐3‐methoxy‐4‐hydroxyphenyl(ethylene)glycol increase in the delirious state? A comparison of the effects of mianserin and haloperidol on delirium. Int Clin Psychopharmacol. 1997;12(3):147‐152. 10.1097/00004850-199705000-00005 [DOI] [PubMed] [Google Scholar]
- 47. Athen D, Beckmann H, Ackenheil M, Markianos M. Biochemical investigations into the alcoholic delirium: alterations of biogenic amines. Arch Psychiatr Nervenkr. 1977;224(2):129‐140. 10.1007/BF00346481 [DOI] [PubMed] [Google Scholar]
- 48. Ackenheil M, Athen D, Beckmann H. Pathophysiology of delirious states. J Neural Transm Suppl. 1978(14):167‐175. [PubMed] [Google Scholar]
- 49. Hartleb J, Eue S, Kemper A. Simultaneous analysis of homovanillic acid, 5‐hydroxyindoleacetic acid, 3‐methoxy‐4‐hydroxyphenylethylene glycol and vanilmandelic acid in plasma from alcoholics by high‐performance liquid chromatography with electrochemical detection. Critical comparison of solid‐phase and liquid‐liquid extraction methods. J Chromatogr. 1993;622(2):161‐171. [PubMed] [Google Scholar]
- 50. Sen Gupta P, Grozinsky‐Glasberg S, Drake WM, et al. Are serotonin metabolite levels related to bone mineral density in patients with neuroendocrine tumours? Clin Endocrinol. 2014;80(2):246‐252. 10.1111/cen.12270 [DOI] [PubMed] [Google Scholar]
- 51. Bouxsein ML, Eastell R, Lui LY, et al. Change in bone density and reduction in fracture risk: a meta‐regression of published trials. J Bone Min Res. 2019;34(4):632‐642. 10.1002/jbmr.3641 [DOI] [PubMed] [Google Scholar]
- 52. Investigators NeuroVISION. Perioperative covert stroke in patients undergoing non‐cardiac surgery (NeuroVISION): a prospective cohort study. Lancet. 2019;394(10203):1022‐1029. 10.1016/S0140-6736(19)31795-7 [DOI] [PubMed] [Google Scholar]
- 53. Friedman M. Analysis, nutrition, and health benefits of tryptophan. Int J Tryptophan Res. 2018;11:117864691880228. 10.1177/1178646918802282 [DOI] [PMC free article] [PubMed] [Google Scholar]
- 54. Ulsa MC, Zheng X, Li P, et al. Association of poor sleep burden in middle age and older adults with risk for delirium during hospitalization [published online ahead of print, 2021 Sep 24]. J Gerontol A Biol Sci Med Sci. 2021;glab272. 10.1093/gerona/glab272 [DOI] [PMC free article] [PubMed] [Google Scholar]
- 55. Fourtillan JB. Role of melatonin in the induction and maintenance of sleep. Dialogues Clin Neurosci. 2002;4(4):395‐401. 10.31887/DCNS.2002.4.4/jbfourtillan [DOI] [PMC free article] [PubMed] [Google Scholar]
- 56. Portas CM, Bjorvatn B, Ursin R. Serotonin and the sleep/wake cycle: special emphasis on microdialysis studies. Prog Neurobiol. 2000;60(1):13‐35. 10.1016/s0301-0082(98)00097-5 [DOI] [PubMed] [Google Scholar]
- 57. van Faassen M, Bouma G, de Hosson LD, et al. Quantitative profiling of platelet‐rich plasma indole markers by direct‐matrix derivatization combined with LC‐MS/MS in patients with neuroendocrine tumors. Clin Chem. 2019;65(11):1388‐1396. 10.1373/clinchem.2019.305359 [DOI] [PubMed] [Google Scholar]
Associated Data
This section collects any data citations, data availability statements, or supplementary materials included in this article.
Data Availability Statement
The data that support the findings of this study are available from the corresponding author upon reasonable request.