

Abstract
Human immunodeficiency virus 1 (HIV‐1) virus‐like particles (VLPs) are nanostructures derived from the self‐assembly and cell budding of Gag polyprotein. Mimicking the native structure of the virus and being noninfectious, they represent promising candidates for the development of new vaccines as they elicit a strong immune response. In addition to this, the bounding membrane can be functionalized with exogenous antigens to target different diseases. Protein glycosylation depends strictly on the production platform and expression system used and the displayed glycosylation patterns may influence downstream processing as well as the immune response. One of the main challenges for the development of Gag VLP production bioprocess is the separation of VLPs and coproduced extracellular vesicles (EVs). In this study, porous graphitized carbon separation method coupled with mass spectrometry was used to characterize the N‐ and O‐ glycosylation profiles of Gag VLPs produced in HEK293 cells. We identified differential glycan signatures between VLPs and EVs that could pave the way for further separation and purification strategies to optimize downstream processing and move forward in VLP‐based vaccine production technology.
Keywords: HIV‐1, N‐glycans, O‐glycans, porous graphitized carbon, vaccine, virus‐like particles
A detailed characterization of the different N‐ and O‐glycans present in the membrane of human immunodeficiency virus 1 (HIV‐1) Gag virus‐like particles (VLPs) and coproduced extracellular vesicles (EVs) in HEK293 was performed in this study. Significant changes in relative abundance of the glycan species between EVs and VLPs were identified, laying the groundwork for the future design of downstream separation strategies.
Abbreviations
- APC
antigen‐presenting cells
- CHO
Chinese hamster ovary
- CLR
C‐type lectin receptor
- EIC
extracted ion chromatogram
- EV
extracellular vesicle
- Gag::eGFP
translational fusion of HIV‐1 Gag polyprotein and enhanced GFP
- GlcNAc
N‐acetylglucosamine
- GnT‐III
N‐acetylglucosaminyltransferase‐III
- HEK
human embryonic kidney
- Hex
hexose
- HexNAc
N‐acetylhexosamine
- HIV‐1
human immunodeficiency virus 1
- LC‐MS/MS
liquid chromatography coupled to tandem mass spectrometry
- Man
mannose
- NeuAc
N‐acetylneuraminic acid
- NeuGc
N‐glycolylneuraminic acid
- NTA
nanoparticle tracking analysis
- PBS
phosphate‐buffered saline
- PEI
polyethylenimine
- PGC
porous graphitized carbon
- RFU
relative fluorescence unit
- sEV
small extracellular vesicles
- VLP
virus‐like particle
1. INTRODUCTION
Protein glycosylation represents a crucial feature in the design and development of new vaccines. Glycans play essential roles in cellular processes such as signaling, cell‐to‐cell communication, vesicle transport regulation, pathogen recognition, immune responses, and allergic reactions (Johannssen & Lepenies, 2017; Varki, 2017; Vigerust & Shepherd, 2007). Therefore, the design and characterization of the different glycoforms present in a biopharmaceutical product have tremendous impact in its development and further safety, efficacy, tolerability, and bioavailability optimization (Duivelshof et al., 2019; Yehuda & Padler‐Karavani, 2020). Harboring the correct glycosylation of biopharmaceuticals like monoclonal antibodies has been demonstrated to improve the stability, solubility and it is important for safety and efficacy (Gupta & Shukla, 2018; Mastrangeli et al., 2018). In the case of influenza viral particles, high titers of IgG were produced when HA proteins carried high mannose glycans while HA inhibition and neutralizing antibody titers were higher with complex glycans (Lin et al., 2013). The usefulness of polysaccharides in eliciting a complete immune response is widely valued in conjugate vaccines where they are used to interact directly with B cells through a T cell‐independent pathway to produce a rapid and restricted antibody response (Goldblatt, 2000). Thus, future glycoengineered viral particles could lead the way to self‐adjuvanted viral vaccines (Schön et al., 2020). However, the most important element representing implications in vaccine development is choosing the best‐suited cell‐based platform for viral particle production, one of the most relevant challenges nowadays. Viruses depend almost entirely on the host cell glycosylation machinery (Watanabe et al., 2019). Thus, the recombinant production of viral particles based on viral component, such as human immunodeficiency virus 1 (HIV‐1) Gag‐based virus‐like particles (VLPs), relies on the host cell biosynthesis pathways for post‐translational modifications (Roldão et al., 2010). Different expression systems like plant or insect cells are among the most used platforms for viral vaccine production due to high titers (Cervera et al., 2019) while producing glycans that are substantially different from human glycosylation, influencing the immunological properties of the subsequent viral particles (Lancaster et al., 2016). Although displaying specific exogenous glycan forms, like fungal glycans, can activate C‐type lectin receptors (CLRs) and promote an immune response (Lepenies et al., 2013), the use of biopharmaceuticals produced in nonhuman expression systems for clinical applications requires special attention. Exogenous immunologically active glycans may cause allergy reactions, therapy rejection, or other different side effects (Md et al., 2021; Tretter et al., 1993). Still within mammalian cell systems, nonhuman platforms like Chinese hamster ovary (CHO) cells present complex N‐glycans capped with N‐glycolylneuraminic acid (NeuGc), largely absent in human cells (Dhar et al., 2019; Ghaderi et al., 2010). Also, human cell lines can generate very different glycosylation patterns depending on their progeny, culture conditions, or immortalization methods (Colgrave et al., 2012). Altogether these considerations make the glycomic characterization of the biotherapeutic derived from the chosen production platform a requirement for further clinical applications. In the case of HIV‐1 Gag VLPs, the human embryonic kidney (HEK) cell line is considered as a reference for its production, since they are easily transfected and can be cultured in suspension, resulting in good scalability (Ausubel et al., 2012; Lavado‐García, Cervera, et al., 2020). VLPs are nanostructures resembling the nature confirmation of the virus but lacking genetic information, hence they are noninfective while carrying viral antigens to elicit an immune response. Gag VLPs are produced via budding from the cell membrane, carrying the host cell membrane glycoproteins. Understanding the glycosylation displayed in VLPs produced in HEK293 cells could help assess and study their immunogenic potential. Moreover, characterizing the glycan profile of Gag VLPs produced in HEK293 cells could offer relevant information that could be used to design purification strategies and new methods to separate VLPs and extracellular vesicles (EVs), a current remaining challenge (Effio & Hubbuch, 2015; Seifalian et al., 2010).
In this study, we report on the characterization of the N‐ and O‐glycan profile of Gag VLPs produced in HEK293 cells. To do this, the analysis by porous graphitized carbon (PGC) liquid chromatography coupled to tandem mass spectrometry (LC‐MS/MS) has been selected due to the advantages of the method. PGC‐LC‐MS/MS is able to separate structural and linkage isomers, providing a detailed and specific glycosylation fingerprint (Jensen et al., 2012; Stavenhagen et al., 2014; Thomsson et al., 2010; Zhang et al., 2020). The insight of these analyses may help further optimize the design of VLP‐based vaccines via glycoengineering approaches and provide new ideas for purification steps that could pave the way towards better bioprocesses, vaccines, and therapies.
2. EXPERIMENTAL SECTION
2.1. HEK 293 MAMMALIAN CELL LINE, CULTURE CONDITIONS
The cell line used in this study is a serum‐free suspension‐adapted HEK 293 cell line (HEK293SF‐3F6, NRC) kindly provided by Prof. Amine Kamen from McGill University (Montreal, Canada). Cells were cultured in disposable polycarbonate 250 ml flasks with vent cap (Corning®) at 37°C, 5% of CO2 and 85% RH at 130 rpm in an LT‐X Kuhner shaker (LT‐X Kuhner). Cell culture media was HyCell™ TransFx‐H media from HyClone™ (GE Healthcare) supplemented with 4 mM GlutaMAX™ (Gibco, Life Technologies, ThermoFisher) and 0.1% Pluronic™ F‐68 nonionic surfactant (Gibco, Life Technologies). Cell concentration and viability were determined using the NucleoCounter®NC‐3000 automatic cell counter (Chemometec) according to manufacturer's instructions.
2.2. TRANSIENT TRANSFECTION
Transfections were carried out at a cell density of 2 × 10⁶ cells/ml using a final DNA concentration of 1 µg/ml. PEI/DNA complexes were formed by adding PEI to plasmid DNA diluted in fresh culture medium (10% of the total culture volume to be transfected). Transfection reagent PEIpro® (Polyplus‐transfection) was used. Briefly, the corresponding plasmid was diluted with supplemented HyCell™ culture media and vortexed for 10 s. Then PEI was added in 1:2 (w/w) DNA:PEI ratio and vortexed three times, incubated for 15 min at room temperature (RT) and then added to the cell culture. The plasmid used encoded an HIV‐Gag protein fused in frame to eGFP (Gag::eGFP). As a transfection control, a plasmid sharing the same backbone but lacking the Gag::eGFP gene was used and noted as mock.
2.3. HIV‐1 GAG VLP QUANTIFICATION BY FLUORIMETRY
The extracellular concentration of HIV‐1 Gag VLPs was assessed by fluorimetry using an ad hocdeveloped and validated quantification assay (Gutiérrez‐Granados et al., 2013). VLP‐containing supernatants were recovered by cell culture centrifugation at ×1000g for 5 min. Relative fluorescence unit values were calculated by subtracting fluorescence unit values of nontransfected negative control samples.
2.4. ULTRACENTRIFUGATION
VLP‐containing supernatants were recovered by cell culture centrifugation at ×1000g for 5 min. Then, concentrated and purified HIV‐1 Gag VLPs were obtained by single sucrose cushion ultracentrifugation. Briefly, a volume of 35 ml of clarified supernatant from HEK293 transiently transfected cell culture was layered on top of a 30% sucrose cushion of 3 ml and centrifuged at 31,000 rpm for 2.5 h at 4°C using an SW32 rotor in a Beckman Optima L100XP centrifuge. After ultracentrifugation, supernatant was discarded and the obtained pellet was resuspended in 1 ml of PBS (Hyclone, GE HeathCare). The concentrated material was stored at −80°C for future studies.
2.5. EVs AND VLPs LYSIS
Total protein concentration was quantified using Micro BCA™ Protein Assay Kit (23235, ThermoFisher Scientific) according to manufacturer's instructions. Membrane lysis was performed using lysis buffer without detergents: 50 mM Tris‐HCl (Sigma‐Aldrich), 100 mM NaCl (Sigma‐Aldrich), 1 mM EDTA (Sigma‐Aldrich), and one tablet of protease inhibitor cocktail (Complete ULTRA Tablets Mini, Roche). Briefly, the corresponding volume of purified samples containing 20 μg of protein was mixed at a ratio 9:1 with concentrated lysis buffer, vortexed for 30 s and followed by two cycles of heating at 60°C for 15 min and sonication for 30 min in an ultrasound bath at RT.
2.6. GLYCOPROTEIN AND VESICLE LYSATE IMMOBILIZATION, DENATURATION, AND REDUCTION
A specific method for glycan release and reduction was carried out (Zhang et al., 2020). A 96‐well plate with hydrophobic Immobilon‐P PVDF membrane (MultiScreen® HTS 96 multiwell plates, pore size 0.45 μm, Millipore) was preconditioned with three times 200 μl 70% ethanol followed by equilibration three times with 200 μl water. Previously prepared lysates as well as intact EVs and VLPs were applied to the PVDF membrane directly. Purified fetuin glycoprotein (Sigma‐Aldrich) was used as a standard and also directly applied to the PVDF membrane followed by horizontal shaking for 30 min. Protein denaturation was achieved by applying 75 μl of denaturation mix, 72.5 μl 8 M GuHCl (ThermoFisher Scientific), and 2.5 μl 200 mM DTT (Sigma‐Aldrich) in each well, followed by 10 min shaking and incubating at 60°C in a moisture box for 30 min. Subsequently, the unbound material was removed by washing three times with water each time followed by centrifugation at ×500g for 1 min. Any residual liquid was subsequently removed from the membrane by pipetting and discarded.
2.7. ENZYMATIC N‐GLYCAN RELEASE, REDUCTION, AND PURIFICATION
N‐glycan release was performed as previously described (Holst et al., 2017) with small modifications. PNGase F (Roche Diagnostics, 2 U of enzyme diluted with water up to 15 μl) was added to each well followed by 10 min shaking at RT. The plate was incubated in a humidified box for 15 min at 37°C. Subsequently, another 15 μl of water was added in each well, including 10 ng of maltoheptaose (DP7; M7753, Sigma‐Aldrich) as an internal standard. The plate was then incubated overnight in a humidified plastic box at 37°C to avoid evaporation of the digestion solution. Released N‐glycans were recovered from the PVDF plate by three rounds of centrifugation at ×1000g for 2 min and washing with 40 μl of water. To hydrolyze N‐glycan glycosylamine forms, 10 μl of 100 mM ammonium acetate (Sigma‐Aldrich) (pH 5) were added followed by a 1 h incubation at RT. Samples were subsequently dried in a SpeedVac concentrator 5301 (Eppendorf) at 40°C. Collected N‐glycans were then reduced and desalted followed by PGC cleanup using a 96‐well plate‐based protocol previously reported (Jensen et al., 2012). Briefly, for the reduction, 20 μl of 1 M NaBH4 (Sigma‐Aldrich) in 50 mM KOH (Sigma‐Aldrich) was added to each well followed by incubation for 3 h at 60°C in a humidified plastic box. To quench the reaction, 3 μl of glacial acetic acid (Honeywell Fluka) was added to each sample. Desalting of the samples was performed using a strong acidic cation exchange resin Dowex 50W‐X8 (Sigma‐Aldrich) which was self‐packed into 96‐well filter plates. Briefly, 100 μl of resin slurry in methanol (50/50, v/v) was added to each well in the filter plate. The columns were preconditioned by 3 × 100 μl of 1 M HCl, followed by 3 × 100 μl methanol and 3 × 100 μl water each time removed by centrifuging at ×500g. The samples containing N‐glycans were loaded onto the columns and eluted two times with 40 μl of water followed by centrifugation at ×500g. The combined flow‐through and wash were collected and dried in a SpeedVac concentrator at 40°C. The remaining borate was removed by several rounds of co‐evaporation using 100 μl methanol in the SpeedVac concentrator at 40°C. SPE cleaning step was performed by packing 60 μl (approximately 6 mg) of bulk sorbent Carbograph slurry (Grace Discovery Sciences) in methanol into a 96‐well filter plate. The columns were preconditioned by 3 × 100 μl of 80% acetonitrile in water containing 0.1% TFA, and 3 × 100 μl water with 0.1% TFA. After loading the sample, the columns were washed three times with 80 μl of 0.1% TFA, followed by N‐glycan elution by 3 × 40 μl of 60% acetonitrile in water containing 0.1% TFA. Samples were dried in a SpeedVac concentrator directly in polymerase chain reaction plates for injection and re‐dissolved in 10 μl of water before PGC nano‐LC‐ESI‐MS/MS analysis.
2.8. O‐GLYCAN RELEASE AND PURIFICATION
After removal of N‐glycans, O‐glycans were released from the same PVDF membrane immobilized sample via reductive β‐elimination. Briefly, 50 μl of 0.5 M NaBH4 in 50 mM KOH was applied onto each PVDF membrane well after rewetting with 3 μl of methanol. 10 ng of maltopentaose (DP5; M8128, Sigma‐Aldrich) was added as an internal standard. Plates were then shaken for 15 min on a horizontal shaker and incubated in a humidified plastic box for 16 h at 55°C. After incubation and cooling to RT, released O‐glycans were recovered by centrifugation at ×1000g for 2 min into 96‐well collection plates. The wells were rewetted by 3 μl of methanol and washed three times with 50 μl of water with 10 min incubation steps on a horizontal shaker before centrifugation at ×500g for 2 min. Before desalting, the collected samples were concentrated to approximately 30 μl under vacuum in a SpeedVac concentrator at 40°C for 2 h. Subsequently, 3 μl of glacial acetic acid was added to acidify the reaction followed by brief centrifugation to collect the sample at the bottom of the well. Subsequently, high throughput desalting and PGC SPE purification were performed as described in the N‐glycan preparation section. The purified O‐glycan alditols were re‐suspended in 10 μl of water before PGC nano‐LC‐ESI‐MS/MS analysis.
2.9. ANALYSIS OF RELEASED N‐ AND O‐GLYCAN ALDITOLS USING PGC NANO‐LC‐ESI‐MS/MS
The analysis of N‐glycans and O‐glycans was performed on an Ultimate 3000 UHPLC system (Thermo Fisher Scientific) equipped with a Hypercarb PGC trap column (5 μm Hypercarb Kappa, 320 μm × 30 mm, Thermo Fisher Scientific) and a Hypercarb PGC nano‐column (3 μm Hypercarb 75 μm × 100 mm, Thermo Fisher Scientific) coupled to an amaZon ETD speed ion trap (Bruker). Mobile phase A consisted of 10 mM ammonium bicarbonate (ABC), while mobile phase B was 60% (v/v) acetonitrile/10 mM ABC. To analyze glycans, 2 μl of prepared sample was injected and trapped on the trap column using a 6 μl/min loading flow in 2% buffer B for N‐glycan and 1% buffer B for O‐glycans for 5 min. Separation was achieved with a multi‐step gradient of B: 2%–9% in 1 min and 9%–49% in 80 min for N‐glycan and 1%–52% over 72 min for O‐glycans followed by a 10 min wash step using 95% of B at a flow of rate of 0.6 μl/min. The column was held at a constant temperature of 45°C. Ionization was achieved using the nanoBooster source (Bruker) with a capillary voltage of 1000 V applied, dry gas temperature of 280°C at 5 L/min, and nebulizer at 3 psi. Isopropanol enriched dopant nitrogen was used. MS spectra were acquired from m/z 500–1850 for N‐glycans and 380–1850 for O‐glycans in enhanced mode, smart parameter setting was set to m/z 1200 for N‐glycans and m/z 900 for O‐glycans; ion charge control (ICC) to 4 × 10³ and maximum acquisition time to 200 ms. MS/MS spectra were generated using collision‐induced dissociation over an m/z range from 100 to 2500 on the top three most abundant precursors, applying an isolation width of 3 Thomson. The fragmentation cut‐off was set to 27% with 100% fragmentation amplitude using the Enhanced SmartFrag option from 30% to 120% in 32 ms and ICC was set to 150,000.
2.10. DATA PROCESSING
Glycan structures were assigned based on glycan composition obtained from accurate mass, relative PGC elution position, MS/MS fragmentation pattern in negative‐ion mode, and general glycobiological knowledge (Karlsson, Schulz, et al., 2004; Karlsson, Wilson, et al., 2004) with help of Glycoworkbench (Ceroni et al., 2008) and Glycomod (Cooper et al., 2001) software tools. Extracted ion chromatograms were used to integrate the area under the curve for each individual glycan isomer using Compass Data Analysis software v.5.0 (Bruker). Glycan peaks in the profile were manually picked and integrated. Relative quantitation of individual glycans was performed on the total area of all included glycans within one sample normalized to 100%.
2.11. PARTICLE SIZE MEASUREMENT
Nanoparticle tracking analysis (NTA) was performed with a NanoSight® LM20 device (NanoSight Ltd.) equipped with a blue laser module (488 nm) to quantify HIV‐1 Gag::eGFP VLPs and neutral density filter for total particle by light scattering. Data were analyzed with NanoSight® NTA 3.2 software. Briefly, samples were injected, and three technical replicate analyses were carried out. Subsequently, particles were identified and tracked by their Brownian motion at RT. Capture settings were recorded with an sCMOS camera (camera level of 8 for Gag::eGFP VLP samples, and 11 for controls, viscosity: 0.9 cP) and analyzed with a detection threshold of 4.
2.12. EXPERIMENTAL DESIGN AND STATISTICAL RATIONALE
For the comparative relative quantification glycomic experiments, three conditions were tested, with two biological replicates (independent cell cultures) from each: no transfection (N), transfection with mock plasmid (M), and transfection with the plasmid coding for Gag::eGFP protein following the standard protocol previously described (S). Samples of each condition were taken at 72 h post‐transfection (hpt) followed by an ultracentrifugation to purify HIV‐1 Gag VLPs and EVs with the same density. As it is depicted in Figure 1a, three technical replicates were analyzed from each sample. Fold changes were calculated from the average relative abundance value of each glycan species in the three studied conditions, noted as N, M, and S as previously described.
Figure 1.

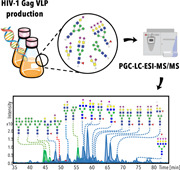
Experimental design and virus‐like particle (VLP) production analysis. (a) Experimental workflow. Two biological replicates of HEK293 cell cultures were grown under three different conditions: no transfected condition, transfected with an empty plasmid denoted as “mock,” and transfected using the standard protocol with the plasmid coding for the translational fusion of HIV‐1 Gag polyprotein and enhanced GFP (Gag::eGFP) polyprotein. Both transfections were performed at the same cell density of 2 × 10⁶ cells/ml. At the time point of 72 h post‐transfection (hpt), cultured samples were taken and centrifuged and supernatants were ultracentrifuged at 31,000 rpm using a 30% sucrose cushion. The resulting pellet was resuspended in 1 ml of phosphate‐buffered saline (PBS). The concentrated sample was subjected to N‐ and O‐glycan release and reduction. Resulted alditols were analyzed by porous grafitized carbon liquid chromatography with electrospray ionization tandem mass spectrometry (PGC‐LC‐ESI‐MS/MS) to assign the glycosylation structures. (b) Concentration via ultracentrifugation measured in relative fluorescence units (RFUs). Harvested VLPs were concentrated 12.2‐fold in the analytical ultracentrifugation step. (c) Extracted ion chromatograms profiles of samples that underwent lysis treatment and samples that contained intact VLPs for glycan analysis (no lysis treatment)
3. RESULTS
3.1. HEK293 VLP production
After transfecting HEK293 cells with PEI:DNA complexes containing the plasmid encoding Gag::eGFP polyprotein, cell cultures were harvested at 72 hpt. The clarified supernatants containing VLPs were then concentrated using analytical ultracentrifugation. The resulting pellet was resuspended in PBS, increasing VLP concentration in 12.2‐fold (Lavado‐García et al., 2021) (Figure 1b). These concentrated VLP samples were used for further glycan analyses.
3.2. Analysis of N‐glycans
To analyze the N‐glycans species present in the Gag VLP membrane, some samples underwent a lysis treatment to disrupt the particles and others maintained the complete structures before N‐glycan release and LC‐MS/MS analysis. These first measurements revealed highly comparable N‐glycan profiles of lysed versus intact particles (Figure 1c). Relative abundance and elution patterns of glycans were maintained, with differences in signal intensity. All identified N‐glycans were observed in both lysed and intact sample conditions. A total of 51 N‐glycan species were identified and 48 quantified. All characteristics and quantitative data relating to these 51 species are presented in Table S1. Overall, 38 glycan species were complex‐type. Of these, 31 were sialylated, 1 contained a sulfate group and 7 presented Lewis epitopes (Figure 2a,b). Lewis epitopes or antigens are fucosylated oligosaccharides derived from Galβ1‐3/4(Fucα1,4/3)GlcNAcβ1‐ structures. The Gal residue can be sialylated, sulfated, also fucosylated or remain unsubstituted. Of the total 51 identified species, seven were high mannose N‐glycans. In these structures, the α(1,3) and α(1,6) arms contained only mannoses whose specific branching pattern was not resolved. Additionally, hybrid N‐glycans were detected, which is a group of glycans with a mannosidic α(1,6) arm and a complex α(1,3) arm containing GlcNAc, Gal, and NeuAc. This group accounted for 6 of the 51 N‐glycans (Figure 2b) and 3 out of these 6 hybrid glycans presented NeuAc as terminal modifications.
Figure 2.

Analysis of N‐glycan species from Gag virus‐like particles (VLPs). (a) Combined extracted ion chromatograms of 51 N‐glycan species released from VLP samples. Structures of the 17 most abundant glycans are depicted. Complex glycans are represented in blue, hybrid glycans represented in red, and oligomannoses or high mannose glycans represented in green. (b) Classification of the different types of N‐glycan species identified in the sample. Glycans with sulfate and Lewis epitopes represent a subdivision within complex glycans. (c) Relative abundance distribution of the 12 most abundant N‐glycan species identified in the VLP sample. Error bars represent standard deviation. The average value of all 51 glycans (1.96) is represented by the dotted line. F, fucose; H, hexose; N, N‐acetylhexosamine; S, N‐acetylneuraminic acid, Su: sulfate
The measured glycans differed greatly in relative abundance. The most abundant glycan, accounting for ∼13% of relative abundance was H5N4F1S1a observed at m/z 1038.89 (charge 2−) which may be represented as Hex2 HexNAc2 Deoxyhexose1 NeuAc1 Man3 GlcNAc2 (Figure 2a–c).
3.3. Analysis of O‐glycans
The O‐glycan profile of VLP sample is exemplified in Figure 1c. A total of nine O‐glycans were identified, from which eight were sialylated, presenting core 1, 2, and 4‐type structures. The only nonsialylated O‐glycan presented core 2‐type structure and one of the lowest abundances (Figure 3a,b). Isobaric O‐glycan structural isomer differentiation was successfully carried out by PCG‐LC separation method coupled with negative ion tandem mass spectrometry (Figure 4). For instance, this method allowed to resolve the position of the sialic acid in the m/z 1040.521 − based on the identification of characteristic diagnostic ions (Figure 4b,c). Within the total of nine identified O‐glycans species, the top two most abundant species accounted for the 76% of relative abundance, being the most abundant the tetrasaccharide H1N1S2 with an observed m/z of 966.4 followed by the hexasaccharide H2N2S2 of m/z 1331.6 (Figure 3c). These two species are common O‐glycosylations found in many human proteins. No significant differences were observed between nontransfected, transfected with mock, and transfected with Gag::eGFP conditions (Figure 3b,c). Similar to N‐glycans, O‐glycan profiles were not influenced by lysis (Figure 1c). All the identified and quantified O‐glycans are presented in Table S2.
Figure 3.

Analysis of O‐glycan species from Gag virus‐like particles (VLPs). (a) Combined extracted ion chromatograms of nine O‐glycan species released from VLP samples in which the top five most abundant glycans account for 94% of relative abundance. (b) Classification of the different types of O‐glycan species identified in the sample. (c) Relative abundance of the nine O‐glycan species identified in the VLP sample. Error bars represent standard deviation. Significance calculated by two‐way analysis of variance. H, hexose; N, N‐acetylhexosamine; S, N‐acetylneuraminic acid; Su, sulfate
Figure 4.

Example of the porous graphitized carbon‐liquid chromatography separation of O‐glycan structural isomers and MS2 analysis. (a) Extracted ion chromatogram (EIC) of the m/z 1040.521 − (Hex2 HexNAc2 NeuAc1) O‐glycan isomers. (b) MS2 spectrum of the m/z 1040.521 − isomer observed at RT 58.1 min. (c) MS2 spectrum of the m/z 1040.521 − isomer observed at RT 66.1 min. Diagnostic ions are denoted in red. H, hexose; N, N‐acetylhexosamine; S, N‐acetylneuraminic acid
3.4. Changes in glycan signature upon transient transfection and Gag VLP production
The most abundant N‐ and O‐glycan species identified in the analyzed samples did not show significant changes in the nontransfected, transfected with mock, and transfected with the plasmid coding for Gag::eGFP studied conditions. When assessing the major glycan compositions, the N‐glycosylation patterns appeared rather similar for the different samples (Figure 2c). Still, some N‐glycans were found to show small, significant differences in relative abundance. One of the four isomers (H7N6F1S4a) of N‐glycan H7N6F1S4 showed elevated levels as indicated by the relative abundance fold change in M and S condition (Figure 5a and Figure S1). This sialylated tetrantennary N‐glycan accounted for ∼0.5% of relative abundance among all N‐glycans in N and M conditions shifted to ∼2%. Isomer H7N6F1S4c showed lower intensities in M and S compared to N condition. A shift was observed in H7N6F1S4c (retention time 78.2 min) from ∼1.0% to ∼0.5% upon transfection. Isomers H7N6F1S4b and H7N6F1S4d hardly differed in all studied conditions. It has been reported that upon recombinant production of human Protein C in HEK293 cells, the structure of H7N6F1S4 glycan shifted from presenting all α(2‐3) linkage to a combination of α(2‐3) and α(2‐6) linkage of sialic acid (Yan et al., 1993). The structural differences of isomers H7N6F1S4a and H7N6F1S4c might also be related to a change in sialic acid linkage combinations. Also, the isomer H3N5F1b showed a significant increase in S and M conditions (Table S1). Moreover, different N‐glycans were observed to have elevated relative abundance only in S condition (Figure 5a and Figure S1). The biantennary glycan H3N5F1a, bearing a bisecting GlcNAc, a β(1,4)GlcNAc attached to the innermost mannose residue, was observed to slightly increase in relative abundance in VLPs, from ∼0.4% to ∼0.7%. Structures presenting a bisecting GlcNAc have been reported to be involved in relevant immunological processes like immune tolerance and immune suppression (Chen et al., 2020). The separation and identification of structural isomers H3N5F1a and H3N5F1b is illustrated in Figure 6. The characteristic diagnostic ions for the bisecting structure (D‐221 ion) and from the nonbisecting isomer (D and D‐18 ions) supported the assignment and identification (Figure 6b,c). Other N‐glycans presenting an increased relative abundance in S condition were three of the identified high mannose N‐glycans; H7N2a, H9N2, and H8N2. High mannose N‐glycans residues have been reported to influence pharmacokinetics of therapeutic molecules like IgGs, reducing their half‐life (Alessandri et al., 2012; Goetze et al., 2011). Interestingly, the other N‐glycan increasing in S condition and therefore in the VLP fraction, was H5N5 (Figure 5a), a glycan found on glycoprotein CD59 (Meri et al., 1996; Rudd et al., 1997). Glycoprotein CD59 is commonly present in HIV‐1 virions preventing the action of the complement cascade and the lysis of the viral particles (Amet et al., 2016). There were also N‐glycan species that decreased upon transfection and VLP production. For instance, the second most abundant N‐glycan, H5N4F1S2 (Figure 5a and Figure S1). Among the N‐glycans that showed lower intensity only upon VLP production, the greatest decrease, 0.3‐fold, was found in H5N5F1S1b, having an α(1,3) sialic acid linkage. The hybrid H7N3F1 glycan also presented a reduction of 0.5‐fold in relative abundance in S condition. As for the O‐glycan species, no significant differences were observed between nontransfected, transfected with mock, and transfected with Gag::eGFP conditions (Figure 5b).
Figure 5.

Relative abundance changes in glycans of produced particles upon transfection and virus‐like particle production. (a) Heatmap illustrating relative abundance and fold change ratios of N‐glycans showing changes in the different studied conditions (left). Replicates are denoted as I, II, III, and IV. (b) Heatmap illustrating relative abundance and fold change ratios of O‐glycans showing changes in the different studied conditions (left). Replicates are denoted as I, II, III, and IV. F, fucose; H, hexose; N, N‐acetylhexosamine; S, N‐acetylneuraminic acid; Su, sulfate
Figure 6.

Example of the porous graphitized carbon‐liquid chromatography separation of N‐glycan structural isomers and MS2 analysis. (a) Extracted ion chromatogram (EIC) of the m/z 832.812 − (Hex3 HexNAc5 Fuc1) N‐glycan isomers. (b) MS2 spectrum of the m/z 832.812 − isomer observed at RT 49.8 min. (c) MS2 spectrum of the m/z 832.812 − isomer observed at RT 59.9 min. Diagnostic ions are denoted in red. F, fucose; GlcNAc, N‐Acetylglucosamine; H, hexose; N, N‐acetylhexosamine
3.5. VLPs present lower glycan density per particle than EVs
Particle concentration and the size distribution curve in each condition were measured by NTA showing a 5.4 times increased concentration of particles in the S condition compared to N and M conditions (Figure 7a). From the total 2.88 × 10¹¹ particles/ml measured in S condition, 82.3% corresponded to fluorescent particles (Gag::eGFP VLPs). The remaining 17.7% corresponded to coproduced EVs. We next aimed at estimating the glycan content per particle. To get an estimate of the glycan amount in each condition, glycan intensity was normalized to the intensity of the internal standard DP7. Then, assuming complete release of glycans and similar response factors between condition and DP7 standard, the number of glycans per particle was estimated (Figure 7b). The condition containing the VLP fraction (S condition) presented a significantly lower glycan density than N and M conditions. Interestingly, M condition also presented a reduction of glycan density compared to N condition (Figure 7b). A reduction from an average of 2400 and 1620 N‐glycan molecules per particle for the N and M condition respectively to 380 for the S condition was assessed. For O‐glycans, it dropped from 6830 to 4300 O‐glycans/particle for the N and M condition respectively to 1150 for the S condition. This is schematically represented in Figure 7c.
Figure 7.

Analysis of diffracting particles. (a) The size distribution curve of diffracting particles in each condition measured by nanoparticle tracking analysis (NTA). The vertical gray line represents 145 nm. N: nontransfected condition, M: condition transfected with mock plasmid, S: condition transfected with plasmid encoding translational fusion of HIV‐1 Gag polyprotein and enhanced GFP (Gag::eGFP) polyprotein, VLPs: virus‐like particles, EVs: extracellular vesicles. (b) Glycan density per particle. The total intensity area of identified glycans in each condition was normalized by their corresponding internal standard DP7 intensity area and divided by the corresponding number of particles in the sample. The number of particles was calculated using the particle concentration value obtained by NTA. Significance was calculated using two‐way analysis of variance. *p < 0.05; **p < 0.01; ***p < 0.001; ****p < 0.0001; ns: non significant. (c) Schematic representation of the glycan density in EVs (left) and Gag VLPs (right). The mean value of the particle diameter measured by NTA is represented within the particle. The represented glycan species in EVs (left) are the most abundant and the ones showing downregulation in S condition. The represented glycans in VLPs (right) are the ones showing an increase in S condition. The values showing the number glycan/particle are the approximate value calculated assuming the same response factor of the standard DP7 with known concentration, used in each condition
4. DISCUSSION
The analysis and characterization of the glycosylation signature of biopharmaceuticals is essential to understand their effect on eliciting the expected immune response. The glycosylation pattern depends exclusively on the cell‐based platform where it has been produced. For human application, it is fundamental to assure that the final bioproduct does not present exogenous and allergenic glycoforms that could neutralize and handicap the envisaged function of the biopharmaceutical. Although some xeno‐glycomotifs can have a desirable effect of boosting the immune response, others can cause allergy reactions (C. Jin et al., 2008). HIV‐1 Gag VLPs conceived as vaccine candidates are commonly produced in insect and plant cells expression systems to obtain higher titers. However, the presence of α1,3‐fucosylations in the core of N‐glycans produced in insect cells or the presence of both allergenic α1,3‐fucosylations and β1,2‐xyloses in N‐glycans produced in plant cells increment the complexity of the bioprocesses using these expression systems. Additional steps to remove these glycoforms are needed as the final purified VLPs cannot contain them for human applications. In this study, the glycosylation profile of Gag VLPs produced in HEK293 cells has been characterized, showing that the displayed glycans presented structures of high mannose, hybrid and mostly complex glycans. For instance, Chikungunya VLPs produced in Sf9 insect cells presented predominantly high mannose structures, (Lancaster et al., 2016) needing to complement the VLPs with adjuvants to achieve the same neutralizing antibody titers as VLPs produced in mammalian cells (Wagner et al., 2014). High mannose structures have been described to produce fewer neutralizing antibody titers than complex glycans (Lin et al., 2013). The lower neutralizing antibody titers generated by high mannose glycans may be explained by the glycan shielding effect that they provide to viral particles. Often, immunogenic surface proteins from viruses like Ebola GP, (Beniac & Timothy, 2017) Influenza HA, (An et al., 2015) HIV‐1 Env glycoprotein (Lee et al., 2016; Seabright et al., 2019; Wei et al., 2003), or SARS‐CoV‐2 S protein (Casalino et al., 2020; Grant et al., 2020) are masked in high mannose structures preventing detection from the immune system. This is one of the main reasons for vaccine strategies to target the surface protein, not considering the glycan shield and leading to low neutralizing titers. Displaying not only high mannose but also hybrid and complex glycans contributes to a stronger immunological response (Lin et al., 2013). Most importantly, VLPs produced in HEK293 cells harbored sialic acid terminations in 63.5% of all identified glycans, between N‐ and O‐glycans. This feature may potentially improve the recognition of VLPs by macrophages and further presentation to antigen‐presenting cells. This opens a potential research line for VLPs in the future, as macrophage recognition is promoted via Siglec‐1 receptor, which selectively binds to α(2,3)‐linked sialic acids, enhancing the immune response (Jobe et al., 2018).
The relative abundance of N‐ and O‐glycans identified in this study has been observed to change upon transfection and VLP production. The changes observed upon transfection correlated with the generation of small EVs (sEVs), previously reported (Lavado‐García, González‐Domínguez, et al., 2020). The increase in the generation of vesicles smaller than 200 nm upon transient transfection in HEK293 cells correlates with the increase of large tetrantennary glycans like H7N6F1S4b. This is hypothesized to be related to the generation of EVs via de multivesicular bodies pathway and release as exosomes. This phenomenon could also be related to the reduction in glycan density in mock‐derived EVs and VLPs. Since sEVs and VLPs are smaller particles, they might deplete the cell of more membrane surface at a higher rate, reducing the cell capacity of replenishing the glycan reservoir. In fact, the VLP specific productivity is 4.5 times higher producing VLPs than in mock condition, from (3.5 ± 0.1) × 103 to (0.8 ± 0.1) × 103 VLP cell−1 day−1 respectively (Lavado‐García et al., 2021). Secreting vesicles at a lower rate might provide more time for glycoproteins to be transported to the membrane. The reduction in vesicle size and increase in production rate of the generated vesicles might account for the reduction in glycan density. More interestingly, the specific changes observed in VLP glycans can shed some light on one of the greatest challenges of Gag‐VLP bioprocess development: the separation of VLPs from the coproduced EVs. This is an essential part of the downstream purification process that is still under research. The usual purification process of VLPs start with clarifying the recovered supernatant to remove cells and debris followed by capture and concentration, typically performed by chromatography. The current capture technologies that are being used for VLPs are anion‐exchange monolith or Capto™‐Heparin columns, yielding from 2% to 13% at elution (Pereira Aguilar et al., 2020; Reiter et al., 2019). These current methods do not efficiently separate VLPs and EVs. The study of VLPs and coproduced EVs glycosylations can contribute to the design of more efficient affinity methods in the future for the downstream processing step of capture, separating both population of nanoparticles. In this study, we have described differences in glycosylation abundance in VLPs and EVs, highlighting the difference in glycoforms of CD59. H5N5 N‐glycans from CD59 significantly increased in VLPs. These changes could open the door to the design of affinity method based on these glycans to chromatographically separate both EV and VLP populations. In addition to this, the glycans that significantly decreased in VLPs, like H5N5F1S1b with α(2,3) sialic acid linkage could be used to create affinity separation methods to allow the flow‐through of VLPs while retaining EVs. Either using affinity resins to capture VLPs for latter elution or retaining EVs while filtering VLPs could provide more efficient solutions for VLP purification. Apart from designing a separation method for downstream processing, knowing the glycosylation signature of Gag VLPs paves the way for glycoengineering strategies to enhance VLP immunogenicity towards the creation of self‐adjuvanted and cell‐specific VLP‐based vaccines. One example is the use of multivalent glycan display for cell‐specific CLR targeting. Specific fungal high mannose or Lewis‐B or Lewis‐X antigens selectively interact with CLR CD209, eliciting a robust CD4+ and CD8+ immune response (Unger et al., 2012). This strategy has proved to achieve immunization using lentiviral nanoparticles (Yang et al., 2008), an approach that could be applied to Gag VLPs in the future.
Moreover, the presence of N‐glycans presenting structures containing a bisecting GlcNAc has been reported to influence immune tolerance, shielding the cells that possessed bisecting GlcNAc structures from the immune system (Link‐Lenczowski et al., 2018; Miwa et al., 2012). In addition to this, bisecting GlcNAc has been reported to suppress further terminal modification such as sialic acid, fucose, or Lewis epitopes. Losing the bisecting GlcNAc made N‐glycans better substrates for many glycosyltransferases, increasing the number of terminal modification (Nakano et al., 2019). Therefore, to increase potential immunogenic terminal modifications and reduce shielding the VLPs from the immune system, a HEK293 N‐acetylglucosaminyltransferase‐III (GnT‐III) knock out production platform could be established. This would provide VLPs rich in potential immunogenic terminal modifications as better vaccine candidates. Another identified feature of the analyzed VLPs is the presence of high mannose N‐glycans. A high concentration of this type of N‐glycan has also been reported to influence immune shielding. One relevant and illustrating example is HIV‐1 Env glycoprotein. This is one of the most heavily glycosylated proteins ever studied, containing almost solely high mannose N‐glycans (Bonomelli et al., 2011; Doores et al., 2010). This high concentration of high mannose glycans offers shielding to HIV‐1 Env glycoprotein from the recognition of antibodies and hamper the immune response. High mannose to complex N‐glycans ratio has also been described to directly influence the stimulation of antibody synthesis and recognition (Raska et al., 2010; Wei et al., 2003). Consequently, to reduce high mannose glycans in the VLP surface, particles can be treated in vitro with α‐mannosidases to hydrolyze terminal mannoses. However, a better option reducing the bioprocess final costs and complexity could be to establish an engineered HEK293 platform overexpressing Golgi α‐mannosidases coded by genes MAN1A1 and MAN1A2. Knocking out these genes has been reported to generate cells with only high mannose surface N‐glycans (Z. C. Jin et al., 2018) and overexpressing them would trim mannoses from uncapped glycans with no terminal modifications, increasing complex species and reducing the high mannose to complex N‐glycans ratio. A different glycoengineering approach to enhance VLP immunogenicity is the expression of the α‐Gal epitope. The trisaccharide structure Gal‐α(1,3)‐Gal‐β(1,4)‐GlcNAc‐R is an epitope found in all nonprimate mammals and absent in humans. The presence of α‐Gal epitope elicits a strong immune response and has been used to boost the elicited immune response of vaccines against Influenza (Abdel‐Motal et al., 2007), HIV‐1 (Abdel‐Motal et al., 2010), and SARS‐CoV‐2 (Galili, 2020). These modulations based on glycoengineering could be implemented towards the development of an improved vaccine platform based on HIV‐1 Gag VLPs.
5. CONCLUSIONS
The characterization of protein glycosylation in biopharmaceuticals is essential for the correct development of further clinical trials to reach human applications. HIV‐1 Gag‐based VLPs are promising candidates for the development of new vaccine therapies. In this study, we have characterized the glycome of VLPs, showing that they present the required complex glycosylations for the envisaged interaction with the immune system of this type of biopharmaceuticals. Moreover, to design an integrated production bioprocess, key protein glycosylations have been identified for purification and separation strategies of VLPs and coproduced EVs. N‐glycans like H5N5 and H5N5F1S1b showed significant differences in VLPs compared to EVs. This could pave the way for affinity‐based separations leading to specific purification methods that would allow the optimization of downstream processing of VLPs.
Supporting information
Supplementary information.
Supplementary information.
Supplementary information.
ACKNOWLEDGMENTS
The authors thank Prof. Amine Kamen (McGill University, Montreal, Canada) for providing the HEK293 SF‐3SF6. The following reagent was obtained through the National Institutes of Health AIDS Reagent Program, Division AIDS, National Institute of Allergy and Infectious Diseases, National Institutes of Health: pGag::eGFP (Cat#11468) from Dr. Merilyn Resh. The support of Dr. Jose Amable Bernabé from the Institute of Material Science of Barcelona (ICMAB‐CSIC, Barcelona, Spain) with particle tracking techniques is greatly appreciated. The authors declare no conflict of interest. The project that gave rise to these results received the support of a fellowship from the “la Caixa” Foundation (ID 100010434). The fellowship code is LCF/BQ/ES17/11600003. European Molecular Biology Organization (EMBO) Short‐Term Fellowship Number 8613 (2020). The research group is recognized as 2017 SGR 898 by Generalitat de Catalunya.
Lavado‐García, J. , Zhang, T. , Cervera, L. , Gòdia, F. , & Wuhrer, M. (2022). Differential N‐ and O‐glycosylation signatures of HIV‐1 Gag virus‐like particles and coproduced extracellular vesicles. Biotechnology and Bioengineering, 119, 1207–1221. 10.1002/bit.28051
DATA AVAILABILITY STATEMENT
The raw mass spectrometry data has been submitted and is available in GlycoPost repository with ID number GPST000169 (https://glycopost.glycosmos.org/entry/GPST000169).
REFERENCES
- Abdel‐Motal, U. M. , Guay, H. M. , Wigglesworth, K. , Welsh, R. M. , & Galili, U. (2007). Immunogenicity of influenza virus vaccine is increased by anti‐gal‐mediated targeting to antigen‐presenting cells. Journal of Virology, 81, 9131–9141. [DOI] [PMC free article] [PubMed] [Google Scholar]
- Abdel‐Motal, U. M. , Wang, S. , Awad, A. , Lu, S. , Wigglesworth, K. , & Galili, U. (2010). Increased immunogenicity of HIV‐1 p24 and gp120 following immunization with gp120/p24 fusion protein vaccine expressing α‐gal epitopes. Vaccine, 28, 1758–1765. [DOI] [PMC free article] [PubMed] [Google Scholar]
- Alessandri, L. , Ouellette, D. , Acquah, A. , Rieser, M. , Leblond, D. , Saltarelli, M. , Radziejewski, C. , Fujimori, T. , & Correia, I. (2012). Increased serum clearance of oligomannose species present on a human IgG1 molecule. mAbs, 4, 509–520. [DOI] [PMC free article] [PubMed] [Google Scholar]
- Amet, T. , Lan, J. , Shepherd, N. , Yang, K. , Byrd, D. , Xing, Y. , & Yu, Q. (2016). Glycosylphosphatidylinositol anchor deficiency attenuates the production of infectious HIV‐1 and renders virions sensitive to complement attack. AIDS Research and Human Retroviruses, 32, 1100–1112. [DOI] [PMC free article] [PubMed] [Google Scholar]
- An, Y. , McCullers, J. A. , Alymova, I. , Parsons, L. M. , & Cipollo, J. F. (2015). Glycosylation analysis of engineered H3N2 influenza A virus hemagglutinins with sequentially added historically relevant glycosylation sites. Journal of Proteome Research, 14, 3957–3969. [DOI] [PubMed] [Google Scholar]
- Ausubel, L. J. , Hall, C. , Sharma, A. , Shakeley, R. , Lopez, P. , Quezada, V. , Couture, S. , Laderman, K. , McMahon, R. , Huang, P. , Hsu, D. , & Couture, L. (2012). Production of CGMP‐grade lentiviral vectors. BioProcess International, 10, 32–43. [PMC free article] [PubMed] [Google Scholar]
- Beniac, D. R. , & Timothy, B. F. (2017). Structure of the Ebola virus glycoprotein spike within the virion envelope at 11 Å resolution. Scientific Reports, 7, 46374. [DOI] [PMC free article] [PubMed] [Google Scholar]
- Bonomelli, C. , Doores, K. J. , Dunlop, D. C. , Thaney, V. , Dwek, R. A. , Burton, D. R. , Crispin, M. , & Scanlan, C. N. (2011). The glycan shield of HIV is predominantly oligomannose independently of production system or viral clade. PLoS One, 6, e23521. [DOI] [PMC free article] [PubMed] [Google Scholar]
- Casalino, L. , Gaieb, Z. , Goldsmith, J. A. , Hjorth, C. K. , Dommer, A. C. , Harbison, A. M. , Fogarty, C. A. , Barros, E. P. , Taylor, B. C. , McLellan, J. S. , Fadda, E. , & Amaro, R. E. (2020). Beyond shielding: The roles of glycans in the SARS‐CoV‐2 spike protein. ACS Central Science, 6(1722–1734), 2020–1734. [DOI] [PMC free article] [PubMed] [Google Scholar]
- Ceroni, A. , Maass, K. , Geyer, H. , Geyer, R. , Dell, A. , & Haslam, S. M. (2008). GlycoWorkbench: A tool for the computer‐assisted annotation of mass spectra of glycans. Journal of Proteome Research, 7, 1650–1659. [DOI] [PubMed] [Google Scholar]
- Cervera, L. , Gòdia, F. , Tarrés‐Freixas, F. , Aguilar‐Gurrieri, C. , Carrillo, J. , Blanco, J. , & Gutiérrez‐Granados, S. (2019). Production of HIV‐1‐based virus‐like particles for vaccination: Achievements and limits. Applied Microbiology and Biotechnology, 103, 7367–7384. [DOI] [PubMed] [Google Scholar]
- Chen, Q. , Tan, Z. , Guan, F. , & Ren, Y. (2020). The essential functions and detection of bisecting GlcNAc in cell biology. Frontiers in Chemistry, 8, 511. [DOI] [PMC free article] [PubMed] [Google Scholar]
- Colgrave, M. L. , Snelling, H. J. , Shiell, B. J. , Feng, Y. R. , Chan, Y. P. , Bossart, K. N. , Xu, K. , Nikolov, D. B. , Broder, C. C. , & Michalski, W. P. (2012). Site occupancy and glycan compositional analysis of two soluble recombinant forms of the attachment glycoprotein of Hendra virus. Glycobiology, 22, 572–584. [DOI] [PMC free article] [PubMed] [Google Scholar]
- Cooper, C. A. , Gasteiger, E. , & Packer, N. H. (2001). GlycoMod—A software tool for determining glycosylation compositions from mass spectrometric data. Proteomics, 1, 340–349. [DOI] [PubMed] [Google Scholar]
- Dhar, C. , Sasmal, A. , & Varki, A. (2019). From ‘serum sickness’ to ‘xenosialitis’: Past, present, and future significance of the non‐human sialic acid Neu5Gc. Frontiers in Immunology, 10, 807. [DOI] [PMC free article] [PubMed] [Google Scholar]
- Doores, K. J. , Bonomelli, C. , Harvey, D. J. , Vasiljevic, S. , Dwek, R. A. , Burton, D. R. , Crispin, M. , & Scanlan, C. N. (2010). Envelope glycans of immunodeficiency virions are almost entirely oligomannose antigens. Proceedings of the National Academy of Sciences of the United States of America, 107, 13800–13805. [DOI] [PMC free article] [PubMed] [Google Scholar]
- Duivelshof, B. L. , Jiskoot, W. , Beck, A. , Veuthey, J. L. , Guillarme, D. , & D′Atri, V. (2019). Glycosylation of biosimilars: Recent advances in analytical characterization and clinical implications. Analytica Chimica Acta, 1089, 1–18. [DOI] [PubMed] [Google Scholar]
- Effio, C. L. , & Hubbuch, J. (2015). Next generation vaccines and vectors: Designing downstream processes for recombinant protein‐based virus‐like particles. Biotechnology Journal, 10, 715–727. [DOI] [PubMed] [Google Scholar]
- Galili, U. (2020). Amplifying immunogenicity of prospective Covid‐19 vaccines by glycoengineering the coronavirus glycan‐shield to present α‐gal epitopes. Vaccine, 38, 6487–6499. [DOI] [PMC free article] [PubMed] [Google Scholar]
- Ghaderi, D. , Taylor, R. E. , Padler‐Karavani, V. , Diaz, S. , & Varki, A. (2010). Implications of the presence of N‐glycolylneuraminic acid in recombinant therapeutic glycoproteins. Nature Biotechnology, 28, 863–867. [DOI] [PMC free article] [PubMed] [Google Scholar]
- Goetze, A. M. , Liu, Y. D. , Zhang, Z. , Shah, B. , Lee, E. , Bondarenko, P. V. , & Flynn, G. C. (2011). High‐mannose glycans on the Fc region of therapeutic IgG antibodies increase serum clearance in humans. Glycobiology, 21, 949–959. [DOI] [PubMed] [Google Scholar]
- Goldblatt, D. (2000). Conjugate vaccines. Clinical and Experimental Immunology, 119, 1–3. [DOI] [PMC free article] [PubMed] [Google Scholar]
- Grant, O. C. , Montgomery, D. , Ito, K. , & Woods, R. J. (2020). Analysis of the SARS‐CoV‐2 spike protein glycan shield reveals implications for immune recognition. Scientific Reports, 10, 14991. [DOI] [PMC free article] [PubMed] [Google Scholar]
- Gupta, S. K. , & Shukla, P. (2018). Glycosylation control technologies for recombinant therapeutic proteins. Applied Microbiology and Biotechnology, 102, 10457–10468. [DOI] [PubMed] [Google Scholar]
- Gutiérrez‐Granados, S. , Cervera, L. , Gòdia, F. , Carrillo, J. , & Segura, M. M. (2013). Development and validation of a quantitation assay for fluorescently tagged HIV‐1 virus‐like particles. Journal of Virological Methods, 193, 85–95. [DOI] [PubMed] [Google Scholar]
- Holst, S. , Belo, A. I. , Giovannetti, E. , Van Die, I. , & Wuhrer, M. (2017). Profiling of different pancreatic cancer cells used as models for metastatic behaviour shows large variation in their N‐glycosylation. Scientific Reports, 7, 16623. [DOI] [PMC free article] [PubMed] [Google Scholar]
- Jensen, P. H. , Karlsson, N. G. , Kolarich, D. , & Packer, N. H. (2012). Structural analysis of N‐ and O‐glycans released from glycoproteins. Nature Protocols, 7, 1299–1310. [DOI] [PubMed] [Google Scholar]
- Jin, C. , Hantusch, B. , Hemmer, W. , Stadlmann, J. , & Altmann, F. (2008). Affinity of IgE and IgG against cross‐reactive carbohydrate determinants on plant and insect glycoproteins. Journal of Allergy and Clinical Immunology, 121, 185–190. [DOI] [PubMed] [Google Scholar]
- Jin, Z. C. , Kitajima, T. , Dong, W. , Huang, Y. F. , Ren, W. W. , Guan, F. , Chiba, Y. , Gao, X. D. , & Fujita, M. (2018). Genetic disruption of multiple 1,2‐mannosidases generates mammalian cells producing recombinant proteins with high‐mannose–type N‐glycans. Journal of Biological Chemistry, 293, 5572–5584. [DOI] [PMC free article] [PubMed] [Google Scholar]
- Jobe, O. , Kim, J. , & Rao, M. (2018). The role of Siglec‐1 in HIV‐1/macrophage interaction. Macrophage, 3. e1435. [PMC free article] [PubMed] [Google Scholar]
- Johannssen, T. , & Lepenies, B. (2017). Glycan‐based cell targeting to modulate immune responses. Trends in Biotechnology, 35, 334–346. [DOI] [PubMed] [Google Scholar]
- Karlsson, N. G. , Schulz, B. L. , & Packer, N. H. (2004). Structural determination of neutral O‐linked oligosaccharide alditols by negative ion LC‐electrospray‐MSn. Journal of the American Society for Mass Spectrometry, 15, 659–672. [DOI] [PubMed] [Google Scholar]
- Karlsson, N. G. , Wilson, N. L. , Wirth, H. J. , Dawes, P. , Joshi, H. , & Packer, N. H. (2004). Negative ion graphitised carbon nano‐liquid chromatography/mass spectrometry increases sensitivity for glycoprotein oligosaccharide analysis. Rapid Communications in Mass Spectrometry, 18, 2282–2292. [DOI] [PubMed] [Google Scholar]
- Lancaster, C. , Pristatsky, P. , Hoang, V. M. , Casimiro, D. R. , Schwartz, R. M. , Rustandi, R. , & Ha, S. (2016). Characterization of N‐glycosylation profiles from mammalian and insect cell derived chikungunya VLP. Journal of Chromatography B: Analytical Technologies in the Biomedical and Life Sciences, 1032, 218–223. [DOI] [PubMed] [Google Scholar]
- Lavado‐García, J. , Cervera, L. , & Gòdia, F. (2020). An alternative perfusion approach for the intensification of virus‐like particle production in HEK293 cultures. Frontiers in Bioengineering and Biotechnology, 8, 617. [DOI] [PMC free article] [PubMed] [Google Scholar]
- Lavado‐García, J. , Díaz‐Maneh, A. , Canal‐Paulí, N. , Pérez‐Rubio, P. , Gòdia, F. , & Cervera, L. (2021). Metabolic engineering of HEK293 cells to improve transient transfection and cell budding of HIV‐1 virus‐like particles. Biotechnology and Bioengineering, 118, 1630–1644. 10.1002/bit.27679 [DOI] [PubMed] [Google Scholar]
- Lavado‐García, J. , González‐Domínguez, I. , Cervera, L. , Jorge, I. , Vázquez, J. , & Gòdia, F. (2020). Molecular characterization of the coproduced extracellular vesicles in HEK293 during virus‐like particle production. Journal of Proteome Research, 19, 4532. [DOI] [PubMed] [Google Scholar]
- Lavado‐García, J. , Jorge, I. , Boix‐Besora, A. , Vázquez, J. , Gòdia, F. , & Cervera, L. (2021). Characterization of HIV‐1 virus‐like particles and determination of Gag stoichiometry for different production platforms. Biotechnology and Bioengineering, 27786, 2660–2675. 10.1002/bit.27786 [DOI] [PubMed] [Google Scholar]
- Lee, J. H. , Ozorowski, G. , & Ward, A. B. (2016). Cryo‐EM structure of a native, fully glycosylated, cleaved HIV‐1 envelope trimer. Science, 351, 1043–1048. [DOI] [PMC free article] [PubMed] [Google Scholar]
- Lepenies, B. , Lee, J. , & Sonkaria, S. (2013). Targeting C‐type lectin receptors with multivalent carbohydrate ligands. Advanced Drug Delivery Reviews, 65, 1271–1281. [DOI] [PubMed] [Google Scholar]
- Lin, S. C. , Jan, J. T. , Dionne, B. , Butler, M. , Huang, M. H. , Wu, C. Y. , Wong, C. H. , & Wu, S. C. (2013). Different immunity elicited by recombinant H5N1 hemagglutinin proteins containing pauci‐mannose, high‐mannose, or complex type N‐glycans. PLoS One, 8, e66719. [DOI] [PMC free article] [PubMed] [Google Scholar]
- Link‐Lenczowski, P. , Bubka, M. , Balog, C. I. A. , Koeleman, C. A. M. , Butters, T. D. , Wuhrer, M. , & Lityńska, A. (2018). The glycomic effect of N‐acetylglucosaminyltransferase III overexpression in metastatic melanoma cells. GnT‐III modifies highly branched N‐glycans. Glycoconjugate Journal, 35, 217–231. [DOI] [PMC free article] [PubMed] [Google Scholar]
- Mastrangeli, R. , Palinsky, W. , & Bierau, H. (2018). Glycoengineered antibodies: Towards the next‐generation of immunotherapeutics. Glycobiology, 29, 199–210. [DOI] [PubMed] [Google Scholar]
- Md, A. , Maeda, M. , Matsui, T. , Takasato, Y. , Ito, K. , & Kimura, Y. (2021). Purification and molecular characterization of a truncated‐type Ara h 1, a major peanut allergen: Oligomer structure, antigenicity, and glycoform. Glycoconjugate Journal, 38, 67–76. [DOI] [PubMed] [Google Scholar]
- Meri, S. , Lehto, T. , Sutton, C. W. , Tyynelä, J. , & Baumann, M. (1996). Structural composition and functional characterization of soluble CD59: Heterogeneity of the oligosaccharide and glycophosphoinositol (GPI) anchor revealed by laser‐desorption mass spectrometric analysis. Biochemical Journal, 316, 923–935. [DOI] [PMC free article] [PubMed] [Google Scholar]
- Miwa, H. E. , Song, Y. , Alvarez, R. , Cummings, R. D. , & Stanley, P. (2012). The bisecting GlcNAc in cell growth control and tumor progression. Glycoconjugate Journal, 29, 609–618. [DOI] [PMC free article] [PubMed] [Google Scholar]
- Nakano, M. , Mishra, S. K. , Tokoro, Y. , Sato, K. , Nakajima, K. , Yamaguchi, Y. , Taniguchi, N. , & Kizuka, Y. (2019). Bisecting GlcNAc is a general suppressor of terminal modification of N‐glycan. Molecular & Cellular Proteomics, 18, 2044–2057. [DOI] [PMC free article] [PubMed] [Google Scholar]
- Pereira Aguilar, P. , et al (2020). Capture and purification of human immunodeficiency virus‐1 virus‐like particles: Convective media vs porous beads. Journal of Chromatography, A, 1627, 461378. [DOI] [PubMed] [Google Scholar]
- Raska, M. , Takahashi, K. , Czernekova, L. , Zachova, K. , Hall, S. , Moldoveanu, Z. , Elliott, M. C. , Wilson, L. , Brown, R. , Jancova, D. , Barnes, S. , Vrbkova, J. , Tomana, M. , Smith, P. D. , Mestecky, J. , Renfrow, M. B. , & Novak, J. (2010). Glycosylation patterns of HIV‐1 gp120 depend on the type of expressing cells and affect antibody recognition. Journal of Biological Chemistry, 285, 20860–20869. [DOI] [PMC free article] [PubMed] [Google Scholar]
- Reiter, K. , Aguilar, P. P. , Wetter, V. , Steppert, P. , Tover, A. , & Jungbauer, A. (2019). Separation of virus‐like particles and extracellular vesicles by flow‐through and heparin affinity chromatography. Journal of Chromatography, A, 1588, 77–84. [DOI] [PubMed] [Google Scholar]
- Roldão, A. , Mellado, M. C. , Castilho, L. R. , Carrondo, M. J. , & Alves, P. M. (2010). Virus‐like particles in vaccine development. Expert Review of Vaccines, 9, 1149–1176. [DOI] [PubMed] [Google Scholar]
- Rudd, P. M. , Morgan, B. P. , Wormald, M. R. , Harvey, D. J. , van den Berg, C. W. , Davis, S. J. , Ferguson, M. A. , & Dwek, R. A. (1997). The glycosylation of the complement regulatory protein, human erythrocyte CD59‐44. Journal of Biological Chemistry, 272, 7229–7244. [DOI] [PubMed] [Google Scholar]
- Schön, K. , Lepenies, B. , & Goyette‐Desjardins, G. (2020). Impact of protein glycosylation on the design of viral vaccines. Advances in Biochemical Engineering/Biotechnology, 175, 319–354. [DOI] [PubMed] [Google Scholar]
- Seabright, G. E. , Doores, K. J. , Burton, D. R. , & Crispin, M. (2019). Protein and glycan mimicry in HIV vaccine design. Journal of Molecular Biology, 431, 2223–2247. [DOI] [PMC free article] [PubMed] [Google Scholar]
- Seifalian, A. , De La Peña, H. , & Seifalian, A. M. (2010). The application of exosomes as a nanoscale cancer vaccine. International Journal of Nanomedicine, 5, 889. [DOI] [PMC free article] [PubMed] [Google Scholar]
- Stavenhagen, K. , Kolarich, D. , & Wuhrer, M. (2014). Clinical glycomics employing graphitized carbon liquid chromatography–mass spectrometry. Chromatographia, 78, 307–320. [DOI] [PMC free article] [PubMed] [Google Scholar]
- Thomsson, K. A. , Bäckström, M. , Holmén Larsson, J. M. , Hansson, G. C. , & Karlsson, H. (2010). Enhanced detection of sialylated and sulfated glycans with negative Ion mode nanoliquid chromatography/mass spectrometry at high pH. Analytical Chemistry, 82, 1470–1477. [DOI] [PubMed] [Google Scholar]
- Tretter, V. , Altmann, F. , Kubelka, V. , März, L. , & Becker, W. M. (1993). Fucose α1,3‐linked to the core region of glycoprotein n‐glycans creates an important epitope for IgE from honeybee venom allergic individuals. International Archives of Allergy and Immunology, 102, 259–266. [DOI] [PubMed] [Google Scholar]
- Unger, W. W. J. , van Beelen, A. J. , Bruijns, S. C. , Joshi, M. , Fehres, C. M. , van Bloois, L. , Verstege, M. I. , Ambrosini, M. , Kalay, H. , Nazmi, K. , Bolscher, J. G. , Hooijberg, E. , de Gruijl, T. D. , Storm, G. , & van Kooyk, Y. (2012). Glycan‐modified liposomes boost CD4+ and CD8+ T‐cell responses by targeting DC‐SIGN on dendritic cells. Journal of Controlled Release, 160, 88–95. [DOI] [PubMed] [Google Scholar]
- Varki, A. (2017). Biological roles of glycans. Glycobiology, 27, 3–49. [DOI] [PMC free article] [PubMed] [Google Scholar]
- Vigerust, D. J. , & Shepherd, V. L. (2007). Virus glycosylation: Role in virulence and immune interactions. Trends in Microbiology, 15, 211–218. [DOI] [PMC free article] [PubMed] [Google Scholar]
- Wagner, J. M. , Pajerowski, J. D. , Daniels, C. L. , McHugh, P. M. , Flynn, J. A. , Balliet, J. W. , Casimiro, D. R. , & Subramanian, S. (2014). Enhanced production of chikungunya virus‐like particles using a high‐pH adapted spodoptera frugiperda insect cell line. PLoS One, 9, e94401. [DOI] [PMC free article] [PubMed] [Google Scholar]
- Watanabe, Y. , Bowden, T. A. , Wilson, I. A. , & Crispin, M. (2019). Exploitation of glycosylation in enveloped virus pathobiology. Biochimica et Biophysica Acta—General Subjects, 1863, 1480–1497. [DOI] [PMC free article] [PubMed] [Google Scholar]
- Wei, X. , Decker, J. M. , Wang, S. , Hui, H. , Kappes, J. C. , Wu, X. , Salazar‐Gonzalez, J. F. , Salazar, M. G. , Kilby, J. M. , Saag, M. S. , Komarova, N. L. , Nowak, M. A. , Hahn, B. H. , Kwong, P. D. , & Shaw, G. M. (2003). Antibody neutralization and escape by HIV‐1. Nature, 422, 307–312. [DOI] [PubMed] [Google Scholar]
- Yan, S. B. , Chao, Y. B. , & Van Halbeek, H. (1993). Novel Asn‐linked oligosaccharides terminating in GaINAcβ(1→4)[fucα(1→3)]GlcNAcβ(1→•) are present in recombinant human protein C expressed in human kidney 293 cells. Glycobiology, 3, 597–608. [DOI] [PubMed] [Google Scholar]
- Yang, L. , Yang, H. , Rideout, K. , Cho, T. , Joo, K. I. , Ziegler, L. , Elliot, A. , Walls, A. , Yu, D. , Baltimore, D. , & Wang, P. (2008). Engineered lentivector targeting of dendritic cells for in vivo immunization. Nature Biotechnology, 26, 326–334. [DOI] [PMC free article] [PubMed] [Google Scholar]
- Yehuda, S. , & Padler‐Karavani, V. (2020). Glycosylated biotherapeutics: Immunological effects of N‐glycolylneuraminic acid. Frontiers in Immunology, 11, 21. [DOI] [PMC free article] [PubMed] [Google Scholar]
- Zhang, T. , Madunić, K. , Holst, S. , Zhang, J. , Jin, C. , Ten Dijke, P. , Karlsson, N. G. , Stavenhagen, K. , & Wuhrer, M. (2020). Development of a 96‐well plate sample preparation method for integrated: N‐ and O‐glycomics using porous graphitized carbon liquid chromatography‐mass spectrometry. Molecular Omics, 16, 355–363. [DOI] [PubMed] [Google Scholar]
Associated Data
This section collects any data citations, data availability statements, or supplementary materials included in this article.
Supplementary Materials
Supplementary information.
Supplementary information.
Supplementary information.
Data Availability Statement
The raw mass spectrometry data has been submitted and is available in GlycoPost repository with ID number GPST000169 (https://glycopost.glycosmos.org/entry/GPST000169).