Abstract
Abrocitinib, an oral once‐daily Janus kinase 1 selective inhibitor, is under development for the treatment of atopic dermatitis. This phase 1, nonrandomized, open‐label, single‐dose study (NCT03660241) investigated the effect of renal impairment on the pharmacokinetics, safety, and tolerability of abrocitinib and its metabolites following a 200‐mg oral dose. Twenty‐three subjects with varying degrees of renal function (normal, moderate, and severe impairment) were enrolled. Active moiety exposures were calculated as the sum of unbound exposures for abrocitinib and its active metabolites. For abrocitinib, the adjusted geometric mean ratios (GMRs; %) for area under the concentration‐time curve from time 0 extrapolated to infinite time and maximum plasma concentration were 182.91 (90% confidence interval [CI], 117.09‐285.71) and 138.49 (90% CI, 93.74‐204.61), respectively, for subjects with moderate renal impairment vs normal renal function; corresponding GMRs were 121.32 (90% CI, 68.32‐215.41) and 99.11 (90% CI, 57.30‐171.43) for subjects with severe impairment vs normal renal function. Metabolite exposures generally increased in subjects with renal impairment. The GMRs of unbound area under the concentration‐time curve from time 0 extrapolated to infinite time and maximum plasma concentration of active moiety were 210.20 (90% CI, 154.60‐285.80) and 133.87 (90% CI, 102.45‐174.92), respectively, for subjects with moderate renal impairment vs normal renal function. Corresponding values were 290.68 (90% CI, 217.39‐388.69) and 129.49 (90% CI, 92.86‐180.57) for subjects with severe renal impairment vs normal renal function. Abrocitinib was generally safe and well tolerated. Both moderate and severe renal impairment led to higher exposure to abrocitinib active moiety, suggesting that abrocitinib dose should be reduced by half for patients with moderate or severe renal impairment.
ClinicalTrials.gov identifier: NCT03660241
Keywords: abrocitinib, active moiety, atopic dermatitis, pharmacokinetics, renal impairment
Atopic dermatitis is a chronic, relapsing, inflammatory, skin disease with symptoms that include intense itch, dry skin, and skin pain; it has a prevalence worldwide of 2% to 7% in adults and 15% to 30% in children in Western countries. 1 , 2 , 3 , 4 Patients with moderate to severe disease who do not respond to topical treatments have limited treatment options, including systemic immunosuppressive agents and targeted therapy with dupilumab, an interleukin‐4 alpha receptor. Although treatment with dupilumab is effective and generally well tolerated, not all patients respond well to treatment 5 ; in addition, dupilumab is associated with conjunctivitis 6 and facial rash 7 , 8 , 9 , 10 , 11 , 12 and must be delivered via subcutaneous injection.
Abrocitinib is a small‐molecule Janus kinase 1 (JAK1) selective inhibitor under clinical investigation for the treatment of patients with moderate to severe atopic dermatitis. The efficacy and safety of once‐daily abrocitinib (100 mg or 200 mg) in this population have been demonstrated in 3 phase 3 studies (NCT03349060 [JADE MONO‐1], NCT03575871 [JADE MONO‐2], and NCT03720470 [JADE COMPARE]). 13 , 14 , 15
The human radiolabeled absorption, distribution, metabolism, and excretion study following intravenous and oral administration of abrocitinib showed that abrocitinib was the most abundant circulating species (26%), followed by 3 more polar oxidative metabolites: PF‐06471658 (3‐hydroxypropyl [M1], 11%), PF‐07055087 (2‐hydroxypropyl [M2], 12%), and PF‐07054874 (pyrrolidinone pyrimidine [M4], 14%) (data on file). The abrocitinib metabolites M1 and M2 were active and displayed JAK1 selectivity profiles similar to that of abrocitinib, whereas M4 was pharmacologically inactive (data on file).
Abrocitinib is eliminated primarily via hepatic metabolism with minimal renal excretion. 16 , 17 The cytochrome P450 (CYP) enzymes involved in the metabolism of abrocitinib are CYP2C19, CYP2C9, CYP3A4, and CYP2B6, with approximate fraction metabolized (fm) values of 0.53, 0.30, 0.11, and 0.07, respectively. 16 Both CYP2C19 and CYP2C9 are responsible for the formation of active metabolites, M1 and M2, with additional smaller contributions from CYP3A4 and CYP2B6 to the formation of M1. The abrocitinib metabolites M1, M2, and M4 are eliminated predominantly by renal excretion and are also substrates of organic anion transporter 3 (data on file).
A recent study has shown that hepatic impairment had no clinically relevant effect on the pharmacokinetics (PK) and safety of abrocitinib and its active moiety (comprising abrocitinib, M1, and M2), suggesting that abrocitinib can be used without dose adjustment in patients with hepatic impairment. 18 Given that the major circulating metabolites of abrocitinib are predominately eliminated by renal excretion, the disposition of metabolites in subjects with renal impairment may therefore be different from that observed in healthy subjects. Furthermore, even if compounds are not excreted renally, renal impairment can inhibit pathways of hepatic and gut metabolism and transport. 19 , 20 , 21 Thus, regulatory agencies generally expect sponsors to evaluate the effect of renal impairment on the PK of small‐molecule investigational drugs. 22 , 23 The European Medicines Agency guidelines recommend a renal impairment study for nearly all small molecules, even if the small molecule or its active metabolites are not primarily eliminated by the kidneys. 22 The US Food and Drug Administration recommends renal impairment studies for any drug that may be used by patients with renal impairment, 23 and it is expected that some patients with renal impairment will receive abrocitnib to treat moderate to severe atopic dermatitis.
The objective of this single‐dose, open‐label study (NCT03660241) was to assess whether the PK of abrocitinib, its 3 major circulating metabolites, and abrocitinib active moiety are impacted by renal impairment. Findings from this study will be used to develop abrocitinib dosing recommendations for patients with renal impairment.
Methods
This study was conducted at 2 centers in the United States: University of Miami Division of Clinical Pharmacology, Miami, Florida/University of Miami Sylvester Comprehensive Cancer Center, Miami, Florida, and Orlando Clinical Research Center, Orlando, Florida. The trial protocol and informed consent documentation were reviewed and approved by the institutional review boards at both participating centers. This study was conducted in compliance with the ethical principles originating in or derived from the Declaration of Helsinki and in compliance with all International Council for Harmonisation Good Clinical Practice Guidelines. All local regulatory requirements were followed. A signed and dated informed consent was required before any study‐specific activity was performed.
Study Design
This was a phase 1, nonrandomized, open‐label, single‐dose, parallel‐cohort study. Estimated glomerular filtration rate (eGFR) values, calculated by the Modification of Diet in Renal Disease equation below, 24 were used to assign subjects into 3 groups (normal, moderately impaired, or severely impaired renal function):
Subjects with an eGFR of ≥90 mL/min were enrolled in the normal renal function group, and subjects with an eGFR of ≥30 to <60 mL/min were enrolled in the moderate renal impairment group. Subjects enrolled in the severe renal impairment group had an eGFR of <30 mL/min but did not require dialysis.
The study followed a staged approach in which subjects with severe renal impairment were recruited first, followed by healthy subjects (part 1); healthy subjects were recruited such that each subject's age was within ±10 years and weight was within ±15 kg of the mean of the pooled severe renal impairment group. After it was confirmed that severe renal impairment resulted in a ≥2‐fold increase in the exposure of active moiety (ie, unadjusted geometric mean area under the concentration‐time curve [AUC] from time 0 to time of last quantifiable concentration [AUClast,u] ratio from part 1 was 2.8‐fold higher in subjects with severe renal impairment compared with healthy subjects), subjects with moderate renal impairment were recruited (part 2). The study would have concluded if the criterion from part 1 of the study was not met. The 2‐fold exposure criteria were chosen on the basis of the results of a phase 2 study in which total daily abrocitinib doses of ≤400 mg were safe and well tolerated. 25 Thus, a <2‐fold increase in unbound abrocitinib active moiety AUC was not considered clinically significant.
Subjects received a single 200‐mg dose of abrocitinib within 28 days of screening, following an overnight fast of ≥10 hours. The 200‐mg dose was chosen because it is the highest dose evaluated in the phase 3 abrocitinib atopic dermatitis clinical program. 13 , 14 , 15 In a phase 1 study, single oral doses of abrocitinib as high as 800 mg were found to be safe and well tolerated. 17 Based on these data and prior clinical experience, a single dose of 200 mg is not likely to pose undue safety risks.
Safety assessments included evaluation of treatment‐emergent adverse events (AEs), clinical laboratory tests, vital signs, physical examination, and 12‐lead electrocardiograms. Subjects experiencing clinically significant abnormal laboratory test results and/or ongoing AEs were followed up via telephone or onsite visit 28 to 35 days after abrocitinib administration.
Subjects
Eligible subjects were aged 18 to 75 years at screening and had a body mass index of ≥17.5 to ≤40.0 kg/m2 and a total body weight of >50 kg (110 lb). Key exclusion criteria were a previous renal transplant, urinary incontinence without catheterization, or clinically significant infections within the past 3 months. Subjects with clinically significant infections within the past 3 months (eg, those requiring hospitalization or as judged by the investigator) or a history of disseminated herpes simplex infection or recurrent (>1 episode) or disseminated herpes zoster were not eligible. Additional exclusions include the use of potent, moderate, and select weak CYP2C19 or CYP2C9 inhibitors or inducers within 14 days or 5 half‐lives (whichever was longer) before day 1; immunosuppressive agents; herbal supplements, hormonal methods of contraception, and hormone replacement therapy <28 days before the first dose of abrocitinib; or prescription or nonprescription drugs and dietary supplements within 7 days or 5 half‐lives (whichever was longer) before day 1.
For subjects with renal impairment, stable concomitant medications and nonprescription medications were permitted only following approval by the sponsor if they were considered necessary for the welfare of the study subjects, not contraindicated with abrocitinib, and unlikely to interfere with the PK of abrocitinib.
Pharmacokinetic Sample Collection and Analysis
Blood samples (10 mL) to provide ≈5 mL of plasma were collected at 0, 0.5, 1, 2, 3, 4, 6, 8, 10, 12, 24, 36, 48, and 72 hours after dosing. Plasma samples were stored at –80°C until analysis and assayed for abrocitinib and the 3 metabolites (M1, M2, and M4) at Syneos Health (Princeton, New Jersey) using 3 separate, validated, sensitive, and specific high‐performance liquid chromatography–tandem mass spectrometry (HPLC‐MS/MS) bioanalytical methods. 18
Briefly, abrocitinib and its stable labeled internal standard PF‐06651703 were extracted from human plasma using a liquid‐liquid extraction procedure. 18 The samples were analyzed by HPLC‐MS/MS using positive electrospray ionization mode. The calibration range of the method was 1.00 ng/mL to 2000 ng/mL, and the quality control (QC) concentrations were 3.00 ng/mL, 60 ng/mL, 1000 ng/mL, 1600 ng/mL, and 5000 ng/mL. The interday assay accuracy ranged from −2.33% to 0.625%, and the between‐day precision was ≤5.79%.
M1, M2, and M4 and their respective internal standards (PF‐07222472, PF‐07222473, and PF‐07222475) were extracted from human plasma using a protein precipitation extraction procedure. 18 The samples were analyzed by HPLC‐MS/MS using the positive electrospray ionization mode for M1 and M4 and using a positive atmospheric pressure chemical ionization mode for M2. The calibration range of the method for M1 and M4 was 1.00 ng/mL to 1000 ng/mL, and the QC concentrations were 3.00 ng/mL, 50 ng/mL, and 750 ng/mL. The interday assay accuracy ranged from –0.400% to 6.80% for M1 and from –1.60% to 4.40% for M4. The between‐day assay precision was ≤7.19% for M1 and ≤5.75% for M4. The calibration range of the method for M2 was 5.00 ng/mL to 5000 ng/mL, and the QC concentrations were 15.0 ng/mL, 75 ng/mL, 250 ng/mL, and 3750 ng/mL. The interday assay accuracy for M2 ranged from –0.667% to –7.73%, and the between‐day assay precision was ≤6.90%.
Pharmacokinetic Data Analysis
PK parameters were calculated using standard noncompartmental analysis using an internally validated software system (eNCA, version 2.2.4). PK parameters calculated for abrocitinib and the 3 metabolites included AUC from time 0 extrapolated to infinite time (AUCinf), AUC from time 0 to time of last quantifiable concentration (AUClast), maximum plasma concentration (Cmax), time to maximum plasma concentration (tmax), and terminal half‐life (t1/2). In addition, apparent oral clearance (CL/F) and apparent volume of distribution (Vz/F) were calculated for abrocitinib, and the metabolite to abrocitinib ratio for AUCinf (MRAUCinf) was calculated for M1, M2, and M4. Unbound AUCinf, AUClast, and Cmax (AUCinf,u, AUClast,u, and Cmax,u) for the active moiety were calculated using the equation below as described in a previous study. 18
where AUC,u,AM is the unbound AUC (AUCinf or AUClast) of the active moiety; AUCu,P, AUCu,M1, and AUCu,M2 are the unbound AUC of abrocitinib, M1, and M2, respectively. IC50,u is the unbound half maximal inhibitory concentration determined from in vitro whole blood inhibition potency of IFNα signaling. The IC50,u, P, IC50,u,M1 and IC50,u,M2 values were 59, 165, and 51 nM for abrocitinib, M1, and M2, respectively (data on file). The plasma unbound fraction for abrocitinib, M1, and M2 were 0.36, 0.63, and 0.71, respectively (data on file). These in vitro values were generated using methods as previously described. 26
Statistical Analysis
The effect of renal impairment on PK parameters (AUCinf, AUClast, and Cmax) was assessed using a 1‐way analysis of variance on natural log transformed data by constructing a 90% confidence interval (CI) around the estimated difference between the test (subjects with moderate or severe renal impairment) and the reference (subjects with normal renal function) groups. Analysis of variance was performed on the exposure parameters for abrocitinib, its metabolites, and the active moiety. Estimates of the adjusted mean differences and corresponding 90% CIs were obtained from the model, and these were exponentiated to calculate the ratio of adjusted geometric means (test/reference) and 90% CIs for the ratios.
Linear regression analysis was used to characterize the relationship between appropriate PK parameters (CL/F and/or AUCinf and AUClast) and renal function (eGFR) for abrocitinib; metabolites M1, M2, and M4; and the active moiety. Estimates of the slope and intercept, together with their precision (90% CI), and the coefficient of determination were obtained from the model. Statistical calculations were performed using SAS version 9.4 or above (SAS Institute Inc., Cary, North Carolina).
Results
Twenty‐three subjects were enrolled into 1 of 3 groups based on renal function. There were 8 subjects each in the normal renal function and severe renal impairment groups, and 7 in the moderate renal impairment group. Baseline characteristics and demographics were generally balanced across the 3 renal function groups (Table 1). No subject discontinued the study or was excluded from the analyses.
Table 1.
Demographics and Baseline Characteristics of Study Subjects
| Normal Renal Function, N = 8 | Moderate Renal Impairment, N = 7 | Severe Renal Impairment, N = 8 | |
|---|---|---|---|
| Age, y, mean (SD) | 59.8 (4.7) | 65.7 (8.3) | 61.0 (14.5) |
| Sex, n (%) | |||
| Male | 6 (75.0) | 3 (42.9) | 7 (87.5) |
| Female | 2 (25.0) | 4 (57.1) | 1 (12.5) |
| Race, n (%) | |||
| White | 6 (75.0) | 6 (85.7) | 7 (87.5) |
| Black or African American | 1 (12.5) | 1 (14.3) | 1 (12.5) |
| Multiracial | 1 (12.5) | 0 | 0 |
| Weight (kg) | |||
| Mean (SD) | 86.1 (6.6) | 82.2 (11.6) | 79.4 (16.5) |
| Range (minimum, maximum) | (77.9, 93.7) | (66.8, 97.0) | (54.4, 100.4) |
| Body mass index (kg/m2) | |||
| Mean (SD) | 28.4 (2.1) | 30.3 (5.7) | 27.7 (5.3) |
| Range (minimum, maximum) | (25.1, 32.2) | (24.4, 39.6) | (20.3, 36.7) |
| eGFR (mL/min), mean (SD) | 112. 4 (21.3) | 43.4 (9.4) | 15.6 (8.4) |
eGFR, estimated glomerular filtration rate, calculated using the Modification of Diet in Renal Disease equation; SD, standard deviation.
After a single oral dose of abrocitinib 200 mg in subjects with normal renal function or renal impairment, the median tmax of abrocitinib was observed at 1 to 2 hours after dosing. Subjects with moderate renal impairment showed higher exposure compared with subjects with normal renal function or severe renal impairment (Figure 1A, Figure 2A, and Table 2A). The mean Cmax of abrocitinib increased by 38% in subjects with moderate renal impairment, whereas the values were similar between subjects with severe renal impairment and normal renal function (Table 2B). The mean AUCinf increased by 83% and 21% in subjects with moderate and severe renal impairment, respectively (Table 2B). Both CL/F and Vz/F were lower in subjects with moderate or severe renal impairment compared with subjects with normal renal function. Mean t1/2 was generally similar across all 3 groups, ranging from 4.5 to 4.9 hours.
Figure 1.
Mean (± standard deviation) plasma concentration‐time profiles for abrocitinib (A), PF‐06471658 (M1) (B), PF‐07055087 (M2) (C), and PF‐07054874 (M4) (D) in subjects with normal renal function, moderate renal impairment, or severe renal impairment following a single 200‐mg oral dose of abrocitinib (semilog scale).
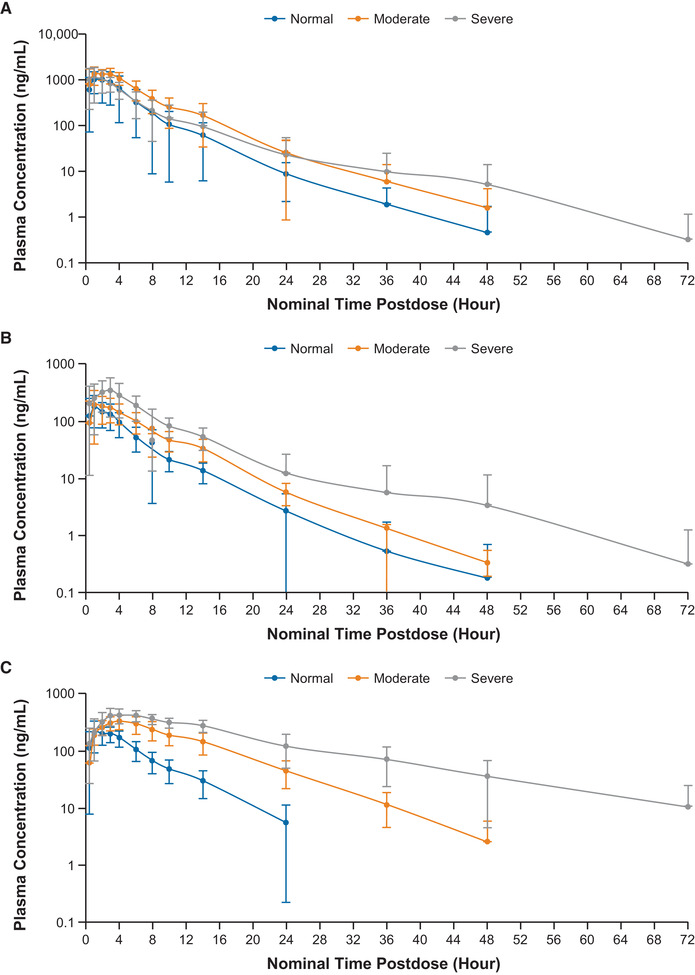
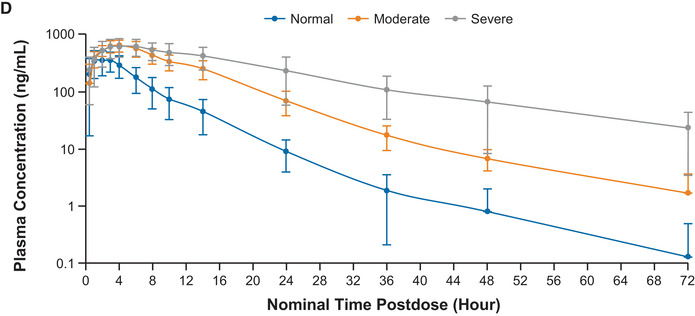
Figure 2.
Scatter plots of individual (open circles) and geometric mean (horizontal lines) AUCinf and Cmax values for abrocitinib (A), M1 (B), M2 (C), M4 (D), and abrocitinib active moiety (E) in subjects with normal renal function, moderate renal impairment, or severe renal impairment. AUCinf, area under the concentration‐time curve from time 0 extrapolated to infinite time; Cmax, maximum plasma concentration.
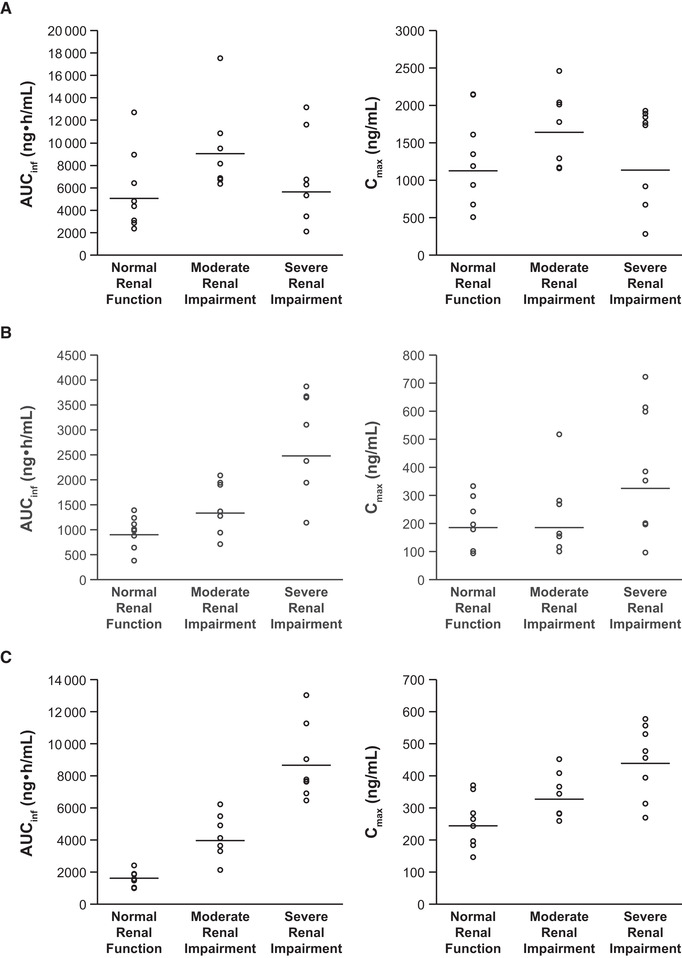
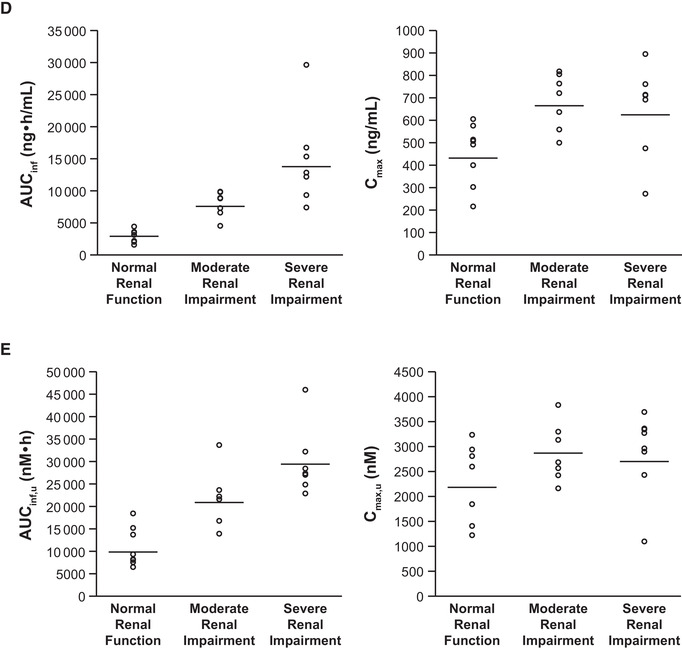
Table 2.
(A) Descriptive and (B) Statistical Summaries of Plasma Abrocitinib Pharmacokinetic Parameters in Subjects With Normal Renal Function or Renal Impairment Following a Single 200‐mg Oral Dose of Abrocitinib
| (A) Pharmacokinetic Parameter Summary | |||
|---|---|---|---|
| Parameter, Unita | Normal Renal Function, N = 8 | Moderate Renal Impairment, N = 7 | Severe Renal Impairment, N = 8 |
| AUCinf, ng • h/mL | 4827 (65) | 8828 (37) | 5855 (73)b |
| AUClast, ng • h/mL | 4808 (65) | 8799 (37) | 5533 (69) |
| Cmax, ng/mL | 1174 (56) | 1626 (31) | 1164 (80) |
| tmax, h | 1.00 (0.50–3.00) | 2.00 (0.50–3.00) | 1.00 (0.50–3.00) |
| CL/F, L/h | 41.4 (65) | 22.7 (37) | 34.2 (73)b |
| t1/2, h | 4.9 ± 2.3 | 4.7 ± 1.6 | 4.5 ± 4.0b |
| Vz/F, L | 270.1 (105) | 147.7 (40) | 157.5 (65)b |
| Adjusted Geometric Means | ||||
|---|---|---|---|---|
| (B) Statistical Comparison | Test | Reference | Ratio (Test/Reference) of Adjusted Geometric Meansc | 90% CI for Ratioc |
| Moderate Renal Impairment (Test) Versus Normal Renal Function (Reference) | ||||
| AUCinf, ng • h/mL | 8828.0 | 4826.6 | 182.91 | (117.09‐285.71) |
| AUClast, ng • h/mL | 8798.8 | 4808.2 | 183.00 | (116.90‐286.46) |
| Cmax, ng/mL | 1626.1 | 1174.2 | 138.49 | (93.74‐204.61) |
| Severe Renal Impairment (Test) Versus Normal Renal Function (Reference) | ||||
| AUCinf, ng • h/mL | 5855.5 | 4826.6 | 121.32 | (68.32‐215.41) |
| AUClast, ng • h/mL | 5532.6 | 4808.2 | 115.07 | (67.27‐196.82) |
| Cmax, ng/mL | 1163.7 | 1174.2 | 99.11 | (57.30‐171.43) |
AUCinf, area under the concentration‐time curve (AUC) from time 0 extrapolated to infinite time; AUClast, AUC from time 0 to time of last quantifiable concentration; Cmax, maximum plasma concentration; CI, confidence interval; CL/F, apparent oral clearance; t1/2, terminal elimination half‐life; tmax, time to Cmax; Vz/F, apparent volume of distribution.
N = total number of subjects in the treatment group in the indicated population.
aGeometric mean (geometric % coefficient of variation) for all except median (range) for tmax, arithmetic mean ± standard deviation for t1/2.
bN = 7.
cThe ratios (and 90% CI) are expressed as percentages.
Results of linear regression analysis of the relationship between CL/F and renal function, estimated using eGFR, found no apparent correlation (Figure 3). Similarly, there was no apparent relationship between AUCinf and eGFR (Figure 4A).
Figure 3.
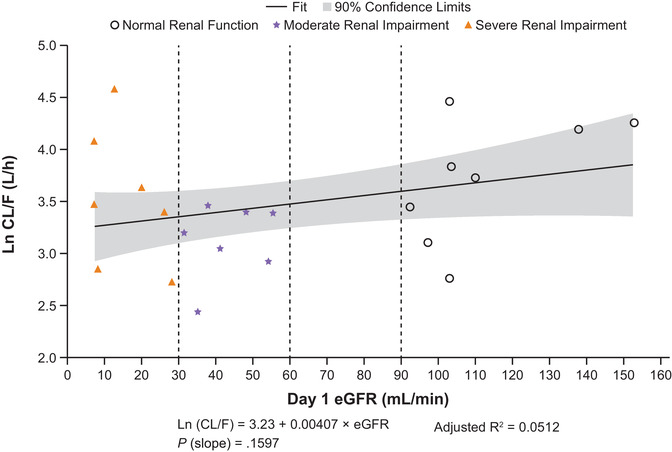
Linear regression plots of ln CL/F vs eGFR for abrocitinib. AUCinf, area under the concentration‐time curve from time 0 extrapolated to infinite time; CL/F, apparent oral clearance; eGFR, estimated glomerular filtration rate; ln, natural log.
Figure 4.
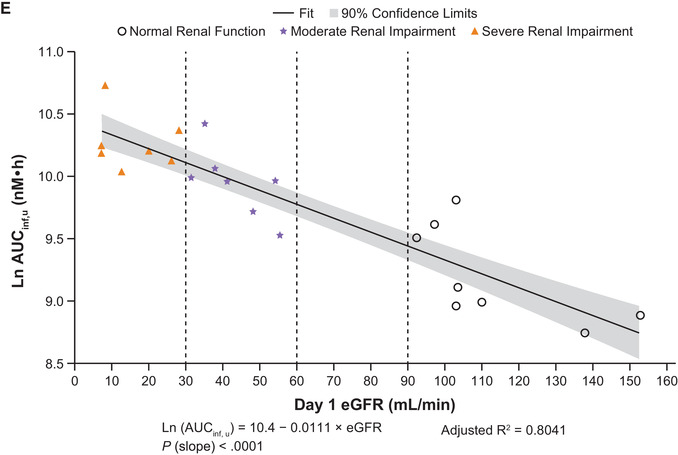
Linear regression plots of ln AUCinf vs eGFR for abrocitinib (A), M1 (B), M2 (C), M4 (D), and abrocitinib active moiety (E). AUCinf, area under the concentration‐time curve from time 0 extrapolated to infinite time; eGFR, estimated glomerular filtration rate; ln, natural log.
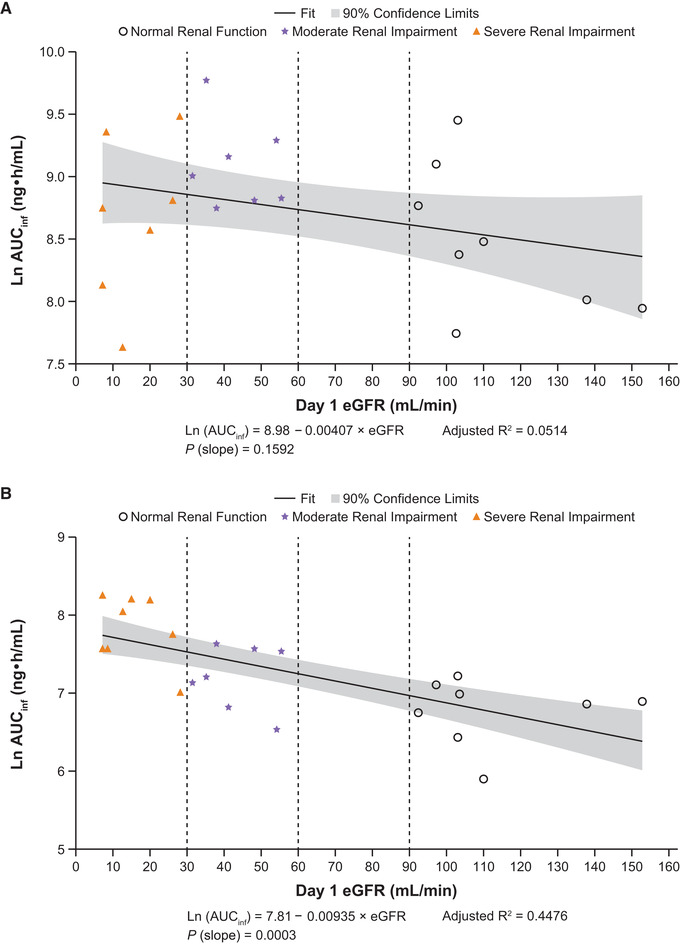
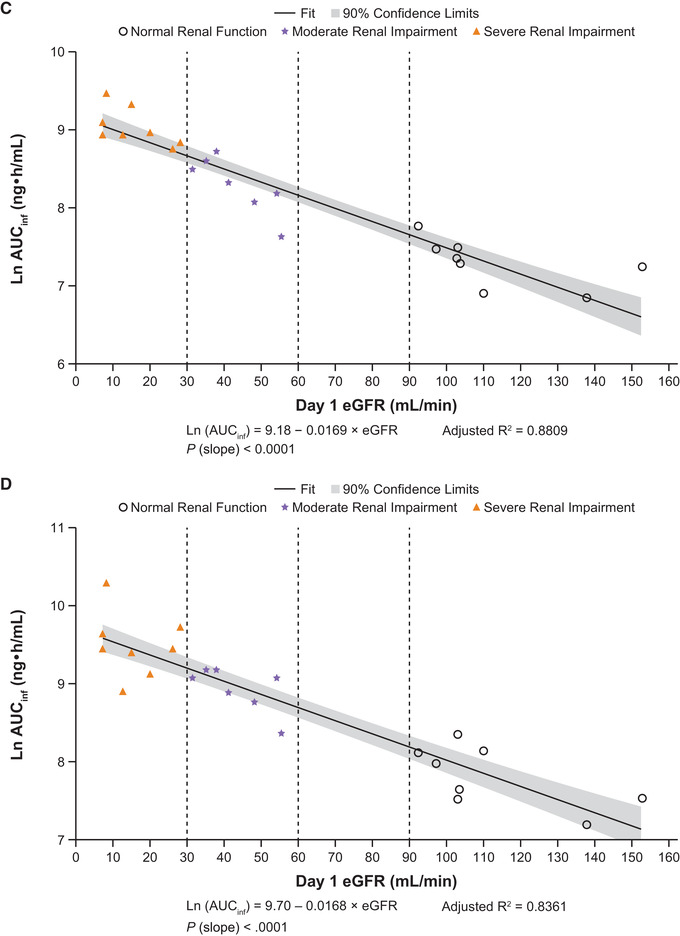
Following a single dose of abrocitinib 200 mg, plasma concentrations of M1, M2, and M4 increased with increasing severity of renal impairment (Figure 1B‐D). The AUCinf, AUClast, and Cmax for M1, M2, and M4 in subjects with moderate or severe renal impairment were generally higher compared with subjects with normal renal function (Figure 2B‐D; Table 3A and B). Peak plasma concentrations for M1, M2, and M4 were achieved with median tmax of 1.00 to 4.00 hours across the 3 groups. For all 3 metabolites, t1/2 increased with increasing severity of renal impairment. Linear regression analysis of AUCinf vs renal function for the 3 metabolites showed a trend of increasing AUCinf with decreasing eGFR (Figure 4B‐D).
Table 3.
(A) Descriptive and (B) Statistical Summaries of Plasma M1 (PF‐06471658), M2 (PF‐07055087), and M4 (PF‐07054874) Pharmacokinetic Parameters in Subjects With Normal Renal Function or Renal Impairment Following a Single 200‐mg Oral Dose of Abrocitinib
| (A) Pharmacokinetic Parameter Summary | |||
|---|---|---|---|
| Parameter, Unita | Normal Renal Function, N = 8 | Moderate Renal Impairment, N = 7 | Severe Renal Impairment, N = 8 |
| AUCinf, ng • h/mL | |||
| M1 | 872.6 (44) | 1346 (43) | 2505 (45) |
| M2 | 1476 (31) | 3981 (38) | 8433 (25) |
| M4 | 2450 (41) | 7543 (30) | 13280 (44) |
| AUClast, ng • h/mL | |||
| M1 | 854.7 (45) | 1330 (44) | 2481 (47) |
| M2 | 1394 (32) | 3894 (39) | 8115 (23) |
| M4 | 2420 (42) | 7474 (30) | 12700 (44) |
| Cmax, ng/mL | |||
| M1 | 193.7 (54) | 192.8 (65) | 325.0 (81) |
| M2 | 241.3 (34) | 331.6 (21) | 429.3 (28) |
| M4 | 427.4 (37) | 671.5 (19) | 616.7 (40) |
| tmax, h | |||
| M1 | 1.00 (0.50‐3.00) | 2.00 (1.00‐3.00) | 1.50 (1.00‐6.00) |
| M2 | 2.00 (1.00‐3.00) | 4.00 (2.00‐6.00) | 4.00 (2.00‐8.00) |
| M4 | 1.50 (0.50‐3.00) | 4.00 (2.00‐6.00) | 3.50 (2.00‐8.00) |
| t1/2, h | |||
| M1 | 4.7 ± 2.3 | 5.9 ± 2.4 | 6.4 ± 2.9 |
| M2 | 4.9 ± 3.0 | 6.7 ± 1.2 | 13.0 ± 5.1 |
| M4 | 7.9 ± 6.2 | 12.5 ± 8.1 | 15.6 ± 4.4 |
| MRAUCinf | |||
| M1 | 0.17 (101) | 0.15 (77) | 0.39 (138)b |
| M2 | 0.29 (63) | 0.43 (45) | 1.32 (72)b |
| M4 | 0.48 (35) | 0.82 (36) | 2.19 (40)b |
| Adjusted (Least‐Squares) Geometric Means | ||||
|---|---|---|---|---|
| (B) Statistical Comparison | Test | Reference | Ratio (Test/Reference) of Adjusted Geometric Meansc | 90% CI for Ratioc |
| Moderate Renal Impairment (Test) Versus Normal Renal Function (Reference) | ||||
| AUCinf, ng • h/mL | ||||
| M1 | 1345.8 | 872.7 | 154.22 | (105.11‐226.26) |
| M2 | 3981.2 | 1475.7 | 269.78 | (196.61‐370.18) |
| M4 | 7543.0 | 2449.9 | 307.89 | (224.18‐422.86) |
| AUClast, ng • h/mL | ||||
| M1 | 1329.6 | 854.7 | 155.56 | (105.45‐229.49) |
| M2 | 3893.6 | 1393.8 | 279.36 | (202.56‐385.29) |
| M4 | 7474.0 | 2420.1 | 308.83 | (223.94‐425.91) |
| Cmax, ng/mL | ||||
| M1 | 192.8 | 193.7 | 99.51 | (59.80‐165.57) |
| M2 | 331.6 | 241.3 | 137.43 | (106.82‐176.81) |
| M4 | 671.5 | 427.4 | 157.13 | (120.95‐204.13) |
| Severe Renal Impairment (Test) Versus Normal Renal Function (Reference) | ||||
| AUCinf, ng • h/mL | ||||
| M1 | 2505.0 | 872.7 | 287.06 | (196.72‐418.89) |
| M2 | 8432.5 | 1475.7 | 571.43 | (447.27‐730.05) |
| M4 | 13278.7 | 2449.9 | 542.01 | (378.71‐775.73) |
| AUClast, ng • h/mL | ||||
| M1 | 2481.3 | 854.7 | 290.30 | (197.65‐426.38) |
| M2 | 8114.5 | 1393.8 | 582.21 | (455.77‐743.73) |
| M4 | 12702.5 | 2420.1 | 524.88 | (365.23‐754.31) |
| Cmax, ng/mL | ||||
| M1 | 325.0 | 193.7 | 167.79 | (97.20‐289.64) |
| M2 | 429.3 | 241.3 | 177.92 | (135.91‐232.92) |
| M4 | 616.7 | 427.4 | 144.29 | (104.21‐199.80) |
AUCinf, area under the concentration‐time curve (AUC) from time 0 extrapolated to infinite time; AUClast, AUC from time 0 to time of last quantifiable concentration; Cmax, maximum plasma concentration; CI, confidence interval; MRAUCinf, metabolite/abrocitinib ratio based on AUCinf; t1/2, terminal elimination half‐life; tmax, time to Cmax.
N = total number of subjects in the treatment group.
aGeometric mean (geometric % coefficient of variation) for all except median (range) for tmax and arithmetic mean ± standard deviation for t1/2.
bN = 7.
cThe ratios (and 90% CI) are expressed as percentages.
Plasma concentrations of all metabolites were generally lower than the abrocitinib concentration for subjects with normal renal function. For subjects with moderate or severe renal impairment, plasma concentrations of the M2 and M4 metabolites were higher than the abrocitinib concentration and correlated with severity of renal impairment (Figure S1A‐C). Except for the MRAUCinf for M1 in subjects with moderate renal impairment, the MRAUCinf was higher for all 3 metabolites in subjects with renal impairment compared with healthy subjects (Table 3A).
After a single dose of abrocitinib 200 mg, the active moiety unbound exposures were higher in subjects with moderate or severe renal impairment compared with subjects with normal renal function (Figure 2E and Table 4A). Mean Cmax,u increased by 34% and 29% and mean AUCinf,u increased by 110% and 191% in subjects with moderate or severe renal impairment, respectively (Table 4B). Linear regression analysis of AUCinf,u vs renal function showed a clear trend of increasing AUCinf,u with decreasing eGFR (Figure 4E).
Table 4.
(A) Descriptive and (B) Statistical Summaries of Plasma Abrocitinib Active Moiety Unbound Pharmacokinetic Parameters in Subjects With Normal Renal Function or Renal Impairment Following a Single 200‐mg Oral Dose of Abrocitinib
| (A) Pharmacokinetic Parameter Summary | |||
|---|---|---|---|
| Parameter, Unita | Normal Renal Function, N = 8 | Moderate Renal Impairment, N = 7 | Severe Renal Impairment, N = 8 |
| AUCinf,u, nM • h | 9955 (40) | 20920 (28) | 28940 (23) |
| AUClast,u, nM • h | 9710 (41) | 20680 (28) | 28670 (22) |
| Cmax,u, nM | 2099 (38) | 2810 (20) | 2718 (41)b |
| Adjusted (Least‐Squares) Geometric Means | ||||
|---|---|---|---|---|
| (B) Statistical Comparison | Test | Reference | Ratio (Test/Reference) of Adjusted Geometric Meansc | 90% CI for Ratioc |
| Moderate Renal Impairment (Test) Versus Normal Renal Function (Reference) | ||||
| AUCinf,u, nM • h | 20924.7 | 9954.8 | 210.20 | (154.60‐285.80) |
| AUClast,u, nM • h | 20682.9 | 9709.6 | 213.02 | (155.80‐291.24) |
| Cmax,u, nM | 2810.3 | 2099.3 | 133.87 | (102.45‐174.92) |
| Severe Renal Impairment (Test) Versus Normal Renal Function (Reference) | ||||
| AUCinf,u, nM • h | 28937.0 | 9954.8 | 290.68 | (217.39‐388.69) |
| AUClast,u, nM • h | 28675.0 | 9709.6 | 295.33 | (221.42‐393.90) |
| Cmax,u, nM | 2718.4 | 2099.3 | 129.49 | (92.86‐180.57) |
AUCinf,u, unbound area under the concentration‐time curve (AUC) from time 0 extrapolated to infinite time (AUCinf); AUClast,u, unbound AUC from time 0 to time of last quantifiable concentration; Cmax,u, unbound maximum plasma concentration; t1/2, terminal elimination half‐life; tmax, time to maximum plasma concentration.
N = total number of subjects in the treatment group in the indicated population.
aGeometric mean (geometric % coefficient of variation) for all.
bN = 7.
cThe ratios (and 90% CI) are expressed as percentages.
No deaths, serious AEs, severe AEs, or discontinuations from the study due to AEs were reported. One AE was reported in the normal renal function group (toothache), and 3 AEs were reported in the moderate renal impairment group (nausea, toothache, and headache). All 3 AEs in the moderate renal impairment group were reported in 1 subject, 2 of which were considered treatment related (nausea and headache). No treatment‐related AEs were reported in subjects with normal renal function or severe renal impairment. No individual laboratory abnormalities, vital signs, physical examination, or electrocardiogram findings were considered to be clinically significant by the investigators.
Discussion
This open‐label study evaluated the effect of renal impairment on the PK, safety, and tolerability of abrocitinib, and the PK of abrocitinib metabolites and abrocitinib active moiety, following a single 200‐mg oral dose of abrocitinib. Both moderate and severe renal impairment generally led to higher exposure of abrocitinib active moiety, abrocitinib metabolites, and to a lesser extent abrocitinib exposure.
Approximately 1% of unchanged abrocitinib is excreted via the kidneys following oral administration (data on file); however, there was up to an 83% increase in abrocitinib exposure in subjects with moderate or severe renal impairment compared with normal renal function. This increase in abrocitinib exposure is likely due to uremic toxins resulting from renal impairment reducing the CYP‐mediated metabolism of abrocitinib 20 , 21 because these subjects did not have significant hepatic disease, illustrating the complexity of interplay between renal impairment and hepatic function. In general, the ranges of AUCinf and Cmax values observed in subjects with severe renal impairment and normal renal function were similar, whereas the values seen in subjects with moderate renal impairment were somewhat higher. This may be due to the small sample size and larger variability (geometric % coefficient of variation) in the subjects with severe renal impairment (73%‐80%) and normal renal function (56%‐65%) compared to subjects with moderate renal impairment (31%‐37%). In effect, within each renal impairment group, there may be differences in hepatic dysfunction, contributing to greater variability in exposures.
After a single dose of abrocitinib 200 mg, the plasma exposures and t1/2 of all 3 metabolites generally increased with increasing severity of renal impairment. Consistent with these results, linear regression analysis of AUCinf vs renal function also showed a clear relationship between AUCinf and eGFR. Compared with subjects with normal renal function, the AUCinf of the metabolites in subjects with moderate and severe renal impairment, respectively, were 1.5‐fold and 2.9‐fold higher for M1, 2.7‐fold and 5.7‐fold higher for M2, and 3.1‐fold and 5.4‐fold higher for M4. For all 3 metabolites, the increases in Cmax were smaller (≤1.8‐fold) in subjects with renal impairment. These results are not unexpected given that metabolites M1, M2, and M4 are eliminated predominantly by renal excretion.
To illustrate the importance of renal clearance of each metabolite, estimates of fractional renal clearance (CLrfm) were calculated for subjects with severe renal impairment from the observed adjusted geometric mean AUCinf ratios derived from subjects with severe renal impairment and normal renal function using methodology typically used to assess drug‐drug interactions. 27 In this case, renal impairment is considered analogous to an extrinsic drug maximally inhibiting renal clearance of the metabolites of abrocitinib. Therefore, CLrfm for each metabolite can be derived from the respective AUC ratios comparing severe renal impairment and normal renal function subjects (AUCinf ratio = 1/[1 − CLrfm]). The calculated CLrfm for M1, M2, and M4 were 0.65, 0.82, and 0.82, respectively (data on file). Furthermore, considering if subjects with severe renal impairment had residual kidney function, these initial CLrfm values can be adjusted upward by 14% (15.6/112.4) based on the respective mean eGFR values in subjects with normal renal function (112.4 mL/min) and severe renal impairment (15.6 mL/min). The results indicate high fractional renal clearance for each metabolite with values of 0.74, 0.94, and 0.93 for M1, M2, and M4, respectively (data on file). These analyses particularly confirm the importance of renal clearance for the active metabolites M1 and M2 of abrocitinib and the need to consider patient renal function with abrocitinib use.
Similar to the results observed with the 3 metabolites, renal impairment impacted the exposures of abrocitinib active moiety, albeit to a lesser extent than that observed for M1, M2, and M4. More importantly, dose adjustment considerations are based on changes in abrocitinib active moiety. Moderate and severe renal impairment resulted in a ≤34% increase in geometric mean Cmax,u of active moiety and an increase of 110% and 191% in the geometric mean AUCinf,u values in subjects with moderate and severe renal impairment, respectively.
The in vitro JAK1 inhibitory profiles of the active metabolites M1 and M2 have been shown to be similar to abrocitinib (data on file). Therefore, the summation of the unbound exposures of abrocitinib, M1, and M2 contributes to the total pharmacologic activity of abrocitinib. Consequently, the abrocitinib active moiety is the clinically relevant parameter for assessing efficacy and safety of abrocitinib as well as in guiding dosing recommendations. In the calculation of active moiety exposure, the relative potency of interferon‐α signaling inhibition was used as a representative of overall inhibition of JAK1 heterodimer signaling (ie, via JAK1/JAK2, JAK1/JAK3, and JAK1/TYK2 pairs) as previously described. 18
Population PK/pharmacodynamic analysis has shown that the average exposure of abrocitinib was able to describe the time course of Eczema Area and Severity Index scores and predict the percentage of subjects who achieved coprimary end points in abrocitinib clinical trials: ≥75% improvement on the Eczema Area and Severity Index 28 and an Investigator's Global Assessment response of 0 or 1 at week 12 (data on file). These analyses indicate that the exposure of abrocitinib is the clinically relevant parameter in predicting efficacy and safety end points. However, with abrocitinib use without comedication, it is expected that both abrocitinib and abrocitinib active moiety will provide similar assessments considering the formation rate limited kinetics of the active metabolites. More importantly, for the impact of intrinsic factors (eg, renal impairment) and extrinsic factors (eg, drug‐drug interactions) on the use of abrocitinib, abrocitinib active moiety exposure is the proper way to assess the efficacy, safety, and need for abrocitinib dose adjustment.
Although subjects with mild renal impairment were not evaluated in this study, the potential effect of mild renal impairment on abrocitinib exposure is not expected, given the effect seen in subjects with moderate or severe renal impairment. Because abrocitinib active moiety exposure is the most relevant pharmacological species for efficacy, the potential effect of mild renal impairment on abrocitinib active moiety exposure was assessed by interpolation, via linear regression analysis of the AUCinf,u vs renal function. Based on the observed relationship between AUCinf,u and eGFR, abrocitinib active moiety AUCinf,u is expected to increase by 69.6% in subjects with mild renal impairment at the lowest eGFR of 60 mL/min. In the abrocitinib clinical development program, there were 756 patients with mild renal impairment (data on file). In these patients, while the exposure was predicted to be about 70% higher, the safety profile and efficacy results were similar to patients with normal renal function. This indicates that increases in active moiety exposures up to 70% are not clinically significant, defining the upper bound of the therapeutic window for abrocitinib exposures in patients with atopic dermatitis.
The observed increases of 110% and 191% in abrocitinib active moiety AUCinf,u are considered clinically relevant; therefore, the dose of abrocitinib is recommended to be reduced by half in patients with moderate or severe renal impairment. No dose adjustment is required in patients with mild renal impairment, as the predicted increase of ≈70% in AUCinf,u is not considered clinically relevant. The use of abrocitinib has not been studied in patients with end‐stage renal disease undergoing hemodialysis.
Although the exposures of metabolites M1, M2, and M4 and abrocitinib active moiety were higher in subjects with moderate or severe renal impairment, in this study, single doses of abrocitinib 200 mg were generally well tolerated in subjects across all renal function groups. No serious or severe AEs and no laboratory abnormalities were considered clinically significant in any renal function group. There was no obvious difference in the AE profiles for subjects with normal renal function vs moderate or severe renal impairment.
Conclusions
The PK results of abroticinib active moiety observed in this study in combination with the safety and efficacy results from the clinical program in patients with mild renal impairment provided the basis of dose recommendation in patients with varying degrees of renal impairment. The recommended dose of abrocitinib is reduced by half to 100 or 50 mg once daily in patients with moderate or severe impairment for 200‐ or 100‐mg once‐daily original doses, respectively. No dose adjustment is required in patients with mild renal impairment.
Conflicts of Interest
E.Q.W., V.L., J.A.W., S.T., S.R., L.W., and B.K.M. are employees and shareholders of Pfizer Inc.
Funding
This study was sponsored by Pfizer Inc.
Data‐Sharing Statement
Upon request, and subject to certain criteria, conditions, and exceptions (see https://www.pfizer.com/science/clinical‐trials/trial‐data‐and‐results for more information), Pfizer will provide access to individual deidentified participant data from Pfizer‐sponsored global interventional clinical studies conducted for medicines, vaccines, and medical devices (1) for indications that have been approved in the United States and/or European Union or (2) in programs that have been terminated (ie, development for all indications has been discontinued). Pfizer will also consider requests for the protocol, data dictionary, and statistical analysis plan. Data may be requested from Pfizer trials 24 months after study completion. The deidentified participant data will be made available to researchers whose proposals meet the research criteria and other conditions, and for which an exception does not apply, via a secure portal. To gain access, data requestors must enter into a data access agreement with Pfizer.
Supporting information
Supporting information.
Acknowledgments
Medical writing support under the guidance of the authors was provided by Irene Park, PhD, and Mariana Ovnic, PhD, at ApotheCom, San Francisco, California, and was funded by Pfizer Inc., New York, New York, in accordance with Good Publication Practice guidelines (Ann Intern Med. 2015;163:461‐464).
References
- 1. Boguniewicz M, Fonacier L, Guttman‐Yassky E, Ong PY, Silverberg J, Farrar JR. Atopic dermatitis yardstick: practical recommendations for an evolving therapeutic landscape. Ann Allergy Asthma Immunol. 2018;120(1):10‐22 e2. [DOI] [PubMed] [Google Scholar]
- 2. Newton L, DeLozier AM, Griffiths PC, et al. Exploring content and psychometric validity of newly developed assessment tools for itch and skin pain in atopic dermatitis. J Patient Rep Outcomes. 2019;3(1):42. [DOI] [PMC free article] [PubMed] [Google Scholar]
- 3. Silverberg JI, Gelfand JM, Margolis DJ, et al. Pain is a common and burdensome symptom of atopic dermatitis in United States adults. J Allergy Clin Immunol Pract. 2019;7(8):2699‐706.e7. [DOI] [PubMed] [Google Scholar]
- 4. Vakharia PP, Chopra R, Sacotte R, et al. Burden of skin pain in atopic dermatitis. Ann Allergy Asthma Immunol. 2017;119(6):548‐552 e3. [DOI] [PMC free article] [PubMed] [Google Scholar]
- 5. Hendricks AJ, Lio PA, Shi VY. Management recommendations for dupilumab partial and non‐durable responders in atopic dermatitis. Am J Clin Dermatol. 2019;20(4):565‐569. [DOI] [PubMed] [Google Scholar]
- 6. Ferreira S, Torres T. Conjunctivitis in patients with atopic dermatitis treated with dupilumab. Drugs Context. 2020;9:2020‐2‐3. [DOI] [PMC free article] [PubMed] [Google Scholar]
- 7. de Beer FSA, Bakker DS, Haeck I, et al. Dupilumab facial redness: positive effect of itraconazole. JAAD Case Rep. 2019;5(10):888‐891. [DOI] [PMC free article] [PubMed] [Google Scholar]
- 8. de Wijs LEM, Nguyen NT, Kunkeler ACM, Nijsten T, Damman J, Hijnen DJ. Clinical and histopathological characterization of paradoxical head and neck erythema in patients with atopic dermatitis treated with dupilumab: a case series. Br J Dermatol. 2020;183(4):745‐749. [DOI] [PMC free article] [PubMed] [Google Scholar]
- 9. Heibel HD, Hendricks AJ, Foshee JP, Shi VY. Rosacea associated with dupilumab therapy. J Dermatolog Treat. 2021:32(1):114‐116. [DOI] [PubMed] [Google Scholar]
- 10. Muzumdar S, Zubkov M, Waldman R, DeWane ME, Wu R, Grant‐Kels JM. Characterizing dupilumab facial redness in children and adolescents: a single‐institution retrospective chart review. J Am Acad Dermatol. 2020;83(5):1520‐1521. [DOI] [PubMed] [Google Scholar]
- 11. Seok SH, An JH, Shin JU, et al. Facial redness in atopic dermatitis patients treated with dupilumab: a case series. Allergy Asthma Immunol Res. 2020;12(6):1063‐1065. [DOI] [PMC free article] [PubMed] [Google Scholar]
- 12. Waldman RA, DeWane ME, Sloan B, Grant‐Kels JM. Characterizing dupilumab facial redness: a multi‐institution retrospective medical record review. J Am Acad Dermatol. 2020;82(1):230‐232. [DOI] [PubMed] [Google Scholar]
- 13. Silverberg JI, Simpson EL, Thyssen JP, et al. Efficacy and safety of abrocitinib in patients with moderate‐to‐severe atopic dermatitis: a randomized clinical trial. JAMA Dermatol. 2020;156(8):863‐873. [DOI] [PMC free article] [PubMed] [Google Scholar]
- 14. Simpson EL, Sinclair R, Forman S, et al. Efficacy and safety of abrocitinib in adults and adolescents with moderate‐to‐severe atopic dermatitis (JADE MONO‐1): a multicentre, double‐blind, randomised, placebo‐controlled, phase 3 trial. Lancet. 2020;396(10246):255‐266. [DOI] [PubMed] [Google Scholar]
- 15. Bieber T, Simpson EL, Silverberg JI, et al. Abrocitinib versus placebo or dupilumab for atopic dermatitis. N Engl J Med. 2021;384(12):1101‐1112. [DOI] [PubMed] [Google Scholar]
- 16. Dowty M, Yang X, Lin J, et al. The effect of CYP2C9 and CYP2C19 genotype on the pharmacokinetics of PF‐04965842, a JAK1 inhibitor in clinical development. Presented at: 12th International Society for the Study of Xenobiotics (ISSX) Meeting; July 28‐31, 2019; Portland, OR. [Google Scholar]
- 17. Peeva E, Hodge MR, Kieras E, et al. Evaluation of a Janus kinase 1 inhibitor, PF‐04965842, in healthy subjects: a phase 1, randomized, placebo‐controlled, dose‐escalation study. Br J Clin Pharmacol. 2018;84(8):1776‐1788. [DOI] [PMC free article] [PubMed] [Google Scholar]
- 18. Wang EQ, Le V, O'Gorman M, et al. Effects of hepatic impairment on the pharmacokinetics of abrocitinib and its metabolites. J Clin Pharmacol. 2021;61(10):1311‐1323. [DOI] [PMC free article] [PubMed] [Google Scholar]
- 19. Leblond F, Guévin C, Demers C, Pellerin I, Gascon‐Barré M, Pichette V. Downregulation of hepatic cytochrome P450 in chronic renal failure. J Am Soc Nephrol. 2001;12(2):326‐332. [DOI] [PubMed] [Google Scholar]
- 20. Leblond FA, Petrucci M, Dube P, Bernier G, Bonnardeaux A, Pichette V. Downregulation of intestinal cytochrome p450 in chronic renal failure. J Am Soc Nephrol. 2002;13(6):1579‐1585. [DOI] [PubMed] [Google Scholar]
- 21. Dreisbach AW, Lertora JJ. The effect of chronic renal failure on drug metabolism and transport. Expert Opin Drug Metab Toxicol. 2008;4(8):1065‐1074. [DOI] [PMC free article] [PubMed] [Google Scholar]
- 22. European Medicines Agency . Guideline on the evaluation of the pharmacokinetics of medicinal products in patients with decreased renal function. https://www.ema.europa.eu/en/documents/scientific-guideline/guideline-evaluation-pharmacokinetics-medicinal-products-patients-decreased-renal-function_en.pdf. Published December 17, 2015. Accessed April 19, 2021.
- 23. Huang SM, Temple R, Xiao S, Zhang L, Lesko LJ. When to conduct a renal impairment study during drug development: US Food and Drug Administration perspective. Clin Pharmacol Ther. 2009;86(5):475‐479. [DOI] [PubMed] [Google Scholar]
- 24. Levey AS, Coresh J, Greene T, et al. Using standardized serum creatinine values in the modification of diet in renal disease study equation for estimating glomerular filtration rate. Ann Int Med. 2006;145(4):247‐254. [DOI] [PubMed] [Google Scholar]
- 25. Schmieder GJ, Draelos ZD, Pariser DM, et al. Efficacy and safety of the Janus kinase 1 inhibitor PF‐04965842 in patients with moderate‐to‐severe psoriasis: phase II, randomized, double‐blind, placebo‐controlled study. Br J Dermatol. 2018;179(1):54‐62. [DOI] [PubMed] [Google Scholar]
- 26. Dowty ME, Lin TH, Jesson MI, et al. Janus kinase inhibitors for the treatment of rheumatoid arthritis demonstrate similar profiles of in vitro cytokine receptor inhibition. Pharmacol Res Perspect. 2019;7(6):e00537. [DOI] [PMC free article] [PubMed] [Google Scholar]
- 27. Di L, Feng B, Goosen TC, et al. A perspective on the prediction of drug pharmacokinetics and disposition in drug research and development. Drug Metab Dispos. 2013;41(12):1975‐1993. [DOI] [PubMed] [Google Scholar]
- 28. Fostvedt L, Wojciechowski J, Malhotra BK, et al. Zero‐inflated beta regression exposure‐response modeling of the Eczema Area and Severity Index score for patients taking abrocitinib. Presented at: American Conference on Pharmacometrics – Virtual; October 4‐7, 2020.
Associated Data
This section collects any data citations, data availability statements, or supplementary materials included in this article.
Supplementary Materials
Supporting information.


