

Abstract
Cardiac glycosides digoxin and digitoxin are used in therapy for the treatment of congestive heart failure. Moreover, these compounds can be responsible for intoxication cases caused by fortuitous ingestion of leaves of Digitalis. Due to the narrow therapeutic range of these drugs, therapeutic drug monitoring is recommended in the clinical practice. In this context, immunoassays‐based methods are generally employed but digoxin‐ and digitoxin‐like compounds can interfere with the analysis. The aim of this study was to develop and validate an original UPLC–MS/MS method for the determination of digoxin and digitoxin in plasma. The method shows adequate sensitivity and selectivity with acceptable matrix effects and very good linearity, accuracy, precision, and recovery. A simple liquid–liquid extraction procedure was used for sample clean‐up. The method was applied for the analysis of n = 220 plasma samples collected in two different clinical chemistry laboratories and previously tested by the same immunoassay. The statistical comparison showed a relevant negative bias of the UPLC–MS/MS method versus the immunoassay. These results are consistent with an immunoassay overestimation of digoxin plasmatic levels due to cross‐reaction events with endogenous digoxin‐like substances.
Keywords: Digoxin, Digitoxin, Immunoassay, LC‐MS/MS
Abbreviations
- CI
confidence interval
- DIG
digoxin
- DIT
digitoxin
- IA
immunoassay
- IS
internal standard
- ME
matrix effect
- MRM
multiple reaction monitoring
1. Introduction
Cardiac glycosides from Digitalis are a class of molecules which, since the 18th century, are in use to increase cardiac contractile force in patients with congestive heart failure and to control atrial fibrillation [1]. They exert their effects on myocardial tissue by inhibiting the Na+/K+–ATPase pump within the plasma membrane of cardiac myocytes, leading to excess intracellular Na+, which indirectly leads to an increase in calcium ions stored in the sarcoplasmic reticulum. As a consequence, the cardiac contractility is enhanced.
The Digitalis glycosides of pharmacological interest are mainly represented by digoxin and digitoxin, which present a similar pharmacodynamics but differ in their pharmacokinetics.
According to the World Health Organization's list of essential medicines, digoxin is a vital drug in the healthcare system, but its high potency and the narrow therapeutic range represent a major obstacle for its safe use in clinical practice. Indeed, the recommended therapeutic plasma concentrations are in the range of 0.5–2.0 ng/mL and more recently, some retrospective studies have proposed to prudentially set this range to 0.5–0.9 ng/mL [2]. Thus, small alterations in digoxin plasma concentration could lead to decreased therapeutic effect or, on the other hand, potentially serious toxicity, including fatal arrhythmias. Therapeutic plasma concentrations of digitoxin in adults are generally 10–30 ng/mL [3]. Higher plasma concentrations are generally associated with toxicity.
Although digitoxin is no longer used for the treatment of congestive heart failure, it has been responsible for intoxication cases caused by fortuitous ingestion of leaves of Digitalis lanata or Digitalis purpurea. In many cases, glycoside ingestion was due to erroneous identification of leaves, not always easily distinguishable from those of other edible plants [4, 5]. Moreover, recent studies have highlighted a possible role of digoxin and digitoxin in the treatment of Covid‐19 or cancer [6, 7, 8, 9].
On these grounds, accurately monitoring the concentrations of digoxin and digitoxin in biofluids and tissues is still of utmost importance in both clinical practice and research. Immunoassays have widely been employed for this purpose [10], but, as in other contexts, they lack high specificity toward the biologically active glycosides (i.e., digoxin or digitoxin) and show cross‐reactions with inactive metabolites and other molecules with similar structure [11, 12, 13, 14].
Because of the low drug concentrations to be accurately and precisely measured (subnanogram per milliliter for digoxin) and the thermal instability of these molecules, the only suitable alternative to immunoassay is modern HPLC‐MS/MS. Although this analytical approach has already been reported by a few authors for the determination of digoxin and, even more rarely, digitoxin [15, 16, 17, 18, 19, 20], specific studies on the comparison between immunoassays and LC‐MS/MS are still extremely rare and based only on a small number of samples.
Thus, the purpose of the present work was to develop and validate an UHPLC–MS/MS method meeting the needs of the clinical determination of digoxin and digitoxin in plasma samples. The overall objective of this study was to compare the results obtained with the newly developed UHPLC–MS/MS method and immunoassay on a large set of clinical samples.
2. Materials and methods
2.1. Standards and reagents
Standard solutions of digoxin and digitoxin at a concentration of 1.0 mg/mL in methanol were purchased from Cerilliant (Round Rock, TX, USA). Digoxin‐D3, used as internal standard (IS), was purchased from LGC standard (Milan, Italy). A stock solution was obtained by diluting the powder in methanol to a final concentration of 1 mg/mL.
All stocks were stored at –20°C. Methyl tert‐butyl ether and ammonium formate were purchased from Sigma‐Aldrich (Steinheim, Germany). Acetonitrile (for HPLC) was purchased from VWR Chemicals (Fontenay‐Sous‐Bois, France). Formic acid 98% for LC‐MS were obtained from Merck KgaA (Darmstadt, Germany). Ultrapure water was obtained by a water purification system model PureLab Chorus 1 Complete (Elga Veolia, High Wycombe, UK).
2.2. Biological samples
The validation experiments were carried out on blank plasma collected from healthy drug‐free volunteers and stored frozen at –20°C. Blood samples were collected in lithium‐heparin tubes and centrifuged at 4500 rpm for 10 min to obtain plasma. The validation experiments were conducted on 220 plasma samples collected from subjects undergoing therapeutic monitoring of digoxin at the University Hospital of Verona and at the Unit of Clinical Pathology‐AUSL Romagna.
All samples had been previously tested with a routine immunoassay (Elecsys, Roche Diagnostics GmbH, Mannheim, Germany). The manufacturer declared a limit of quantification of 0.4 ng/mL.
Patient plasma samples were kept at –20°C prior to analysis and analyzed within 2 weeks.
2.3. Extraction procedure
A simple liquid–liquid extraction procedure (according to Li et al. [19]) was used for its rapidity and convenience and for these reasons preferred to the SPE procedures. Briefly, plasma sample (200 μL) was transferred in a polypropylene tube, added with 1 mL of methyl tert‐butyl ether and with 10 μL of digoxin‐D3 solution to a final concentration of 10 ng/mL. The mixture was vortex‐mixed for 2 min and then centrifuged at 13000 rpm for 15 min in a Microfuge Lite centrifuge (Beckman Coulter, CA, USA). The supernatant was collected and transferred into glass tubes where it was evaporated under nitrogen stream at room temperature. Finally, the samples were re‐suspended in 100 μL of mobile phase A/B (70:30) before the injection into the chromatographic system.
2.4. UPLC–MS/MS
Separations were performed by using a model I‐Class UHPLC (Waters, Milford, MA, USA) provided with an Acquity UHPLC BEH C18 (2.1 × 50 mm, 1.7 μm) analytical column thermostatted at a temperature of 50°C.
Mobile phase A was composed of water containing 5 mM ammonium formate and formic acid 0.01%, while mobile phase B consisted of acetonitrile containing 0.1% of formic acid. The injected samples were eluted with a linear gradient from 30 to 60% of solvent B lasting 5 min. The column was then washed with 90% of phase B and then the starting conditions were restored in 1 min and kept for 2 min to allow system re‐equilibration. The flow rate was set at 0.4 mL/min. An injection volume of 2 μL was used in all experiments. Under the above‐described conditions, digoxin was eluted in 3 min and digitoxin at 5.5 min.
The liquid chromatograph was coupled with a model 6500 triple quadrupole mass spectrometer equipped with an IonDrive Turbo V ion source (both from AB Sciex, Framingham, MA, USA). The instrument was operated in the positive‐ion mode with the following optimized voltages: ion spray, 3000 V; source temperature: 350°C; curtain gas (nitrogen): 30 L/; gas 1 and gas (air): 60 and 70 L/h, respectively.
The analyses were performed in multiple reaction monitoring (MRM) mode using the following ion transitions: digoxin: 798.6 → 651.6, 391.1, 243.3; digitoxin: 782.7 → 635.5, 375.5, 243.2; and digoxin‐D3: 801.6 → 243.0.
Data acquisition and data handling were performed with the Analyst software (ver.1.4.2) (AB Sciex).
2.5. Method validation
The method was validated according to the guidelines of the International Conference on Harmonization (ICH) [21] in terms of selectivity, linearity, sensitivity (LOD and LOQ), intra‐ and interday precision, accuracy (bias), matrix effect (ME), recovery, and robustness.
Selectivity was assessed by testing 20 different human plasma collected from healthy volunteers in order to exclude possible interferences at the retention times of the studied analytes.
Sensitivity was expressed as LOD and calculated as the concentration of analyte providing an S/N ratio ≥ 3 in real matrix. The lower LOQ (LLOQ) was calculated as the lowest amount of analyte, which was quantitatively determined with acceptable (<20%) precision and accuracy.
To assess linearity, ten‐point calibration curves were prepared in the range of 0.25–5 ng/mL for digoxin and of 0.25–50 ng/mL for digitoxin and tested over 3 different nonconsecutive days. Calibration levels were 0.25, 0.3, 0.5, 0.6, 1, 1.25, 2, 2.5, 4, and 5 ng/mL for digoxin and 0.25, 0.6, 1.25, 5, 10, 12.5, 20, 25, 40, and 50 ng/mL for digitoxin. The calibration curves for the analytes were created by weighted (1/x) regression analysis of the normalized peak areas (analyte area/IS area).
Intra‐ and interday precision were calculated in three different days. Five replicas of four QC levels (0.25, 0.6, 1.25, and 4 ng/mL for digoxin (DIG); 0.25, 5, 12.5, and 40 ng/mL for digitoxin [DIT]) were analyzed under the same analytical conditions. The intraday assessments were expressed in terms of percent relative standard deviation (intra‐ or interday RSD%). The inaccuracy of the method was expressed as intra‐ and intraday bias, in terms of percentage deviation from the “expected” value.
ME and extraction recovery (RE) were evaluated according to Matuszewski et al. [22]. In short, three different sets of samples were prepared: ultra‐pure water spiked with analytes and IS standards (set A), blank plasma spiked after the extraction procedure (set B), and blank plasma spiked before extraction (set C). Matrix effect was analyzed in three replicates and evaluated at three concentration levels. For digitoxin 5, 12.5, and 40 ng/mL were chosen, while 0.5, 2, and 4 ng/mL were considered for digoxin in order to perform the evaluation according to the lower and at the upper recommended levels of its therapeutic range (0.5–2 ng/mL).
The matrix effect was calculated as follows: ME (%) = (B/A) × 100.
The extraction recovery was calculated using the following formulae: RE (%) = (C/B) × 100.
For the evaluation of the robustness, small deliberate changes in chromatographic conditions such as column temperature (±5°C), the mobile phase pH (± 0.2), and flow rate (±0.1 mL/min) were performed and the standard deviation of the relative peak areas for each parameter was calculated.
2.6. Statistical analysis
Statistical analyses were performed by Stata software version 17.0 (StataCorp, College Station, TX). The mean difference, standard deviation of the differences, and upper and lower limits for the coupled methods were measured by the Bland–Altman test. Regression analysis with 95% confidence interval (CI) of the slope and the intercept was carried out by the Passing–Bablok test.
3. Results and discussion
3.1. UHPLC–MS/MS optimization
To assess the precursor ions and relative product ion transitions of DIG and DIT, standard solutions of each compound at a concentration of 1 μg/mL were infused directly in the ionization source.
As already described in literature [23], DIG and DIT structures are prone to the production of in‐source adducts when analyzed in electrospray. The type and degree of adduct formation strongly depends on the design of the ionization source and on the experimental conditions. In the present study, DIG and DIT generated multiple adduct ions mainly in form of [M + NH4]+ and [M + Na]+, while the intensity of the [M + H]+ ion was negligible.
The most abundant and stable product ion was found to be the ammonium adduct [M +NH4]+; thus, ammonium formate was added to the LC solvents to facilitate and increase the formation of ammonium adducts.
The mass parameters were fine‐tuned in order to achieve the maximum sensitivity by optimizing the declustering potential, the entrance potential, the collision cell exit potential, and collision energy. MRM mode was used for quantitative determination of the target compounds. Moreover, to improve the specificity of the method, among the daughter ion fragments for each compound, three fragments were chosen. The optimized MRM transitions and mass parameters of the studied compounds are summarized in Table 1.
Table 1.
Multiple reaction monitoring (MRM) selected transitions of digoxin, digitoxin, and digoxin‐d3
| Analyte | Precursor ion (Da) | Daughter ion (Da) | Retention time (min) | Declustering potential (DP) (V) | Entrance potential (EP) (V) | Collision energy (CE) (V) | Collision cell exit potential (CXP) (V) |
|---|---|---|---|---|---|---|---|
| Digoxin | 798.6 | 651.6 | 3.03 | 89 | 10 | 21 | 3 |
| 798.6 | 243.3 | 3.03 | 89 | 10 | 27 | 3 | |
| 798.6 | 391.1 | 3.03 | 89 | 10 | 25 | 3 | |
| Digitoxin | 782.7 | 635.5 | 5.58 | 60 | 5 | 16 | 7 |
| 782.7 | 243.2 | 5.58 | 85 | 5 | 23 | 12 | |
| 782.7 | 375.5 | 5.58 | 89 | 5 | 28 | 12 | |
| Digoxin‐d3 | 801.6 | 654.4 | 3.02 | 106 | 10 | 20 | 8 |
| 801.6 | 243.0 | 3.02 | 102 | 10 | 21 | 14 |
Because of the high sensitivity needed and the complexity of the sample matrix, protein precipitation appeared insufficient to provide adequate sample clean‐up and consequently, a liquid–liquid extraction was chosen. A typical chromatogram obtained by analyzing plasma spiked at LLOQ concentration is depicted in Fig. 1.
Figure 1.

Chromatogram obtained by analyzed plasma spiked with digoxin and digitoxin at LLOQ (0.25 ng/mL).
3.2. Method validation
Selectivity was assessed by testing different human plasma samples collected from volunteers aged >65 years (n = 20) including patient with liver insufficiency. Also, cadaveric blood was tested for interferences (n = 10). The test revealed no peaks or spurious signals at the retention times corresponding to the target compounds.
The method proved to be linear within the range from 0.25 to 5 ng/mL for DIG and from 0.25 to 50 ng/mL for DIT. The regression lines were as follows: y = (0.156 ± 0.019)x + (0.017 ± 0.008) and y = (0.098 ± 0.017)x + (0.010 ± 0.006) for digoxin and digitoxin, respectively. Correlation coefficients were higher than 0.9946 for both analytes.
The LODs and LLOQs were 0.08 and 0.25 ng/mL, respectively, for each one of the studied analytes.
As shown in Table 2, intra‐ and interday precision and bias all the results of the tested samples were within the acceptable criteria of ±15%.
Table 2.
Intra‐ and inter‐day precision and accuracy (bias) experiments evaluated at the selected concentration levels (LOQ, low QC, medium QC, and high)
| Analyte | Concentration (ng/mL) | Intraday precision (RSD%) n = 5 | Intraday bias n = 5 | Interday precision (RSD%) n = 3 | Interday bias n = 3 | ||||
|---|---|---|---|---|---|---|---|---|---|
| Day 1 | Day 2 | Day 3 | Day 1 | Day 2 | Day 3 | ||||
| Digoxin | LOQ 0.25 | 7.66 | 4.53 | 12.71 | –0.22 | 0.58 | –2.97 | 10 | –0.87 |
| Low QC 0.6 | 7.05 | 1.83 | 5.20 | 2.69 | 5.02 | 3.33 | 6 | 3.68 | |
| Medium QC 1.25 | 4.40 | 1.25 | 5.52 | –0.07 | –1.78 | –1.48 | 10 | –1.11 | |
| High QC 4 | 3.47 | 2.11 | 5.84 | 2.61 | –0.14 | –0.43 | 13 | 0.68 | |
| Digitoxin | LOQ 0.25 | 9.07 | 3.26 | 6.75 | –8.45 | –6.26 | 4.10 | 8 | –3.53 |
| Low QC 5 | 3.95 | 4.83 | 3.13 | –3.13 | 8.03 | –2.25 | 13 | 0.88 | |
| Medium QC 12.5 | 2.66 | 6.22 | 4.07 | –2.35 | 6.93 | 3.84 | 12 | 2.81 | |
| High QC 40 | 3.96 | 2.66 | 6.37 | –0.53 | 0.58 | 6 | 14 | 1.87 | |
The mean extraction recoveries of the analytes tested at three different concentration levels in plasma (i.e., 0.5, 2, and 4 ng/mL for DIG and 5, 12.50, and 40 ng/mL for DIT) ranged from 77% to 101%, and the matrix effect ranged from 76% to 109% for both digoxin and digitoxin (Table 3).
Table 3.
Matrix effect (ME%) and extraction recovery (RE%) expressed as mean value ± relative standard deviation (SD) experiments evaluated at the selected concentration levels
| Analyte | Concentration (ng/mL) | Matrix effect (ME% ± SD%) | Extraction recovery (RE% ± SD%) |
|---|---|---|---|
| Digoxin |
Low QC 0.5 |
108 ± 3.2 | 86 ± 6.6 |
| Medium QC 2 | 81 ± 4.2 | 84 ± 6.4 | |
| High QC 4 | 109 ± 9.8 | 77 ± 4.7 | |
| Digitoxin | Low QC 5 | 81 ± 9.4 | 86 ± 8.3 |
| Medium QC 12.5 | 76 ± 4.5 | 97 ± 4.8 | |
| High QC 40 | 84 ± 4.7 | 101 ± 5.2 |
For the evaluation of the robustness, the small variations in all the tested parameters only slightly affect the peak areas and thus the quantification of the drugs. Indeed, the standard deviation of relative peak areas for each parameter was calculated and %RSD was found to be less than 2%, thus indicating the robustness of the method.
3.3. Analysis of real samples
The developed UHPLC–MS/MS method was externally verified by analyzing 220 real human plasma samples, already tested with a routine immunoassay at the clinical chemistry laboratory of the University Hospital of Verona (n = 120) and at the Unit of Clinical Pathology‐AUSL Romagna (n = 100).
Out of the 220 samples re‐analyzed with the present UHPLC–MS/MS, 204 showed measurable DIG concentrations with an average of 0.72 ng/mL (range 0.25–2.59 ng/mL, median: 0.67 ng/mL). Just for comparison, 211 samples were “positive” for DIG using the immunoassay with an average of 0.89 ng/mL (range 0.2–2.96 ng/mL, median: 0.82 ng/mL).
Figure 2 depicts an example of the extract ion chromatograms of a real plasma sample containing digoxin at a concentration of 0.39 ng/mL, which is below the therapeutical range. As expected, DIT was detected in none of them, because this pharmacological principle is presently not available in Italy as a pharmaceutical drug.
Figure 2.
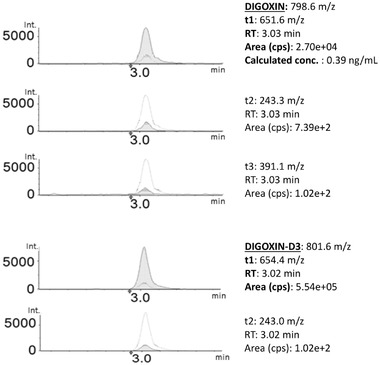
Extract ion chromatograms of a real plasma sample containing 0.39 ng/mL of digoxin (internal standard: digoxin‐D3).
The results from the present UHPLC–MS/MS were then point‐by‐point compared with those from the immunoassay presently adopted in the two clinical laboratories collaborating in the present research, as well as many other clinical contexts. Bland–Altman and the Passing–Bablok test were used to statistically estimate the concordance and to investigate possible systematic bias between them.
The Bland–Altman graph is a scatter plot XY, in which the Y‐axis shows the difference between the two paired measurements; in this case, the developed UHPLC–MS/MS method (MS) and immunoassay (IA) data and the X‐axis represent the average of these measures ((MS + IA)/2). Therefore, the difference of the two paired measurements is plotted against the mean of the two measurements.
In the present study, the Bland–Altman test showed a negative bias, particularly for concentrations above the therapeutical range (Fig. 3). The mean difference between MS and IA determinations was –0.18 ng/mL with 95% CI ranging from –0.21 to –0.15) and a standard error of the mean of 0.013. Thus, a statistically significant overestimation (p < 0.0001, MS median = 0.67, IQR = 0.45 p5–p95 = 0.3–1.4; IA median = 0.82, IQR = 0.48 p5–p95 = 0.4–1.67) of the immunoassay versus UHPLC–MS/MS was found.
Figure 3.

Bland–Altman plot of differences between data obtained on n = 220 plasma samples with immunoassay method (IA) and the developed UPLC–MS/MS (MS). The 95% limit of agreement was in the range of –0.55 to 0.19 (dashed line).
In addition to the application of the Bland–Altman test, the Passing–Bablok test was used to assess the correlation between the results from the two, which is described by the following equation y = –0.058 + 0.888x considering a 95% CI. Figure 4 shows the regression line (solid line) and its confidence interval (dashed line).
Figure 4.

Passing–Bablok regression line for the data obtained with the newly developed method (MS, Y‐axis) and with the routine immunoassay (IA, X‐axis). n = 220; regression line equation: y = –0.058 + 0.888x; 95% CI for intercept –0.111 to –0.001, and 0.818 to 0.960 for slope.
4. Concluding remarks
The UHPLC–MS/MS method herein developed has been validated, showing adequate sensitivity and selectivity with acceptable matrix effects and very good linearity, accuracy, precision, and recovery.
The method allows for the determination of digoxin and digitoxin down to concentrations lower than the therapeutic range (0.5–2 ng/mL and 10–30 ng/mL, respectively) with the high specificity of mass spectrometry, which, in present times, is the “gold standard” in analytical toxicology.
Overall, the proposed method proved to be superior to other papers for its capability to simultaneously measure both digoxin and digitoxin. Indeed, as shown in Table 4 [20, 23, 24, 25, 26, 27, 28, 29], many published methods used digitoxin as internal standard, thus hampering the possibility to quantify the presence of digitoxin. Since the latter is responsible for severe unintentional intoxications caused by the erroneous identification of Digitalis leaves, it could be important to also analyze this compound in intoxication cases.
Table 4.
Analytical methods for the determination of digoxin in biological fluids (N.E. = not evaluated, ppt: sample precipitation with organic solvent)
| Reference | Studiedanalytes | Method | Acquisitionmode | Matrix | Concentration range (ng/mL) | RT (min) | Extraction procedure | Mean extraction recovery |
|---|---|---|---|---|---|---|---|---|
| [20] |
DIG/DIT + three other cardiac glycosides |
HPLC–MS/MS | SIM mode | Human plasma |
DIG: 1–100 DIT: 1–100 |
DIG: 6 DIT: 8 |
LLE (4 mL plasma) |
DIG: 67% DIT: 90% |
| [23] | DIG | HPLC–MS/MS |
SRM mode: 1 transition monitored |
Human plasma | DIG: 0.01–5 | DIG: 1.4 |
LLE (0.1 mL plasma) |
DIG: 98% |
| [24] |
DIG (DIT as IS) |
HPLC–MS/MS |
MRM mode: 2 transitions monitored |
Rat plasma | DIG: 0.2–50 |
DIG: 1.1 DIT: 1.6 |
SPE (0.1 mL plasma) |
DIG: 85% DIT: N.E. |
| [25] |
DIG (DIT as IS) |
HPLC–MS | SIM mode | Human plasma/urine | DIG: 0.025–1.5 | DIG: 8.4 DIT: 11 |
LLE (1 mL plasma) |
DIG: 58% DIT: N.E. |
| [26] |
DIG/DIT + metabolites |
HPLC–MS/MS |
MRM mode: 2 transitions monitored |
Human serum/plasma |
DIG: 1.1–8.8 DIT: 12–90 |
DIG: 7.6 DIT:11.5 | ppt + SLE (0.3 mL serum) |
31% DIG 12% DIT |
| [18] |
DIG (DIT as IS) |
HPLC–MS/MS |
SRM mode: 1 transition monitored |
Human plasma | DIG: 0.02–5 | DIG: 5.9 DIT:11.9 |
SPE (0.2 mL plasma) |
DIG: 85% DIT: 73% |
| [17] | DIG | HPLC–MS/MS |
SRM mode: 1 transition monitored |
Human serum | DIG: 0.2–3.2 | DIG: 4.9 |
ppt + SPE (0.25 mL serum) |
DIG: 92% |
| [27] | DIG | HPLC–MS/MS |
SRM mode: 1 transition monitored |
Human plasma/urine | DIG: 0.2–20 | DIG: 2.5 |
SPE (0.5 mL plasma) |
DIG: 80% |
| [28] | n = 39 phytotoxin including DIT and DIG | UHPLC–MS/MS |
MRM mode: 2 transitions monitored |
Post‐mortem blood and fluids |
DIG: 0.5–1000 DIT: 0.5–1000 |
DIG: 7.2 DIT:10.8 |
SPE (1 mL whole blood) |
DIG: 84% DIT: 91% |
| [29] | DIG/DIT | HPLC–MS/MS |
MRM mode: 2 transitions monitored |
Post‐mortem blood |
DIG: 0.4–4 DIT: 2–23 |
DIG: 1.9 DIT: 3.3 |
LLE (0.5 mL whole blood) |
DIG: 72% DIT: 99% |
Among the few published methods that allow for the determination of both digoxin and digitoxin, two are tailored on postmortem analyses while the studies of Bylda et al. [24] presented a quantification range higher than the therapeutic level to be monitored thus being not suitable for therapeutic drug monitoring.
Moreover, with the present method, increased selectivity compared to previously published methods is obtained by using three MRM transitions for determination of each compound with shorter analysis time.
The developed method was applied in the analyses of n = 220 plasma samples collected in two different clinical chemistry laboratory and previously tested by immunoassay. The comparison showed a relevant negative bias of the UHPLC–MS/MS method versus the immunoassay. This evidence could tentatively be attributed to the presence of digoxin‐like immunoreactivity. Although the literature shows different LC‐MS/MS methods for the analysis of digoxin and digitoxin in plasma, there is a lack of information about the correlation between traditional immunoassays and the results from this new technology. The present paper report for the first time the comparison of the data obtained with the two different analytical techniques (immunoassay and UHPLC–MS/MS) on a large set of samples. The statistical comparison showed a relevant negative bias of the UHPLC–MS/MS method versus the immunoassay. These results are consistent with an immunoassay overestimation of digoxin plasmatic levels due to cross‐reaction events with endogenous digoxin‐like substances.
Considering the present active debate on the usefulness of Digitalis glycosides in human therapy, which is strictly correlated with the narrow therapeutic window of these compounds, we believe that the present UHPLC–MS/MS method combining easy sample preparation and excellent analytical performances could represent a step forward in a personalized digitalis therapy.
Open Access Funding provided by Universita degli Studi di Verona within the CRUI‐CARE Agreement.
The Ministry of Science and Higher Education of the Russian Federation contributed in part to support personnel costs within the framework of state funding for the creation and development of World‐Class Research Centers Digital biodesign and personalized healthcare (No. 075‐15‐2020‐926). [Correction added on 7 May, 2022, after first online publication: CRUI‐CARE funding statement has been added.]
The authors have declared no conflict of interest.
Data availability statement
The data that support the findings of this study are available from the corresponding author upon reasonable request.
5 References
- 1. Whayne, T. F. , Am. J. Cardiovasc. Drugs 2018, 18, 427–440. [DOI] [PubMed] [Google Scholar]
- 2. Adams, K. F. , Butler, J. , Patterson, J. H. , Gattis Stough, W. , Bauman, J. L. , van Veldhuisen, D. J. , Schwartz, T. A. , Sabbah, H. , Mackowiak, J. I. , Ventura, H. O. , Ghali, J. K. , Eur. J. Heart Fail. 2016, 18, 1072–1081. [DOI] [PubMed] [Google Scholar]
- 3. Belz, G. G. , Breithaupt‐Grogler, K. , Osowski, U. , Eur. J. Clin. Invest. 2001, 31, 10–17. [DOI] [PubMed] [Google Scholar]
- 4. Negroni, M. S. , Marengo, A. , Caruso, D. , Tayar, A. , Rubiolo, P. , Giavarini, F. , Persampieri, S. , Sangiovanni, E. , Davanzo, F. , Carugo, S. , Colombo, M. L. , Dell'Agli, M. , CaseRep. Cardiol. 2019, 2019, 9707428. [DOI] [PMC free article] [PubMed] [Google Scholar]
- 5. Lehmann, A. , Späni, S. , Harings‐Kaim, A. , Probst, C. , Christ, A. , Leuppi‐Taegtmeyer, A. B. , Glob. Cardiol. Sci. Pract. 2021, 2021. 10.21542/gcsp.2021.2. [DOI] [PMC free article] [PubMed] [Google Scholar]
- 6. Siniorakis, E. , Arvanitakis, S. , Katsianis, A. , Elkouris, M. , J. Cardiovasc. Electrophysiol. 2021, 32, 878–879. [DOI] [PMC free article] [PubMed] [Google Scholar]
- 7. Cho, J. , Lee, Y. J. , Kim, J. H. , Kim, S. I. , Kim, S. S. , Choi, B. S. , Choi, J. H. , Sci. Rep. 2020, 10, 16200. [DOI] [PMC free article] [PubMed] [Google Scholar]
- 8. Pollard, B. S. , Blancoi, J. C. , Pollard, J. R. , In Vivo 2020, 34, 3723–3730. [DOI] [PMC free article] [PubMed] [Google Scholar]
- 9. Elbaz, H. A. , Stueckle, T. A. , Tse, W. , Rojanasakul, Y. , Dinu, C. , Exp. Hematol. Oncol. 2012, 1, 4. [DOI] [PMC free article] [PubMed] [Google Scholar]
- 10. Pashazadeh‐Panahi, P. , Hasanzadeh, M. , Biomed. Pharmacother. 2020, 123, 109813. [DOI] [PubMed] [Google Scholar]
- 11. Simonson, P. D. , Kim, K. H. , Winston‐McPherson, G. , Parakh, R. S. , Yamaguchi, D. , Merrill, A. E. , Dickerson, J. A. , Greene, D. N. , Clin. Biochem. 2019, 63, 102–105. [DOI] [PubMed] [Google Scholar]
- 12. Dasgupta, A. , Toxicol. Rev. 2006, 25, 273–281. [DOI] [PubMed] [Google Scholar]
- 13. Dasgupta, A. , Ther. Drug Monit. 2008, 30, 212–217. [DOI] [PubMed] [Google Scholar]
- 14. Dasgupta, A. , Wu, S. , Actor, J. , Olsen, M. , Wells, A. , Datta, P. , Am. J. Clin. Pathol. 2003, 119, 298–303. [DOI] [PubMed] [Google Scholar]
- 15. Srinivas, N. R. , Ramesh, M. , Bioanalysis 2009, 1, 97–113. [DOI] [PubMed] [Google Scholar]
- 16. Josephs, R. D. , Daireaux, A. , Westwood, S. , Wielgosz, R. I. , J. Chromatogr. A 2010, 1217, 4535–4543. [DOI] [PubMed] [Google Scholar]
- 17. Mitamura, K. , Horikawa, A. , Yamane, Y. , Ikeda, Y. , Fujii, Y. , Shimada, K. , Biol. Pharm. Bull. 2007, 30, 1653–1656. [DOI] [PubMed] [Google Scholar]
- 18. Hashimoto, Y. , Shibakawa, K. , Nakade, S. , Miyata, Y. , J. Chromatogr. B: Anal. Technol. Biomed. Life Sci. 2008, 869, 126–132. [DOI] [PubMed] [Google Scholar]
- 19. Li, S. , Liu, G. , Jia, J. , Miao, Y. , Gu, S. , Miao, P. , Shi, X. , Wang, Y. , Yu, C. , Clin. Biochem. 2010, 43, 307–313. [DOI] [PubMed] [Google Scholar]
- 20. Tracqui, A. , Kintz, P. , Ludes, B. , Mangin, P. , J. Chromatogr. B: Biomed. Sci. Appl. 1997, 692, 101–109. [DOI] [PubMed] [Google Scholar]
- 21. International conference on harmonization of technical requirements for registration of pharmaceutical for human use . Complementary Guidelines on Methodology, current step 4, version 2005.
- 22. Matuszewski, B. K. , Constanzer, M. L. , Chavez‐Eng, C. M. , Anal. Chem. 2003, 75, 3019–3030. [DOI] [PubMed] [Google Scholar]
- 23. Keane, S. , Wallace, G. , Munday, C. , Wright, M. , Bioanalysis 2018, 10, 1401–1411. [DOI] [PubMed] [Google Scholar]
- 24. Bylda, C. , Thiele, R. , Kobold, U. , Volmer, D. A. , Drug Test. Anal. 2015, 7, 937–946. [DOI] [PubMed] [Google Scholar]
- 25. Li, X. , Wang, Y. , Zhou, Q. , Yu, Y. , Chen, L. , Zheng, J. , J. Chromatogr. B: Anal. Technol. Biomed. Life Sci. 2015, 978–979, 138–144. [DOI] [PubMed] [Google Scholar]
- 26. Kirby, B. J. , Kalhorn, T. , Hebert, M. , Easterling, T. , Unadkat, J. D. , Biomed. Chromatogr. 2008, 22, 712–718. [DOI] [PubMed] [Google Scholar]
- 27. Salvador, A. , Sagan, C. , Denouel, J. , J. Liq. Chromatogr. Relat. Technol. 2006, 29, 1917–1932. [Google Scholar]
- 28. Carlier, J. , Guitton, J. , Romeuf, L. , Bévalot, F. , Boyer, B. , Fanton, L. , Gaillard, Y. , J. Chromatogr. B: Anal. Technol. Biomed. Life Sci. 2015, 975, 65–76. [DOI] [PubMed] [Google Scholar]
- 29. Øiestad, E. L. , Johansen, U. , Opdal, M. S. , Bergan, S. , Christophersen, A. S. , J. Anal. Toxicol. 2009, 33, 372–378. [DOI] [PubMed] [Google Scholar]
Associated Data
This section collects any data citations, data availability statements, or supplementary materials included in this article.
Data Availability Statement
The data that support the findings of this study are available from the corresponding author upon reasonable request.